Embed Size (px)
Citation preview
Transcript
Northwest Center for Public Health Practice
1
Cause and Effect in Epidemiology
Cause and Effect in EpidemiologyWelcome to “Cause and Effect in Epidemiology.” My name is Victoria Holt. As a nurse, I’ve worked in a vari-ety of hospital and clinic practice settings, including public health clinics in East Tennessee and North Carolina. More recently, as an epidemiologist, I’m a faculty member at the Northwest Center for Public Health Practice at the School of Public Health and Community Medicine at the University of Washington in Seattle.
For the last 15 years, I have also been a faculty member in the Department of Epidemiology at the University of Washington, where I currently teach courses in epidemio-logic methods.
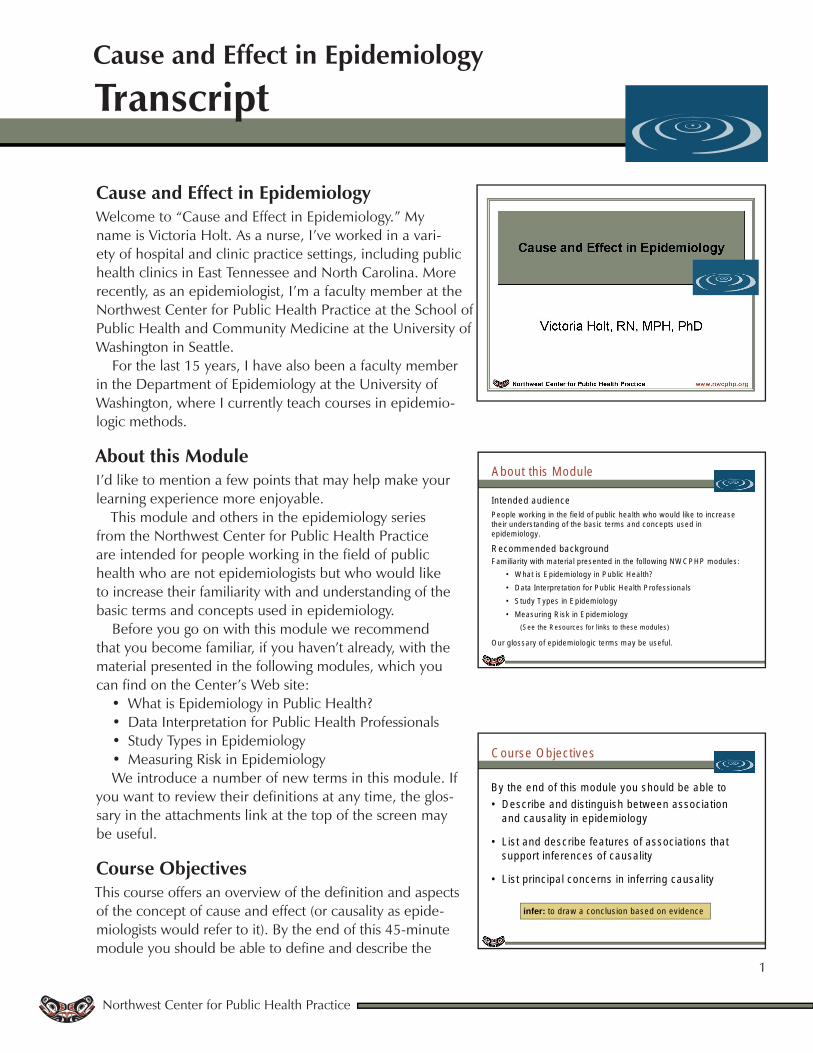
About this ModuleI’d like to mention a few points that may help make your learning experience more enjoyable.
This module and others in the epidemiology series from the Northwest Center for Public Health Practice are intended for people working in the field of public health who are not epidemiologists but who would like to increase their familiarity with and understanding of the basic terms and concepts used in epidemiology.
Before you go on with this module we recommend that you become familiar, if you haven’t already, with the material presented in the following modules, which you can find on the Center’s Web site:
What is Epidemiology in Public Health? Data Interpretation for Public Health Professionals Study Types in Epidemiology Measuring Risk in Epidemiology
We introduce a number of new terms in this module. If you want to review their definitions at any time, the glos-sary in the attachments link at the top of the screen may be useful.
Course Objectives This course offers an overview of the definition and aspects of the concept of cause and effect (or causality as epide-miologists would refer to it). By the end of this 45-minute module you should be able to define and describe the
••••
A bout th is M odu le
In tended aud ienceP eop le w ork ing in the fie ld o f pub lic hea lth w ho w ou ld like to inc rease the ir unders tand ing o f the bas ic te rm s and concepts used in ep idem io log y.
R ecom m ended backgroundFam ilia r ity w ith m ateria l p resented in the fo llow ing NW C P H P m odu les :
• W hat is E p idem io log y in P ub lic H ea lth?• D ata In te rpre ta tion fo r P ub lic H ea lth P ro fess iona ls• S tud y T ypes in E p idem io logy• M easuring R isk in E p idem io logy
(S ee the R esources fo r links to these m odu les)
O ur g lossary o f ep idem io log ic te rm s m ay be usefu l.
C ourse O b jectives
B y the end of th is m odu le you shou ld be ab le to• D escribe and d istingu ish betw een assoc ia tion
and causa lity in ep idem io logy
• L is t and describe fea tu res o f assoc ia tions tha t support in fe rences o f causa lity
• L is t p rinc ipa l concerns in in fe rring causa lity
infer: to d raw a conclus ion based on evidence
Transcript
Northwest Center for Public Health Practice
2
Cause and Effect in Epidemiology
concepts of association and causality in epidemiology and distinguish between them. You should also be able to list several features of associations that support inferences of causality, and describe these features. Finally you should understand and be able to list several important or principal concerns that arise in inferring causality from epidemiologic studies.
Before we go on, I’d like to mention that this topic, causality in epidemi-ology, is often also called causal inference. To epidemiologists the term infer means to draw a conclusion based on evidence.
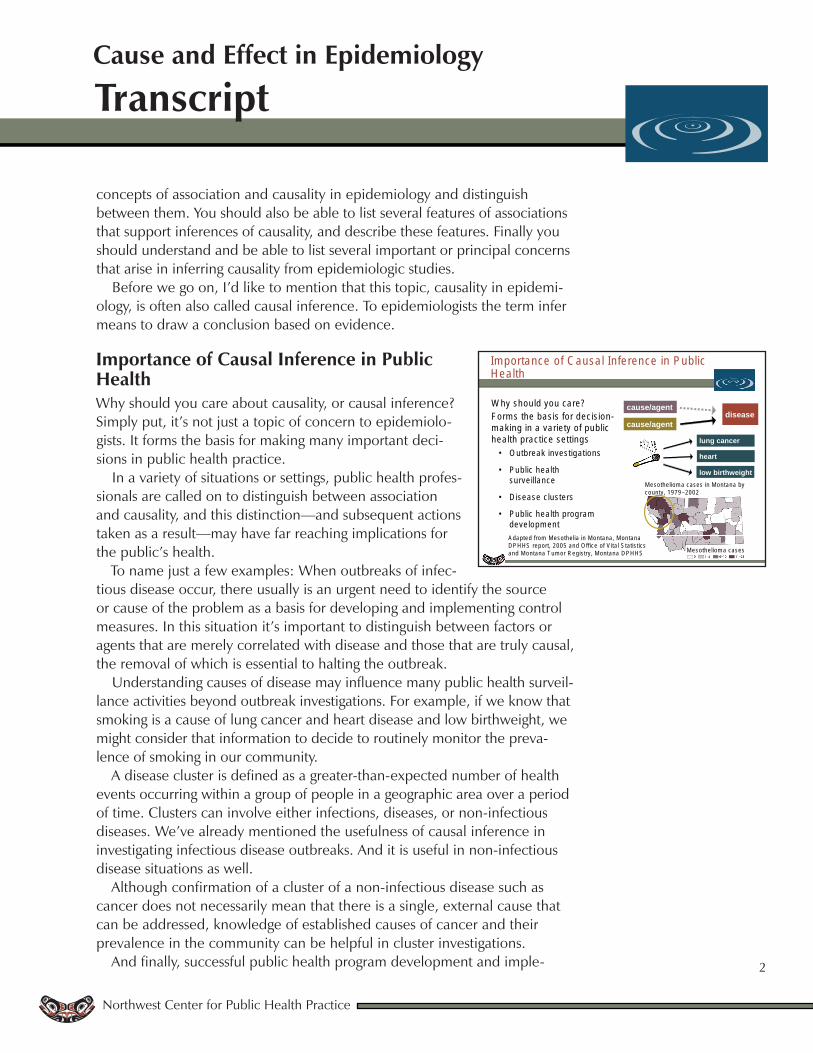
Importance of Causal Inference in Public HealthWhy should you care about causality, or causal inference? Simply put, it’s not just a topic of concern to epidemiolo-gists. It forms the basis for making many important deci-sions in public health practice.
In a variety of situations or settings, public health profes-sionals are called on to distinguish between association and causality, and this distinction—and subsequent actions taken as a result—may have far reaching implications for the public’s health.
To name just a few examples: When outbreaks of infec-tious disease occur, there usually is an urgent need to identify the source or cause of the problem as a basis for developing and implementing control measures. In this situation it’s important to distinguish between factors or agents that are merely correlated with disease and those that are truly causal, the removal of which is essential to halting the outbreak.
Understanding causes of disease may influence many public health surveil-lance activities beyond outbreak investigations. For example, if we know that smoking is a cause of lung cancer and heart disease and low birthweight, we might consider that information to decide to routinely monitor the preva-lence of smoking in our community.
A disease cluster is defined as a greater-than-expected number of health events occurring within a group of people in a geographic area over a period of time. Clusters can involve either infections, diseases, or non-infectious diseases. We’ve already mentioned the usefulness of causal inference in investigating infectious disease outbreaks. And it is useful in non-infectious disease situations as well.
Although confirmation of a cluster of a non-infectious disease such as cancer does not necessarily mean that there is a single, external cause that can be addressed, knowledge of established causes of cancer and their prevalence in the community can be helpful in cluster investigations.
And finally, successful public health program development and imple-
W hy shou ld you ca re?Form s the bas is fo r dec is ion -m aking in a va rie ty o f pub lic hea lth p ractice se ttings
• O utbreak investiga tions
• P ub lic hea lth surve illance
• D isease c luste rs
• P ub lic hea lth p rog ram deve lopm ent
Im portance o f C ausa l In fe rence in P ub lic H ea lth
cause/agent
cause/agentdisease
A dapted from M esothe lia in M ontana, M ontana D P H HS report, 2005 and O ffice of V ita l S tatis tics and M ontana Tum or R eg is try, M ontana D P HH S
lung cancer
heart diseaselow birthweight
M esothe liom a cases
M esothe liom a cases in M ontana by county, 1979–2002
Transcript
Northwest Center for Public Health Practice
3
Cause and Effect in Epidemiology
mentation rely on the identification of true causal factors that increase the risk of negative health outcomes in the community, in order to minimize the community’s disease burden by targeting these factors.
Causal inference was the first step in a variety of notable epidemio-logic accomplishments, such as decreasing coronary heart disease, mainly by decreasing smoking, high blood pressure, and cholesterol levels in the population.
Now let’s turn to the topic of association in epidemiology.
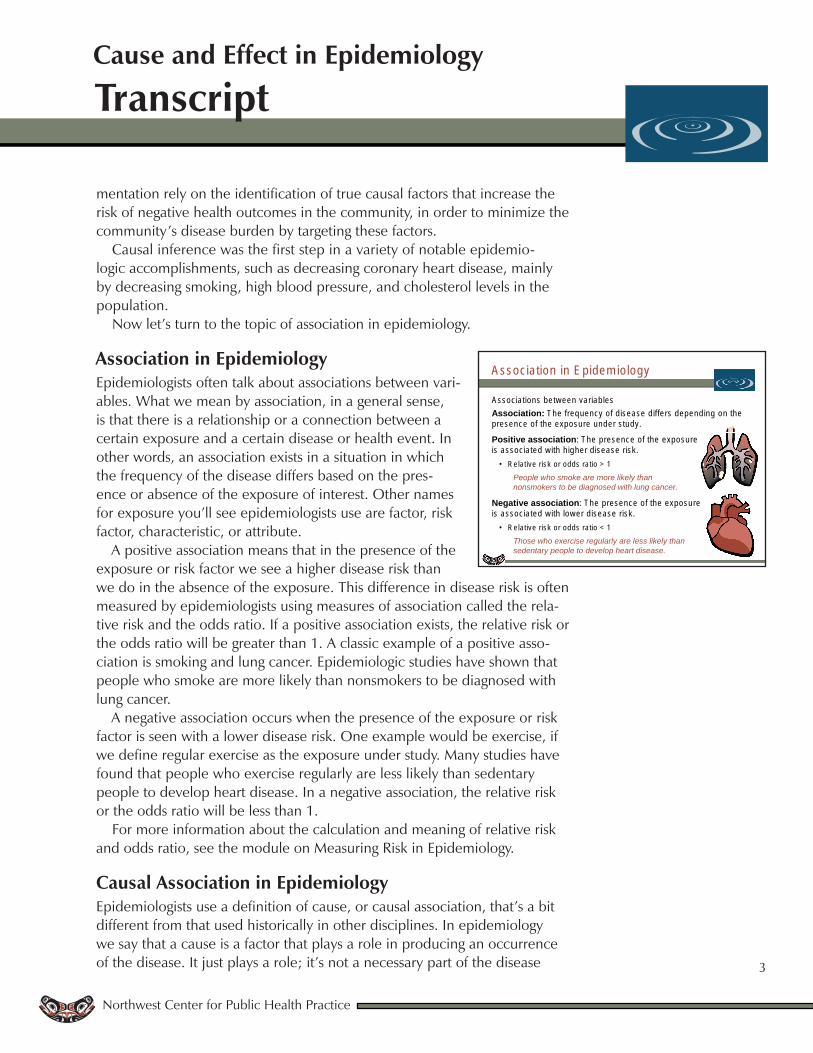
Association in EpidemiologyEpidemiologists often talk about associations between vari-ables. What we mean by association, in a general sense, is that there is a relationship or a connection between a certain exposure and a certain disease or health event. In other words, an association exists in a situation in which the frequency of the disease differs based on the pres-ence or absence of the exposure of interest. Other names for exposure you’ll see epidemiologists use are factor, risk factor, characteristic, or attribute.
A positive association means that in the presence of the exposure or risk factor we see a higher disease risk than we do in the absence of the exposure. This difference in disease risk is often measured by epidemiologists using measures of association called the rela-tive risk and the odds ratio. If a positive association exists, the relative risk or the odds ratio will be greater than 1. A classic example of a positive asso-ciation is smoking and lung cancer. Epidemiologic studies have shown that people who smoke are more likely than nonsmokers to be diagnosed with lung cancer.
A negative association occurs when the presence of the exposure or risk factor is seen with a lower disease risk. One example would be exercise, if we define regular exercise as the exposure under study. Many studies have found that people who exercise regularly are less likely than sedentary people to develop heart disease. In a negative association, the relative risk or the odds ratio will be less than 1.
For more information about the calculation and meaning of relative risk and odds ratio, see the module on Measuring Risk in Epidemiology.
Causal Association in EpidemiologyEpidemiologists use a definition of cause, or causal association, that’s a bit different from that used historically in other disciplines. In epidemiology we say that a cause is a factor that plays a role in producing an occurrence of the disease. It just plays a role; it’s not a necessary part of the disease
A ssoc ia tion in E pidem io logy
A ssocia tions be tw een variab lesAssociation: T he frequency o f d isease d iffe rs depend ing on the presence of the exposure under study.
Positive association: The presence of the exposure is associa ted w ith h igher d isease risk .
• R e la tive risk o r odds ra tio > 1People who smoke are more likely than nonsmokers to be diagnosed with lung cancer.
Negative association: The presence of the exposure is associa ted w ith low er d isease risk .
• R e la tive risk o r odds ra tio < 1Those who exercise regularly are less likely than sedentary people to develop heart disease.
Transcript
Northwest Center for Public Health Practice
4
Cause and Effect in Epidemiology
process. For instance, we can talk about smoking being a cause of lung cancer even though some people who have never smoked also get lung cancer—smoking is not a necessary factor for all cases of lung cancer.
In the most general sense, a cause is something that if it weren’t there, some cases of the disease wouldn’t happen. This definition allows that factors can play a direct role or an indirect role in causing disease. A factor may not be capable of causing disease all by itself; it may be just one part of a more complex mechanism that necessar-ily involves other exposures or factors. For instance, not all smokers get lung cancer—smoking is not sufficient all by itself to cause lung cancer in all smokers. But we still consider smoking to be a cause of lung cancer.
The key feature of the notion of cause and causality is that causality is not proven in any one study. It’s a process of determination or decision-making or inference based on a variety of information, as we’ll discuss for the rest of this module.
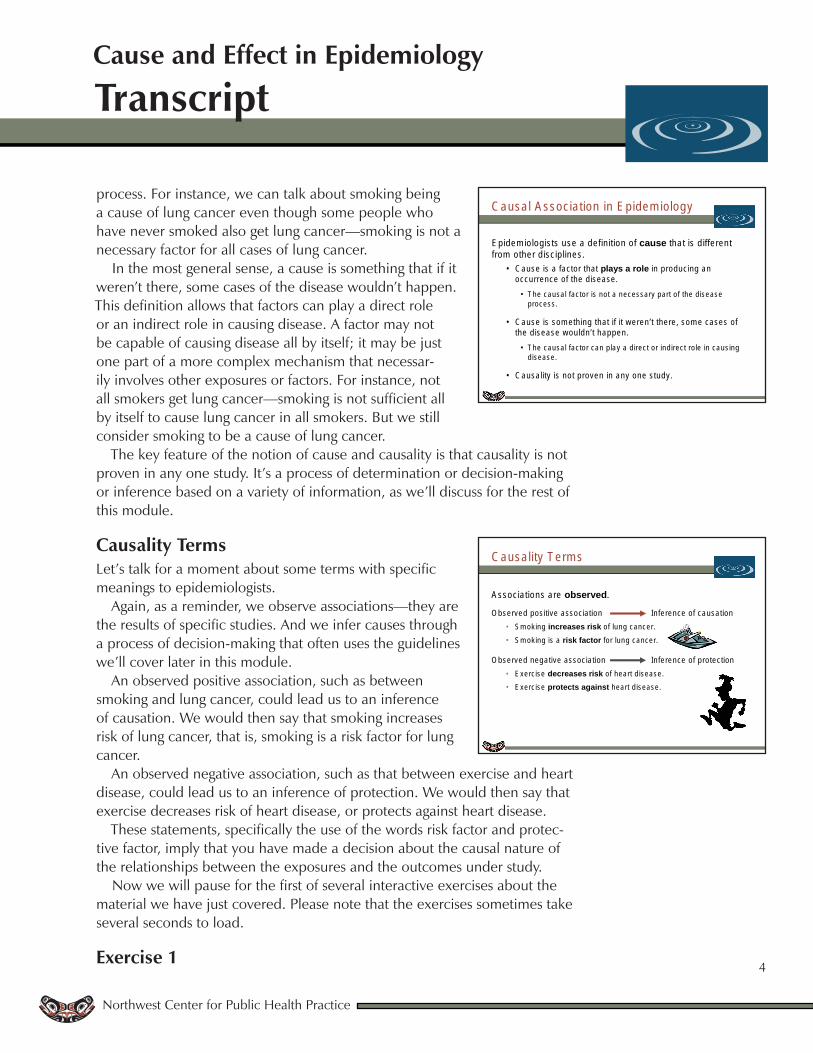
Causality TermsLet’s talk for a moment about some terms with specific meanings to epidemiologists.
Again, as a reminder, we observe associations—they are the results of specific studies. And we infer causes through a process of decision-making that often uses the guidelines we’ll cover later in this module.
An observed positive association, such as between smoking and lung cancer, could lead us to an inference of causation. We would then say that smoking increases risk of lung cancer, that is, smoking is a risk factor for lung cancer.
An observed negative association, such as that between exercise and heart disease, could lead us to an inference of protection. We would then say that exercise decreases risk of heart disease, or protects against heart disease.
These statements, specifically the use of the words risk factor and protec-tive factor, imply that you have made a decision about the causal nature of the relationships between the exposures and the outcomes under study.
Now we will pause for the first of several interactive exercises about the material we have just covered. Please note that the exercises sometimes take several seconds to load.
Exercise 1
C ausa l A ssocia tion in E p idem io logy
E p idem io log is ts use a defin ition o f cause tha t is d iffe ren t from o ther d isc ip lines.
• C ause is a facto r that plays a role in p roducing an occurrence of the d isease.
• T he causa l fac tor is no t a necessary part o f the d isease process .
• C ause is som eth ing that if it w eren ’t there , som e cases of the d isease w ou ldn ’t happen.
• T he causa l fac tor can p la y a d irec t o r ind irec t ro le in caus ing d isease.
• C ausa lity is no t p roven in any one study.
C ausa lity Term s
A ssocia tions a re observed. C auses a re inferred.
O bserved positive association In fe rence of causa tion• S m ok ing increases risk of lung cancer.• S m ok ing is a risk factor fo r lung cancer.
O bserved negative associa tion In fe rence of p ro tection• E xerc ise decreases risk of heart d isease.• E xerc ise protects against heart d isease.
Transcript
Northwest Center for Public Health Practice
5
Cause and Effect in Epidemiology
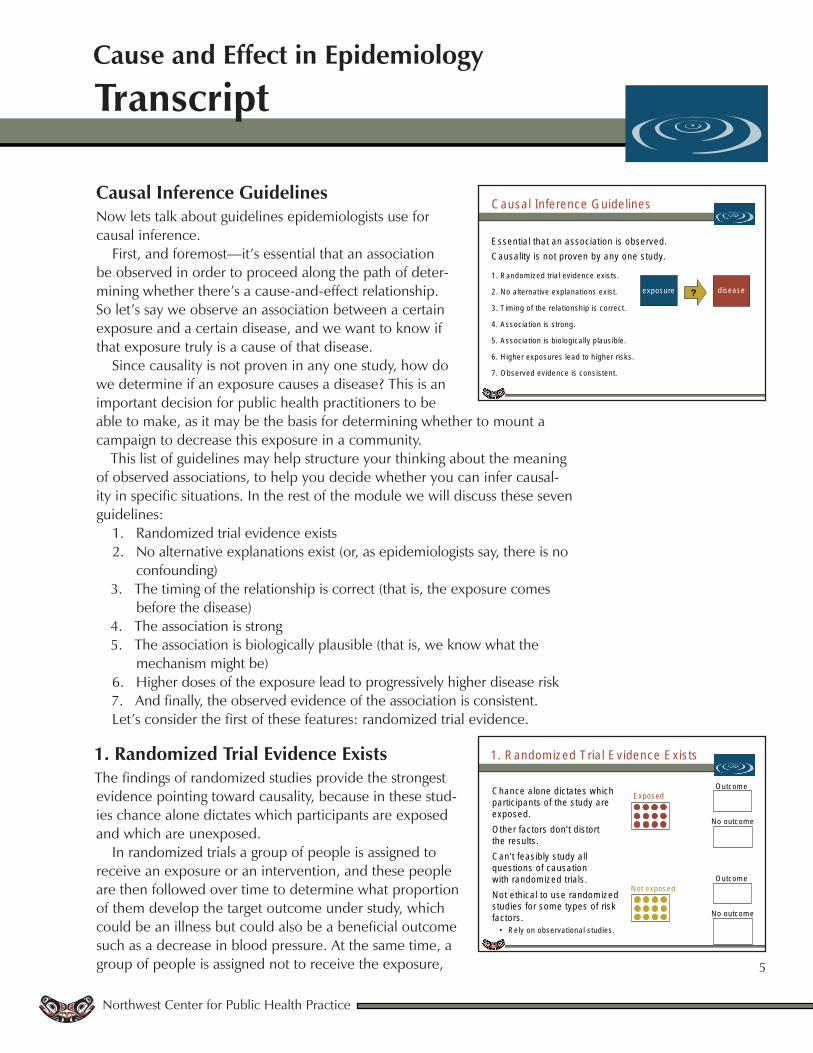
Causal Inference GuidelinesNow lets talk about guidelines epidemiologists use for causal inference.
First, and foremost—it’s essential that an association be observed in order to proceed along the path of deter-mining whether there’s a cause-and-effect relationship. So let’s say we observe an association between a certain exposure and a certain disease, and we want to know if that exposure truly is a cause of that disease.
Since causality is not proven in any one study, how do we determine if an exposure causes a disease? This is an important decision for public health practitioners to be able to make, as it may be the basis for determining whether to mount a campaign to decrease this exposure in a community.
This list of guidelines may help structure your thinking about the meaning of observed associations, to help you decide whether you can infer causal-ity in specific situations. In the rest of the module we will discuss these seven guidelines:
Randomized trial evidence existsNo alternative explanations exist (or, as epidemiologists say, there is no confounding)The timing of the relationship is correct (that is, the exposure comes before the disease)The association is strongThe association is biologically plausible (that is, we know what the mechanism might be)Higher doses of the exposure lead to progressively higher disease riskAnd finally, the observed evidence of the association is consistent.
Let’s consider the first of these features: randomized trial evidence.
1. Randomized Trial Evidence ExistsThe findings of randomized studies provide the strongest evidence pointing toward causality, because in these stud-ies chance alone dictates which participants are exposed and which are unexposed.
In randomized trials a group of people is assigned to receive an exposure or an intervention, and these people are then followed over time to determine what proportion of them develop the target outcome under study, which could be an illness but could also be a beneficial outcome such as a decrease in blood pressure. At the same time, a group of people is assigned not to receive the exposure,
1.2.
3.
4.5.
6.7.
C ausa l In fe rence G u ide lines
E ssen tia l tha t an associa tion is observed .C ausa lity is no t p roven by any one study.
1 . R andom ized tria l ev idence ex is ts .
2 . N o a lte rna tive exp lanations ex is t.
3 . T im ing o f the re la tionsh ip is correc t.
4 . A ssoc ia tion is s trong.
5 . A ssoc ia tion is b io log ica lly p laus ib le .
6 . H igher exposures lead to h igher risks .
7 . O bserved ev idence is cons is ten t.
d isease?exposure
1 . R andom ized T ria l E v idence E xis ts
C hance a lone d ic ta tes w h ich partic ipan ts o f the s tudy a re exposed .O ther facto rs don ’t d is to rt the resu lts .C an ’t feas ib ly s tudy a ll questions o f causa tion w ith random ized tria ls .N o t e th ica l to use random ized stud ies fo r som e types o f risk facto rs .
• R e ly on observa tiona l s tud ies .
E xposed
N ot exposed
O utcom e
N o outcom e
O utcom e
N o outcom e
Transcript
Northwest Center for Public Health Practice
6
Cause and Effect in Epidemiology
and this group is also followed up to determine how many develop the outcome, and whether that proportion differs from the proportion in the exposed group.
Because the researcher, rather than the participant, decides who will be in which group, other factors that could influence the risk of disease or the health event generally will not distort the results.
Unfortunately, we cannot feasibly study all questions of causation with randomized trials, and it isn’t ethical to use a randomized trial to study some risk factors, such as suspected carcinogens. For these types of questions we must rely on observational studies such as case-control and cohort studies.
See the module on Study Types in Epidemiology for more information on types of observational study designs.
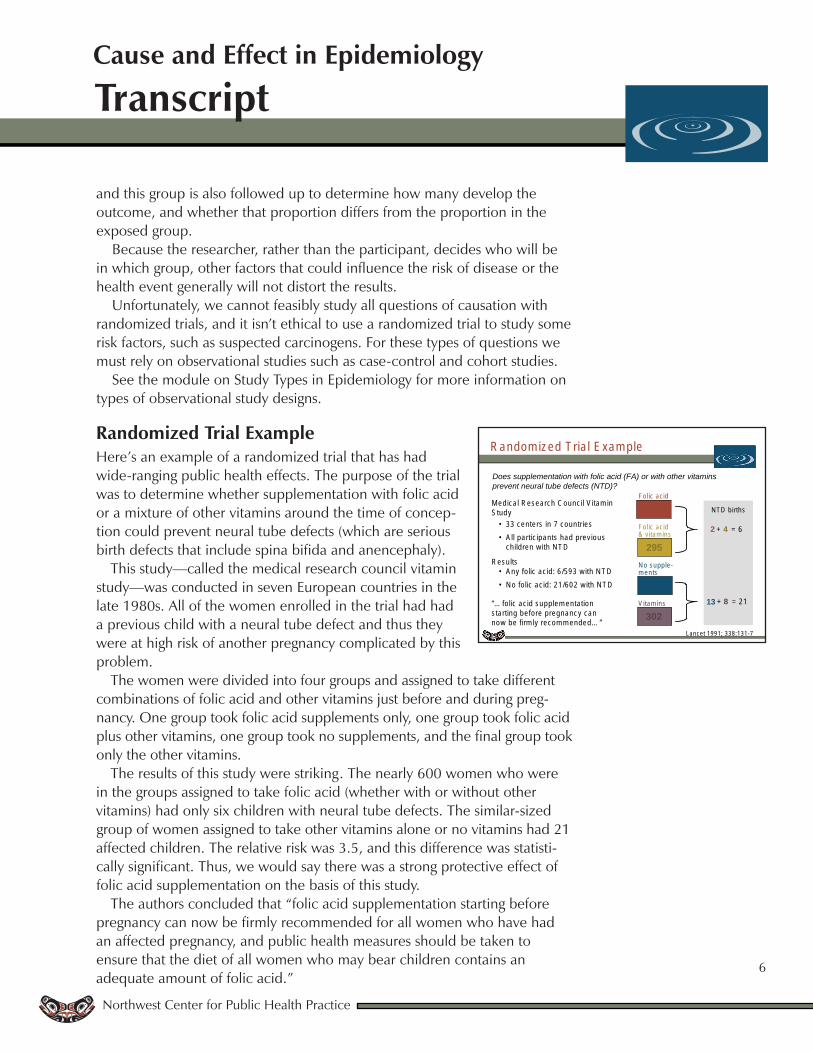
Randomized Trial ExampleHere’s an example of a randomized trial that has had wide-ranging public health effects. The purpose of the trial was to determine whether supplementation with folic acid or a mixture of other vitamins around the time of concep-tion could prevent neural tube defects (which are serious birth defects that include spina bifida and anencephaly).
This study—called the medical research council vitamin study—was conducted in seven European countries in the late 1980s. All of the women enrolled in the trial had had a previous child with a neural tube defect and thus they were at high risk of another pregnancy complicated by this problem.
The women were divided into four groups and assigned to take different combinations of folic acid and other vitamins just before and during preg-nancy. One group took folic acid supplements only, one group took folic acid plus other vitamins, one group took no supplements, and the final group took only the other vitamins.
The results of this study were striking. The nearly 600 women who were in the groups assigned to take folic acid (whether with or without other vitamins) had only six children with neural tube defects. The similar-sized group of women assigned to take other vitamins alone or no vitamins had 21 affected children. The relative risk was 3.5, and this difference was statisti-cally significant. Thus, we would say there was a strong protective effect of folic acid supplementation on the basis of this study.
The authors concluded that “folic acid supplementation starting before pregnancy can now be firmly recommended for all women who have had an affected pregnancy, and public health measures should be taken to ensure that the diet of all women who may bear children contains an adequate amount of folic acid.”
R andom ized T ria l E xam ple
Does supplementation with folic acid (FA) or with other vitaminsprevent neural tube defects (NTD)?
Lancet 1991; 338:131-7
M ed ica l R esearch C ounc il V itam in S tud y
• 33 centers in 7 countr ies• A ll partic ipants had prev ious
ch ild ren w ith N T D
R esu lts• A n y fo lic ac id : 6 /593 w ith N T D • N o fo lic ac id : 21 /602 w ith N T D
“… fo lic ac id supp lem enta tion s ta rting be fore pregnanc y can now be firm ly recom m ended… ”
N TD b irths
Fo lic ac id
298Fo lic ac id & v itam ins
295
V itam ins
302
N o supp le -m ents
300
2 4
13 8
+ = 6
+ = 21
Transcript
Northwest Center for Public Health Practice
7
Cause and Effect in Epidemiology
As a result of this and a few other similar studies, folic acid supplemen-tation is now routine in pregnancy and some foods likely to be eaten by women of childbearing age are fortified with folic acid. You can see how persuasive a randomized trial can be in determining a cause and effect association.
2. No Alternative Explanations ExistOur next guideline applies particularly in studies that are not randomized trials. We need to conclude that no alter-native explanation exists for the association seen.
It’s important to consider whether the increase in disease risk we see in the presence of a certain factor is due instead to other co-occurring factors or exposures. We call this situation confounding. Before we can infer a causal relationship, we first must consider the possibil-ity of confounding and either dismiss it or take it into account. We can take confounding into account at either the design or analysis stages of a study.
What is confounding, exactly? It’s a mixing of effects. If there is confound-ing, the association that we see between an exposure and a disease is a distortion. This distortion occurs because another factor or exposure that happens along with the one we’re interested in is also associated with the disease we’re studying—so what we’re really seeing is a mixture of the effects of two exposures or factors on the disease.
In order for confounding to occur two things need to happen: First, there needs to be an association between the exposure you’re interested in and this extraneous, or confounding, factor. And second, there needs to be an association between the extraneous factor and the disease you’re studying.
Let’s use an example to illustrate this principle.
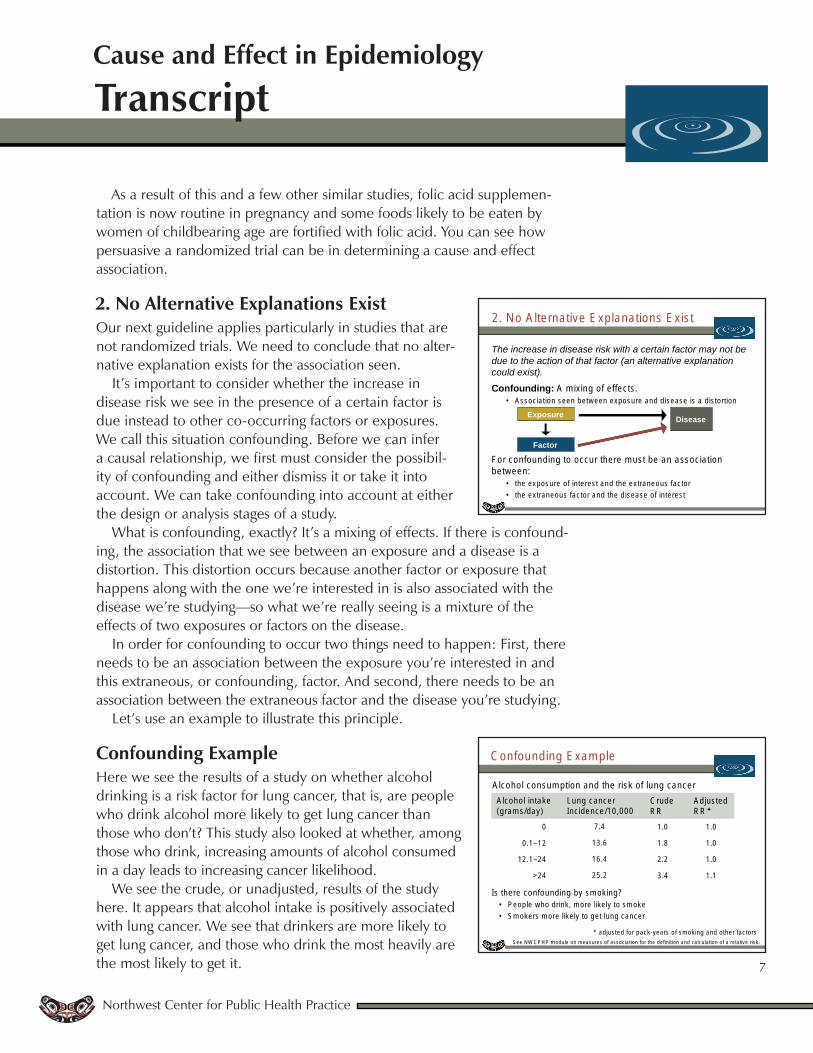
Confounding ExampleHere we see the results of a study on whether alcohol drinking is a risk factor for lung cancer, that is, are people who drink alcohol more likely to get lung cancer than those who don’t? This study also looked at whether, among those who drink, increasing amounts of alcohol consumed in a day leads to increasing cancer likelihood.
We see the crude, or unadjusted, results of the study here. It appears that alcohol intake is positively associated with lung cancer. We see that drinkers are more likely to get lung cancer, and those who drink the most heavily are the most likely to get it.
2. N o A lte rna tive E xp lana tions E xis t
The increase in disease risk with a certain factor may not be due to the action of that factor (an alternative explanation could exist).
Confounding: A m ixing o f e ffects.• A ssoc ia tion seen be tw een exposure and d isease is a d is to rtion
For confound ing to occur the re m ust be an associa tion be tw een :
• the exposure o f in te res t and the ex traneous fac tor• the ex traneous fac tor and the d isease o f in te res t
DiseaseExposure
Factor
C onfound ing E xam ple
S ee N W C P H P m odule on m easures o f associa tion fo r the defin ition and ca lcu la tion o f a re la tive risk .
A lcoho l consum ption and the risk o f lung cancer
adjus ted for pack-years o f sm ok ing and o ther fac tors
0
0 .1–12
12.1–24
>24
7.4
13.6
16.4
25.2
1 .0
1 .8
2 .2
3 .4
1 .0
1 .0
1 .0
1 .1
A lcoho l in take(g ram s/day)
Lung cancerInc idence/10 ,000
C rude R R
A djusted R R
Is there confound ing by sm ok ing?• P eop le w ho drink , m ore like ly to sm oke• S m okers m ore like ly to ge t lung cancer
Transcript
Northwest Center for Public Health Practice
8
Cause and Effect in Epidemiology
But before we decide that this is a causal association however, we have to ask whether confounding is responsible for these associations. You might specifically wonder if there is confounding by smoking. Why? Because smoking meets our first requirement for a confounder. An association exists between the exposure, alcohol drinking, and the extraneous factor, smok-ing. Research has shown that people who drink alcohol are more likely to smoke than people who don’t drink. So we may have a mixing of the effects of alcohol and smoking when we think we’re looking only at the effects of alcohol use.
And why might that matter? Because smoking also meets our other require-ment for confounding—there’s an association between smoking and the disease we’re looking at, here, lung cancer. Smokers are more likely to get lung cancer than nonsmokers. So, the possibility exists that smok-ing is confounding the association between alcohol use and lung cancer. The effect we think is due to alcohol use may be due instead to smoking because many drinkers also smoke. To check this we conduct analyses that
“adjust” for smoking, and when we do so, we see that there is no association between alcohol use and lung cancer. Drinkers are no more likely to get lung cancer than nondrinkers. Controlling or adjusting for the confounder, smok-ing, has removed the association between alcohol use and lung cancer, and therefore the association cannot be causal.
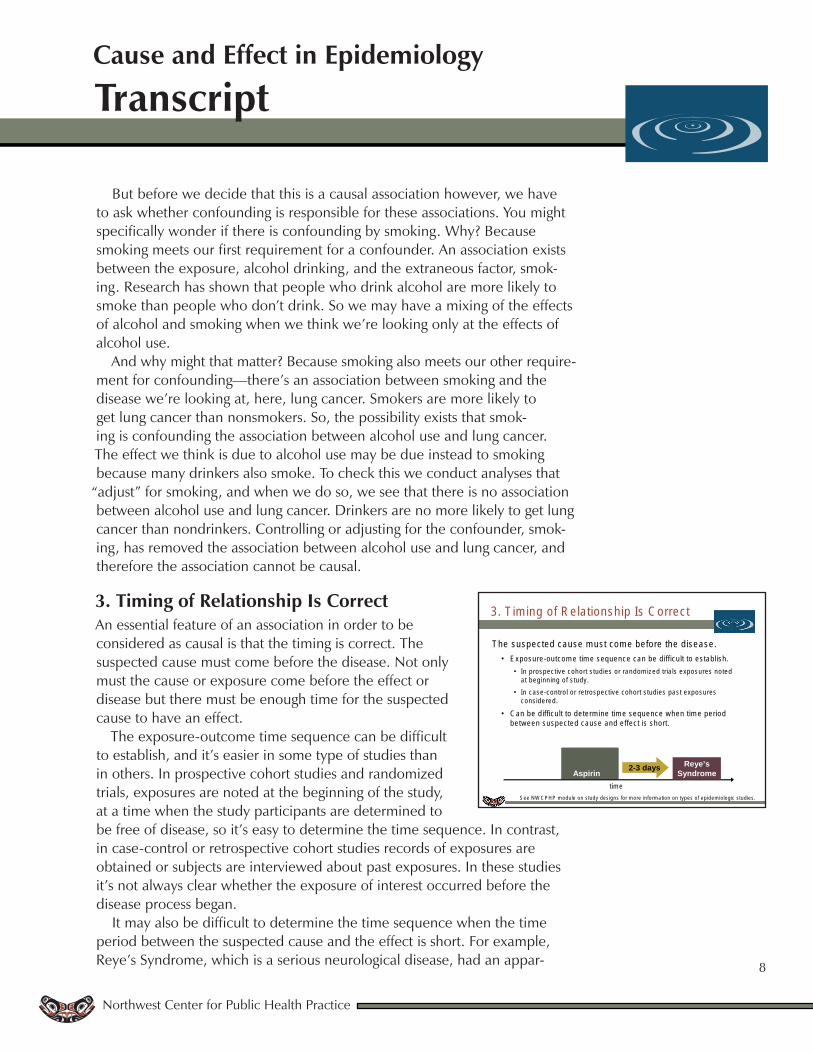
3. Timing of Relationship Is CorrectAn essential feature of an association in order to be considered as causal is that the timing is correct. The suspected cause must come before the disease. Not only must the cause or exposure come before the effect or disease but there must be enough time for the suspected cause to have an effect.
The exposure-outcome time sequence can be difficult to establish, and it’s easier in some type of studies than in others. In prospective cohort studies and randomized trials, exposures are noted at the beginning of the study, at a time when the study participants are determined to be free of disease, so it’s easy to determine the time sequence. In contrast, in case-control or retrospective cohort studies records of exposures are obtained or subjects are interviewed about past exposures. In these studies it’s not always clear whether the exposure of interest occurred before the disease process began.
It may also be difficult to determine the time sequence when the time period between the suspected cause and the effect is short. For example, Reye’s Syndrome, which is a serious neurological disease, had an appar-
Aspirin given for flu or chicken pox
given for flu or chicken
Aspirin
3. T im ing o f R e la tionsh ip Is C orrect
T he suspected cause m ust com e befo re the d isease .• E xposure-outcom e tim e sequence can be d ifficu lt to es tab lish .
• In p rospective cohort s tud ies or random ized tria ls exposures no ted a t beg inn ing o f s tudy.
• In case-contro l o r re trospective cohort s tud ies pas t exposures cons ide red .
• C an be d ifficu lt to de term ine tim e sequence w hen tim e period be tw een suspected cause and e ffec t is short.
S ee N W C P H P m odule on s tudy des igns for m ore in fo rm ation on types o f ep idem io log ic s tud ies .
tim e
Reye’s Syndrome
2-3 days
Transcript
Northwest Center for Public Health Practice
9
Cause and Effect in Epidemiology
ent sharp increase in occurrence in children in 1980, and aspirin use was suspected as a cause. Researchers hypothesized that giving a child aspirin for flu or chicken pox increased the risk of the disease in the next few days. One concern raised early on about the proposed association was that chil-dren in the early stages of Reye’s syndrome may have been given aspirin as a treatment for the disease, and thus one shouldn’t conclude that any associa-tions seen were cause-and-effect because the effect, Reye’s Syndrome, may have come before the suspected cause, taking aspirin. Subsequent studies of this issue clarified that this wasn’t the case.
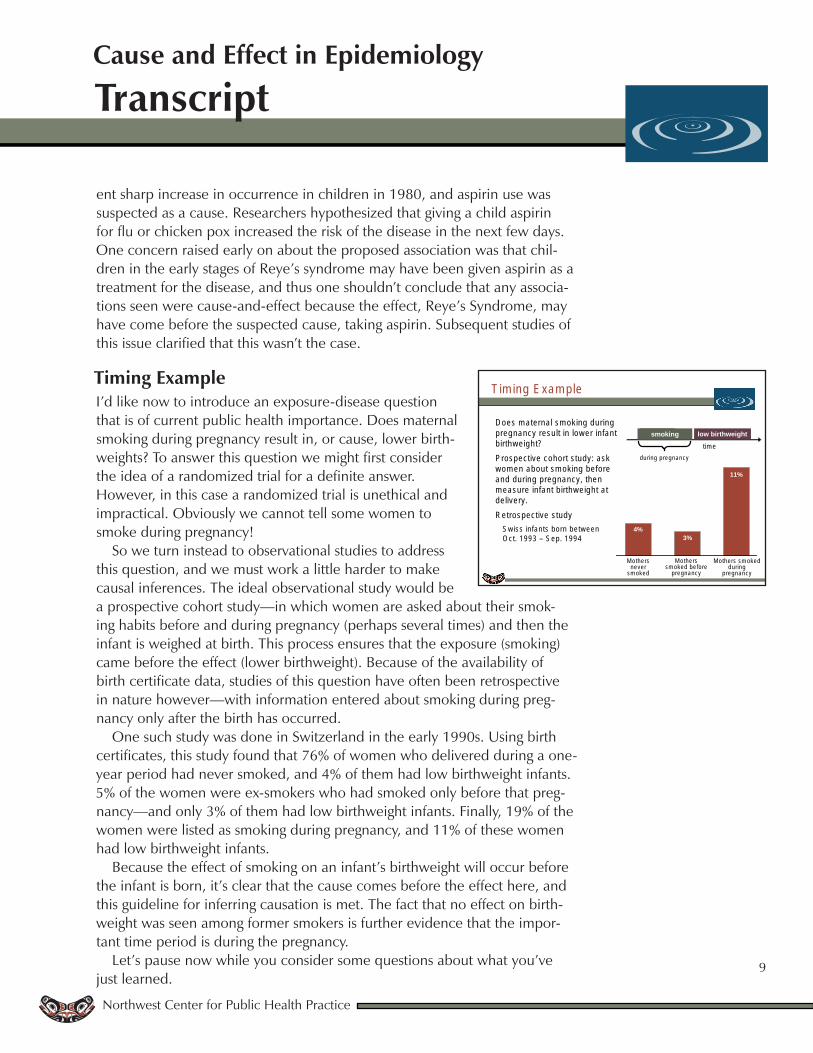
Timing ExampleI’d like now to introduce an exposure-disease question that is of current public health importance. Does maternal smoking during pregnancy result in, or cause, lower birth-weights? To answer this question we might first consider the idea of a randomized trial for a definite answer. However, in this case a randomized trial is unethical and impractical. Obviously we cannot tell some women to smoke during pregnancy!
So we turn instead to observational studies to address this question, and we must work a little harder to make causal inferences. The ideal observational study would be a prospective cohort study—in which women are asked about their smok-ing habits before and during pregnancy (perhaps several times) and then the infant is weighed at birth. This process ensures that the exposure (smoking) came before the effect (lower birthweight). Because of the availability of birth certificate data, studies of this question have often been retrospective in nature however—with information entered about smoking during preg-nancy only after the birth has occurred.
One such study was done in Switzerland in the early 1990s. Using birth certificates, this study found that 76% of women who delivered during a one-year period had never smoked, and 4% of them had low birthweight infants. 5% of the women were ex-smokers who had smoked only before that preg-nancy—and only 3% of them had low birthweight infants. Finally, 19% of the women were listed as smoking during pregnancy, and 11% of these women had low birthweight infants.
Because the effect of smoking on an infant’s birthweight will occur before the infant is born, it’s clear that the cause comes before the effect here, and this guideline for inferring causation is met. The fact that no effect on birth-weight was seen among former smokers is further evidence that the impor-tant time period is during the pregnancy.
Let’s pause now while you consider some questions about what you’ve just learned.
T im ing E xam ple
D oes m aterna l sm ok ing during pregnancy resu lt in low er in fan t b irthw e igh t?P rospective cohort s tudy: ask w om en about sm ok ing be fore and during pregnancy, then m easure in fant b irthw e igh t a t de livery.R etrospective s tudy
S w iss in fan ts born be tw een O ct. 1993 – S ep. 1994
tim esmoking low birthweight
during pregnancy
smoking
M others never
sm oked
M others sm oked before
pregnancy
M others sm oked during
pregnancy
4%3%
11%
Transcript
Northwest Center for Public Health Practice
10
Cause and Effect in Epidemiology
Exercise 2
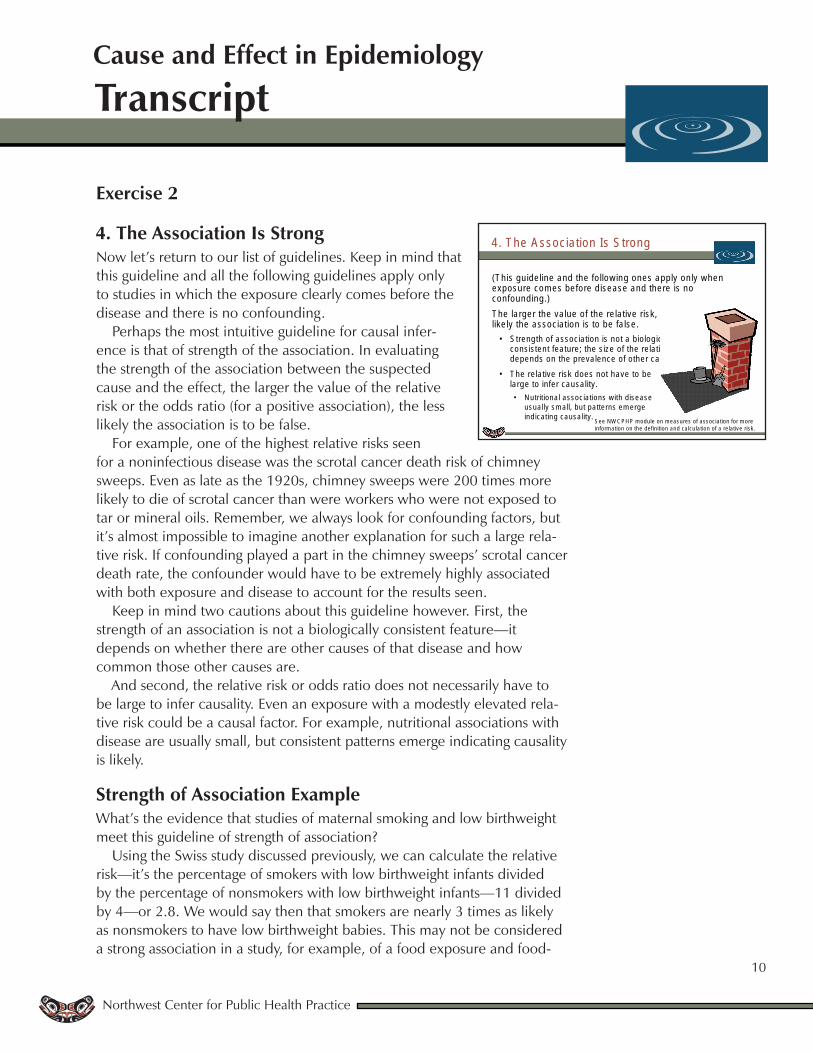
4. The Association Is StrongNow let’s return to our list of guidelines. Keep in mind that this guideline and all the following guidelines apply only to studies in which the exposure clearly comes before the disease and there is no confounding.
Perhaps the most intuitive guideline for causal infer-ence is that of strength of the association. In evaluating the strength of the association between the suspected cause and the effect, the larger the value of the relative risk or the odds ratio (for a positive association), the less likely the association is to be false.
For example, one of the highest relative risks seen for a noninfectious disease was the scrotal cancer death risk of chimney sweeps. Even as late as the 1920s, chimney sweeps were 200 times more likely to die of scrotal cancer than were workers who were not exposed to tar or mineral oils. Remember, we always look for confounding factors, but it’s almost impossible to imagine another explanation for such a large rela-tive risk. If confounding played a part in the chimney sweeps’ scrotal cancer death rate, the confounder would have to be extremely highly associated with both exposure and disease to account for the results seen.
Keep in mind two cautions about this guideline however. First, the strength of an association is not a biologically consistent feature—it depends on whether there are other causes of that disease and how common those other causes are.
And second, the relative risk or odds ratio does not necessarily have to be large to infer causality. Even an exposure with a modestly elevated rela-tive risk could be a causal factor. For example, nutritional associations with disease are usually small, but consistent patterns emerge indicating causality is likely.
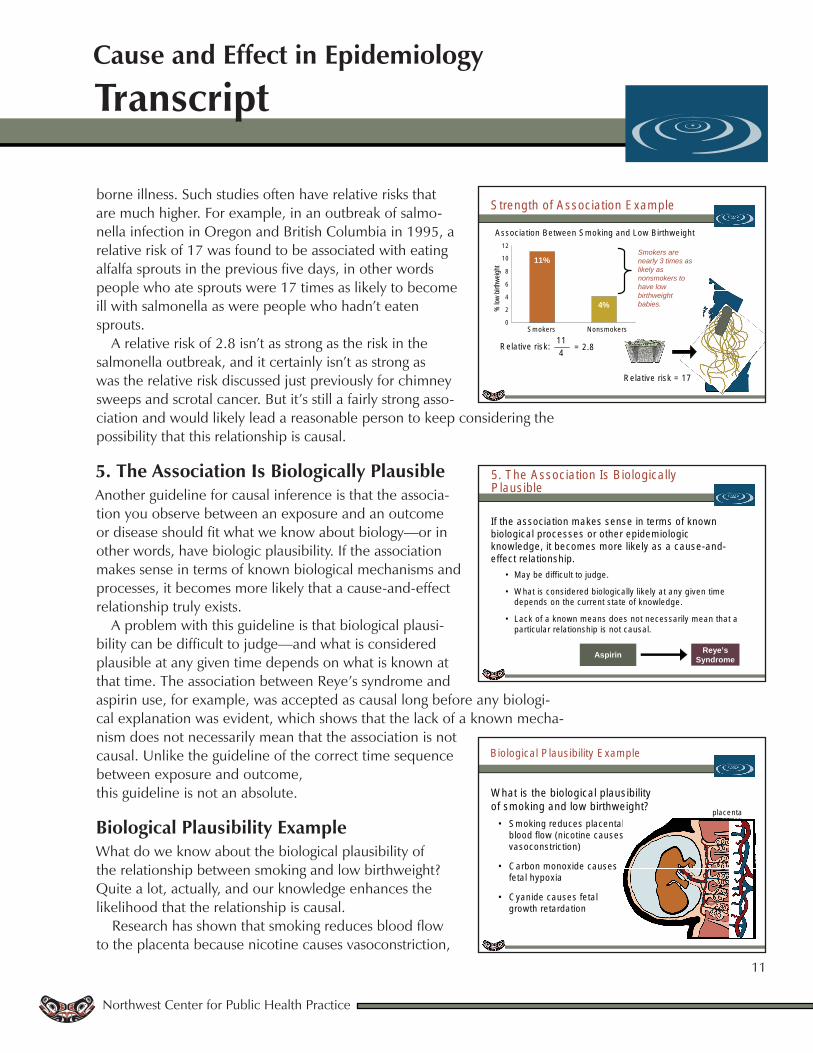
Strength of Association Example What’s the evidence that studies of maternal smoking and low birthweight meet this guideline of strength of association?
Using the Swiss study discussed previously, we can calculate the relative risk—it’s the percentage of smokers with low birthweight infants divided by the percentage of nonsmokers with low birthweight infants—11 divided by 4—or 2.8. We would say then that smokers are nearly 3 times as likely as nonsmokers to have low birthweight babies. This may not be considered a strong association in a study, for example, of a food exposure and food-
4. The A ssoc ia tion Is S trong
(T h is gu ide line and the fo llow ing ones app ly on ly w hen exposure com es befo re d isease and the re is no confound ing.)T he la rger the va lue o f the re la tive risk , the less like ly the associa tion is to be fa lse .
• S treng th of associa tion is no t a b io log ica lly consis ten t fea ture ; the s ize o f the re la tive risk depends on the preva lence of o ther causes.
• T he re la tive risk does not have to be la rge to in fer causa lity.• N utritiona l assoc ia tions w ith d isease
usua lly sm all, bu t pa tte rns em erge ind ica ting causa lity. S ee NW C P H P m odu le on m easures of assoc iation fo r m ore
in fo rm ation on the defin ition and ca lcu la tion of a re lative risk.
Transcript
Northwest Center for Public Health Practice
11
Cause and Effect in Epidemiology
borne illness. Such studies often have relative risks that are much higher. For example, in an outbreak of salmo-nella infection in Oregon and British Columbia in 1995, a relative risk of 17 was found to be associated with eating alfalfa sprouts in the previous five days, in other words people who ate sprouts were 17 times as likely to become ill with salmonella as were people who hadn’t eaten sprouts.
A relative risk of 2.8 isn’t as strong as the risk in the salmonella outbreak, and it certainly isn’t as strong as was the relative risk discussed just previously for chimney sweeps and scrotal cancer. But it’s still a fairly strong asso-ciation and would likely lead a reasonable person to keep considering the possibility that this relationship is causal.
5. The Association Is Biologically PlausibleAnother guideline for causal inference is that the associa-tion you observe between an exposure and an outcome or disease should fit what we know about biology—or in other words, have biologic plausibility. If the association makes sense in terms of known biological mechanisms and processes, it becomes more likely that a cause-and-effect relationship truly exists.
A problem with this guideline is that biological plausi-bility can be difficult to judge—and what is considered plausible at any given time depends on what is known at that time. The association between Reye’s syndrome and aspirin use, for example, was accepted as causal long before any biologi-cal explanation was evident, which shows that the lack of a known mecha-nism does not necessarily mean that the association is not causal. Unlike the guideline of the correct time sequence between exposure and outcome, this guideline is not an absolute.
Biological Plausibility ExampleWhat do we know about the biological plausibility of the relationship between smoking and low birthweight?Quite a lot, actually, and our knowledge enhances the likelihood that the relationship is causal.
Research has shown that smoking reduces blood flow to the placenta because nicotine causes vasoconstriction,
S treng th o f A ssoc ia tion E xam ple
R ela tive risk :
Smokers are nearly 3 times as likely as nonsmokers to have low birthweight babies.
S m okers N onsm okers0
2
4
6
8
10
12
% lo
w bir
thweig
ht
11%
4%
= 2 .8114
R ela tive risk = 17
A ssocia tion B etw een S m ok ing and Low B irthw e igh t
5 . The A ssoc ia tion Is B io log ica lly P laus ib le
If the associa tion m akes sense in te rm s o f know n b io log ica l p rocesses or o ther ep idem io log ic know ledge, it becom es m ore like ly as a cause-and-e ffec t re la tionsh ip .
• M ay be d iff icu lt to judge.
• W hat is considered b io log ica lly like ly a t any g iven tim e depends on the current sta te of know ledge.
• Lack of a know n m eans does no t necessarily m ean tha t a particu la r re la tionsh ip is no t causa l.
Reye’s SyndromeAspirin
B io log ica l P laus ib ility E xam p le
W hat is the b io log ica l p laus ib ility o f sm oking and low b irthw e igh t?
• S m oking reduces p lacen ta l b lood flow (n ico tine causes vasoconstric tion )
• C arbon m onoxide causes fe ta l hypoxia
• C yan ide causes fe ta l grow th re ta rda tion
placenta
Transcript
Northwest Center for Public Health Practice
12
Cause and Effect in Epidemiology
and that this reduced blood flow means less oxygen gets to the fetus, which interferes with growth.
Additionally, carbon monoxide, which is a by-product of smoking, also causes less oxygen to get to the fetus.
And finally, another by-product of smoking, cyanide, has been shown to slow fetal growth.
This body of biochemical evidence all points to the possibility that the relationship between smoking and lower birthweight is truly a causal one.
6. Higher Exposure Levels Carry Higher Disease Risks (Dose Gradient)Another guideline that points us toward causality is that the association is strongest when we predict it would be. This is sometimes referred to as a dose-response gradi-ent, or effect. Higher risks are seen with higher levels of exposure.
Although the observation of a gradient of disease risk associated with degree of exposure does point toward causality, keep in mind two cautions:
First, the presence of a dose-response relationship like this does not always mean that a cause-and-effect relation-ship actually exists. Confounding still could be responsible for the observed association.
And second, the absence of such a gradient doesn’t mean that a causal relationship doesn’t exist. We may not be able to see the dose-response rela-tionship because of insufficient variability in levels of exposure. For example, most women in the US have a dietary fat intake of about 30 to 40% of total calories. There may not be enough women at very low levels of fat intake in the US to see the decrease in breast cancer rates that might occur with, say 15% of calories coming from fat.
Or a dose-response relationship may not be evident because there may be a threshold, an exposure level above which additional exposure has no additional effect.
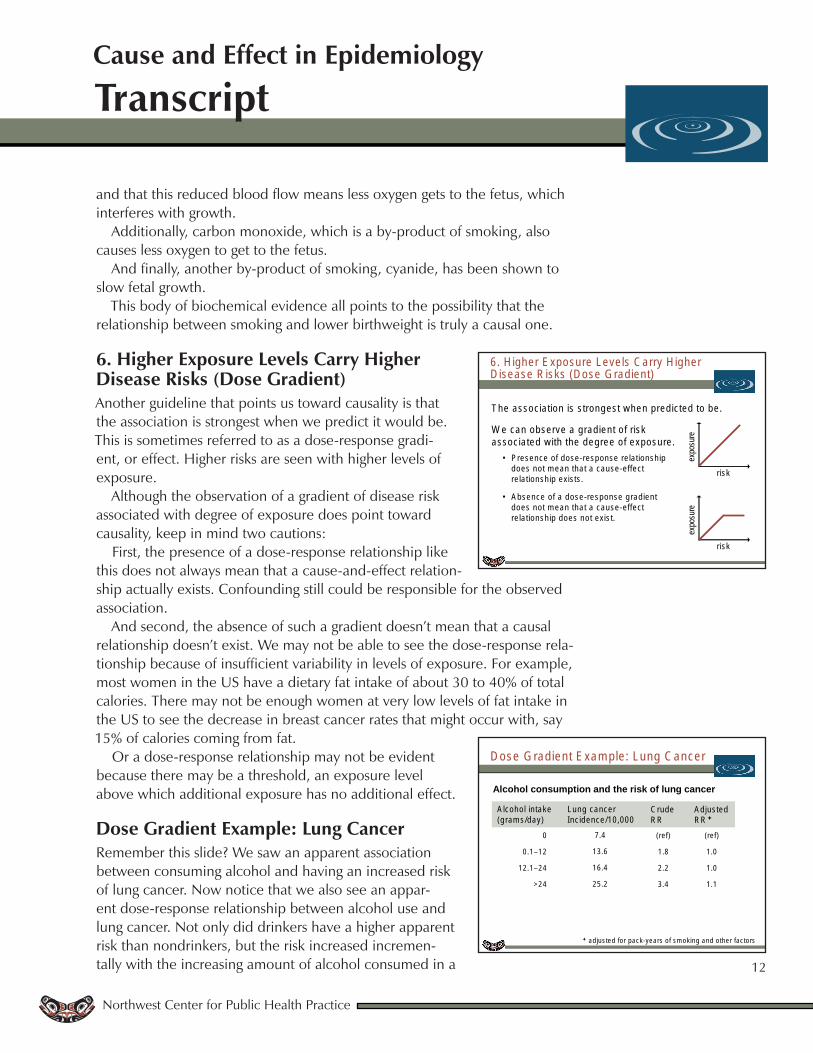
Dose Gradient Example: Lung Cancer Remember this slide? We saw an apparent association between consuming alcohol and having an increased risk of lung cancer. Now notice that we also see an appar-ent dose-response relationship between alcohol use and lung cancer. Not only did drinkers have a higher apparent risk than nondrinkers, but the risk increased incremen-tally with the increasing amount of alcohol consumed in a
6 . H igher E xposure Leve ls C arry H igher D isease R isks (D ose G rad ien t)
T he associa tion is s trongest w hen pred ic ted to be .
W e can observe a g rad ien t o f risk associa ted w ith the degree o f exposure .
• P resence of dose-response re la tionsh ip does no t m ean tha t a cause-effect re la tionsh ip exis ts .
• A bsence of a dose-response g rad ien t does no t m ean tha t a cause-effect re la tionsh ip does no t exis t.
expo
sure
r isk
expo
sure
r isk
D ose G rad ien t E xam ple : Lung C ancer
Alcohol consumption and the risk of lung cancer
ad jus ted fo r pack-years o f sm oking and o ther fac to rs
0
0 .1–12
12.1–24
>24
7.4
13.6
16.4
25.2
(ref)
1 .8
2 .2
3 .4
(ref)
1 .0
1 .0
1 .1
A lcoho l in take(g ram s/day)
Lung cancerInc idence/10 ,000
C rude R R
A djusted R R
Transcript
Northwest Center for Public Health Practice
13
Cause and Effect in Epidemiology
day. But remember, the association disappeared when we controlled for the confounding effect of smoking. Relying solely on the existence of an appar-ent dose-response relationship to infer causality would be a mistake in this situation.
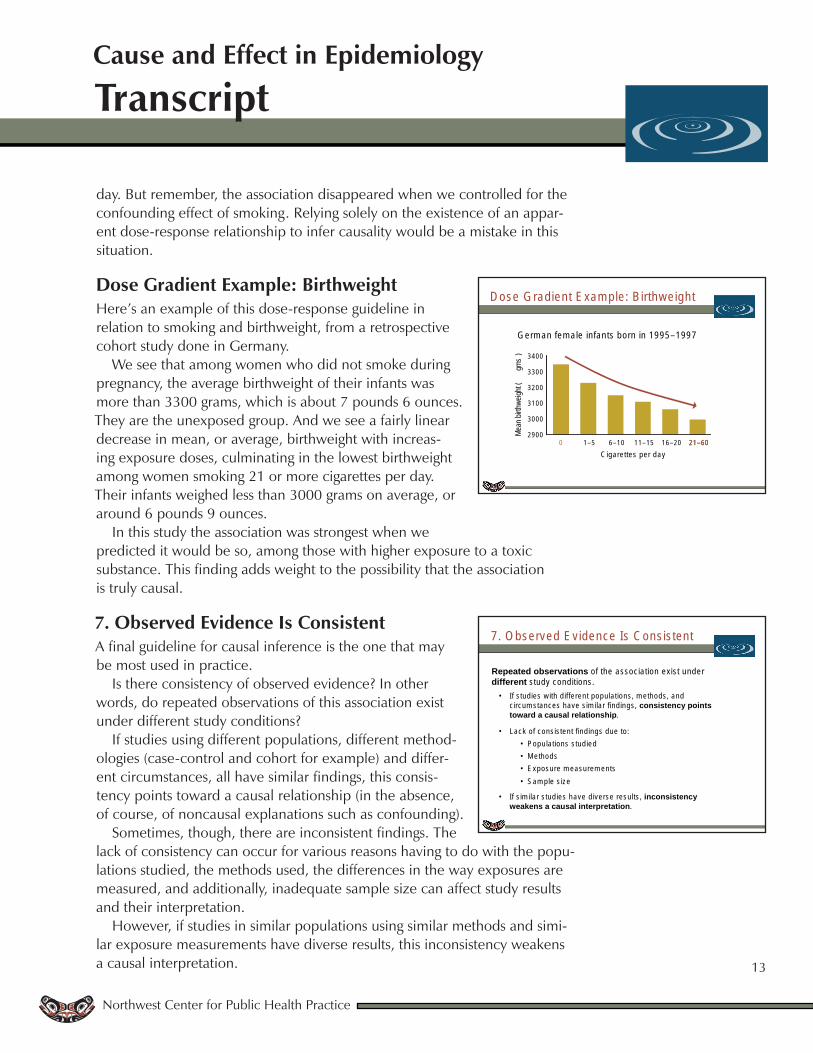
Dose Gradient Example: BirthweightHere’s an example of this dose-response guideline in relation to smoking and birthweight, from a retrospective cohort study done in Germany.
We see that among women who did not smoke during pregnancy, the average birthweight of their infants was more than 3300 grams, which is about 7 pounds 6 ounces. They are the unexposed group. And we see a fairly linear decrease in mean, or average, birthweight with increas-ing exposure doses, culminating in the lowest birthweight among women smoking 21 or more cigarettes per day. Their infants weighed less than 3000 grams on average, or around 6 pounds 9 ounces.
In this study the association was strongest when we predicted it would be so, among those with higher exposure to a toxic substance. This finding adds weight to the possibility that the association is truly causal.
7. Observed Evidence Is ConsistentA final guideline for causal inference is the one that may be most used in practice.
Is there consistency of observed evidence? In other words, do repeated observations of this association exist under different study conditions?
If studies using different populations, different method-ologies (case-control and cohort for example) and differ-ent circumstances, all have similar findings, this consis-tency points toward a causal relationship (in the absence, of course, of noncausal explanations such as confounding).
Sometimes, though, there are inconsistent findings. The lack of consistency can occur for various reasons having to do with the popu-lations studied, the methods used, the differences in the way exposures are measured, and additionally, inadequate sample size can affect study results and their interpretation.
However, if studies in similar populations using similar methods and simi-lar exposure measurements have diverse results, this inconsistency weakens a causal interpretation.
D ose G rad ien t E xam ple : B irthw e igh t
G erm an fem a le in fan ts bo rn in 1995–1997
0 1–5 6–10 11–15 16–20 21–60C igare ttes per day
2900
3000
3100
3200
3300
3400
Mean
birth
weigh
t (gm
s)
0 21–60
7 . O bserved E vidence Is C ons is ten t
Repeated observations of the associa tion exis t under different study cond itions.
• If s tud ies w ith d iffe ren t popu la tions , m ethods, and c ircum stances have s im ila r find ings , consistency points toward a causal relationship.
• Lack of cons is ten t find ings due to :• P opu la tions s tud ied• M ethods • E xposure m easurem ents• S am ple s ize
• If s im ila r s tud ies have d iverse resu lts , inconsistency weakens a causal interpretation.
Transcript
Northwest Center for Public Health Practice
14
Cause and Effect in Epidemiology
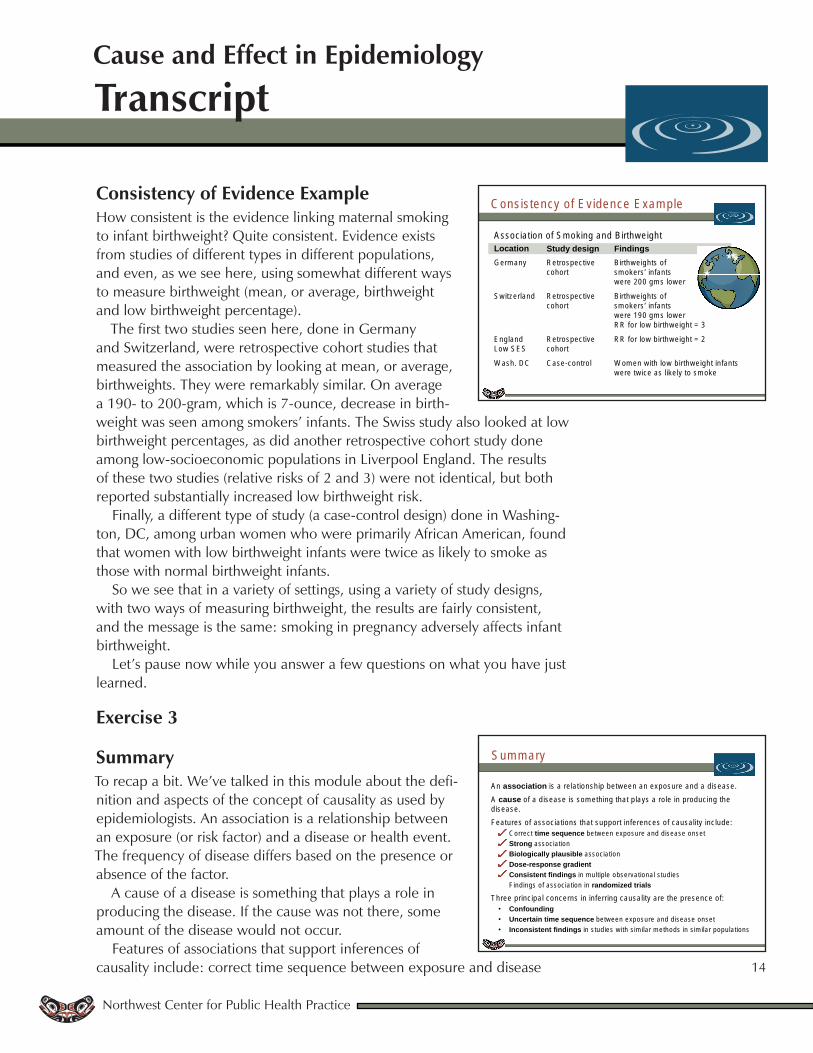
Consistency of Evidence ExampleHow consistent is the evidence linking maternal smoking to infant birthweight? Quite consistent. Evidence exists from studies of different types in different populations, and even, as we see here, using somewhat different ways to measure birthweight (mean, or average, birthweight and low birthweight percentage).
The first two studies seen here, done in Germany and Switzerland, were retrospective cohort studies that measured the association by looking at mean, or average, birthweights. They were remarkably similar. On average a 190- to 200-gram, which is 7-ounce, decrease in birth-weight was seen among smokers’ infants. The Swiss study also looked at low birthweight percentages, as did another retrospective cohort study done among low-socioeconomic populations in Liverpool England. The results of these two studies (relative risks of 2 and 3) were not identical, but both reported substantially increased low birthweight risk.
Finally, a different type of study (a case-control design) done in Washing-ton, DC, among urban women who were primarily African American, found that women with low birthweight infants were twice as likely to smoke as those with normal birthweight infants.
So we see that in a variety of settings, using a variety of study designs, with two ways of measuring birthweight, the results are fairly consistent, and the message is the same: smoking in pregnancy adversely affects infant birthweight.
Let’s pause now while you answer a few questions on what you have just learned.
Exercise 3
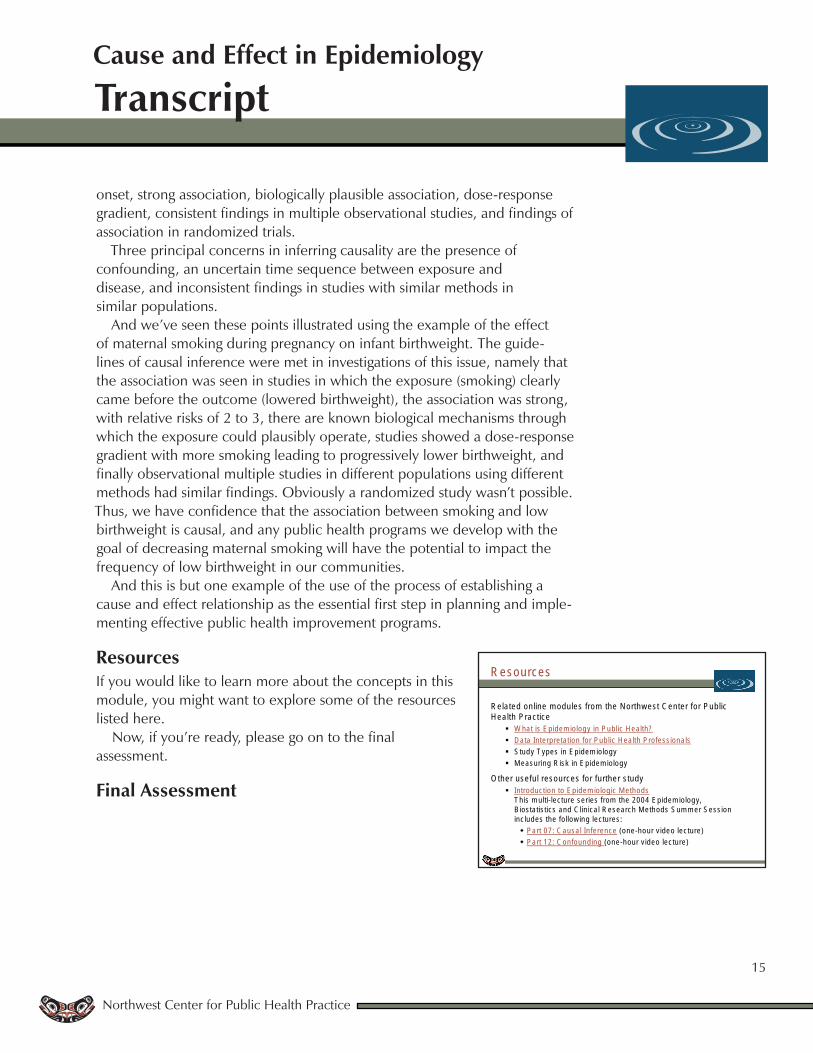
SummaryTo recap a bit. We’ve talked in this module about the defi-nition and aspects of the concept of causality as used by epidemiologists. An association is a relationship between an exposure (or risk factor) and a disease or health event. The frequency of disease differs based on the presence or absence of the factor.
A cause of a disease is something that plays a role in producing the disease. If the cause was not there, some amount of the disease would not occur.
Features of associations that support inferences of causality include: correct time sequence between exposure and disease
C onsis tency o f E v idence E xam ple
LocationG erm any
S w itzerland
E ng landLow S E S
W ash. D C
Study designR etrospective cohort
R etrospective cohort
R etrospective cohort
C ase-contro l
FindingsB irthw e igh ts o f sm okers ’ in fan ts w ere 200 gm s low er
B irthw e igh ts o fsm okers ’ in fan ts w ere 190 gm s low erR R fo r low b irthw e igh t = 3
R R fo r low b irthw e igh t = 2
W om en w ith low b irthw e igh t in fan ts w ere tw ice as like ly to sm oke
A ssocia tion o f S m oking and B irthw e igh t
S um m ary
A n association is a re la tionsh ip be tw een an exposure and a d isease.A cause of a d isease is som eth ing tha t p la ys a ro le in p roduc ing the d isease. Features o f assoc ia tions tha t support in fe rences o f causa lity inc lude:
• C orrec t time sequence be tw een exposure and d isease onset• Strong assoc ia tion• Biologically plausible assoc ia tion• Dose-response gradient• Consistent findings in m u ltip le observa tional s tud ies• F ind ings o f assoc ia tion in randomized trials
T hree princ ipa l concerns in in fe rring causa lity a re the p resence of: • Confounding• Uncertain time sequence be tw een exposure and d isease onse t• Inconsistent findings in s tud ies w ith s im ila r m ethods in s im ila r popu la tions
Transcript
Northwest Center for Public Health Practice
15
Cause and Effect in Epidemiology
onset, strong association, biologically plausible association, dose-response gradient, consistent findings in multiple observational studies, and findings of association in randomized trials.
Three principal concerns in inferring causality are the presence of confounding, an uncertain time sequence between exposure and disease, and inconsistent findings in studies with similar methods in similar populations.
And we’ve seen these points illustrated using the example of the effect of maternal smoking during pregnancy on infant birthweight. The guide-lines of causal inference were met in investigations of this issue, namely that the association was seen in studies in which the exposure (smoking) clearly came before the outcome (lowered birthweight), the association was strong, with relative risks of 2 to 3, there are known biological mechanisms through which the exposure could plausibly operate, studies showed a dose-response gradient with more smoking leading to progressively lower birthweight, and finally observational multiple studies in different populations using different methods had similar findings. Obviously a randomized study wasn’t possible. Thus, we have confidence that the association between smoking and low birthweight is causal, and any public health programs we develop with the goal of decreasing maternal smoking will have the potential to impact the frequency of low birthweight in our communities.
And this is but one example of the use of the process of establishing a cause and effect relationship as the essential first step in planning and imple-menting effective public health improvement programs.
ResourcesIf you would like to learn more about the concepts in this module, you might want to explore some of the resources listed here.
Now, if you’re ready, please go on to the final assessment.
Final Assessment
R esources
R ela ted on line m odu les from the N orthw est C enter fo r P ub lic H ea lth P ractice
W hat is E p idem io log y in P ub lic H ea lth?D ata In te rpre ta tion fo r P ub lic H ea lth P ro fess iona lsS tud y T ypes in E p idem io logyM easuring R isk in E p idem io logy
O ther usefu l resources fo r fu rther s tudyIn troduc tion to E p idem io log ic M ethodsT h is m ulti-lec tu re series from the 2004 E p idem io log y, B ios ta tis tics and C lin ica l R esearch M ethods S um m er S ess ion inc ludes the fo llow ing lec tures :
P art 07 : C ausa l In fe rence (one-hour v ideo lec ture)P art 12 : C onfound ing (one-hour v ideo lec ture)