Embed Size (px)
Citation preview
社会经济研究中心
SOCIO-ECONOMIC
RESEARCH CENTRE
New Malaysia in Transition:
Hope and Policy Priorities
Lee Heng Guie
Executive Director, SERC
27 August 2018
Socio-Economic Research Centre 1
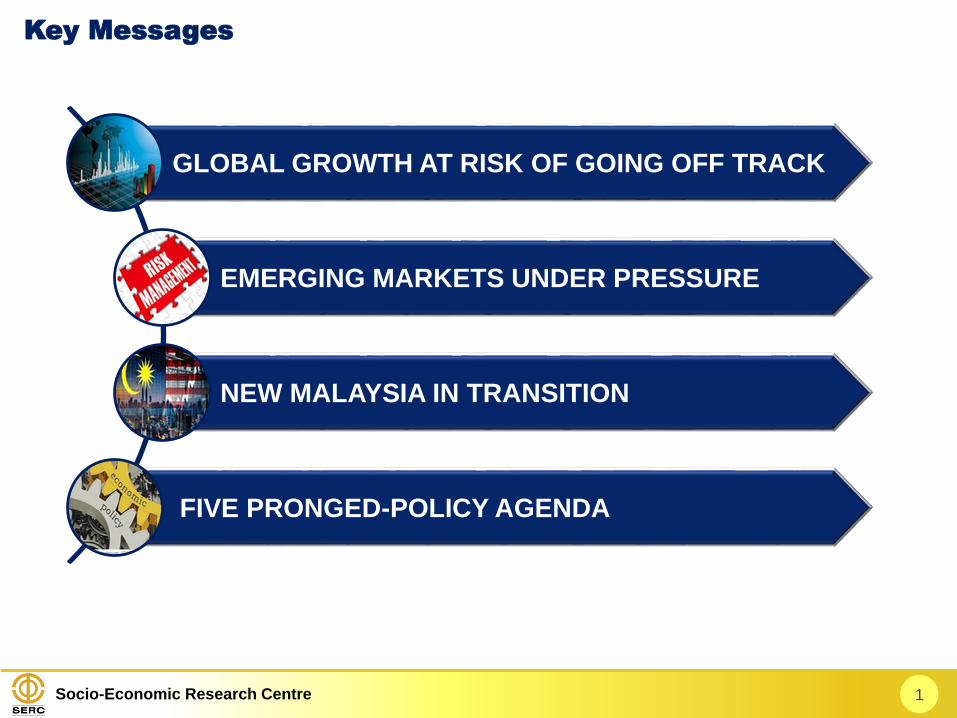
Key Messages
GLOBAL GROWTH AT RISK OF GOING OFF TRACK
EMERGING MARKETS UNDER PRESSURE
NEW MALAYSIA IN TRANSITION
FIVE PRONGED-POLICY AGENDA
Socio-Economic Research Centre
Global engine will continue to CRUISE ALONG in 2H18, albeit moderately. Global
growth has PEAKED or IS PEAKING. REAL RISKS could undermine the global
expansion and investors’ confidence.
Advanced economies appear to GO ON THEIR OWN WAY; CHINA displayed
signs of weakening momentum.
Uncertainties over GLOBAL TRADE WAR, RISING OIL PRICES and HIGHER
INTEREST RATES have started to temper synchronized global economic growth.
EMEGING MARKETS under pressure – currencies slid on capital reversals; fears
of contagion; trade battle risk.
CENTRAL BANKS are having a 'difficult time' following THE FED. Central banks
in emerging economies are expected to TREAD cautiously though some were
forced to ACT IMMEDIATELY.
2
DISRUPTIVE THREATS to global growth
Socio-Economic Research Centre 3
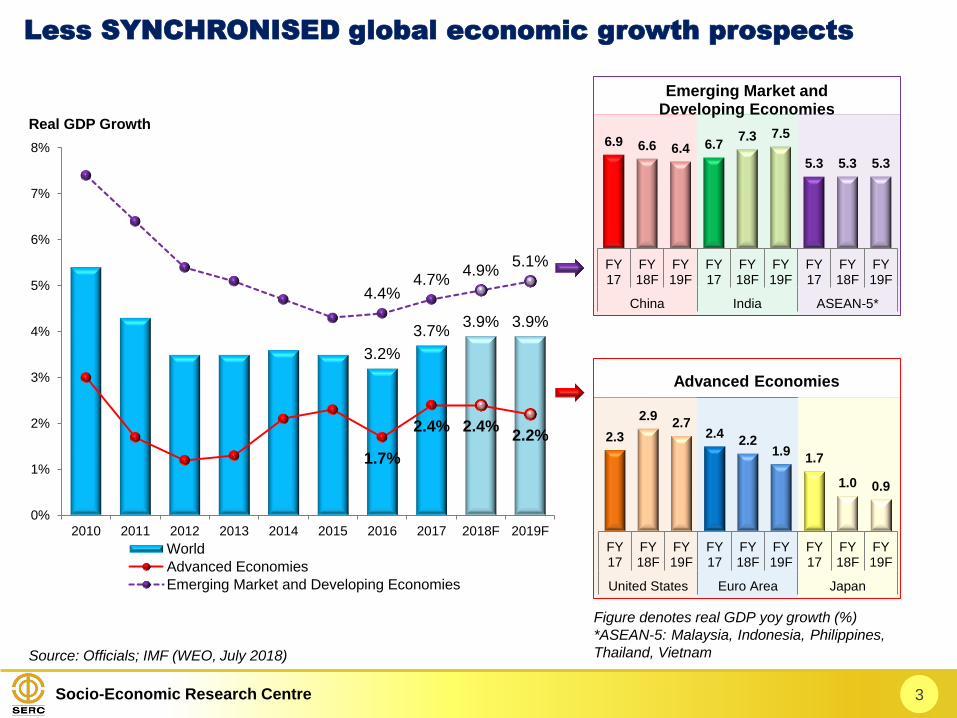
Less SYNCHRONISED global economic growth prospects
Source: Officials; IMF (WEO, July 2018)
3.2%
3.7%3.9% 3.9%
1.7%
2.4% 2.4%2.2%
4.4%4.7%
4.9%5.1%
0%
1%
2%
3%
4%
5%
6%
7%
8%
2010 2011 2012 2013 2014 2015 2016 2017 2018F 2019F
World
Advanced Economies
Emerging Market and Developing Economies
Real GDP Growth
Figure denotes real GDP yoy growth (%)
*ASEAN-5: Malaysia, Indonesia, Philippines,
Thailand, Vietnam
6.9 6.6 6.4 6.77.3 7.5
5.3 5.3 5.3
FY17
FY18F
FY19F
FY17
FY18F
FY19F
FY17
FY18F
FY19F
China India ASEAN-5*
Emerging Market and Developing Economies
2.3
2.92.7
2.42.2
1.91.7
1.0 0.9
FY17
FY18F
FY19F
FY17
FY18F
FY19F
FY17
FY18F
FY19F
United States Euro Area Japan
Advanced Economies
Socio-Economic Research Centre 4
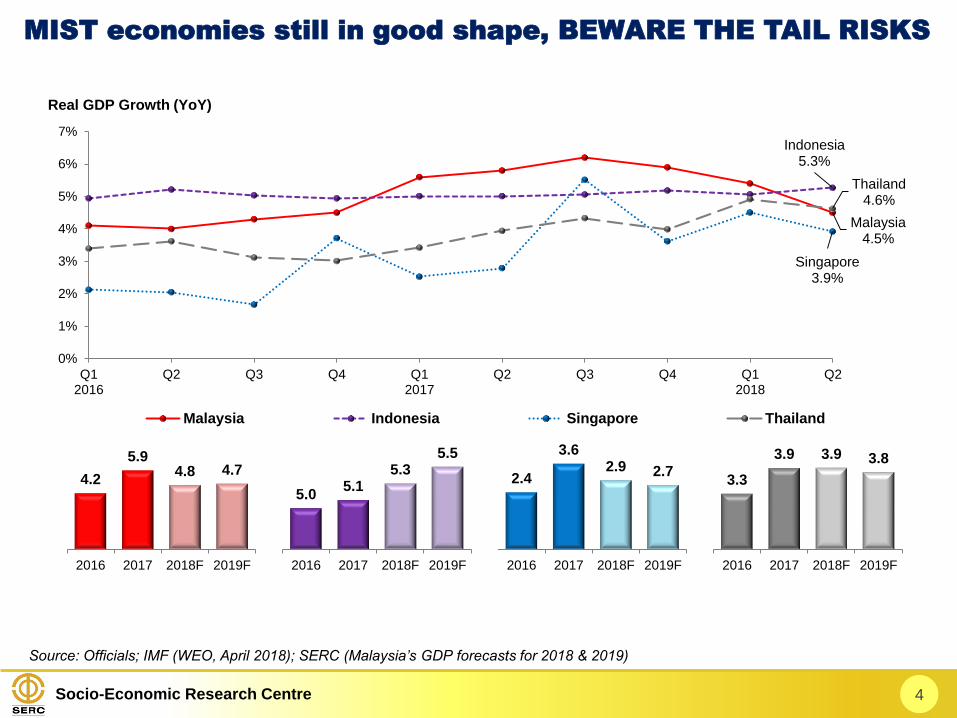
Source: Officials; IMF (WEO, April 2018); SERC (Malaysia’s GDP forecasts for 2018 & 2019)
Malaysia4.5%
Indonesia5.3%
Singapore3.9%
Thailand4.6%
0%
1%
2%
3%
4%
5%
6%
7%
Q12016
Q2 Q3 Q4 Q12017
Q2 Q3 Q4 Q12018
Q2
Malaysia Indonesia Singapore Thailand
Real GDP Growth (YoY)
4.2
5.94.8 4.7
2016 2017 2018F 2019F
2.4
3.62.9 2.7
2016 2017 2018F 2019F
5.05.1
5.35.5
2016 2017 2018F 2019F
3.3
3.9 3.9 3.8
2016 2017 2018F 2019F
MIST economies still in good shape, BEWARE THE TAIL RISKS
Socio-Economic Research Centre
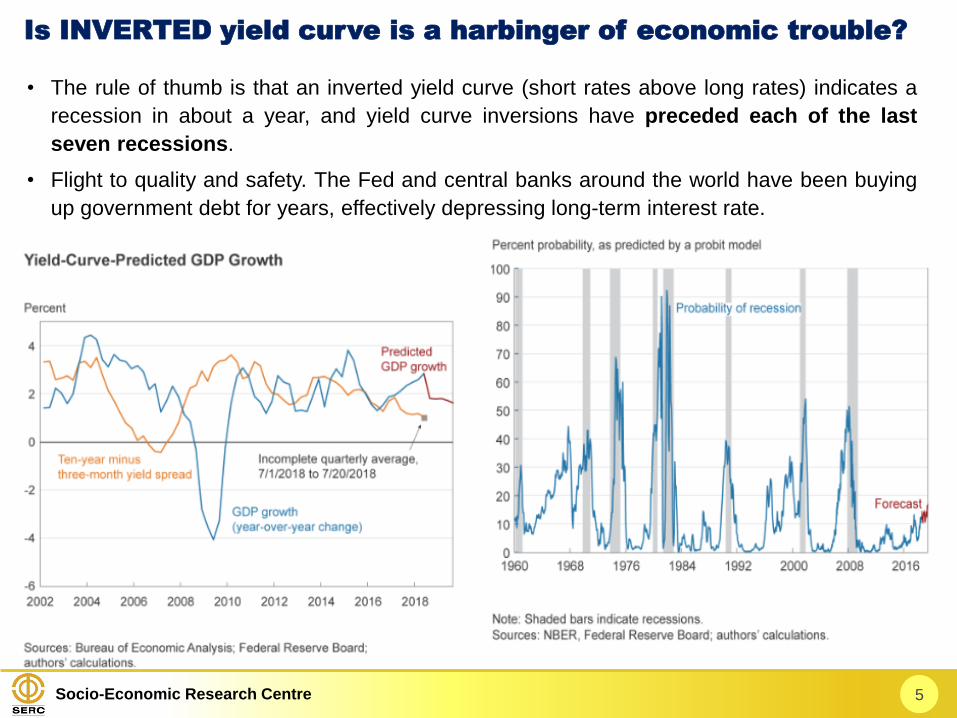
• The rule of thumb is that an inverted yield curve (short rates above long rates) indicates a
recession in about a year, and yield curve inversions have preceded each of the last
seven recessions.
• Flight to quality and safety. The Fed and central banks around the world have been buying
up government debt for years, effectively depressing long-term interest rate.
5
Is INVERTED yield curve is a harbinger of economic trouble?
Socio-Economic Research Centre 6
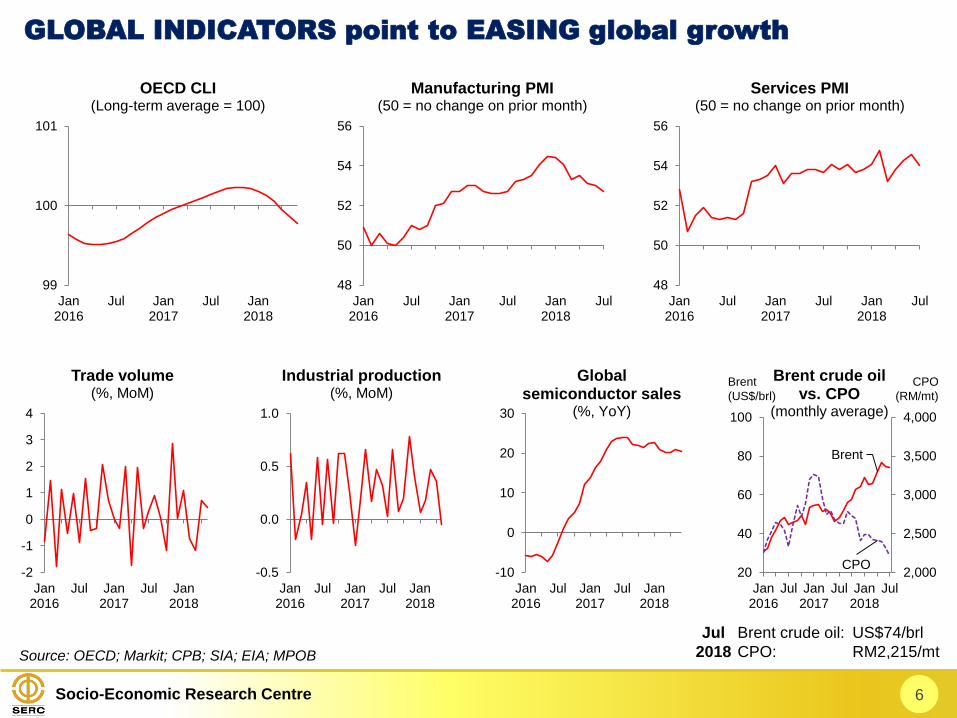
GLOBAL INDICATORS point to EASING global growth
Source: OECD; Markit; CPB; SIA; EIA; MPOB
48
50
52
54
56
Jan2016
Jul Jan2017
Jul Jan2018
Jul
Manufacturing PMI(50 = no change on prior month)
-2
-1
0
1
2
3
4
Jan2016
Jul Jan2017
Jul Jan2018
Trade volume(%, MoM)
99
100
101
Jan2016
Jul Jan2017
Jul Jan2018
OECD CLI(Long-term average = 100)
48
50
52
54
56
Jan2016
Jul Jan2017
Jul Jan2018
Jul
Services PMI(50 = no change on prior month)
-0.5
0.0
0.5
1.0
Jan2016
Jul Jan2017
Jul Jan2018
Industrial production(%, MoM)
-10
0
10
20
30
Jan2016
Jul Jan2017
Jul Jan2018
Global semiconductor sales
(%, YoY)
Brent
CPO2,000
2,500
3,000
3,500
4,000
20
40
60
80
100
Jan2016
Jul Jan2017
Jul Jan2018
Jul
Brent crude oilvs. CPO
(monthly average)
Brent
(US$/brl)
CPO
(RM/mt)
Jul Brent crude oil: US$74/brl
2018 CPO: RM2,215/mt
Socio-Economic Research Centre
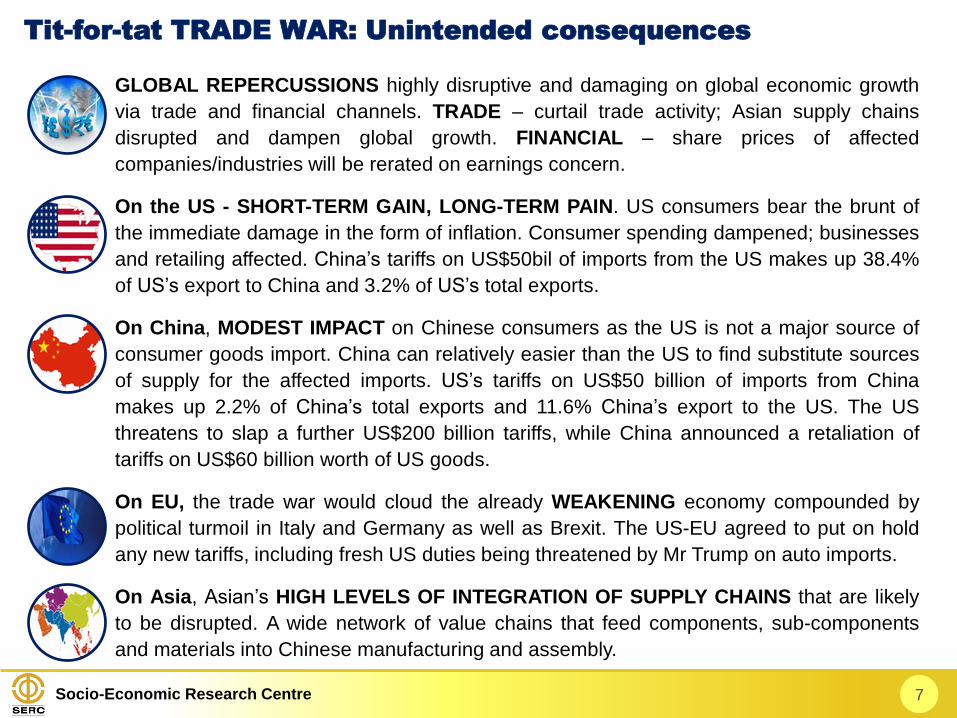
GLOBAL REPERCUSSIONS highly disruptive and damaging on global economic growth
via trade and financial channels. TRADE – curtail trade activity; Asian supply chains
disrupted and dampen global growth. FINANCIAL – share prices of affected
companies/industries will be rerated on earnings concern.
On the US - SHORT-TERM GAIN, LONG-TERM PAIN. US consumers bear the brunt of
the immediate damage in the form of inflation. Consumer spending dampened; businesses
and retailing affected. China’s tariffs on US$50bil of imports from the US makes up 38.4%
of US’s export to China and 3.2% of US’s total exports.
On China, MODEST IMPACT on Chinese consumers as the US is not a major source of
consumer goods import. China can relatively easier than the US to find substitute sources
of supply for the affected imports. US’s tariffs on US$50 billion of imports from China
makes up 2.2% of China’s total exports and 11.6% China’s export to the US. The US
threatens to slap a further US$200 billion tariffs, while China announced a retaliation of
tariffs on US$60 billion worth of US goods.
On EU, the trade war would cloud the already WEAKENING economy compounded by
political turmoil in Italy and Germany as well as Brexit. The US-EU agreed to put on hold
any new tariffs, including fresh US duties being threatened by Mr Trump on auto imports.
On Asia, Asian’s HIGH LEVELS OF INTEGRATION OF SUPPLY CHAINS that are likely
to be disrupted. A wide network of value chains that feed components, sub-components
and materials into Chinese manufacturing and assembly.
7
Tit-for-tat TRADE WAR: Unintended consequences
Socio-Economic Research Centre 8
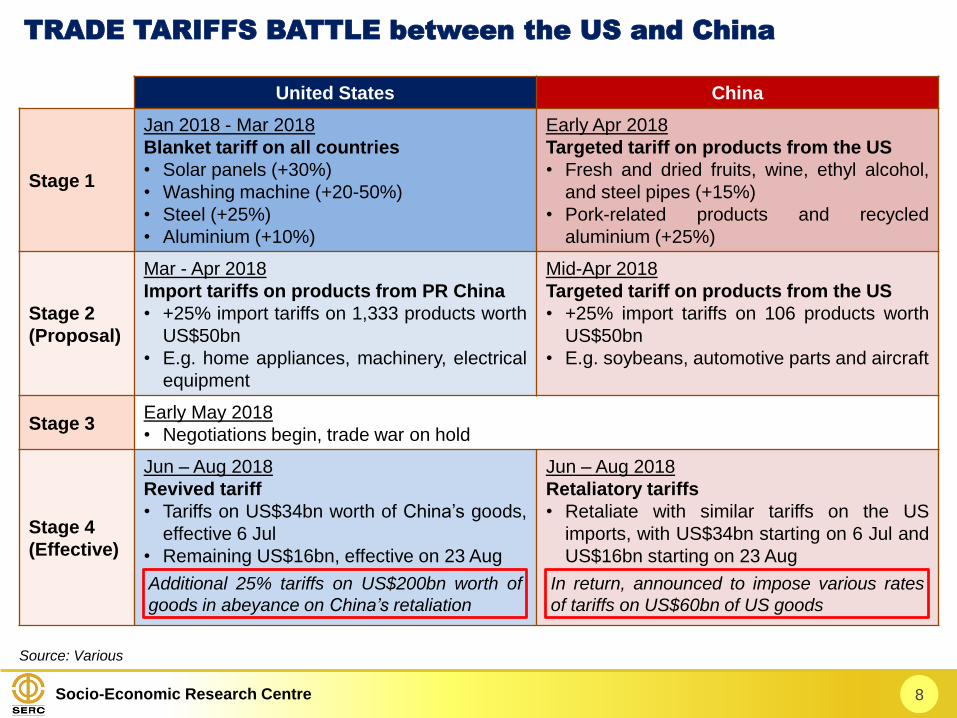
TRADE TARIFFS BATTLE between the US and China
United States China
Stage 1
Jan 2018 - Mar 2018
Blanket tariff on all countries
• Solar panels (+30%)
• Washing machine (+20-50%)
• Steel (+25%)
• Aluminium (+10%)
Early Apr 2018
Targeted tariff on products from the US
• Fresh and dried fruits, wine, ethyl alcohol,
and steel pipes (+15%)
• Pork-related products and recycled
aluminium (+25%)
Stage 2
(Proposal)
Mar - Apr 2018
Import tariffs on products from PR China
• +25% import tariffs on 1,333 products worth
US$50bn
• E.g. home appliances, machinery, electrical
equipment
Mid-Apr 2018
Targeted tariff on products from the US
• +25% import tariffs on 106 products worth
US$50bn
• E.g. soybeans, automotive parts and aircraft
Stage 3Early May 2018
• Negotiations begin, trade war on hold
Stage 4
(Effective)
Jun – Aug 2018
Revived tariff
• Tariffs on US$34bn worth of China’s goods,
effective 6 Jul
• Remaining US$16bn, effective on 23 Aug
Jun – Aug 2018
Retaliatory tariffs
• Retaliate with similar tariffs on the US
imports, with US$34bn starting on 6 Jul and
US$16bn starting on 23 Aug
Source: Various
Additional 25% tariffs on US$200bn worth of
goods in abeyance on China’s retaliation
In return, announced to impose various rates
of tariffs on US$60bn of US goods
Socio-Economic Research Centre 9
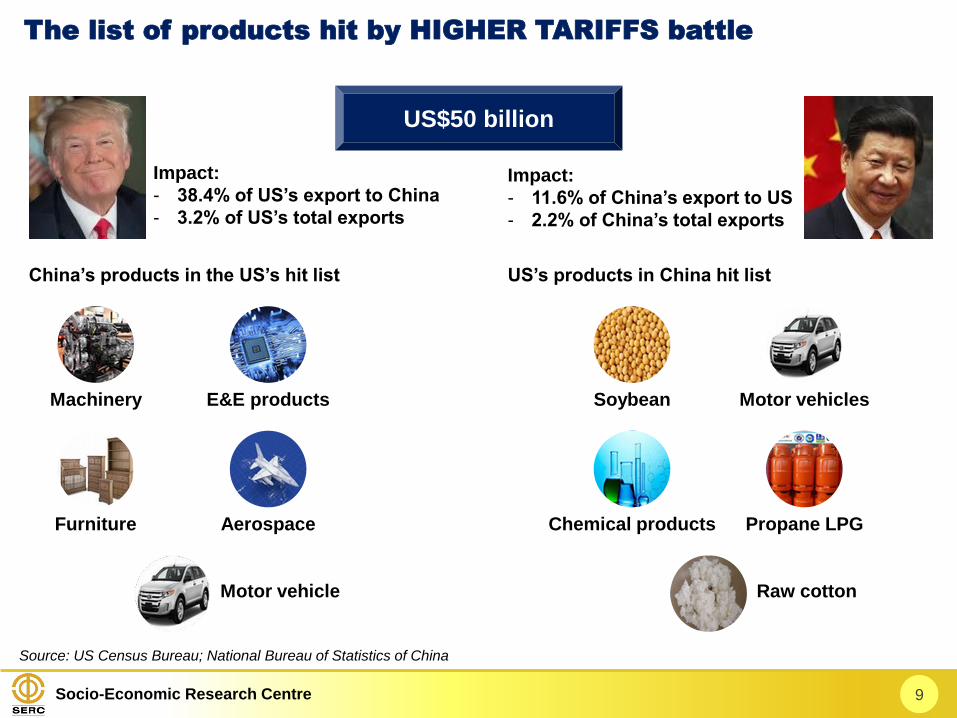
The list of products hit by HIGHER TARIFFS battle
Soybean
US$50 billion
Impact:
- 38.4% of US’s export to China
- 3.2% of US’s total exports
US’s products in China hit listChina’s products in the US’s hit list
Impact:
- 11.6% of China’s export to US
- 2.2% of China’s total exports
Source: US Census Bureau; National Bureau of Statistics of China
Chemical products Propane LPG
Motor vehicles
Raw cotton
Machinery
Furniture Aerospace
E&E products
Motor vehicle
Socio-Economic Research Centre 10
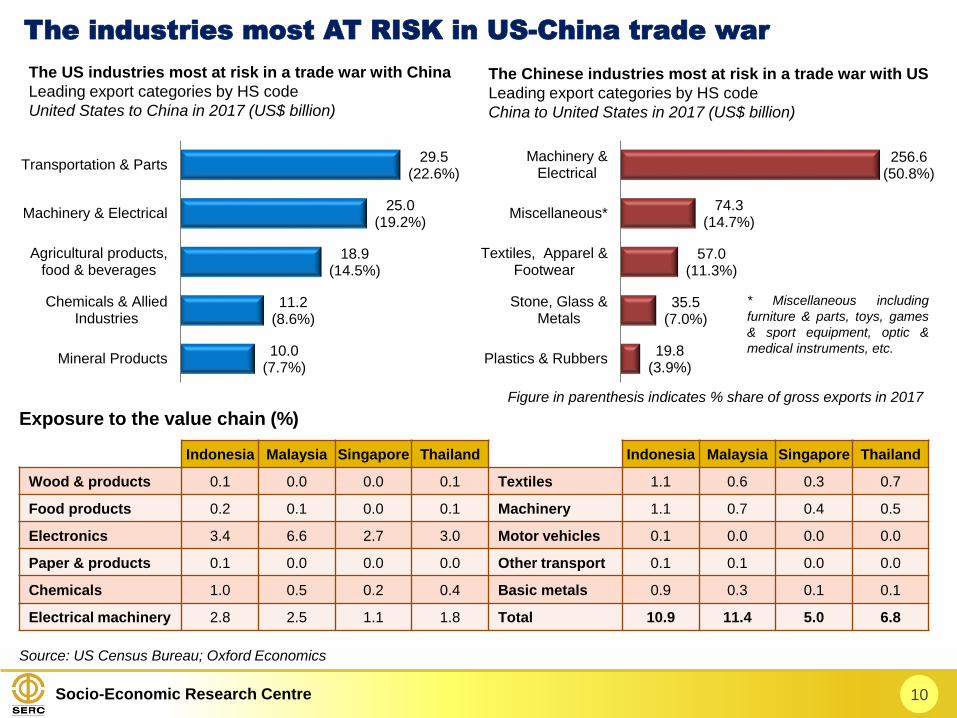
The industries most AT RISK in US-China trade war
10.0(7.7%)
11.2(8.6%)
18.9(14.5%)
25.0(19.2%)
29.5(22.6%)
Mineral Products
Chemicals & AlliedIndustries
Agricultural products,food & beverages
Machinery & Electrical
Transportation & Parts
The US industries most at risk in a trade war with China
Leading export categories by HS code
United States to China in 2017 (US$ billion)
19.8(3.9%)
35.5(7.0%)
57.0(11.3%)
74.3(14.7%)
256.6(50.8%)
Plastics & Rubbers
Stone, Glass &Metals
Textiles, Apparel &Footwear
Miscellaneous*
Machinery &Electrical
The Chinese industries most at risk in a trade war with US
Leading export categories by HS code
China to United States in 2017 (US$ billion)
Source: US Census Bureau; Oxford Economics
Indonesia Malaysia Singapore Thailand Indonesia Malaysia Singapore Thailand
Wood & products 0.1 0.0 0.0 0.1 Textiles 1.1 0.6 0.3 0.7
Food products 0.2 0.1 0.0 0.1 Machinery 1.1 0.7 0.4 0.5
Electronics 3.4 6.6 2.7 3.0 Motor vehicles 0.1 0.0 0.0 0.0
Paper & products 0.1 0.0 0.0 0.0 Other transport 0.1 0.1 0.0 0.0
Chemicals 1.0 0.5 0.2 0.4 Basic metals 0.9 0.3 0.1 0.1
Electrical machinery 2.8 2.5 1.1 1.8 Total 10.9 11.4 5.0 6.8
Exposure to the value chain (%)
Figure in parenthesis indicates % share of gross exports in 2017
* Miscellaneous including
furniture & parts, toys, games
& sport equipment, optic &
medical instruments, etc.
Socio-Economic Research Centre 11
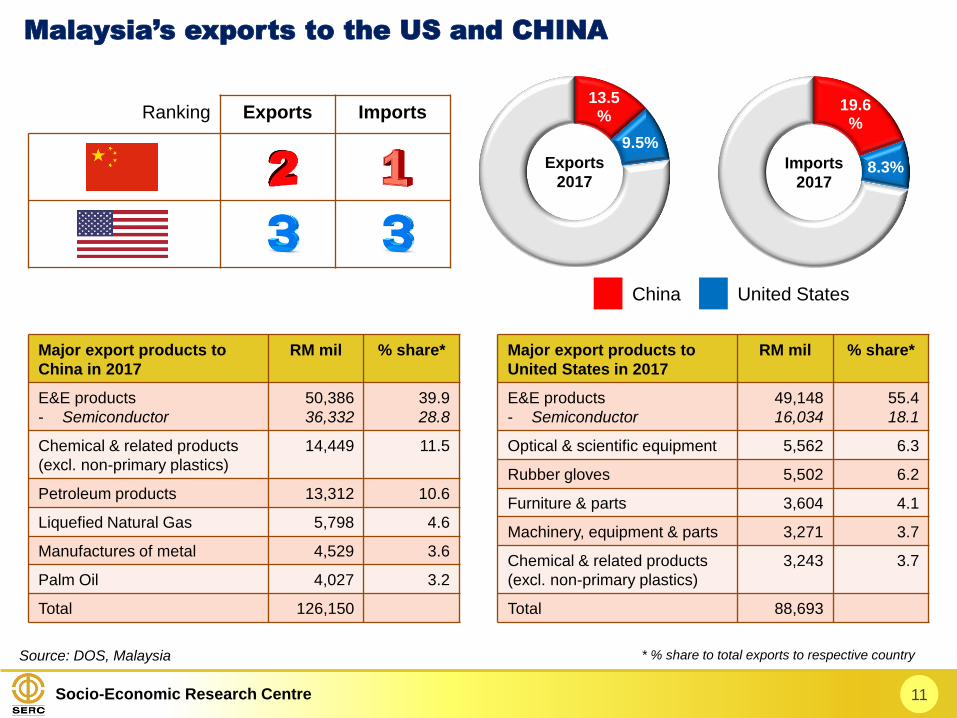
Malaysia’s exports to the US and CHINA
Source: DOS, Malaysia
13.5%
9.5%
Exports
2017
China United States
19.6%
8.3%Imports
2017
Ranking Exports Imports
Major export products to
China in 2017
RM mil % share*
E&E products
- Semiconductor
50,386
36,332
39.9
28.8
Chemical & related products
(excl. non-primary plastics)
14,449 11.5
Petroleum products 13,312 10.6
Liquefied Natural Gas 5,798 4.6
Manufactures of metal 4,529 3.6
Palm Oil 4,027 3.2
Total 126,150
Major export products to
United States in 2017
RM mil % share*
E&E products
- Semiconductor
49,148
16,034
55.4
18.1
Optical & scientific equipment 5,562 6.3
Rubber gloves 5,502 6.2
Furniture & parts 3,604 4.1
Machinery, equipment & parts 3,271 3.7
Chemical & related products
(excl. non-primary plastics)
3,243 3.7
Total 88,693
* % share to total exports to respective country
Socio-Economic Research Centre 12
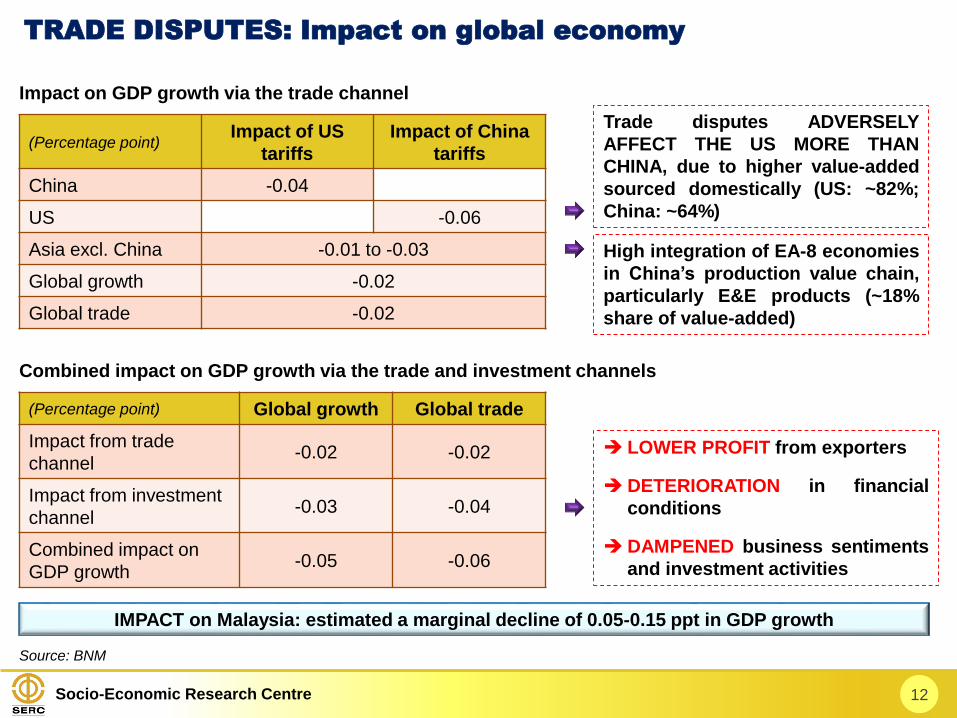
TRADE DISPUTES: Impact on global economy
(Percentage point)Impact of US
tariffs
Impact of China
tariffs
China -0.04
US -0.06
Asia excl. China -0.01 to -0.03
Global growth -0.02
Global trade -0.02
(Percentage point) Global growth Global trade
Impact from trade
channel-0.02 -0.02
Impact from investment
channel-0.03 -0.04
Combined impact on
GDP growth-0.05 -0.06
Impact on GDP growth via the trade channel
Combined impact on GDP growth via the trade and investment channels
Source: BNM
High integration of EA-8 economies
in China’s production value chain,
particularly E&E products (~18%
share of value-added)
Trade disputes ADVERSELY
AFFECT THE US MORE THAN
CHINA, due to higher value-added
sourced domestically (US: ~82%;
China: ~64%)
LOWER PROFIT from exporters
DETERIORATION in financial
conditions
DAMPENED business sentiments
and investment activities
IMPACT on Malaysia: estimated a marginal decline of 0.05-0.15 ppt in GDP growth
Socio-Economic Research Centre 13
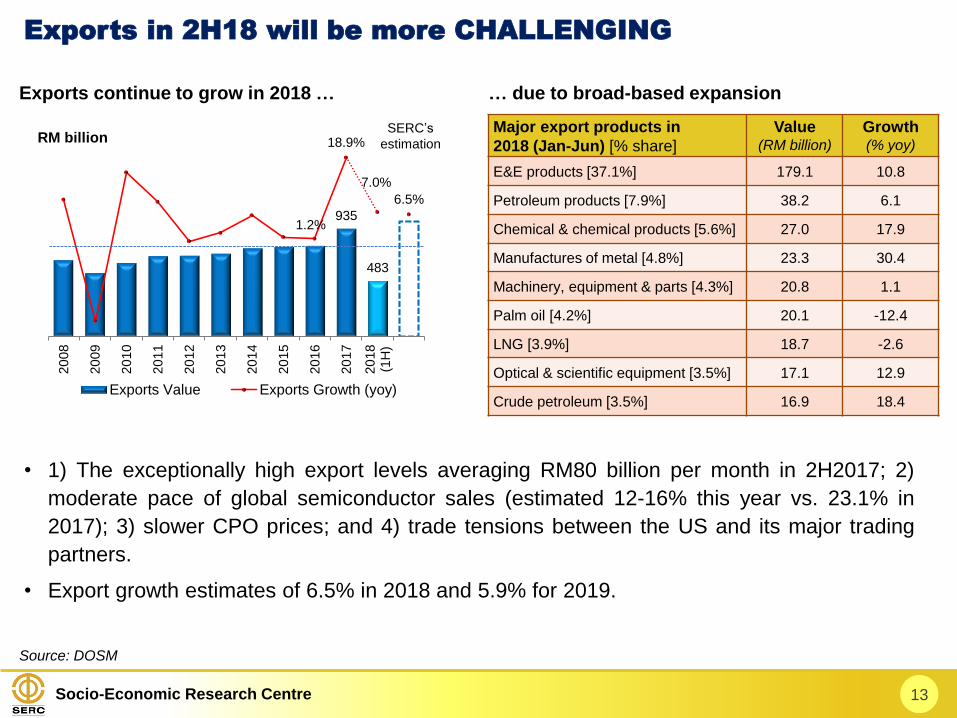
Exports in 2H18 will be more CHALLENGING
Source: DOSM
Exports continue to grow in 2018 … … due to broad-based expansion
Major export products in
2018 (Jan-Jun) [% share]
Value(RM billion)
Growth(% yoy)
E&E products [37.1%] 179.1 10.8
Petroleum products [7.9%] 38.2 6.1
Chemical & chemical products [5.6%] 27.0 17.9
Manufactures of metal [4.8%] 23.3 30.4
Machinery, equipment & parts [4.3%] 20.8 1.1
Palm oil [4.2%] 20.1 -12.4
LNG [3.9%] 18.7 -2.6
Optical & scientific equipment [3.5%] 17.1 12.9
Crude petroleum [3.5%] 16.9 18.4
• 1) The exceptionally high export levels averaging RM80 billion per month in 2H2017; 2)
moderate pace of global semiconductor sales (estimated 12-16% this year vs. 23.1% in
2017); 3) slower CPO prices; and 4) trade tensions between the US and its major trading
partners.
• Export growth estimates of 6.5% in 2018 and 5.9% for 2019.
935
483
1.2%
18.9%
7.0%
6.5%
20
08
20
09
20
10
20
11
20
12
20
13
20
14
20
15
20
16
20
17
20
18
(1H
)
RM billion
Exports Value Exports Growth (yoy)
SERC’s
estimation
Socio-Economic Research Centre
The weakest link in Argentina and Turkey have stirred the FEAR OF CONTAGION
RISKS in assets class of other emerging market economies in Asia such as India,
Indonesia, and Philippines.
CAPITAL OUTFLOWS are a natural reaction to RISING US BOND YIELDS, a
REVIVED STRENGTH OF THE DOLLAR, the expected FURTHER RISE IN THE
FED’S INTEREST RATE, and further amplified by TRADE AND GEOPOLITICAL
TENSIONS. HIGHER CRUDE OIL PRICES also exerted upward pressures on
inflation and budget of oil-importing countries.
While damaging market volatility, it is unlikely to trigger BROADER EMERGING
MARKETS’ CRISIS AND CONTAGION RISKS should be contained. The
ECONOMIC AND FINANCIAL FUNDAMENTALS in emerging market economies
in Asia have improved and strengthened in recent years.
14
Emerging markets under PRESSURE
Socio-Economic Research Centre 15
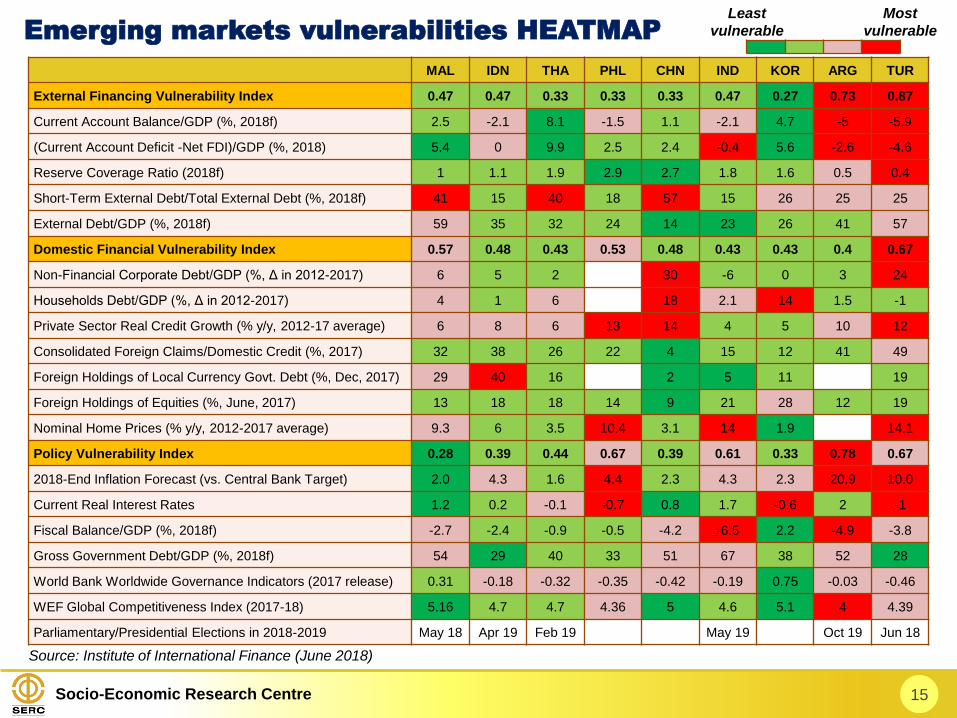
Emerging markets vulnerabilities HEATMAP
Source: Institute of International Finance (June 2018)
MAL IDN THA PHL CHN IND KOR ARG TUR
External Financing Vulnerability Index 0.47 0.47 0.33 0.33 0.33 0.47 0.27 0.73 0.87
Current Account Balance/GDP (%, 2018f) 2.5 -2.1 8.1 -1.5 1.1 -2.1 4.7 -5 -5.9
(Current Account Deficit -Net FDI)/GDP (%, 2018) 5.4 0 9.9 2.5 2.4 -0.4 5.6 -2.6 -4.6
Reserve Coverage Ratio (2018f) 1 1.1 1.9 2.9 2.7 1.8 1.6 0.5 0.4
Short-Term External Debt/Total External Debt (%, 2018f) 41 15 40 18 57 15 26 25 25
External Debt/GDP (%, 2018f) 59 35 32 24 14 23 26 41 57
Domestic Financial Vulnerability Index 0.57 0.48 0.43 0.53 0.48 0.43 0.43 0.4 0.67
Non-Financial Corporate Debt/GDP (%, Δ in 2012-2017) 6 5 2 30 -6 0 3 24
Households Debt/GDP (%, Δ in 2012-2017) 4 1 6 18 2.1 14 1.5 -1
Private Sector Real Credit Growth (% y/y, 2012-17 average) 6 8 6 13 14 4 5 10 12
Consolidated Foreign Claims/Domestic Credit (%, 2017) 32 38 26 22 4 15 12 41 49
Foreign Holdings of Local Currency Govt. Debt (%, Dec, 2017) 29 40 16 2 5 11 19
Foreign Holdings of Equities (%, June, 2017) 13 18 18 14 9 21 28 12 19
Nominal Home Prices (% y/y, 2012-2017 average) 9.3 6 3.5 10.4 3.1 14 1.9 14.1
Policy Vulnerability Index 0.28 0.39 0.44 0.67 0.39 0.61 0.33 0.78 0.67
2018-End Inflation Forecast (vs. Central Bank Target) 2.0 4.3 1.6 4.4 2.3 4.3 2.3 20.9 10.0
Current Real Interest Rates 1.2 0.2 -0.1 -0.7 0.8 1.7 -0.6 2 -1
Fiscal Balance/GDP (%, 2018f) -2.7 -2.4 -0.9 -0.5 -4.2 -6.5 2.2 -4.9 -3.8
Gross Government Debt/GDP (%, 2018f) 54 29 40 33 51 67 38 52 28
World Bank Worldwide Governance Indicators (2017 release) 0.31 -0.18 -0.32 -0.35 -0.42 -0.19 0.75 -0.03 -0.46
WEF Global Competitiveness Index (2017-18) 5.16 4.7 4.7 4.36 5 4.6 5.1 4 4.39
Parliamentary/Presidential Elections in 2018-2019 May 18 Apr 19 Feb 19 May 19 Oct 19 Jun 18
Least
vulnerable
Most
vulnerable
Socio-Economic Research Centre 16
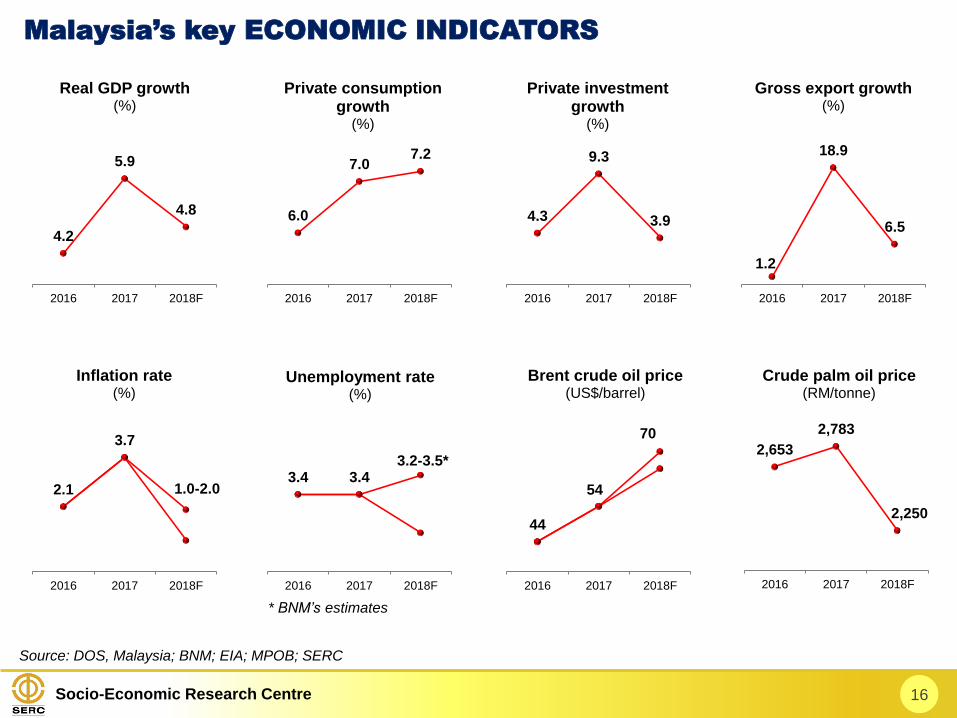
Malaysia’s key ECONOMIC INDICATORS
Source: DOS, Malaysia; BNM; EIA; MPOB; SERC
6.0
7.07.2
2016 2017 2018F
Private consumption growth
(%)
4.3
9.3
3.9
2016 2017 2018F
Private investment growth
(%)
4.2
5.9
4.8
2016 2017 2018F
Real GDP growth(%)
2,653
2,783
2,250
2016 2017 2018F
Crude palm oil price(RM/tonne)
44
54
2016 2017 2018F
Brent crude oil price(US$/barrel)
70
3.4 3.4
2016 2017 2018F
Unemployment rate(%)
3.2-3.5*
1.2
18.9
6.5
2016 2017 2018F
Gross export growth(%)
2.1
3.7
2016 2017 2018F
Inflation rate(%)
1.0-2.0
* BNM’s estimates
Socio-Economic Research Centre
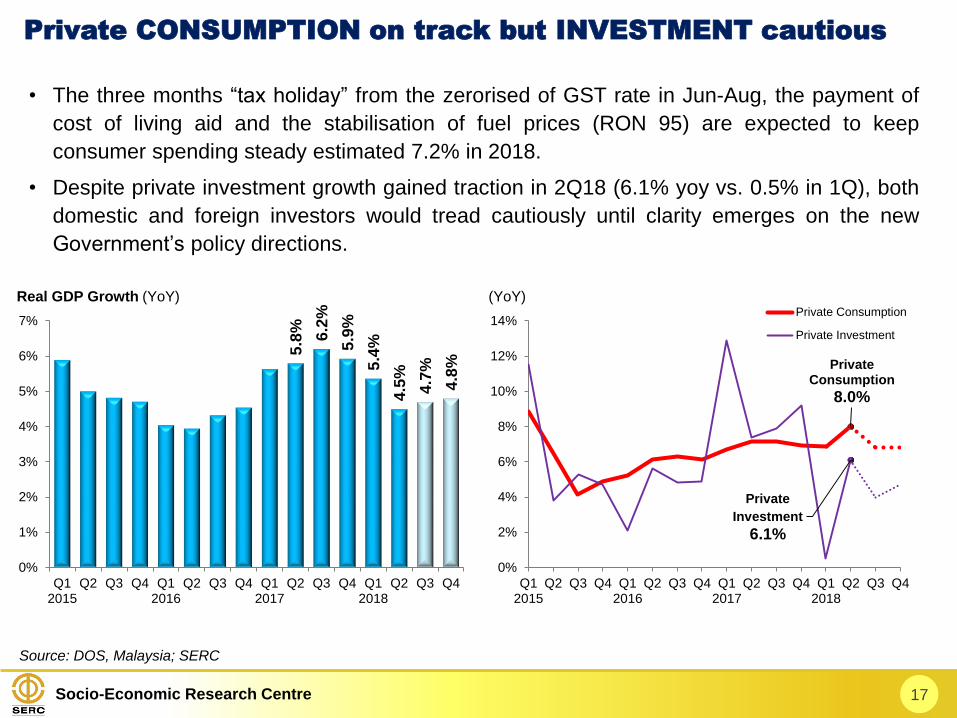
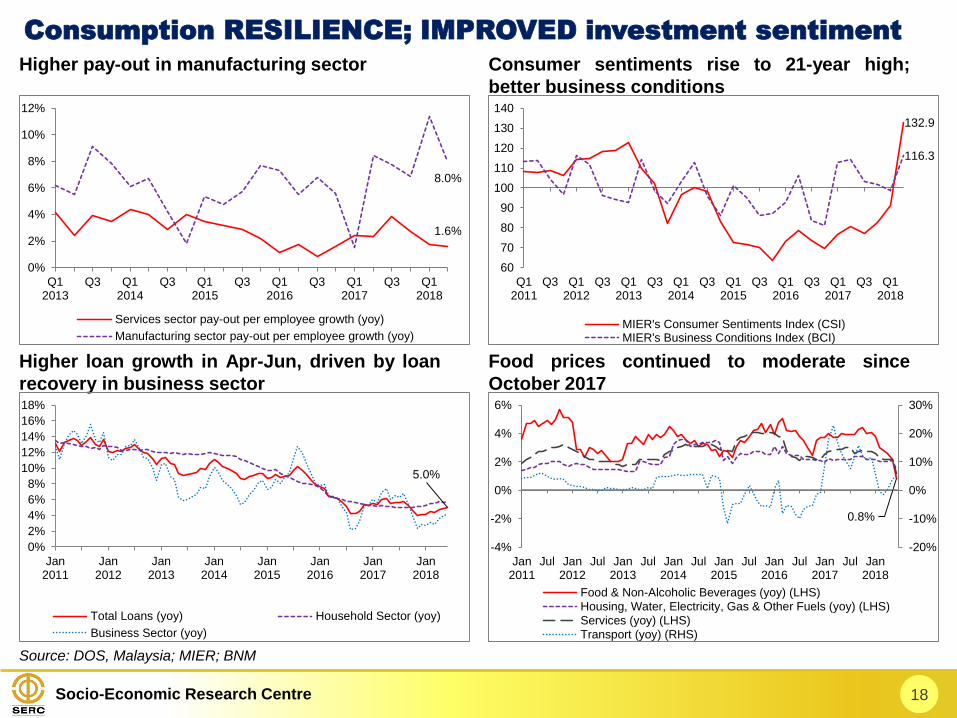
• The three months “tax holiday” from the zerorised of GST rate in Jun-Aug, the payment of
cost of living aid and the stabilisation of fuel prices (RON 95) are expected to keep
consumer spending steady estimated 7.2% in 2018.
• Despite private investment growth gained traction in 2Q18 (6.1% yoy vs. 0.5% in 1Q), both
domestic and foreign investors would tread cautiously until clarity emerges on the new
Government’s policy directions.
17
Private CONSUMPTION on track but INVESTMENT cautious
5.8
%
6.2
%
5.9
%
5.4
%
4.5
%
4.7
%
4.8
%
0%
1%
2%
3%
4%
5%
6%
7%
Q12015
Q2 Q3 Q4 Q12016
Q2 Q3 Q4 Q12017
Q2 Q3 Q4 Q12018
Q2 Q3 Q4
Real GDP Growth (YoY)
Private Consumption
8.0%
Private
Investment
6.1%
0%
2%
4%
6%
8%
10%
12%
14%
Q12015
Q2 Q3 Q4 Q12016
Q2 Q3 Q4 Q12017
Q2 Q3 Q4 Q12018
Q2 Q3 Q4
Private Consumption
Private Investment
(YoY)
Source: DOS, Malaysia; SERC
Socio-Economic Research Centre 18
Consumption RESILIENCE; IMPROVED investment sentiment
Source: DOS, Malaysia; MIER; BNM
Higher pay-out in manufacturing sector Consumer sentiments rise to 21-year high;
better business conditions
Higher loan growth in Apr-Jun, driven by loan
recovery in business sector
Food prices continued to moderate since
October 2017
1.6%
8.0%
0%
2%
4%
6%
8%
10%
12%
Q12013
Q3 Q12014
Q3 Q12015
Q3 Q12016
Q3 Q12017
Q3 Q12018
Services sector pay-out per employee growth (yoy)
Manufacturing sector pay-out per employee growth (yoy)
132.9
116.3
60
70
80
90
100
110
120
130
140
Q12011
Q3 Q12012
Q3 Q12013
Q3 Q12014
Q3 Q12015
Q3 Q12016
Q3 Q12017
Q3 Q12018
MIER's Consumer Sentiments Index (CSI)MIER's Business Conditions Index (BCI)
5.0%
0%
2%
4%
6%
8%
10%
12%
14%
16%
18%
Jan2011
Jan2012
Jan2013
Jan2014
Jan2015
Jan2016
Jan2017
Jan2018
Total Loans (yoy) Household Sector (yoy)
Business Sector (yoy)
0.8%
-20%
-10%
0%
10%
20%
30%
-4%
-2%
0%
2%
4%
6%
Jan2011
Jul Jan2012
Jul Jan2013
Jul Jan2014
Jul Jan2015
Jul Jan2016
Jul Jan2017
Jul Jan2018
Food & Non-Alcoholic Beverages (yoy) (LHS)Housing, Water, Electricity, Gas & Other Fuels (yoy) (LHS)Services (yoy) (LHS)Transport (yoy) (RHS)
Socio-Economic Research Centre 19
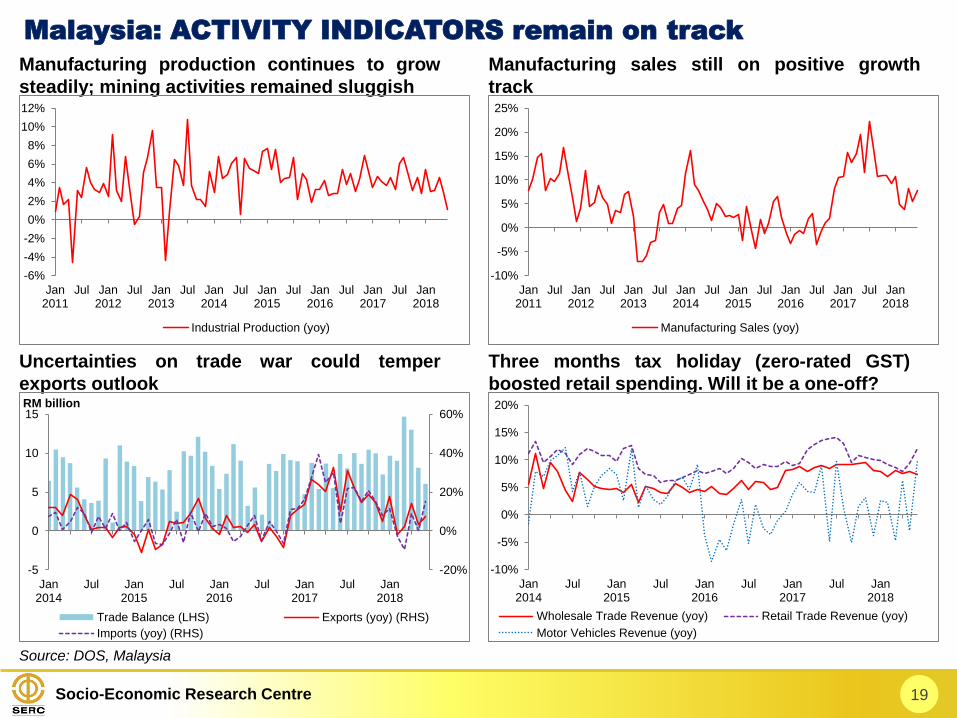
Malaysia: ACTIVITY INDICATORS remain on track
Source: DOS, Malaysia
Manufacturing production continues to grow
steadily; mining activities remained sluggish
Manufacturing sales still on positive growth
track
Uncertainties on trade war could temper
exports outlook
Three months tax holiday (zero-rated GST)
boosted retail spending. Will it be a one-off?
-6%
-4%
-2%
0%
2%
4%
6%
8%
10%
12%
Jan2011
Jul Jan2012
Jul Jan2013
Jul Jan2014
Jul Jan2015
Jul Jan2016
Jul Jan2017
Jul Jan2018
Industrial Production (yoy)
-10%
-5%
0%
5%
10%
15%
20%
25%
Jan2011
Jul Jan2012
Jul Jan2013
Jul Jan2014
Jul Jan2015
Jul Jan2016
Jul Jan2017
Jul Jan2018
Manufacturing Sales (yoy)
-20%
0%
20%
40%
60%
-5
0
5
10
15
Jan2014
Jul Jan2015
Jul Jan2016
Jul Jan2017
Jul Jan2018
RM billion
Trade Balance (LHS) Exports (yoy) (RHS)
Imports (yoy) (RHS)
-10%
-5%
0%
5%
10%
15%
20%
Jan2014
Jul Jan2015
Jul Jan2016
Jul Jan2017
Jul Jan2018
Wholesale Trade Revenue (yoy) Retail Trade Revenue (yoy)
Motor Vehicles Revenue (yoy)
Socio-Economic Research Centre
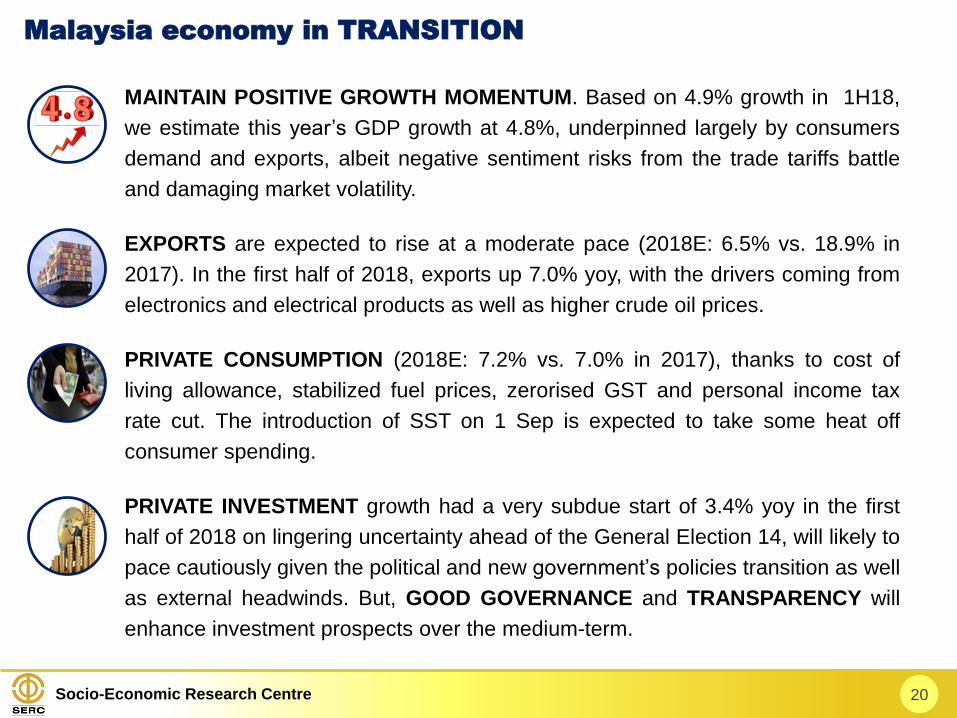
MAINTAIN POSITIVE GROWTH MOMENTUM. Based on 4.9% growth in 1H18,
we estimate this year’s GDP growth at 4.8%, underpinned largely by consumers
demand and exports, albeit negative sentiment risks from the trade tariffs battle
and damaging market volatility.
EXPORTS are expected to rise at a moderate pace (2018E: 6.5% vs. 18.9% in
2017). In the first half of 2018, exports up 7.0% yoy, with the drivers coming from
electronics and electrical products as well as higher crude oil prices.
PRIVATE CONSUMPTION (2018E: 7.2% vs. 7.0% in 2017), thanks to cost of
living allowance, stabilized fuel prices, zerorised GST and personal income tax
rate cut. The introduction of SST on 1 Sep is expected to take some heat off
consumer spending.
PRIVATE INVESTMENT growth had a very subdue start of 3.4% yoy in the first
half of 2018 on lingering uncertainty ahead of the General Election 14, will likely to
pace cautiously given the political and new government’s policies transition as well
as external headwinds. But, GOOD GOVERNANCE and TRANSPARENCY will
enhance investment prospects over the medium-term.
20
Malaysia economy in TRANSITION
Socio-Economic Research Centre
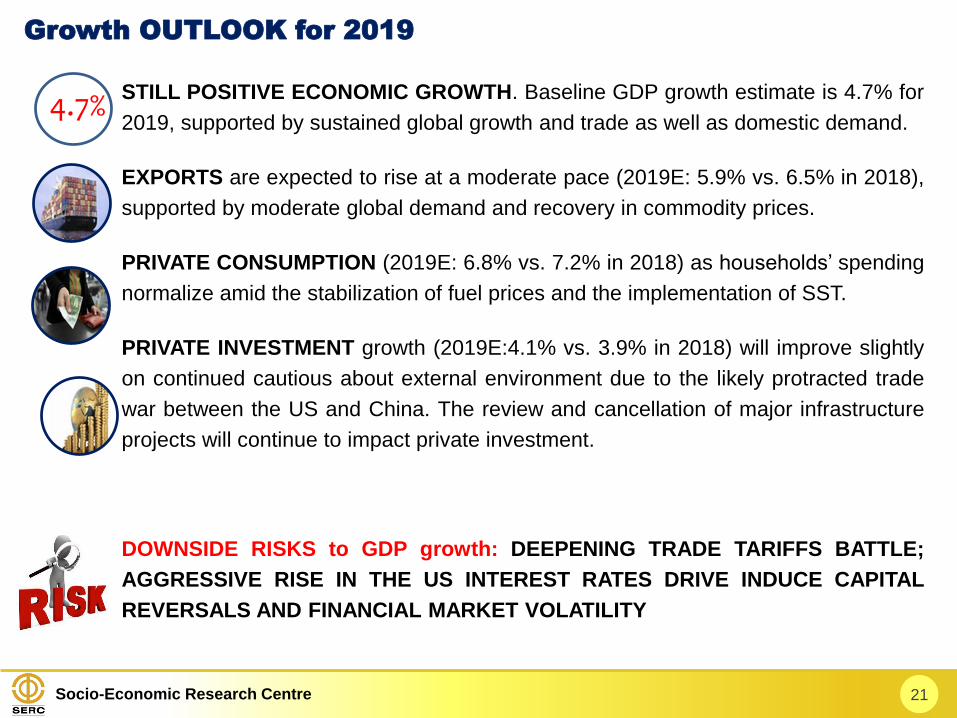
STILL POSITIVE ECONOMIC GROWTH. Baseline GDP growth estimate is 4.7% for
2019, supported by sustained global growth and trade as well as domestic demand.
EXPORTS are expected to rise at a moderate pace (2019E: 5.9% vs. 6.5% in 2018),
supported by moderate global demand and recovery in commodity prices.
PRIVATE CONSUMPTION (2019E: 6.8% vs. 7.2% in 2018) as households’ spending
normalize amid the stabilization of fuel prices and the implementation of SST.
PRIVATE INVESTMENT growth (2019E:4.1% vs. 3.9% in 2018) will improve slightly
on continued cautious about external environment due to the likely protracted trade
war between the US and China. The review and cancellation of major infrastructure
projects will continue to impact private investment.
DOWNSIDE RISKS to GDP growth: DEEPENING TRADE TARIFFS BATTLE;
AGGRESSIVE RISE IN THE US INTEREST RATES DRIVE INDUCE CAPITAL
REVERSALS AND FINANCIAL MARKET VOLATILITY
21
Growth OUTLOOK for 2019
4.7%
Socio-Economic Research Centre 22
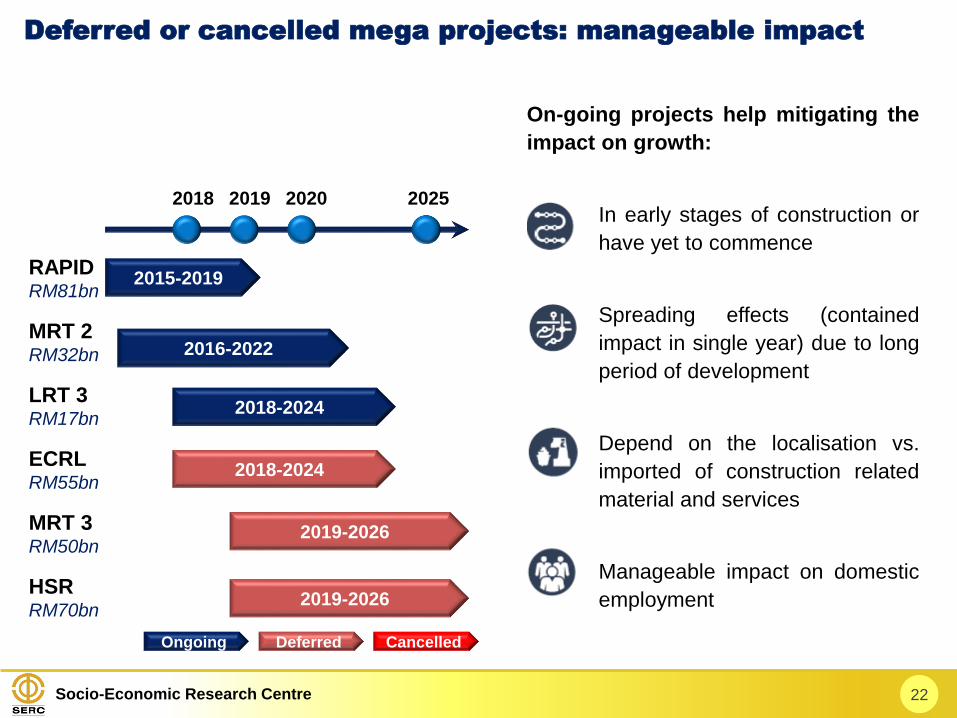
Deferred or cancelled mega projects: manageable impact
On-going projects help mitigating the
impact on growth:
In early stages of construction or
have yet to commence
Spreading effects (contained
impact in single year) due to long
period of development
Depend on the localisation vs.
imported of construction related
material and services
Manageable impact on domestic
employment
RAPIDRM81bn
MRT 2RM32bn
LRT 3RM17bn
ECRLRM55bn
MRT 3RM50bn
HSRRM70bn
2018 2019 2020 2025
2015-2019
2016-2022
2018-2024
2018-2024
2019-2026
2019-2026
Ongoing Deferred Cancelled
Socio-Economic Research Centre
3.0583
3.2815(-6.8%)
3.4950(-6.1%)
4.2920(-18.6%) 4.4860
(-4.3%)
4.0620(+10.4%)
3.8620(+5.2%)
4.1030(-1.0%)
End-2012
End-2013
End-2014
End-2015
End-2016
End-2017
30 Mar2018
15 Aug2018
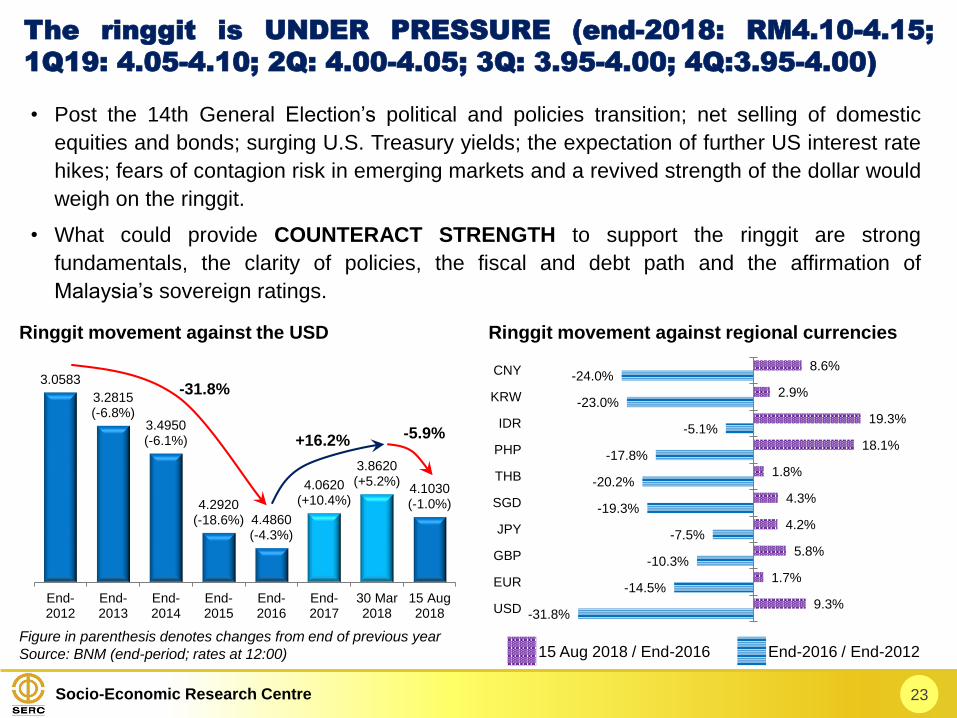
• Post the 14th General Election’s political and policies transition; net selling of domestic
equities and bonds; surging U.S. Treasury yields; the expectation of further US interest rate
hikes; fears of contagion risk in emerging markets and a revived strength of the dollar would
weigh on the ringgit.
• What could provide COUNTERACT STRENGTH to support the ringgit are strong
fundamentals, the clarity of policies, the fiscal and debt path and the affirmation of
Malaysia’s sovereign ratings.
23
The ringgit is UNDER PRESSURE (end-2018: RM4.10-4.15;
1Q19: 4.05-4.10; 2Q: 4.00-4.05; 3Q: 3.95-4.00; 4Q:3.95-4.00)
Ringgit movement against the USD
Figure in parenthesis denotes changes from end of previous year
Source: BNM (end-period; rates at 12:00)
-31.8%
+16.2% -5.9%
Ringgit movement against regional currencies
-31.8%
-14.5%
-10.3%
-7.5%
-19.3%
-20.2%
-17.8%
-5.1%
-23.0%
-24.0%
9.3%
1.7%
5.8%
4.2%
4.3%
1.8%
18.1%
19.3%
2.9%
8.6%
USD
EUR
GBP
JPY
SGD
THB
PHP
IDR
KRW
CNY
15 Aug 2018 / End-2016 End-2016 / End-2012
Socio-Economic Research Centre
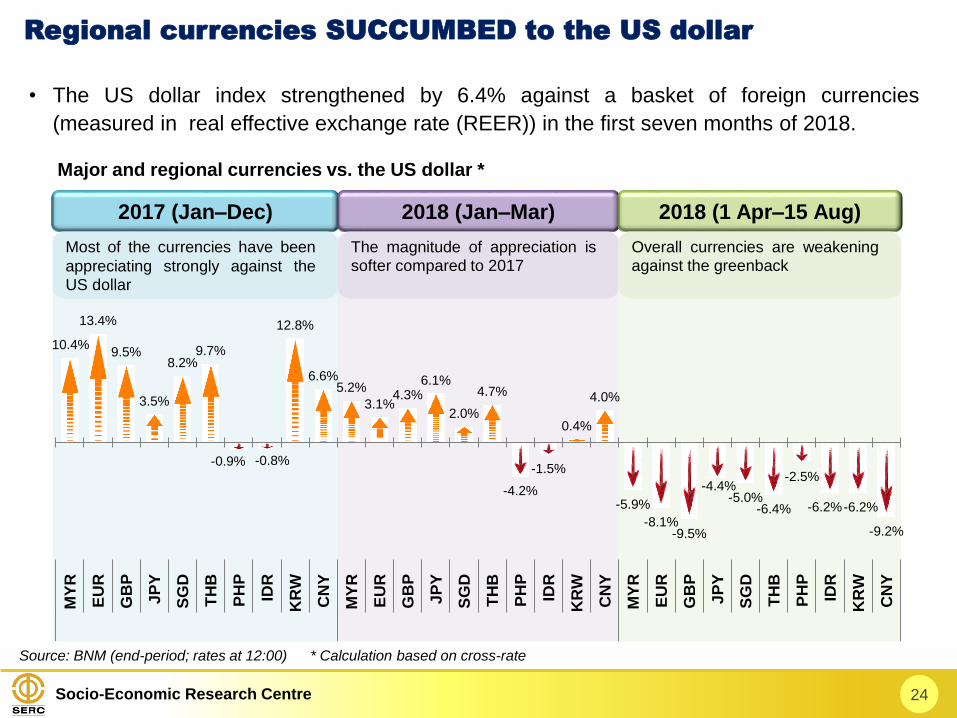
• The US dollar index strengthened by 6.4% against a basket of foreign currencies
(measured in real effective exchange rate (REER)) in the first seven months of 2018.
24
Regional currencies SUCCUMBED to the US dollar
Major and regional currencies vs. the US dollar *
2017 (Jan–Dec) 2018 (Jan–Mar) 2018 (1 Apr–15 Aug)
-5.9%
-8.1%-9.5%
-4.4%-5.0%
-6.4%
-2.5%
-6.2% -6.2%
-9.2%
5.2%
3.1%4.3%
6.1%
2.0%
4.7%
-4.2%
-1.5%
0.4%
4.0%
10.4%
13.4%
9.5%
3.5%
8.2%9.7%
-0.9% -0.8%
12.8%
6.6%
MY
R
EU
R
GB
P
JP
Y
SG
D
TH
B
PH
P
IDR
KR
W
CN
Y
MY
R
EU
R
GB
P
JP
Y
SG
D
TH
B
PH
P
IDR
KR
W
CN
Y
MY
R
EU
R
GB
P
JP
Y
SG
D
TH
B
PH
P
IDR
KR
W
CN
Y
Most of the currencies have been
appreciating strongly against theUS dollar
The magnitude of appreciation issofter compared to 2017
Overall currencies are weakeningagainst the greenback
Source: BNM (end-period; rates at 12:00) * Calculation based on cross-rate
Socio-Economic Research Centre
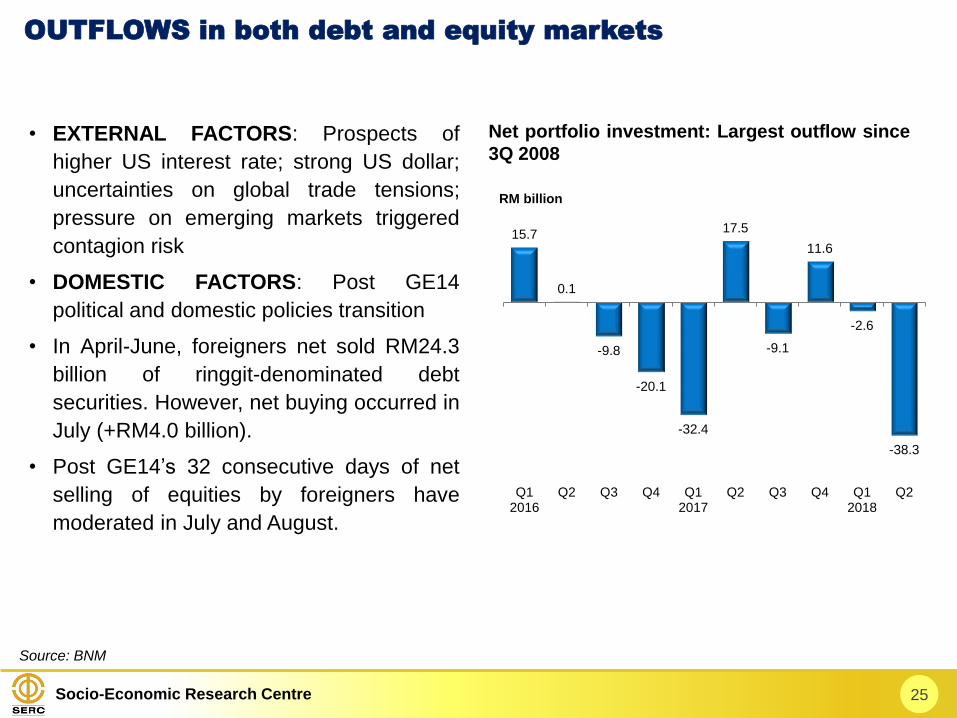
• EXTERNAL FACTORS: Prospects of
higher US interest rate; strong US dollar;
uncertainties on global trade tensions;
pressure on emerging markets triggered
contagion risk
• DOMESTIC FACTORS: Post GE14
political and domestic policies transition
• In April-June, foreigners net sold RM24.3
billion of ringgit-denominated debt
securities. However, net buying occurred in
July (+RM4.0 billion).
• Post GE14’s 32 consecutive days of net
selling of equities by foreigners have
moderated in July and August.
25
OUTFLOWS in both debt and equity markets
Source: BNM
15.7
0.1
-9.8
-20.1
-32.4
17.5
-9.1
11.6
-2.6
-38.3
Q12016
Q2 Q3 Q4 Q12017
Q2 Q3 Q4 Q12018
Q2
RM billion
Net portfolio investment: Largest outflow since
3Q 2008
Socio-Economic Research Centre 26
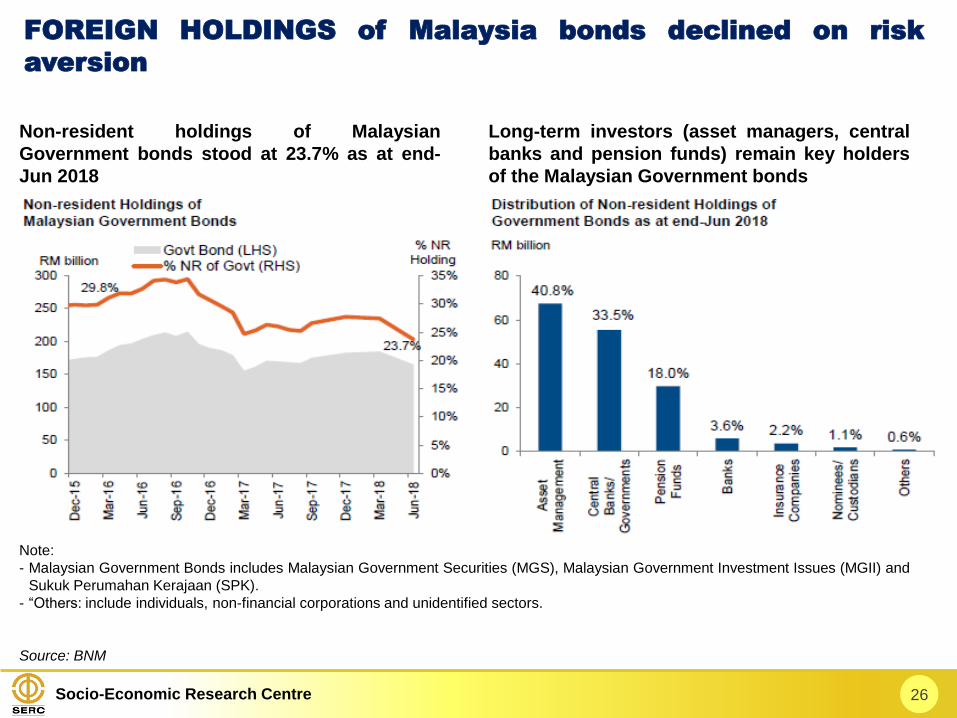
FOREIGN HOLDINGS of Malaysia bonds declined on risk
aversion
Source: BNM
Non-resident holdings of Malaysian
Government bonds stood at 23.7% as at end-
Jun 2018
Long-term investors (asset managers, central
banks and pension funds) remain key holders
of the Malaysian Government bonds
Note:
- Malaysian Government Bonds includes Malaysian Government Securities (MGS), Malaysian Government Investment Issues (MGII) and
Sukuk Perumahan Kerajaan (SPK).
- “Others: include individuals, non-financial corporations and unidentified sectors.
Socio-Economic Research Centre 27
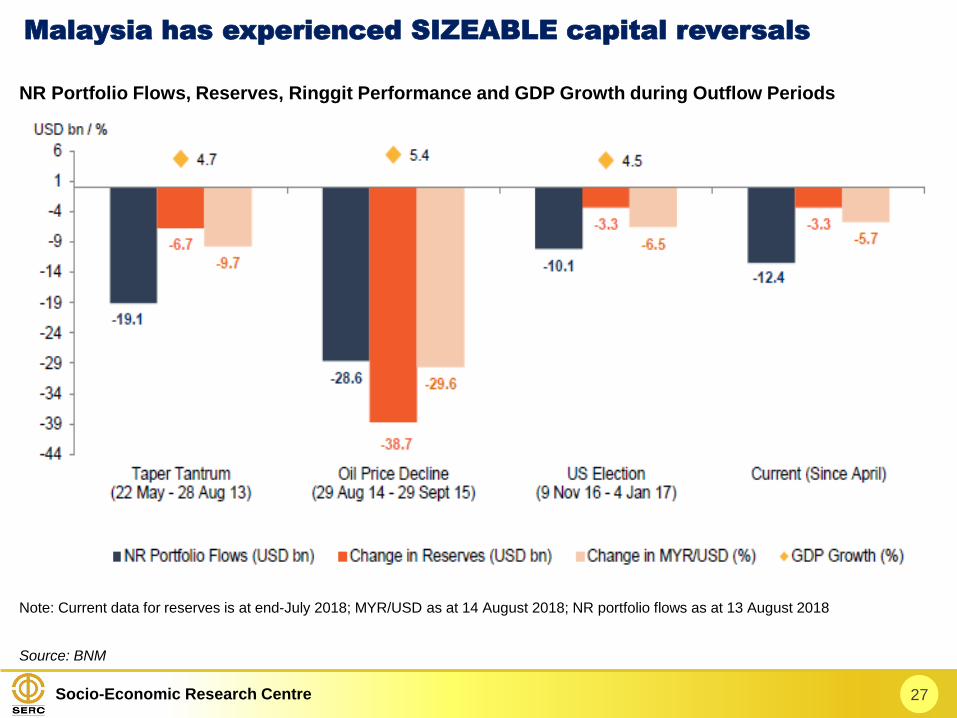
Malaysia has experienced SIZEABLE capital reversals
Source: BNM
Note: Current data for reserves is at end-July 2018; MYR/USD as at 14 August 2018; NR portfolio flows as at 13 August 2018
NR Portfolio Flows, Reserves, Ringgit Performance and GDP Growth during Outflow Periods
Socio-Economic Research Centre 28
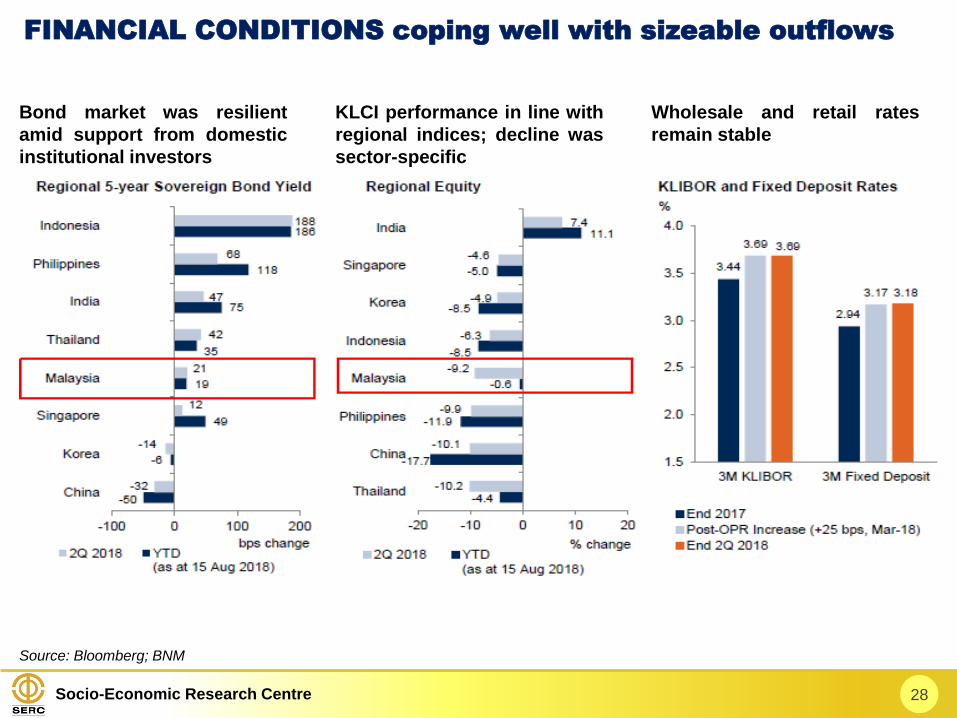
FINANCIAL CONDITIONS coping well with sizeable outflows
Source: Bloomberg; BNM
Bond market was resilient
amid support from domestic
institutional investors
KLCI performance in line with
regional indices; decline was
sector-specific
Wholesale and retail rates
remain stable
Socio-Economic Research Centre 29
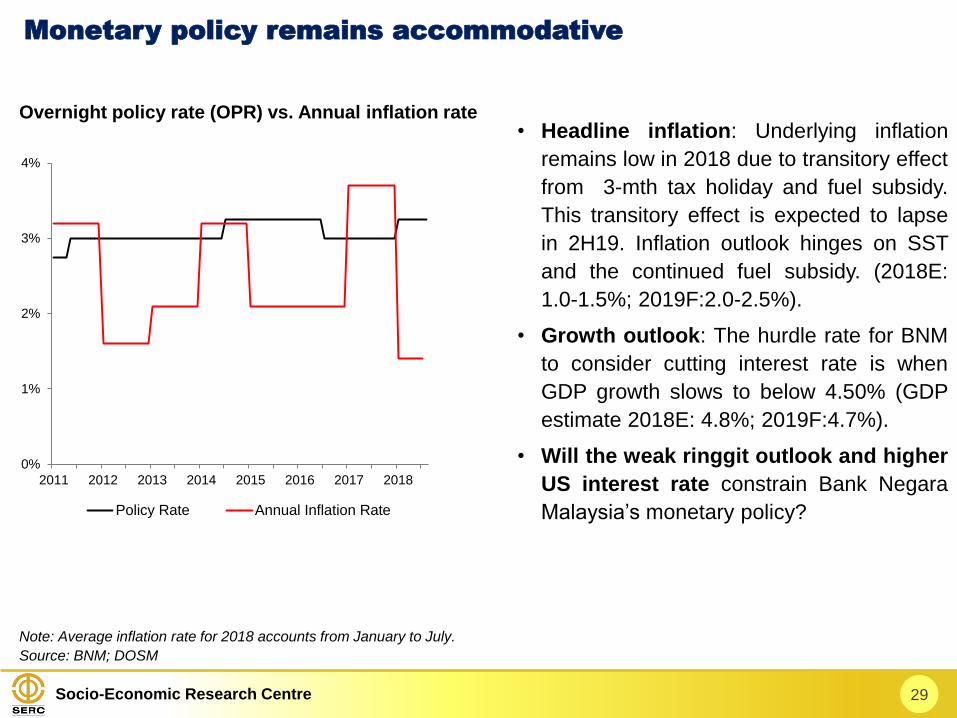
Monetary policy remains accommodative
Source: BNM; DOSM
Overnight policy rate (OPR) vs. Annual inflation rate
0%
1%
2%
3%
4%
2011 2012 2013 2014 2015 2016 2017 2018
Policy Rate Annual Inflation Rate
• Headline inflation: Underlying inflation
remains low in 2018 due to transitory effect
from 3-mth tax holiday and fuel subsidy.
This transitory effect is expected to lapse
in 2H19. Inflation outlook hinges on SST
and the continued fuel subsidy. (2018E:
1.0-1.5%; 2019F:2.0-2.5%).
• Growth outlook: The hurdle rate for BNM
to consider cutting interest rate is when
GDP growth slows to below 4.50% (GDP
estimate 2018E: 4.8%; 2019F:4.7%).
• Will the weak ringgit outlook and higher
US interest rate constrain Bank Negara
Malaysia’s monetary policy?
Note: Average inflation rate for 2018 accounts from January to July.
Socio-Economic Research Centre
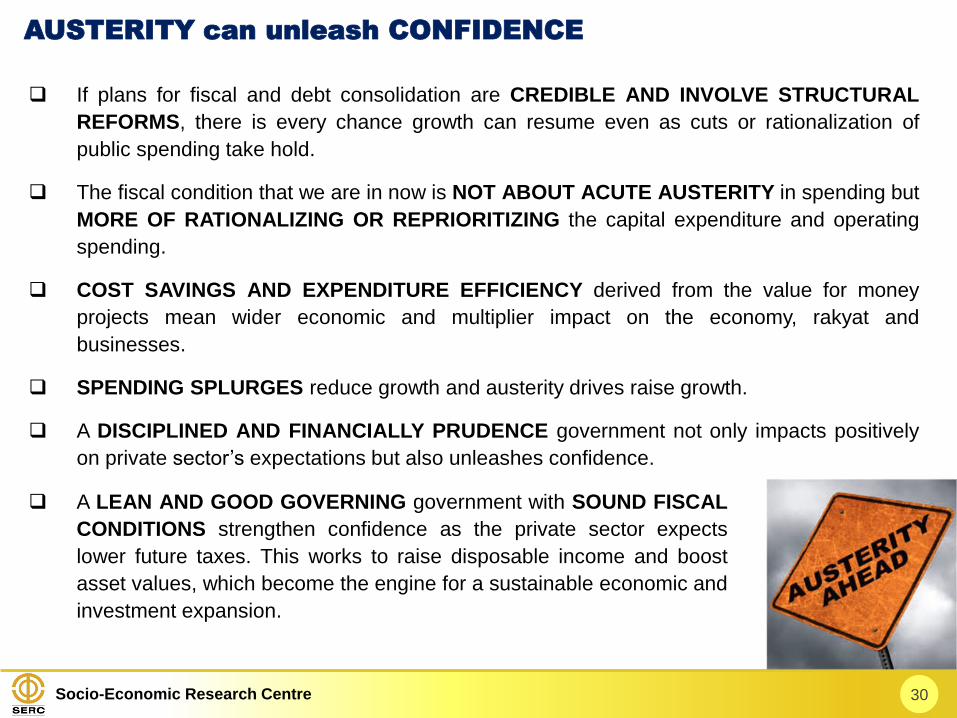
If plans for fiscal and debt consolidation are CREDIBLE AND INVOLVE STRUCTURAL
REFORMS, there is every chance growth can resume even as cuts or rationalization of
public spending take hold.
The fiscal condition that we are in now is NOT ABOUT ACUTE AUSTERITY in spending but
MORE OF RATIONALIZING OR REPRIORITIZING the capital expenditure and operating
spending.
COST SAVINGS AND EXPENDITURE EFFICIENCY derived from the value for money
projects mean wider economic and multiplier impact on the economy, rakyat and
businesses.
SPENDING SPLURGES reduce growth and austerity drives raise growth.
A DISCIPLINED AND FINANCIALLY PRUDENCE government not only impacts positively
on private sector’s expectations but also unleashes confidence.
30
AUSTERITY can unleash CONFIDENCE
A LEAN AND GOOD GOVERNING government with SOUND FISCAL
CONDITIONS strengthen confidence as the private sector expects
lower future taxes. This works to raise disposable income and boost
asset values, which become the engine for a sustainable economic and
investment expansion.

Socio-Economic Research Centre
Malaysians’ desire of having a national development agenda which promises CLEAN, FAIR,
TOLERANCE AND MUTUAL RESPECT SOCIETY, VISIONARY AND DECISIVE
LEADERSHIP, GOOD GOVERNANCE AND WELL-CRAFTED CREDIBLE ECONOMIC
POLICIES AND INCLUSIVE SOCIOECONOMIC DEVELOPMENT PROGRAMS.
Malaysia must reset and build on the people trust with ACCOUNTABILITY,
TRANSPARENCY AND GOOD GOVERNANCE.
SUCCESSFUL ECONOMIC REFORMS must result in strengthening and securing higher
quality economic growth, driving higher investment, and boosting productivity. There must
be a balancing act between unpopular, radical yet sustainable public policies and populist
approaches, weighing on the Government’s budget capacity and fiscal conditions.
What is crucial is that MEANINGFUL ENGAGING THE PUBLIC AND STAKEHOLDERS is
an important part of an effective, open, and transparent government in the formulation of
policy priorities, programs and services for Malaysians.
A five-pronged agenda outlined below suggests an immediate actionable agenda for the
Government to help ACHIEVE GROWTH AND EFFICIENCY as well as INCREASE
NATIONAL INCOME by leveraging the capabilities, innovation, and productivity.
31
Policy advocacy: FIVE-PRONGED policy agenda
Socio-Economic Research Centre
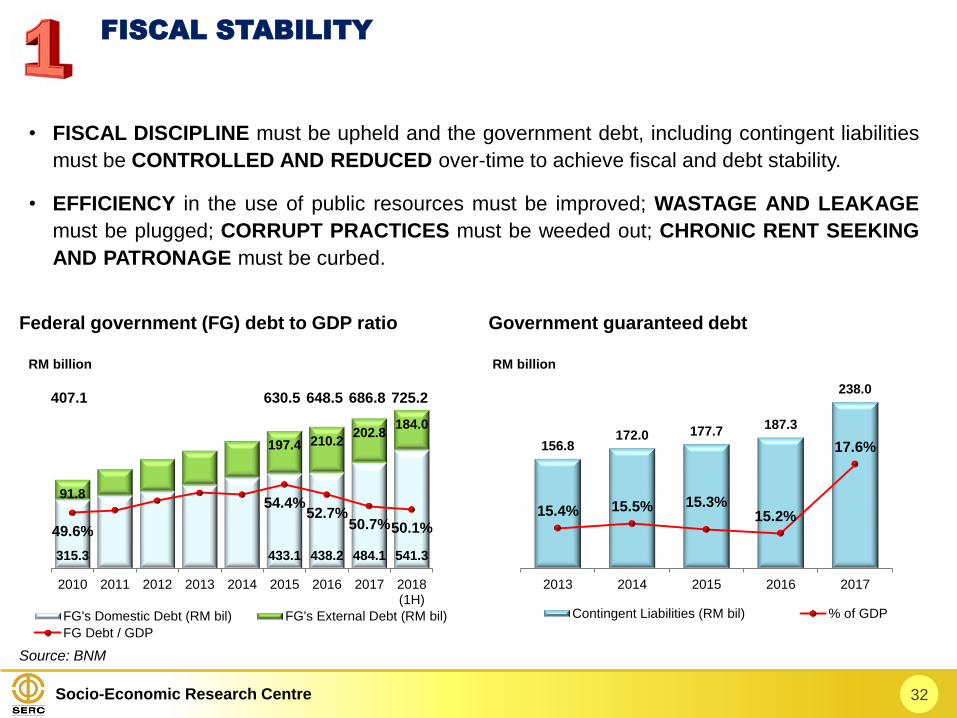
• FISCAL DISCIPLINE must be upheld and the government debt, including contingent liabilities
must be CONTROLLED AND REDUCED over-time to achieve fiscal and debt stability.
• EFFICIENCY in the use of public resources must be improved; WASTAGE AND LEAKAGE
must be plugged; CORRUPT PRACTICES must be weeded out; CHRONIC RENT SEEKING
AND PATRONAGE must be curbed.
32
315.3 433.1 438.2 484.1 541.3
91.8
197.4 210.2202.8
184.0
49.6%
54.4%52.7%
50.7%50.1%
2010 2011 2012 2013 2014 2015 2016 2017 2018(1H)
RM billion
FG's Domestic Debt (RM bil) FG's External Debt (RM bil)
FG Debt / GDP
Source: BNM
Federal government (FG) debt to GDP ratio Government guaranteed debt
156.8172.0 177.7
187.3
238.0
15.4% 15.5% 15.3%15.2%
17.6%
14.0%
15.0%
16.0%
17.0%
18.0%
19.0%
20.0%
0
50
100
150
200
250
2013 2014 2015 2016 2017
RM billion
Contingent Liabilities (RM bil) % of GDP
407.1 630.5 648.5 686.8 725.2
FISCAL STABILITY
Socio-Economic Research Centre
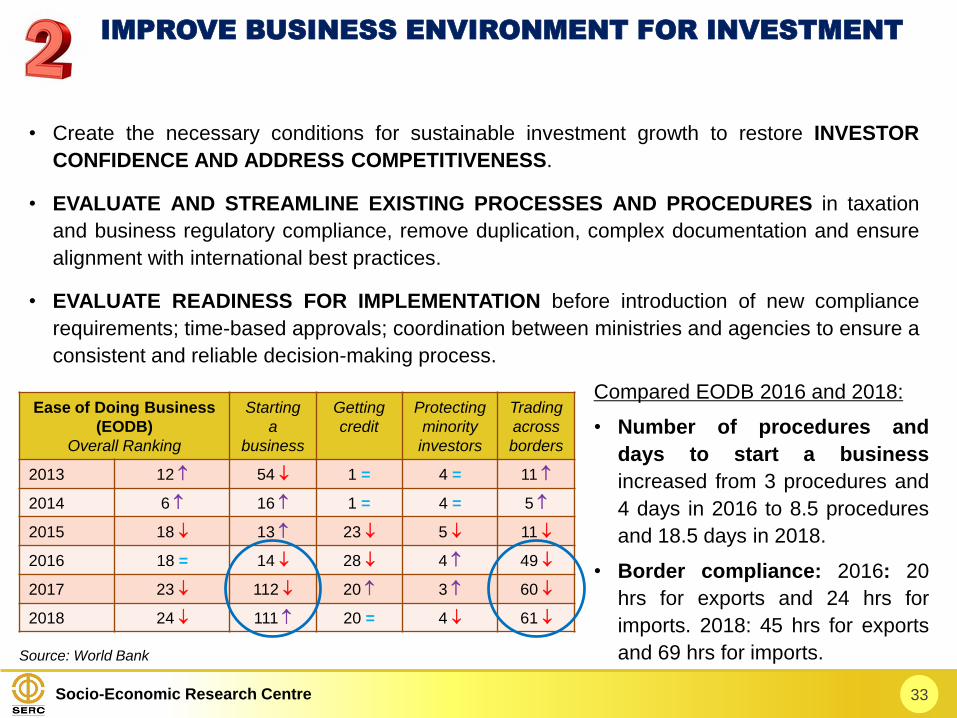
• Create the necessary conditions for sustainable investment growth to restore INVESTOR
CONFIDENCE AND ADDRESS COMPETITIVENESS.
• EVALUATE AND STREAMLINE EXISTING PROCESSES AND PROCEDURES in taxation
and business regulatory compliance, remove duplication, complex documentation and ensure
alignment with international best practices.
• EVALUATE READINESS FOR IMPLEMENTATION before introduction of new compliance
requirements; time-based approvals; coordination between ministries and agencies to ensure a
consistent and reliable decision-making process.
33
Source: World Bank
Ease of Doing Business
(EODB)
Overall Ranking
Starting
a
business
Getting
credit
Protecting
minority
investors
Trading
across
borders
2013 12 54 1 = 4 = 11
2014 6 16 1 = 4 = 5
2015 18 13 23 5 11
2016 18 = 14 28 4 49
2017 23 112 20 3 60
2018 24 111 20 = 4 61
Compared EODB 2016 and 2018:
• Number of procedures and
days to start a business
increased from 3 procedures and
4 days in 2016 to 8.5 procedures
and 18.5 days in 2018.
• Border compliance: 2016: 20
hrs for exports and 24 hrs for
imports. 2018: 45 hrs for exports
and 69 hrs for imports.
IMPROVE BUSINESS ENVIRONMENT FOR INVESTMENT
Socio-Economic Research Centre
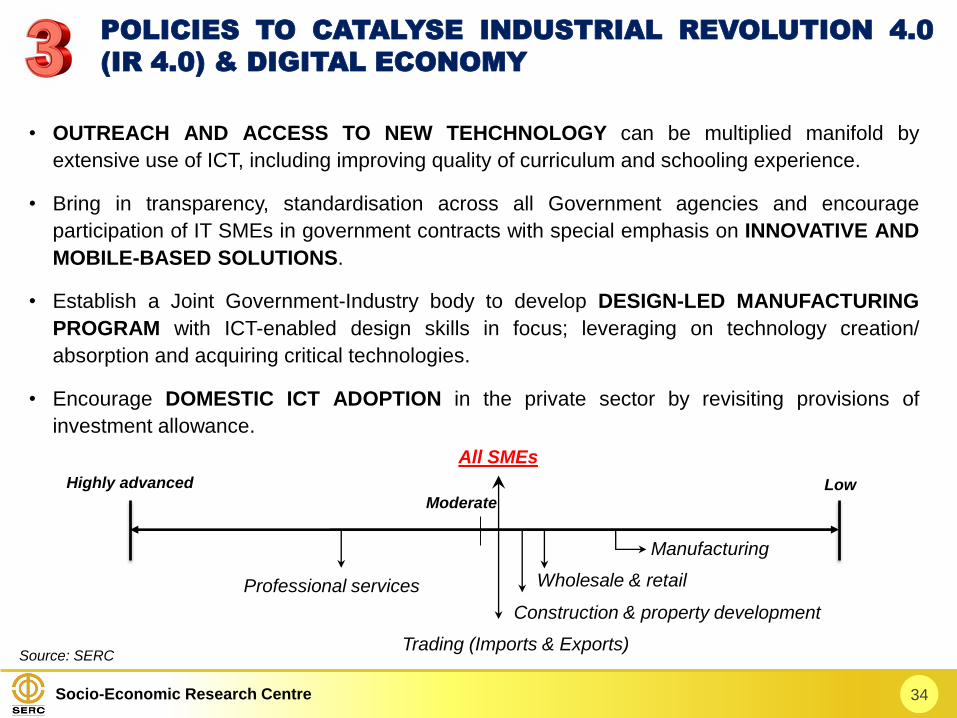
• OUTREACH AND ACCESS TO NEW TEHCHNOLOGY can be multiplied manifold by
extensive use of ICT, including improving quality of curriculum and schooling experience.
• Bring in transparency, standardisation across all Government agencies and encourage
participation of IT SMEs in government contracts with special emphasis on INNOVATIVE AND
MOBILE-BASED SOLUTIONS.
• Establish a Joint Government-Industry body to develop DESIGN-LED MANUFACTURING
PROGRAM with ICT-enabled design skills in focus; leveraging on technology creation/
absorption and acquiring critical technologies.
• Encourage DOMESTIC ICT ADOPTION in the private sector by revisiting provisions of
investment allowance.
34
Wholesale & retail
LowModerate
Highly advanced
All SMEs
Construction & property development
Professional services
Trading (Imports & Exports)
Manufacturing
Source: SERC
POLICIES TO CATALYSE INDUSTRIAL REVOLUTION 4.0
(IR 4.0) & DIGITAL ECONOMY
Socio-Economic Research Centre
• Business transaction costs and cost of doing business (direct and indirect) must be kept
REASONABLE AND COMPETITIVE as well as at ease through removing the constraints in
hard and soft infrastructure, including the binding regulatory and layering as well as
unnecessary compliance costs.
• A critical anchor of successful industrial development policy is to focus on growing the
industries and sectors that conform to our LATENT COMPARATIVE ADVANTAGES to
counteract dynamic competitive and comparative advantages of our competitors.
• The IDENTIFIED SECTORS include the downstream resource-based MANUFACTURING
ACTIVITIES, SERVICE SECTOR, E-COMMERCE, DIGITALIZED BUSINESS AND THE
ENVIRONMENTAL SECTOR. New service industries that have emerged and are growing
rapidly are in the areas of Fintech-finance, ICT, logistics, e-commerce, sharing economy,
healthcare, higher education, tourism, hospitality and the Halal market not just in food, but in
pharmaceuticals, cosmetics, and many more.
• EXPORTS CAPACITY in terms of products’ differentiation and markets diversification should
be further enhanced.
35
PROMOTE GROWTH AND GLOBAL COMPETITIVENESS
Socio-Economic Research Centre
• Move away from a centrally-driven system to one of EMPLOYER OWNERSHIP OF SKILLS,
with greater employer and employee input into the design and delivery of the manpower
system. Skills development is the SHARED RESPONSIBILITY of government, employers and
workers.
• Creating a local market for skills where providers are INCENTIVISED to meet employer and
learner demand.
• LINKING SKILLS with employment opportunities and DECENT COMPENSATION is critical,
and skills need to be an integral part of economic growth and employment strategies as well as
productivity enhancement.
• EQUAL OPPORTUNITIES for education and training.
• REVAMPING of Technical and Vocational Education and Training (TVET) to improve the
calibre of workforce; develop skill standards and curriculum. Three skills that are relevant in IR
4.0: learning skills (self directed learning, cross discipline, digital skills); thinking skills (creative,
resilience, inquisitive, problem solving); and soft skills (ethics, communication).
36
SKILLS DEVELOPMENT AND EMPLOYMENT CREATION
Socio-Economic Research Centre
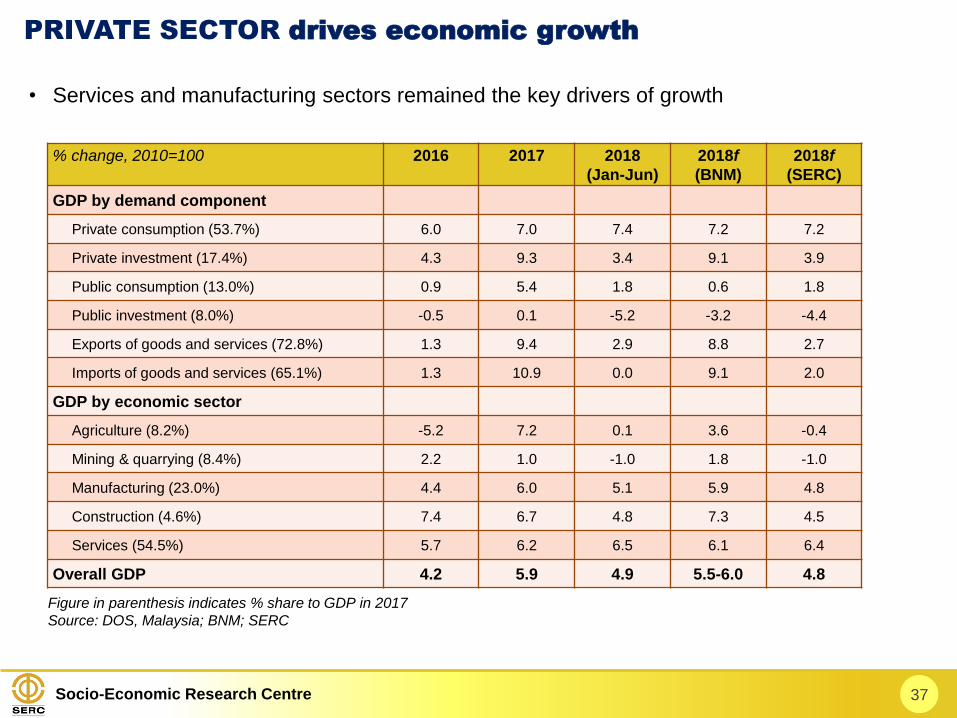
• Services and manufacturing sectors remained the key drivers of growth
37
PRIVATE SECTOR drives economic growth
% change, 2010=100 2016 2017 2018
(Jan-Jun)
2018f
(BNM)
2018f
(SERC)
GDP by demand component
Private consumption (53.7%) 6.0 7.0 7.4 7.2 7.2
Private investment (17.4%) 4.3 9.3 3.4 9.1 3.9
Public consumption (13.0%) 0.9 5.4 1.8 0.6 1.8
Public investment (8.0%) -0.5 0.1 -5.2 -3.2 -4.4
Exports of goods and services (72.8%) 1.3 9.4 2.9 8.8 2.7
Imports of goods and services (65.1%) 1.3 10.9 0.0 9.1 2.0
GDP by economic sector
Agriculture (8.2%) -5.2 7.2 0.1 3.6 -0.4
Mining & quarrying (8.4%) 2.2 1.0 -1.0 1.8 -1.0
Manufacturing (23.0%) 4.4 6.0 5.1 5.9 4.8
Construction (4.6%) 7.4 6.7 4.8 7.3 4.5
Services (54.5%) 5.7 6.2 6.5 6.1 6.4
Overall GDP 4.2 5.9 4.9 5.5-6.0 4.8
Figure in parenthesis indicates % share to GDP in 2017
Source: DOS, Malaysia; BNM; SERC
社会经济研究中心
SOCIO-ECONOMIC
RESEARCH CENTRE
谢 谢THANK YOU
Address : 6th Floor, Wisma Chinese Chamber,258, Jalan Ampang, 50450 Kuala Lumpur, Malaysia.
Tel : 603 - 4260 3116 / 3119
Fax : 603 - 4260 3118
Email : [email protected]
Website : http://www.acccimserc.com


![Apresenta ao Conjuntura julho [Modo de Compatibilidade] · 2014-01-16 · (**) Deflator IPA setorial (***) Deflator IPC - Fipe c/ajuste Jul/13 Jul/13 Jan-Dez/12 Jan-Jul/13 Jun/13](https://img.pdfslide.tips/doc/110x75/5f3292e3dce065680b3963b9/apresenta-ao-conjuntura-julho-modo-de-compatibilidade-2014-01-16-deflator.jpg)