Embed Size (px)
Citation preview

1
CCUS and Hydrogen in Rich Renewable Energy Systems
脱炭素社会のCCUSと水素
Haruki Tsuchiya
槌屋治紀
Research Institute for
Systems Technology
システム技術研究所
International Symposium on
CCUS and Hydrogen
at Bellesalle Kanda, Tokyo,
19, February 2020
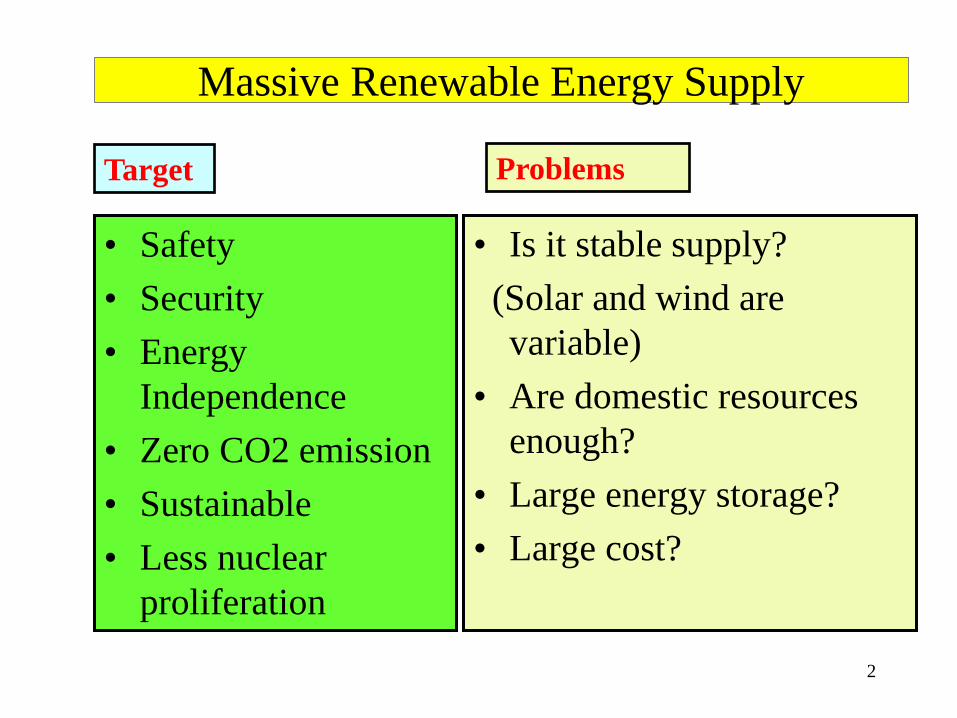
Massive Renewable Energy Supply
• Safety
• Security
• Energy
Independence
• Zero CO2 emission
• Sustainable
• Less nuclear
proliferation
2
• Is it stable supply?
(Solar and wind are
variable)
• Are domestic resources
enough?
• Large energy storage?
• Large cost?
Target Problems
3
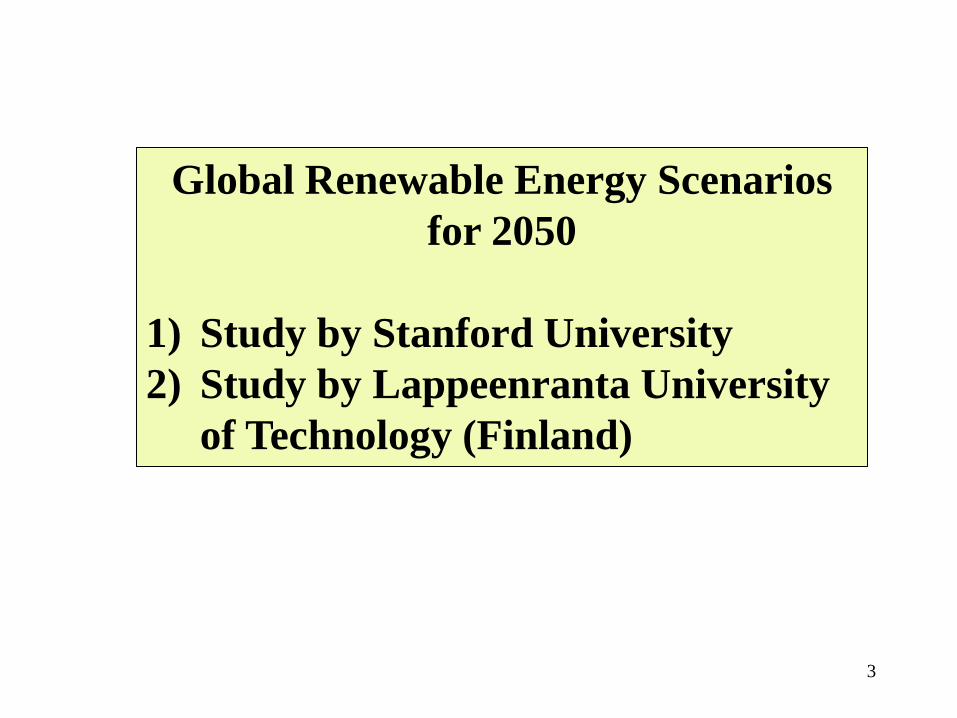
Global Renewable Energy Scenarios
for 2050
1) Study by Stanford University
2) Study by Lappeenranta University
of Technology (Finland)
4
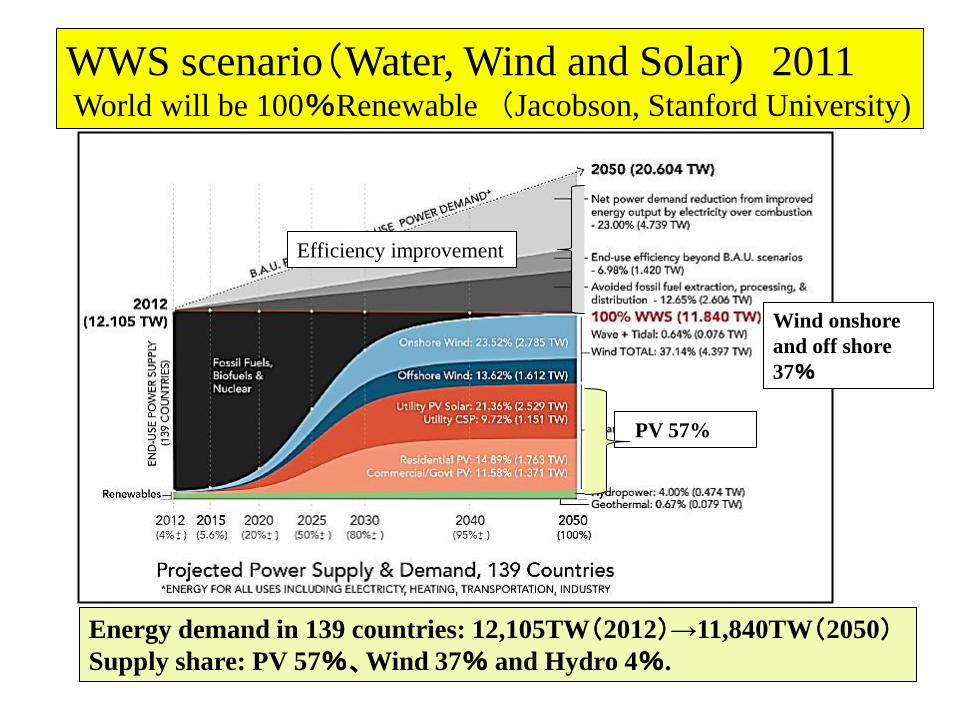
Energy demand in 139 countries: 12,105TW(2012)→11,840TW(2050)
Supply share: PV 57%、Wind 37% and Hydro 4%.
WWS scenario(Water, Wind and Solar) 2011 World will be 100%Renewable (Jacobson, Stanford University)
PV 57%
Wind onshore
and off shore
37%
Efficiency improvement

Global energy scenario with 100% renewables
by Jacobson (Stanford University)
WWS systems (Water, Wind, Solar)2011
Global energy demand will
be supplied by 51 TW
electricity plant.
It requires only 1.16% of
global land area.
Necessary material: cement
and steel are enough.
Rare metals for EV and
wind machines: enough
Platinum for FCV: recycled.
70 million cars produced
every year. 50 kW for a car,
it is the production scale of
3.5TW electricity plant
every year.
19.0
14.7
12.0
5.1
0.5 1.2
0.5 0.5
02468
101214161820
Generation capacity (TW) Total capacity is 51TW

6
Lappeenranta University of Technology: Global Energy Systems
Capacity (left) and Generation(right) in Northeast Asia in 2050
World is in 9 areas with 146 sub
areas. They are supplied by fully
renewable energy in 2050. Japan
is shown as one of the northeast
Asia country. Published in 2019.
Capacity GW Generation TWh
East Japan 693 1094
West Japan 745 1264
Total 1438 2358
Generation (TWh) Capacity (GW)

7
Long-term Scenarios for
Decarbonizing Japan
by WWF Japan

8
Long-term Scenarios 2050 for WWF Japan
Activity Level Decrease
Energy Efficiency Improvement
Two scenarios,
1) ‘Bridge Scenario’
(GHG 80% decrease)
2) ‘100% Renewable’
Decrease Energy
demand
Decrease CO2
Emission
in 2050
We studied two scenarios, ‘Bridge scenario’ and
‘100% Renewable Energy Scenario’. If we can
decrease energy demand, the problems for renewable
energy supply become smaller, and we can decrease
CO2 emission smoothly.

×
Future
energy
demand = ×
Estimate of future energy demand
Future energy demand is estimated by demand in base
year, future activity level and efficiency improvement.
Activity level: population decrease is very large.
Efficiency improvement: new technology widespread
Energy
demand
in base
year
Activity
level
Population,
GDP, macro
economics
index etc.
Efficiency
improvem
ent
EV, FCV,
LED light,
Heat pump

10
Population will decrease toward 2050
The population will decrease by 20% from 127
million in 2015 to 102 million in 2050.
The 2017 Report of National Institute of
Population and Social Security Research.
11
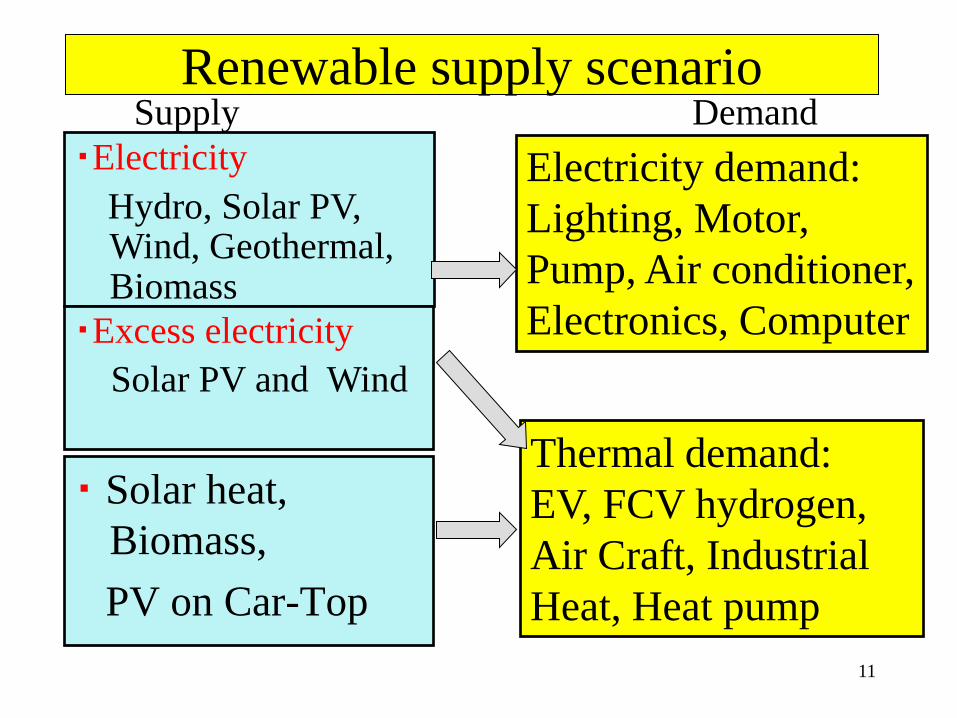
Renewable supply scenario
・ Solar heat,
Biomass,
PV on Car-Top
・Electricity
Hydro, Solar PV, Wind, Geothermal, Biomass
Electricity demand:
Lighting, Motor,
Pump, Air conditioner,
Electronics, Computer
Thermal demand:
EV, FCV hydrogen,
Air Craft, Industrial
Heat, Heat pump
・Excess electricity
Solar PV and Wind
Supply Demand
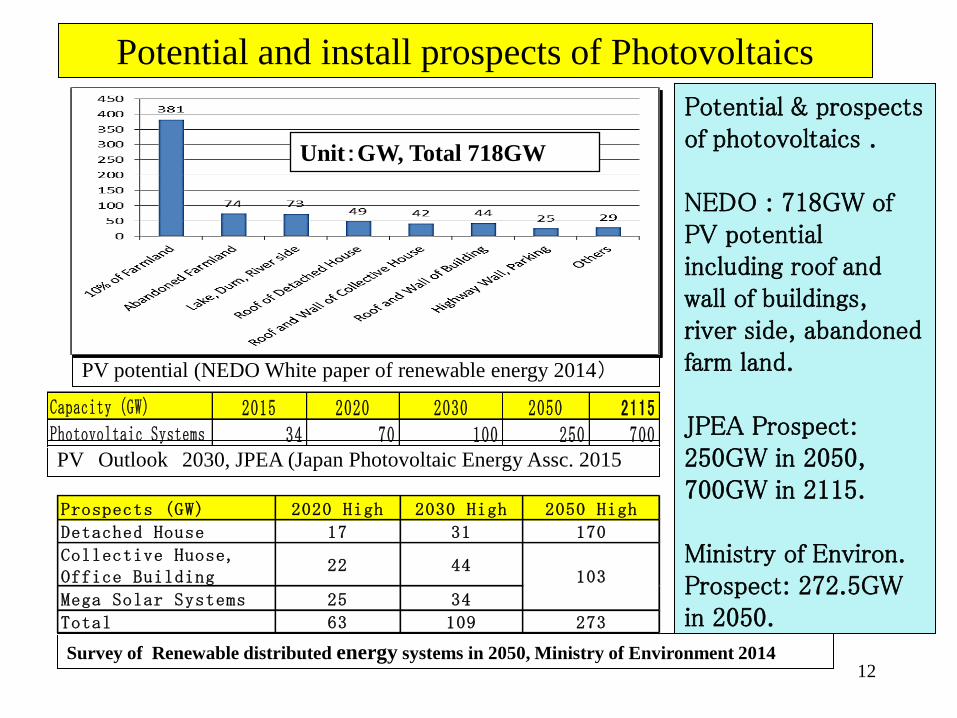
Potential and install prospects of Photovoltaics
12 Survey of Renewable distributed energy systems in 2050, Ministry of Environment 2014
PV potential (NEDO White paper of renewable energy 2014)
PV Outlook 2030, JPEA (Japan Photovoltaic Energy Assc. 2015
Potential & prospects of photovoltaics . NEDO : 718GW of PV potential including roof and wall of buildings, river side, abandoned farm land. JPEA Prospect: 250GW in 2050, 700GW in 2115. Ministry of Environ. Prospect: 272.5GW in 2050.
Capacity(GW) 2015 2020 2030 2050 2115Photovoltaic Systems 34 70 100 250 700
Prospects (GW) 2020 High 2030 High 2050 High
Detached House 17 31 170
Collective Huose,Office Building
22 44
Mega Solar Systems 25 34
Total 63 109 273
103
Unit:GW, Total 718GW
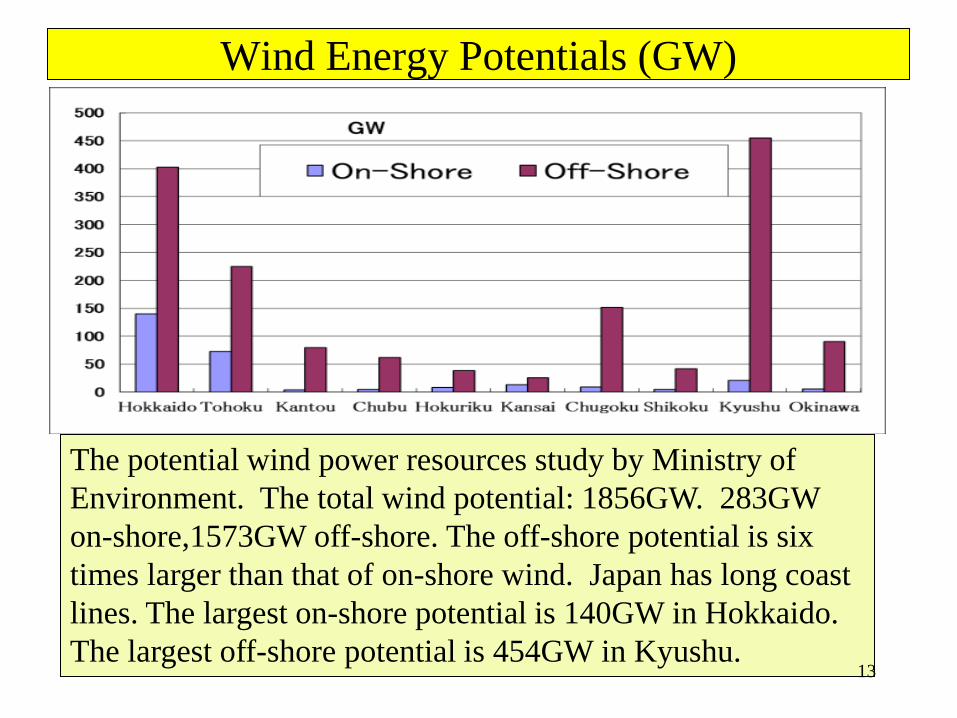
Wind Energy Potentials (GW)
The potential wind power resources study by Ministry of
Environment. The total wind potential: 1856GW. 283GW
on-shore,1573GW off-shore. The off-shore potential is six
times larger than that of on-shore wind. Japan has long coast
lines. The largest on-shore potential is 140GW in Hokkaido.
The largest off-shore potential is 454GW in Kyushu. 13

Renewable Energy in Japan
14
Maximum potentials: Survey 2014 on Distributed Renewable
Energy for 2050 (Ministry of Environment)
PV potential (Photovoltaic Roadmap: PV2030+, NEDO, 2014)
*) shows prospect for 2030. Biomass peaked 270PJ in 1940.
Energy Source 2015Max
PotentialProspectfor 2050
BridgeScenario
100% REScenario
Hydro power 21 GW 46 GW 46 GW 46 GW 46 GWPhotovoltaic 33 GW 718 GW 279 GW 241 GW 445 GWWind Power 3 GW 1698 GW 75 GW 78 GW 104 GWGeothermal 0.54 GW 31GW 8 GW 10 GW 10 GWWave power 0 18 GW 14GW 10 GW 10 GWBiomass 66PJ - 973PJ(*) 1640PJ 2200PJ

Photovoltaics and Wind in WWF study
Renewable
Energy
Number of Sites
Capacity factor(CF)
Installation
Photovoltaics
842 sites
CF=12.6%
Unit 10kW, South
oriented, Tilt angle
=latitude-5 degree
Wind Turbine 99 sites with
CF>18% among
842 sites, Average
CF=27.6%
2MW, Diameter =80m,
Hub hight=56m,
Cut-in speed=3m/s,
Cut-out speed=25m/s
Weather data of Expanded AMEDAS 2000 has solar
radiation and wind speed of 842 sites in Japan.
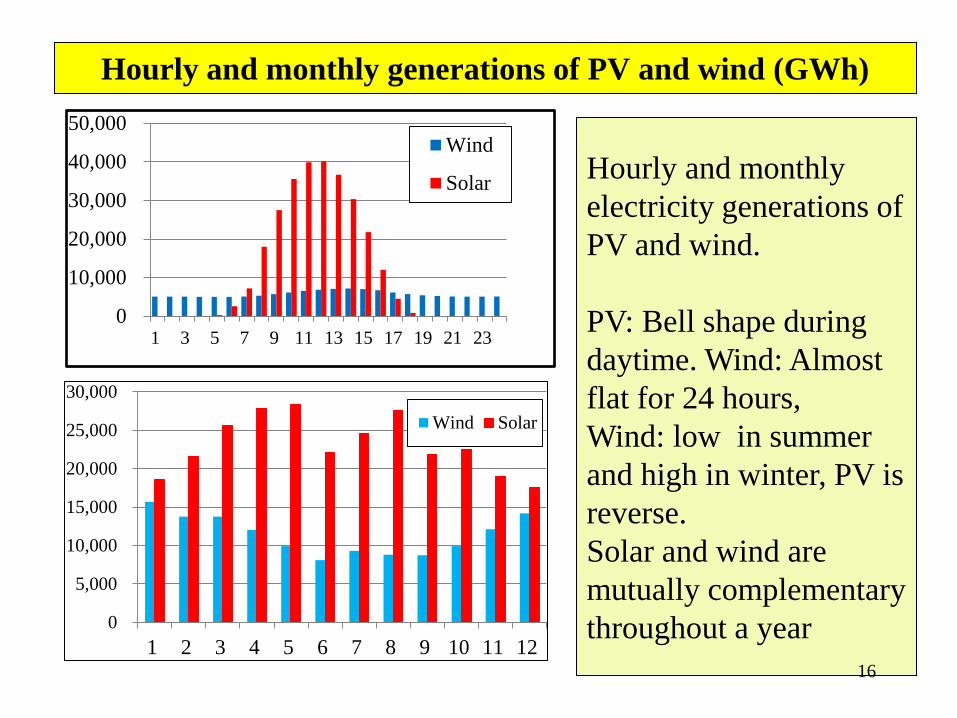
Hourly and monthly generations of PV and wind (GWh)
Hourly and monthly
electricity generations of
PV and wind.
PV: Bell shape during
daytime. Wind: Almost
flat for 24 hours,
Wind: low in summer
and high in winter, PV is
reverse.
Solar and wind are
mutually complementary
throughout a year
0
10,000
20,000
30,000
40,000
50,000
1 3 5 7 9 11 13 15 17 19 21 23
Wind
Solar
16
0
5,000
10,000
15,000
20,000
25,000
30,000
1 2 3 4 5 6 7 8 9 10 11 12
Wind Solar

17
Dynamic Simulation of Electricity Supply in 2050 (Based on 842 sites of AMEDAS weather data 2000)
Waste Waste
To Battery or
Pumped Hydro
Hydrogen production
Electricity
demand
Dynamic simulation of hourly renewable electricity for three days. Variable
nature of photovoltaics and wind power is compensated by pumped hydro and
battery systems. Hydro power is used in the evening. Geothermal power keeps
constant supply. The excess electricity is used for EV, hydrogen production for
FCV and heat pump for low temperature demand.
Geothermal Hydro Biomass Wind PV Discharge Pumped Hydro

End use energy demand in scenarios
18
End use energy demand in 2050 is 61% (Bridge Scenario) and 53%
(100% Renewable energy Scenario) compared to 2010 level.
Unit:PJ 2010 2020 2030 2040 2050 2050/2010
BAU Scenario 14,698 15,215 14,892 14,084 13,272 90.3
Activity Change 14,698 14,660 14,008 13,312 11,884 80.9
Bridge Scenario 14,698 13,749 12,272 10,856 8,950 60.9
100% Renewable 14,698 13,396 11,604 9,917 7,821 53.2

Primary energy supply structure in ‘100% Renewable Scenario’
19
Fossil fuel supply
in 2050 will be
zero in ‘100%
renewable
scenario’.
PJ 2010 2020 2030 2040 2050Coal 4,981 4,076 2,814 1,443 0Oil 8,819 7,474 5,009 2,657 0Gas 4,243 3,682 2,380 1,278 0Hydro 747 810 873 949 1,215Nuclear 2,322 801 207 0 0Geothermal 28 33 66 331 552Biomass 153 938 1,500 1,778 2,200Photovoltaics 20 794 2,890 3,900 4,316Wind 29 397 1,260 1,946 2,286Wave power 0 0 2 118 237Solar Heat 0 20 120 444 600
Total 22,157 19,025 17,122 14,844 11,406
100% Renewable Scenario
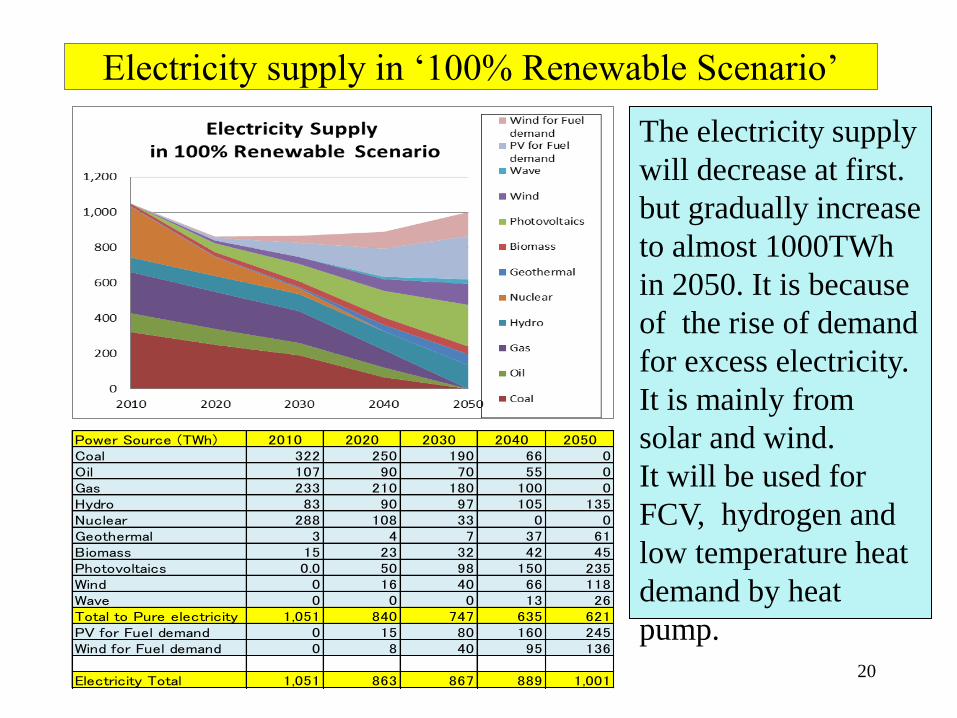
Electricity supply in ‘100% Renewable Scenario’
20
The electricity supply
will decrease at first.
but gradually increase
to almost 1000TWh
in 2050. It is because
of the rise of demand
for excess electricity.
It is mainly from
solar and wind.
It will be used for
FCV, hydrogen and
low temperature heat
demand by heat
pump.
Power Source (TWh) 2010 2020 2030 2040 2050Coal 322 250 190 66 0Oil 107 90 70 55 0Gas 233 210 180 100 0Hydro 83 90 97 105 135Nuclear 288 108 33 0 0Geothermal 3 4 7 37 61Biomass 15 23 32 42 45Photovoltaics 0.0 50 98 150 235Wind 0 16 40 66 118Wave 0 0 0 13 26Total to Pure electricity 1,051 840 747 635 621PV for Fuel demand 0 15 80 160 245Wind for Fuel demand 0 8 40 95 136
Electricity Total 1,051 863 867 889 1,001

Electricity supply in ‘100% renewable scenario in 2050’
21
Solar PV is 445GW ,
Wind power is 104GW in
2050. The electricity
demand is 620 TWh.
Excess Electricity is 59%
of electricity demand.
Shares in national land:
1.18% for PV and 1.38%
for wind.
Present shares:forest
66%, agriculture 13%,
residential 5%, road 3%.
Capacity Generation ShareSupply Source GW GWh/year %
Photovoltaic system 444.7 486,696 78.51Wind power 104 242,027 39.04Hydro power 46 135,241 21.81Geothermal 10 60,997 9.84Wave Power 10 25,999 4.19Gas power 0 0 0Biomass power 10 49,056 7.91
Total 1,000,016 161.30
GWUnit area(W/m2)
Area(km2)
Share innationalland (%)
PV 445 100W/m2 4450 1.18
Wind 104 20MW/100ha (*) 5200 1.38
(*) Eurus Energy in Hokkaido

GHG emission in ‘100% renewable energy scenario’
22
CO2 emission in 2050
will be zero,
but CO2 equivalent
emission from ‘the
other gas’ will remain,
as 64 million ton in
2050., which is 5% of
1990 CO2 emission
level
GHG (Million ton CO2) 2010 2020 2030 2040 2050100% Renewable 1304 1098 759 428 64
402 329 227 117 0544 461 309 164 0193 167 108 58 0166 140 115 89 64
CoalOilGas
Other gases

Hydrogen from Excess
Electricity
23

Electricity for EV and Hydrogen for FCV
24
Fuel
Economy
100Wh/㎞ Fuel Cell
Efficiency
60%
Battery
Efficiency
90%
29TWh
for EV
EV 111Wh/㎞
49TWh
For FCV
FCV 185Wh/km
Electrolyze
85%
We assumed 29.2 million passenger vehicles of EV and FCV
respectively in 2050. Electricity demand is 29TWh for EV and
45TWh for FCV.
H2
Annual Electricity Demand
for 29.2 million passenger
vehicles
‘Nissan Leaf’(EV) runs
at 107Wh/km in 2016
Electricity
PV on car top
20%

Hourly and monthly Excess Electricity
for 8760 hours (GWh)
0
50
100
1501
51
7
103
3
154
9
206
5
258
1
309
7
361
3
412
9
46
45
516
1
567
7
619
3
670
9
722
5
774
1
825
7
Small excess electricity
happens in rainy season
June and July.
Simple solution to this
problem is large energy
storage.
But we have demand
side approach: demand
response and production
scheduling against
weather condition.
25
0
10,000
20,000
30,000
1 2 3 4 5 6 7 8 9 10 11 12
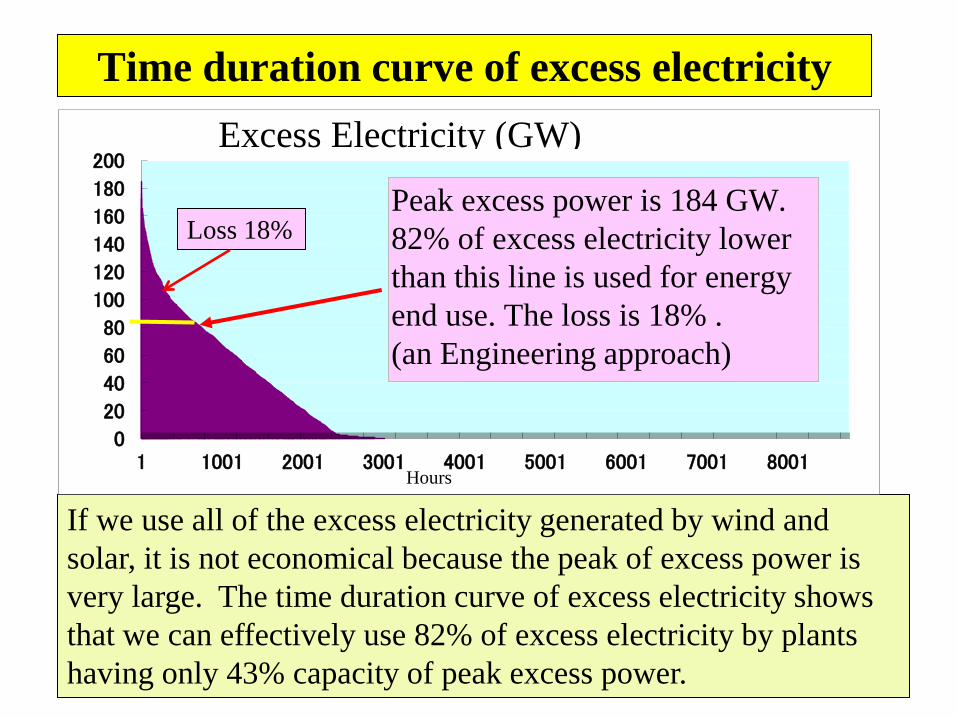
If we use all of the excess electricity generated by wind and
solar, it is not economical because the peak of excess power is
very large. The time duration curve of excess electricity shows
that we can effectively use 82% of excess electricity by plants
having only 43% capacity of peak excess power.
Time duration curve of excess electricity
0
20
40
60
80
100
120
140
160
180
200
1 1001 2001 3001 4001 5001 6001 7001 8001
Excess Electricity (GW)
Hours
Peak excess power is 184 GW.
82% of excess electricity lower
than this line is used for energy
end use. The loss is 18% .
(an Engineering approach)
Loss 18%

Energy for steel production by hydrogen (GJ/crude steel ton)
27
The bottom blast furnace case shows present Japanese case.
Other cases are studies by Wuppertal Institute. Electrolysis uses Alkali
liquid method. Hydrogen process includes energy water electrolysis.
If the electricity is supplied by thermal power plant, the units of alkali and
hydrogen reduction process is 2 or 3 times larger than the values above.
But if electricity comes from renewables without loss, they are efficient.

Future Cost of Renewables
28
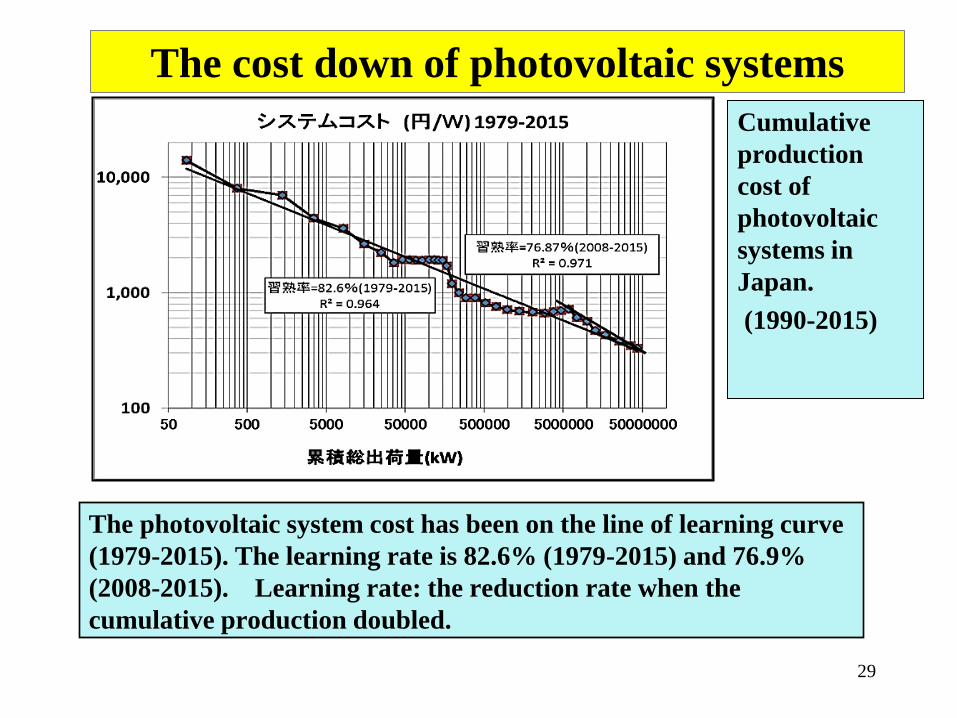
The cost down of photovoltaic systems
The photovoltaic system cost has been on the line of learning curve
(1979-2015). The learning rate is 82.6% (1979-2015) and 76.9%
(2008-2015). Learning rate: the reduction rate when the
cumulative production doubled.
29
Cumulative
production
cost of
photovoltaic
systems in
Japan.
(1990-2015)

Global average install cost of renewables, 2010-2017
30 Renewable power generation costs in 2017, IRENA
Onshore wind
Concentrating solar
PV Offshore wind
PV: Decreasing rapidly
Onshore wind:Decreasing slowly
31
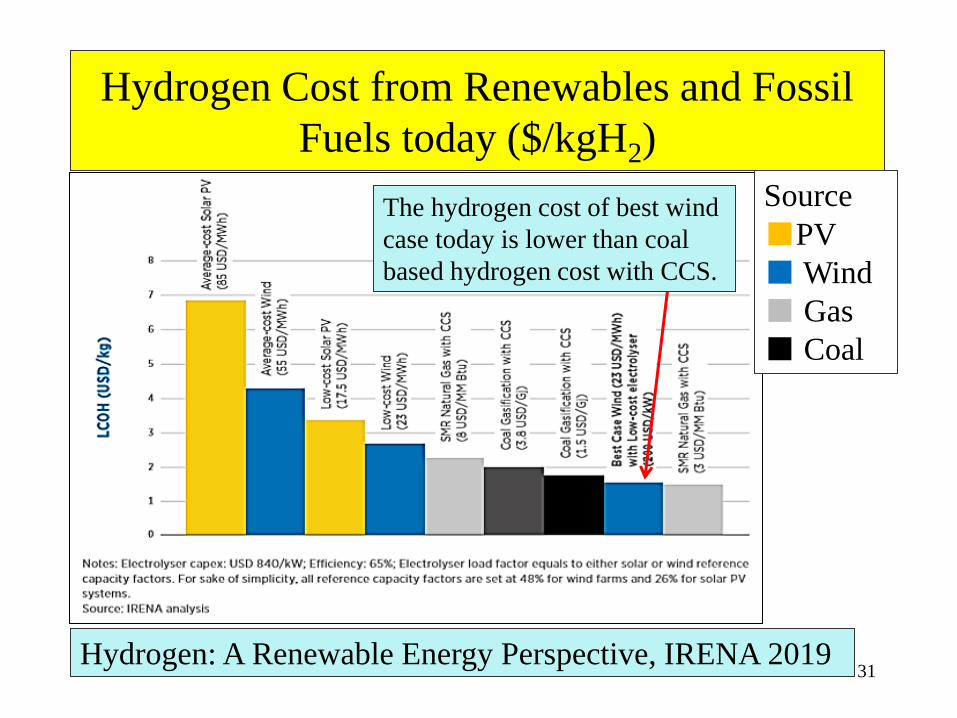
Hydrogen Cost from Renewables and Fossil
Fuels today ($/kgH2)
Hydrogen: A Renewable Energy Perspective, IRENA 2019
Source
■PV
■ Wind
■ Gas
■ Coal
The hydrogen cost of best wind
case today is lower than coal
based hydrogen cost with CCS.
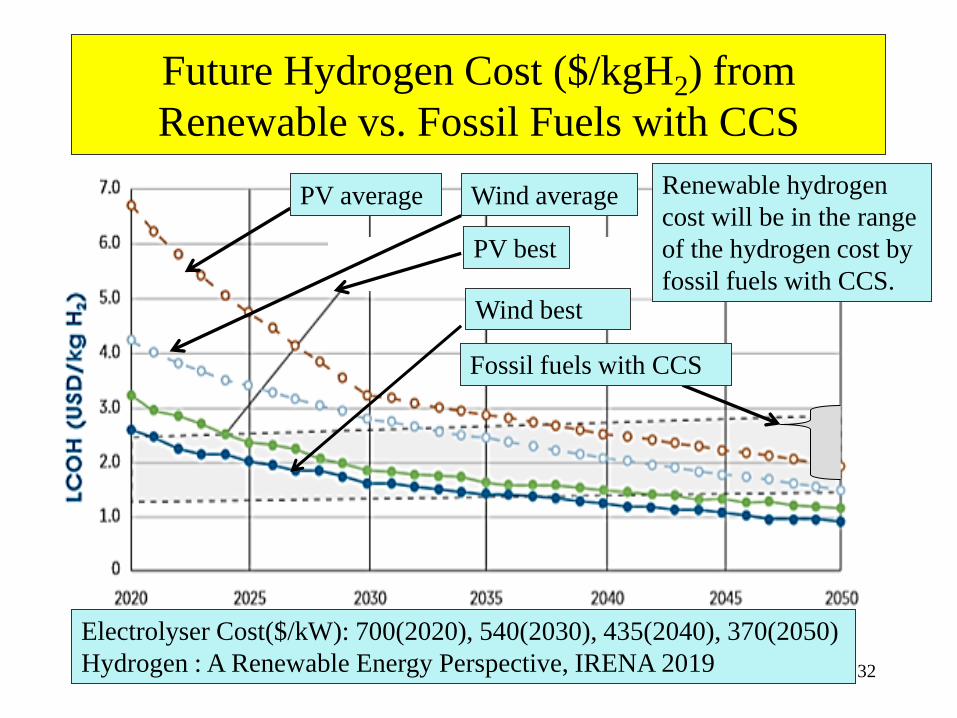
Future Hydrogen Cost ($/kgH2) from
Renewable vs. Fossil Fuels with CCS
32
PV average
Electrolyser Cost($/kW): 700(2020), 540(2030), 435(2040), 370(2050)
Hydrogen : A Renewable Energy Perspective, IRENA 2019
Renewable hydrogen
cost will be in the range
of the hydrogen cost by
fossil fuels with CCS.
PV best
Wind best
Fossil fuels with CCS
Wind average
CCUS and Hydrogen
33
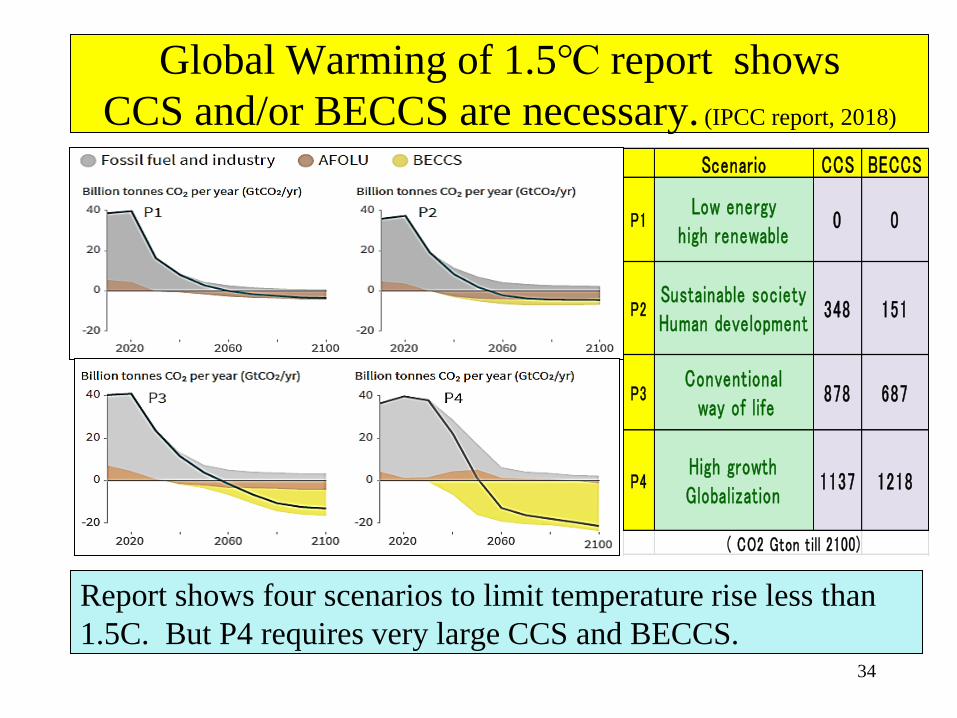
Global Warming of 1.5℃ report shows
CCS and/or BECCS are necessary. (IPCC report, 2018)
Report shows four scenarios to limit temperature rise less than
1.5C. But P4 requires very large CCS and BECCS. 34
Scenario CCS BECCS
( CO2 Gton till 2100)
P4
Low energyhigh renewable
Sustainable societyHuman development
Conventional way of life
High growthGlobalization
0 0P1
P2
P3
348 151
687878
12181137

BECCS or DAC
• Even if CO2 emission will become zero in 2050, there still
remains the accumulated CO2 in the atmosphere.
• It is necessary to decrease it to eliminate climate risks.
• BECCS (Biomass energy with CCS) or DAC(Direct Air
Capture) will be necessary.
• BECCS products will be used as construction materials for
long time storage, but large land area is necessary.
35
DAC cost was $600/CO2 ton in
2010 by American Physics Society
report. In 2018 Carbon Engineering
expected €75-113/CO2 ton at large
scale. The cost is only for capture,
not including storage cost. Carbon Engineering (Canada)
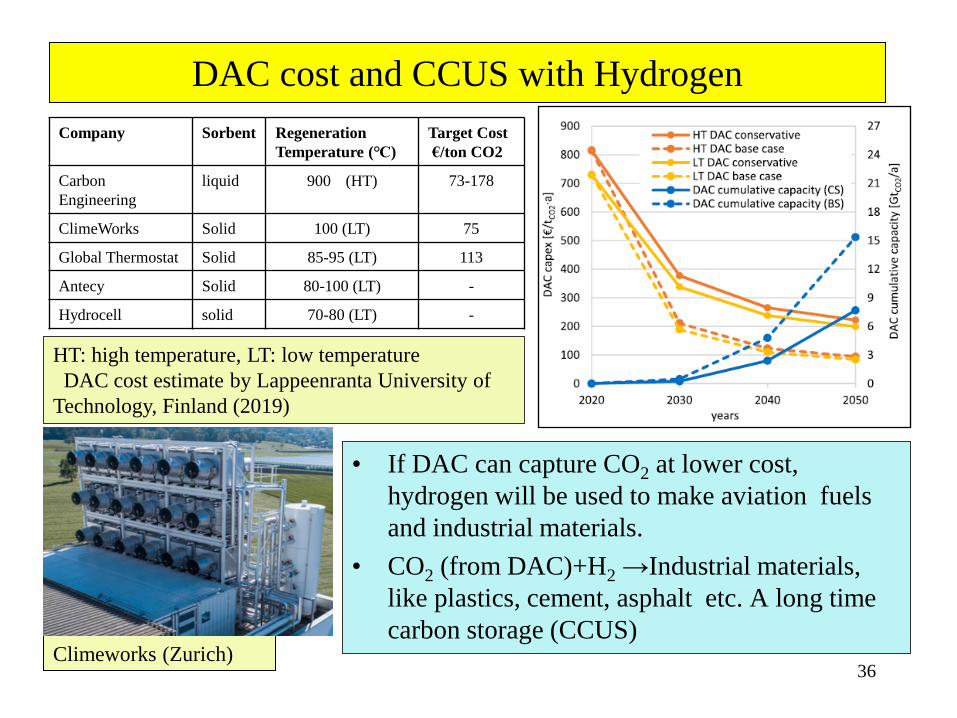
DAC cost and CCUS with Hydrogen
• If DAC can capture CO2 at lower cost,
hydrogen will be used to make aviation fuels
and industrial materials.
• CO2 (from DAC)+H2 →Industrial materials,
like plastics, cement, asphalt etc. A long time
carbon storage (CCUS)
36 Climeworks (Zurich)
Company Sorbent Regeneration
Temperature (℃)
Target Cost
€/ton CO2
Carbon
Engineering
liquid 900 (HT) 73-178
ClimeWorks Solid 100 (LT) 75
Global Thermostat Solid 85-95 (LT) 113
Antecy Solid 80-100 (LT) -
Hydrocell solid 70-80 (LT) -
HT: high temperature, LT: low temperature
DAC cost estimate by Lappeenranta University of
Technology, Finland (2019)
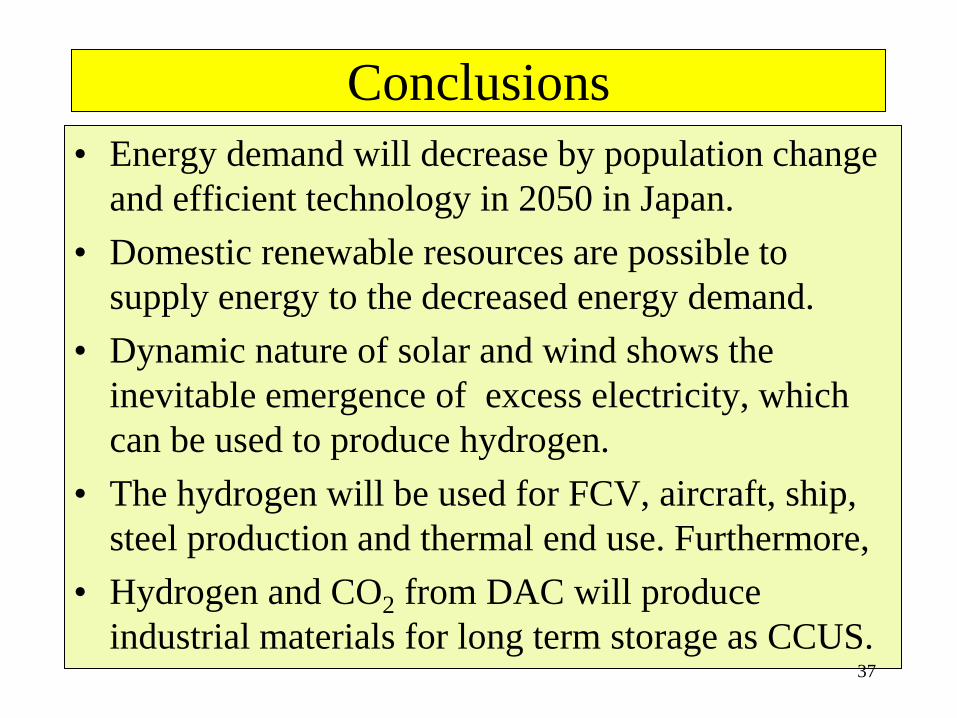
Conclusions
• Energy demand will decrease by population change
and efficient technology in 2050 in Japan.
• Domestic renewable resources are possible to
supply energy to the decreased energy demand.
• Dynamic nature of solar and wind shows the
inevitable emergence of excess electricity, which
can be used to produce hydrogen.
• The hydrogen will be used for FCV, aircraft, ship,
steel production and thermal end use. Furthermore,
• Hydrogen and CO2 from DAC will produce
industrial materials for long term storage as CCUS.
As future energy demand will decrease by
population change
37

Thank you
38