Embed Size (px)
Citation preview
精密儀器概論Optical imaging and MR imaging
王雲銘
生物科技學系

The term molecular imaging can be broadly defined as the in vivo characterization and
measurement of biologic processes at the cellular and molecular level.
In the future, molecular imaging can be clinically employed to
detect and characterize disease at very earlier stage. In
addition, molecular imaging can allow us to understand
fundamental aspect of cause of disease
Classical imaging Molecular Imaging
Probe the end effects of molecular
alterations
Probe the molecular abnormalities that
are the basis of disease
Molecular Imaging
2

Figure 1. Schematic representation of molecular and genomic imaging. Conventional diagnostic
imaging generally visualizes non-specific changes related to morphology (CT, MRI, ultrasound),
physiology (MRI, ultrasound, PET, SPECT) or biochemistry (PET, SPECT, MRS) that could be caused
by alterations in many different proteins or genes. In molecular and genomic imaging, the goal is to
image the location and expression levels of specific genes and proteins that are thought to play an
important part in the molecular pathways of disease. Targeted contrast agents normally are required to
isolate the signal from the gene or protein of interest.
Introduction
R. Weissleder et al., Radiology, 2001, 219, 316–333.
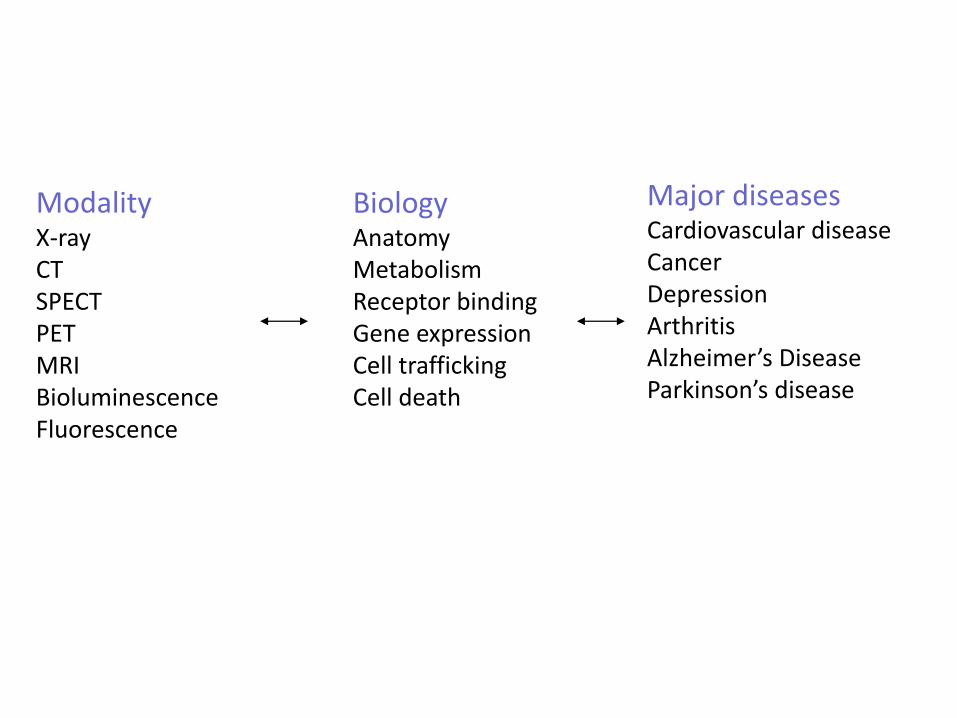
BiologyAnatomyMetabolismReceptor bindingGene expressionCell traffickingCell death
ModalityX-rayCTSPECTPETMRIBioluminescenceFluorescence
Major diseasesCardiovascular diseaseCancerDepressionArthritisAlzheimer’s DiseaseParkinson’s disease


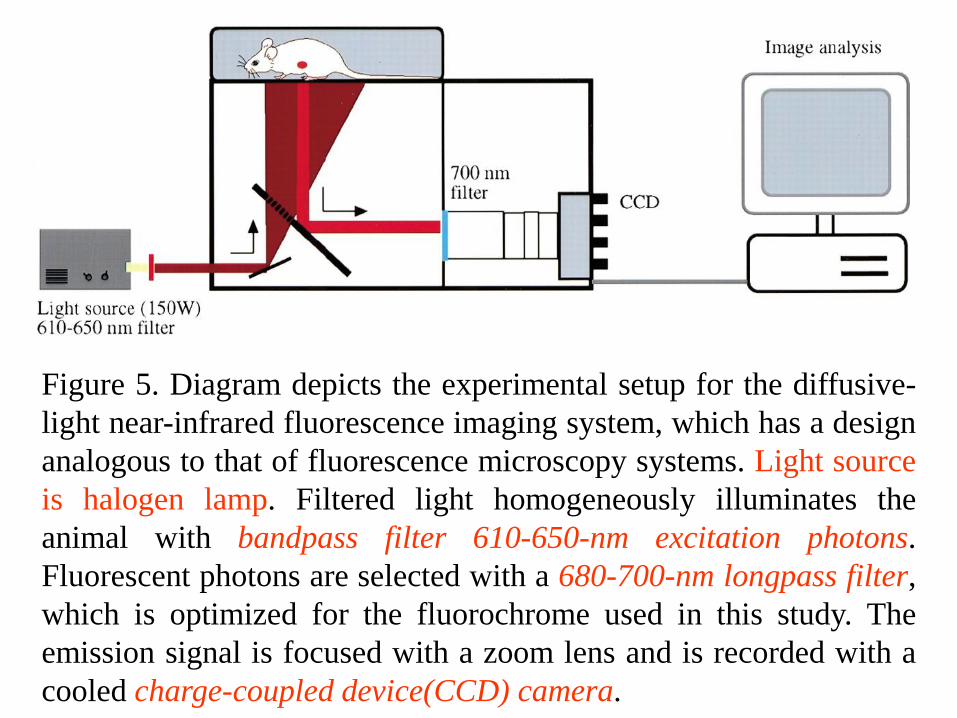
Figure 5. Diagram depicts the experimental setup for the diffusive-
light near-infrared fluorescence imaging system, which has a design
analogous to that of fluorescence microscopy systems. Light source
is halogen lamp. Filtered light homogeneously illuminates the
animal with bandpass filter 610-650-nm excitation photons.
Fluorescent photons are selected with a 680-700-nm longpass filter,
which is optimized for the fluorochrome used in this study. The
emission signal is focused with a zoom lens and is recorded with a
cooled charge-coupled device(CCD) camera.
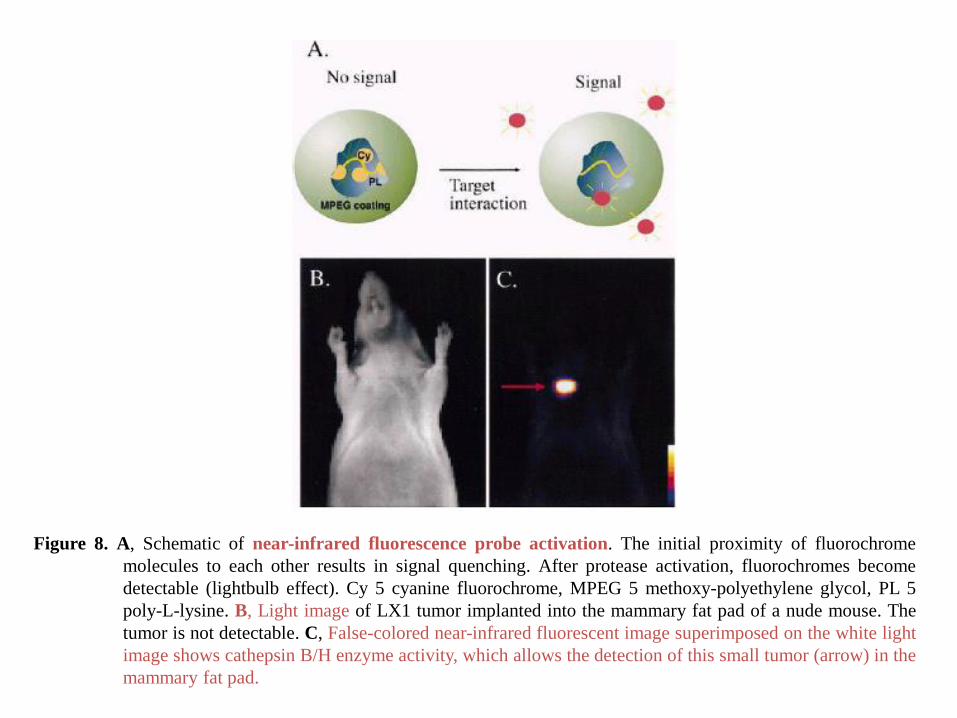
Figure 8. A, Schematic of near-infrared fluorescence probe activation. The initial proximity of fluorochrome
molecules to each other results in signal quenching. After protease activation, fluorochromes become
detectable (lightbulb effect). Cy 5 cyanine fluorochrome, MPEG 5 methoxy-polyethylene glycol, PL 5
poly-L-lysine. B, Light image of LX1 tumor implanted into the mammary fat pad of a nude mouse. The
tumor is not detectable. C, False-colored near-infrared fluorescent image superimposed on the white light
image shows cathepsin B/H enzyme activity, which allows the detection of this small tumor (arrow) in the
mammary fat pad.

Figure 1. Getting the right image. (A) The NIR window is ideally suited for in vivo imaging because of minimal light absorption by hemoglobin(<650 nm) and water (>900 nm). (B) Approaches of NIR fluorescent imaging probes. Isotope and fluorochrome reporters can be used interchangeably for nonspecific and targeted agents; however, fluorochromes can also be used to make activation-sensitive agents forread-out of protein function.

12
Genomics, Proteomics and Functional Study
13
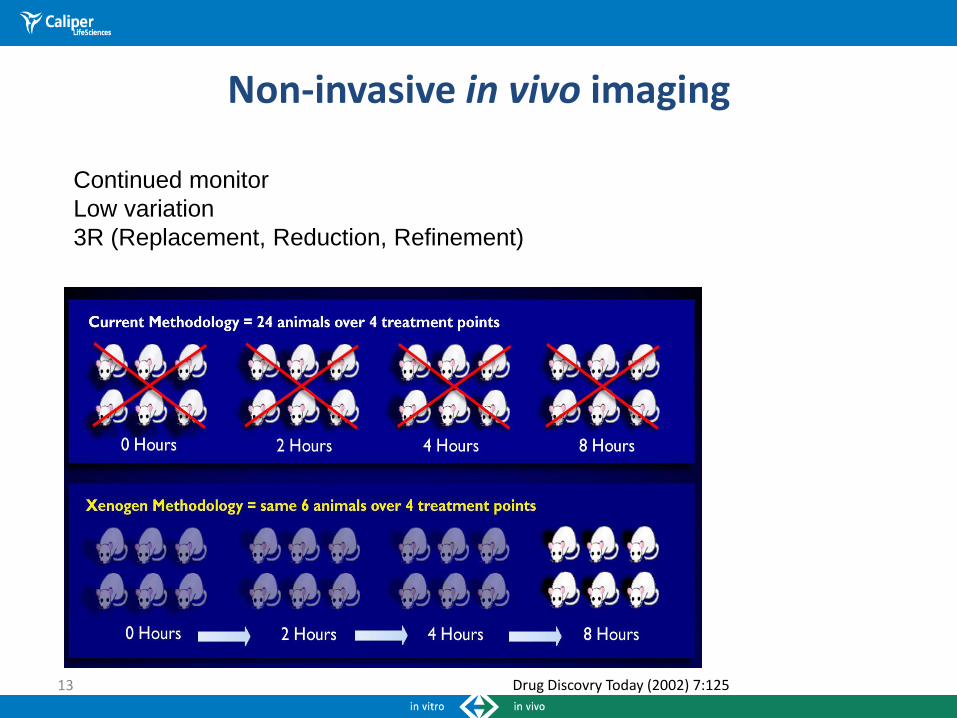
Non-invasive in vivo imaging
Continued monitor
Low variation
3R (Replacement, Reduction, Refinement)
Drug Discovry Today (2002) 7:125

14
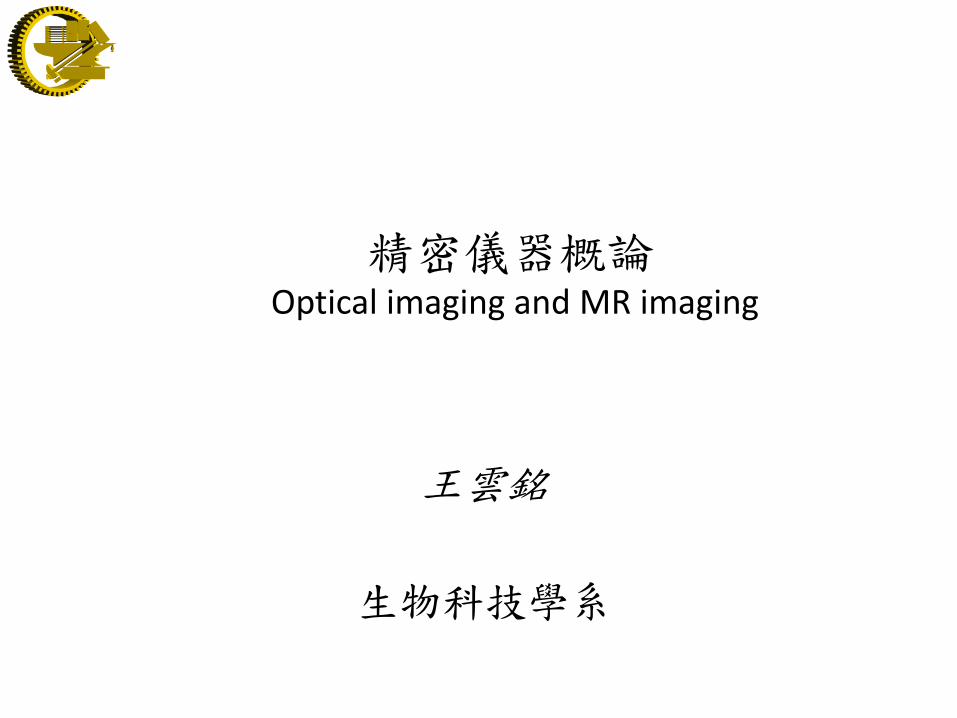
microPET
microCT
microSPECT
microMRI
Optical bioluminescence
Optical fluorescence
Ultrasound
GENE & DEVELOPMENT 2003 17:545
Multi-type of in vivo imaging
Optical Imaging

Micro Ultrasound
Micro CT Micro MRI Optical Micro PET
Resolution 30 to 100uM 5 to 100uM 50 to 200uM ~1000uM 1500uM
Radiation
Hemodynamics
Anatomy
Molecular Data Available
Targeted Contrast
Targeted Contrast
Real Time Imaging
Scan TimeSeconds (Fast)
Minutes (Moderate)
Minutes (Moderate)
Minutes (Moderate)
Minutes (Moderate)
Infrastructure
Cost
Cost
Multi-type of in vivo imaging

Total solution for in vivo imaging
IVIS Optical Imaging
Vevo HR Ultrasound
Cellvizio In vivo microscopy
Quantum FXMicro CT

17
IVIS™
Biology
+
Instrumentation
Biology and User-Driven Technology and Instrumentation Development

18
Advantage of optical imaging
1.High throughput
2.No radiation
3.Easy to operation
4.Dual function
(fluorescence and bioluminescence)
5.Functional analysis

19
Basic Method

20
Reporter Molecules
Luciferase, Fluorescent
Protein
Fluorescent dyes
Quantum dots
Label Cells Label Bacteria Label Genes
ATP and O2 required for luciferase

21
Autofluorescence Autoluminescence
Luminescent or Fluorescent source
Imaging system
Imaging Principle

22
Luciferase Emission Spectra and Tissue Transmission
Tissue is not Transparent - Light Absorbance Depends on Wavelength
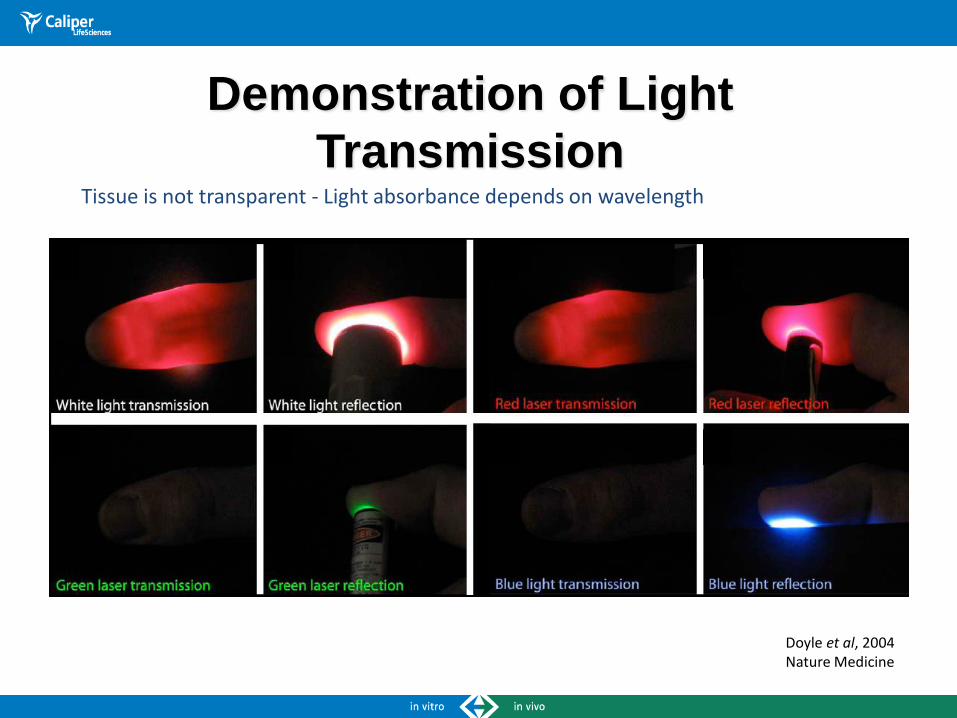
Demonstration of Light
TransmissionTissue is not transparent - Light absorbance depends on wavelength
Doyle et al, 2004 Nature Medicine
24
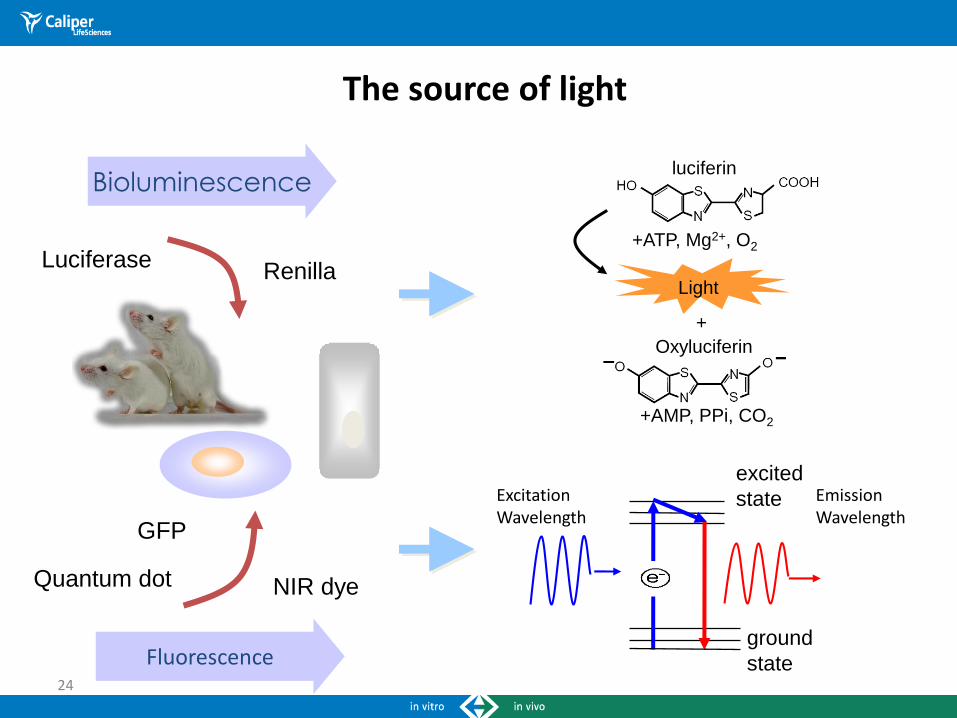
Bioluminescence
Oxyluciferin
luciferin
+ATP, Mg2+, O2
Light
+
+AMP, PPi, CO2
The source of light
RenillaLuciferase
Fluorescence
GFP
Quantum dot NIR dye
ground
state
Excitation Wavelength
Emission Wavelength
excited
state
25
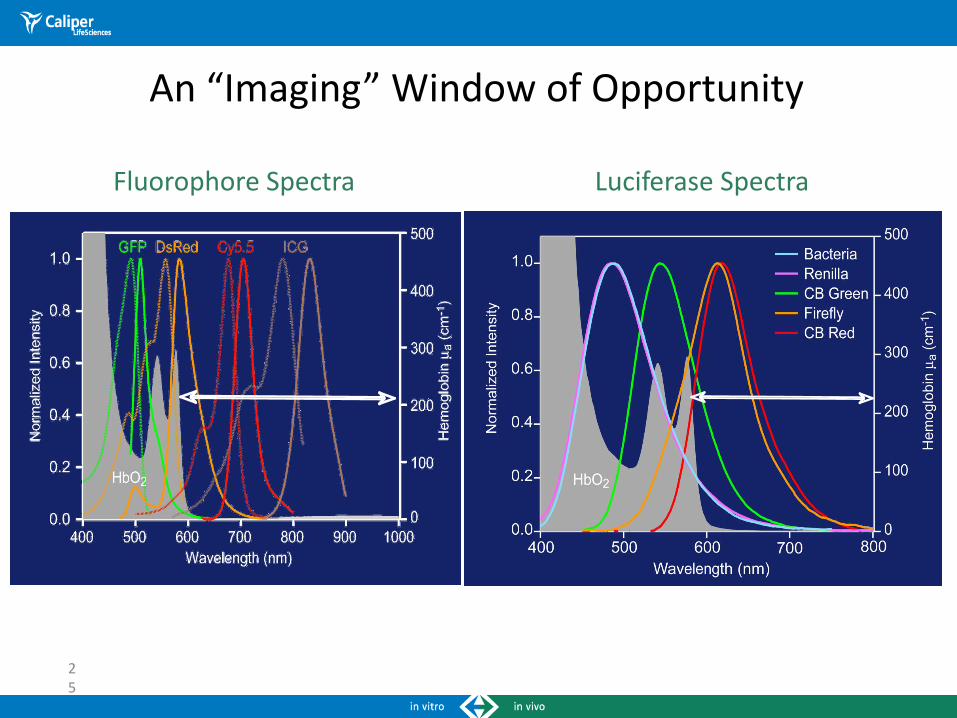
An “Imaging” Window of Opportunity
Excitation EmissionFluorophore Spectra Luciferase Spectra

26
Bioluminescence
Just light out
No background
Fluorescence
Light in and Light out
Autofluorescence interference
Bioluminescence and fluorescence
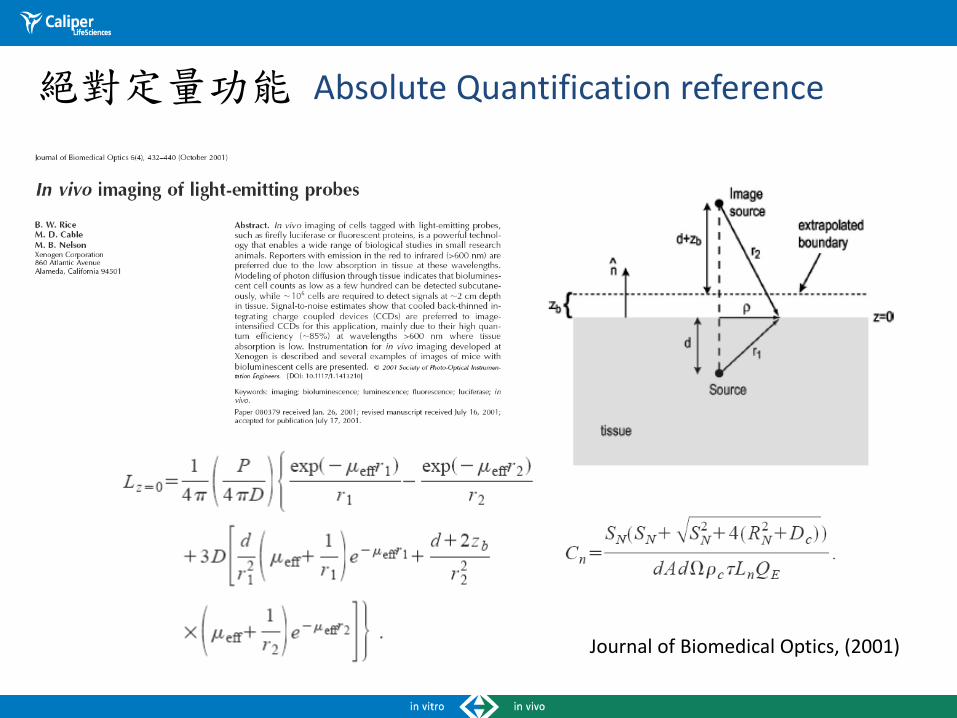
Journal of Biomedical Optics, (2001)
絕對定量功能 Absolute Quantification reference
28
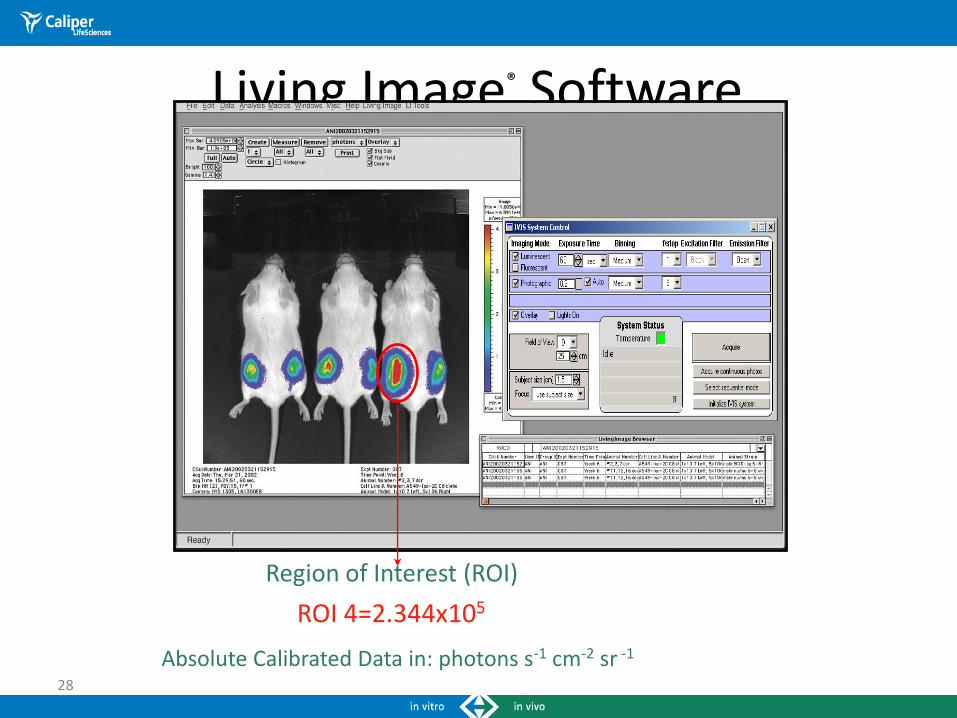
Living Image® Software
Region of Interest (ROI)
Absolute Calibrated Data in: photons s-1 cm-2 sr -1
ROI 4=2.344x10⁵

30
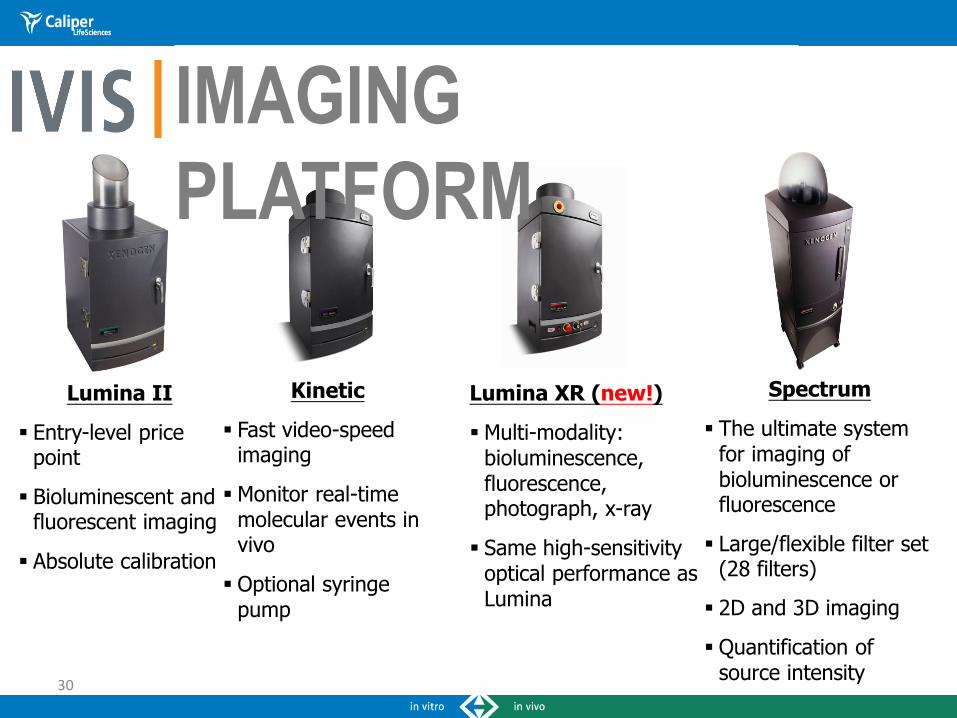
Lumina II
Entry-level price point
Bioluminescent and fluorescent imaging
Absolute calibration
Kinetic
Fast video-speed imaging
Monitor real-time molecular events in vivo
Optional syringe pump
Spectrum
The ultimate system for imaging of bioluminescence or fluorescence
Large/flexible filter set (28 filters)
2D and 3D imaging
Quantification of source intensity
Lumina XR (new!)
Multi-modality: bioluminescence, fluorescence, photograph, x-ray
Same high-sensitivity optical performance as Lumina
IMAGING
PLATFORM

in vivo fluorescence imaging of subcutaneous
U87MG glioblastoma
Cancer research (2004) 64: 8009
RGD-Cy5.5Fluorescence probe
MCF‐7 (human breast adenocarcinoma cell line),A‐549 (human lung adenocarcinoma epithelial cell line),
HT‐29 (human colon carcinoma cell line) andHT‐1080 (human fibrosarcoma cell line) cells
are all integrin receptor overexpressors

FluorescenceFluorophore
ground state
Excitation Wavelength
Emission Wavelength
excited state

•18 Emission filters (computer controlled)
•10 Excitation filters (computer controlled)
•150 Watt Tungsten/Halogen lamp(computer controlled intensity)
•Low Auto Fluorescence optics and fibers
IVIS® Fluorescence Imaging
Emissionfilter wheel
Excitationfilter wheel
Opticalswitch
Trans-illuminationLight source

Excitation and Emission Filters
445 -
490 nm
515 -
575 nm
575 -
650 nm
500 -
550 nm
615 -
665 nm
695 -
770 nm
710 -
760 nm
810 -
875 nm10 Excitation filters –
35nm bandwidth
18 Emission filters –20nm bandwidth
0
20
40
60
80
100
400 440 480 520 560 600 640 680 720 760
Wavelength (nm)
Tra
ns
mis
sio
n %

Total Optical Imaging
• The “no compromise” system for multiple fluorescence and bioluminescence applications
• Best in class performance forSensitivity of detectionField of view (throughput)Resolution
• Trans-illumination for fluorescence imaging
• Tools for absolute quantitation in cell number or pmol of fluorescence compound
• 3D tomographic reconstructions for both bioluminescence and fluorescence

36
IVIS® 200 Imaging System – Hardware
Chiller andCamera controller
Lenses
CCD camera
Heated SampleStage
Electronics
Filter Wheels
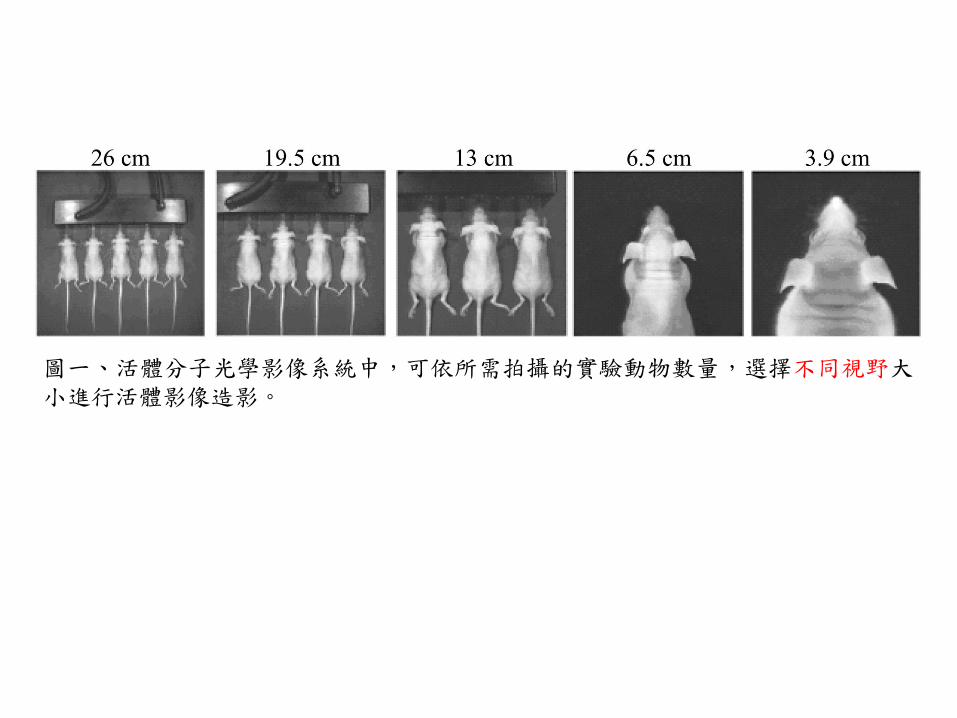
圖一、活體分子光學影像系統中,可依所需拍攝的實驗動物數量,選擇不同視野大小進行活體影像造影。
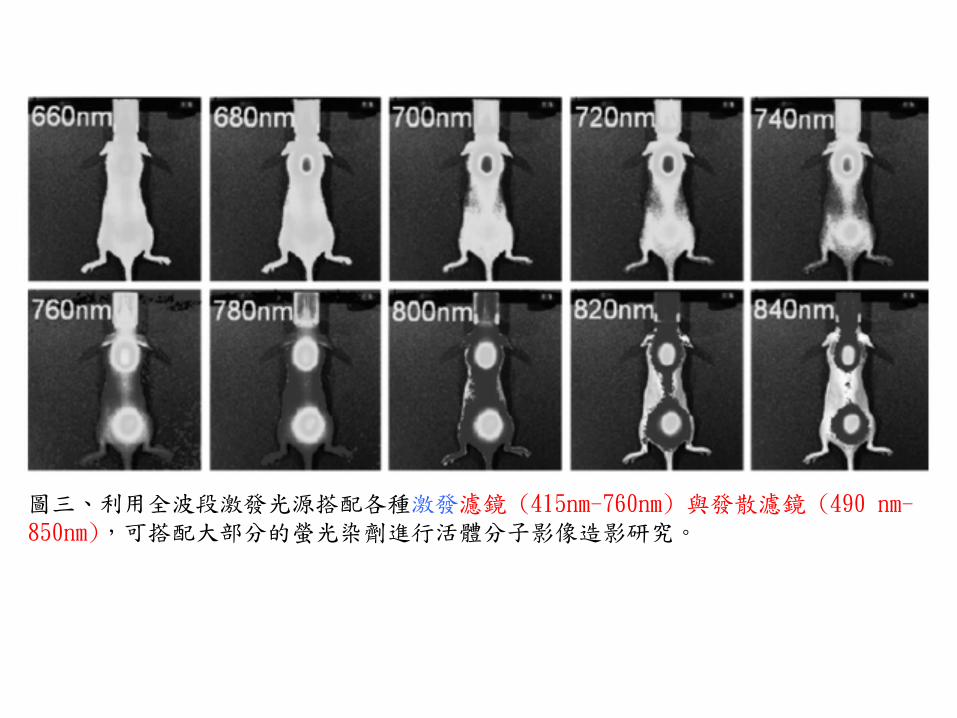
圖三、利用全波段激發光源搭配各種激發濾鏡 (415nm-760nm) 與發散濾鏡 (490 nm-850nm),可搭配大部分的螢光染劑進行活體分子影像造影研究。
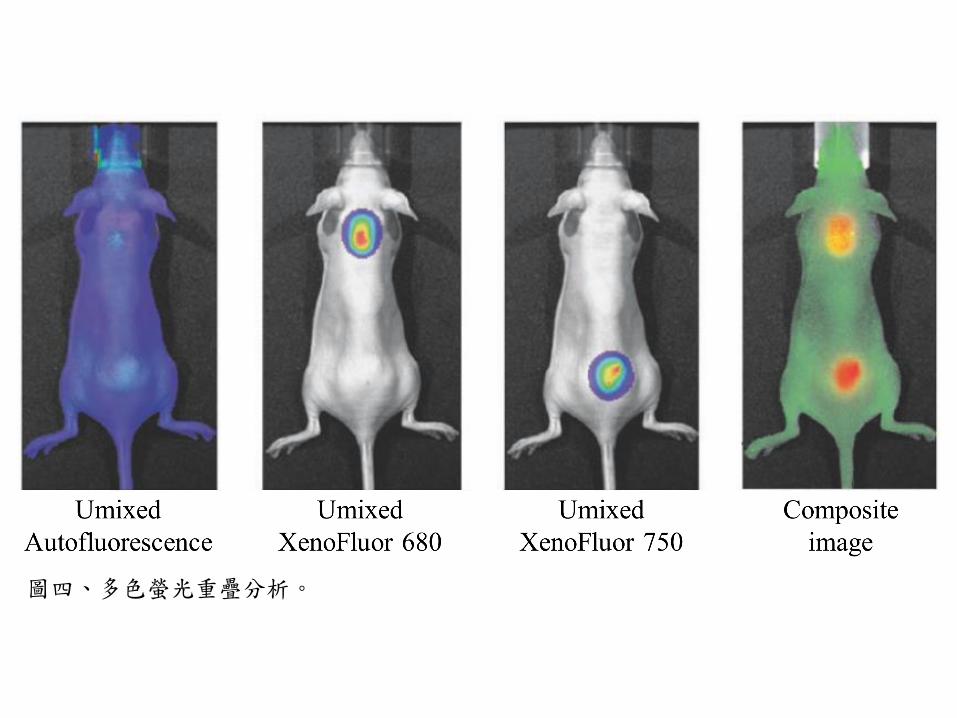
圖四、多色螢光重疊分析。

Radio FrequencyReceiver
Radio frequencycoil
Gradient coilMagnetic coil
Figure 1,The major components of the MagneticResonance Imaging System
protocols ImageReconstructionViewing control
processing
Operator keyboard
computer
RadiofrequencyTransmitter
GradientPowerSupply
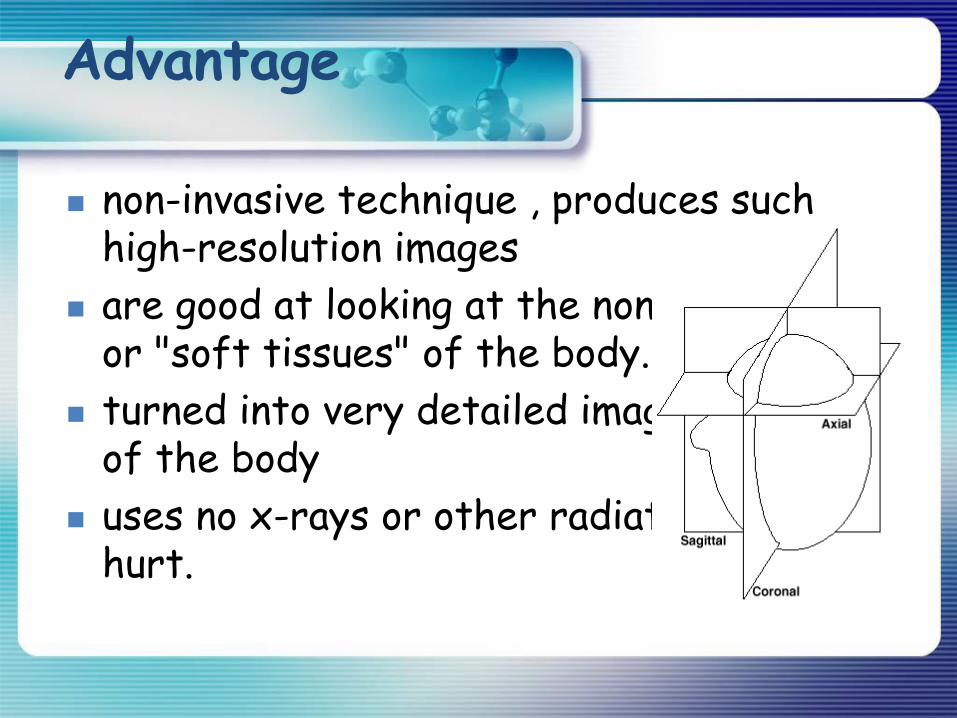
Advantage
non-invasive technique , produces such high-resolution images
are good at looking at the non-bony parts or "soft tissues" of the body.
turned into very detailed images of "slices" of the body
uses no x-rays or other radiation ,does not hurt.
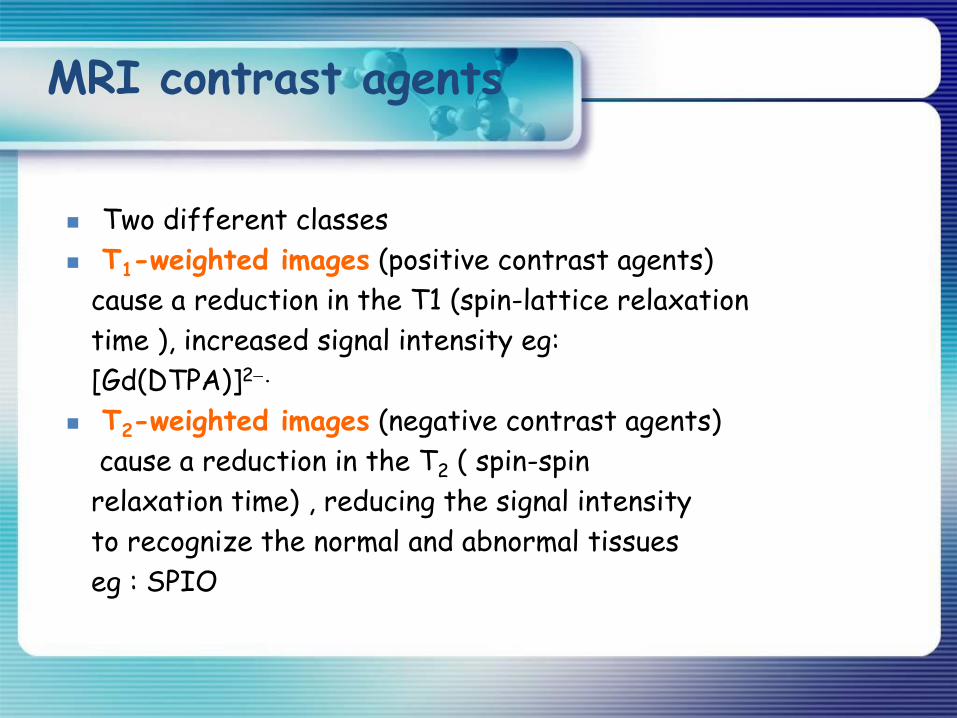
MRI contrast agents
Two different classes
T1-weighted images (positive contrast agents)
cause a reduction in the T1 (spin-lattice relaxation
time ), increased signal intensity eg:
[Gd(DTPA)]2.
T2-weighted images (negative contrast agents)
cause a reduction in the T2 ( spin-spin
relaxation time) , reducing the signal intensity
to recognize the normal and abnormal tissues
eg : SPIO

t1[1].avi t1[1].avi
t1[1].avi
fat
white gray
fluid
Figure 2, The weighted images of T1 and T2
T2 Relaxation
T1 Relaxation

N N N
O
Gd
O
O
O
O
O
O
O
ONH
S
NH
Lys-Gly-Gly-Gly-Gln-Trp-Ala-Val-Gly-His-Leu-Met
Cy5.5
Bioorg. Med. Chem. 2010, 19, 1085–1096.
In vivo MR/optical imaging for gastrin releasing peptide receptor of
prostate cancer tumor using
Gd-TTDA-NP-BN-Cy5.5
44
45
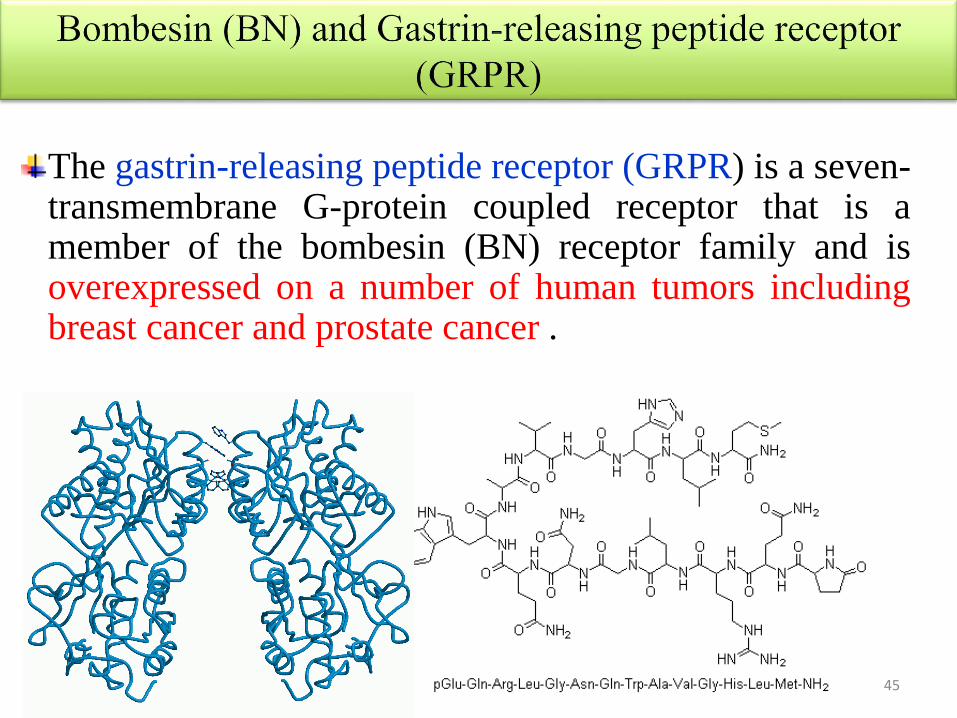
The gastrin-releasing peptide receptor (GRPR) is a seven-transmembrane G-protein coupled receptor that is amember of the bombesin (BN) receptor family and isoverexpressed on a number of human tumors includingbreast cancer and prostate cancer .

Scheme 2. Synthetic scheme of Gd-NP-TTDA-BN-Cy5.5 and Eu-NP-TTDA-BN
BN:Met-Leu-His-Gly-Val-Ala-Trp-Gln-Gly-Gly-Gly-Lys
R BN(P): resin-Met-Leu-His(Trt)-Gly-Val-Ala-Trp(Boc)-Gln(Trt)-Gly-Gly-Gly-Lys(Boc)
N N NCOOtBu
COOtBu
ButOOC
ButOOC
HO
N N NCOOH
COOH
HOOC
HOOC
HO
Ln(III)Cl3N N N
O
Ln
O
O
O
O
O
O
O
ONHNH
NH
SNH S N
H SNHBN(P)
BNBN
Ln =Gd,
R
1. 94.5%TFA, 2.5%EDT 2.5%H2O, 1%TIS
BN(P)R
N N NCOOtBu
COOtBu
ButOOC
ButOOC
HO NCS
1
23 4
2.Cy5.5-NHS
DMSO
Cy5.5Cy5.5
N N NCOOH
COOH
HOOC
HOOC
HO
Ln(III)Cl3N N N
O
Ln
O
O
O
O
O
O
O
ONH NH
S NH S
NHBN
BN
Ln= Eu,Gd
1. 94.5%TFA,2.5%EDT 2.5%H2O, 1%TIS
5 6
46

In vitro MR Imaging
47
PC-3 PC-3KB KB
Without contrast agent
[Gd(DTPA)]2
[Gd(NP-TTDA-BN)]2
[Gd(NP-TTDA-BN)]2
+4-fold BN peptide
Figure The T1-weighted images of PC-3 and KB cell after the treatment without or
with [Gd(DTPA)]2-, [Gd(NP-TTDA)]2-, Gd-NP-TTDA-BN and Gd-NP-TTDA-BN
with excess amount BN peptide.
[Gd (NP-TTDA)]2
Cell line
Gastrin-releasing peptide receptor
(GRPR) overexpression
PC-3 ( Human Prostate Cancer
Cell Line)
Whole-body 3 T MR scanner
KB ( Human Oropharyngeal Cell
Line)
Pulse sequence: T1 weighted, Spin
echo, TR / TE = 100 : 10
Coil: Knee coil and animal coil
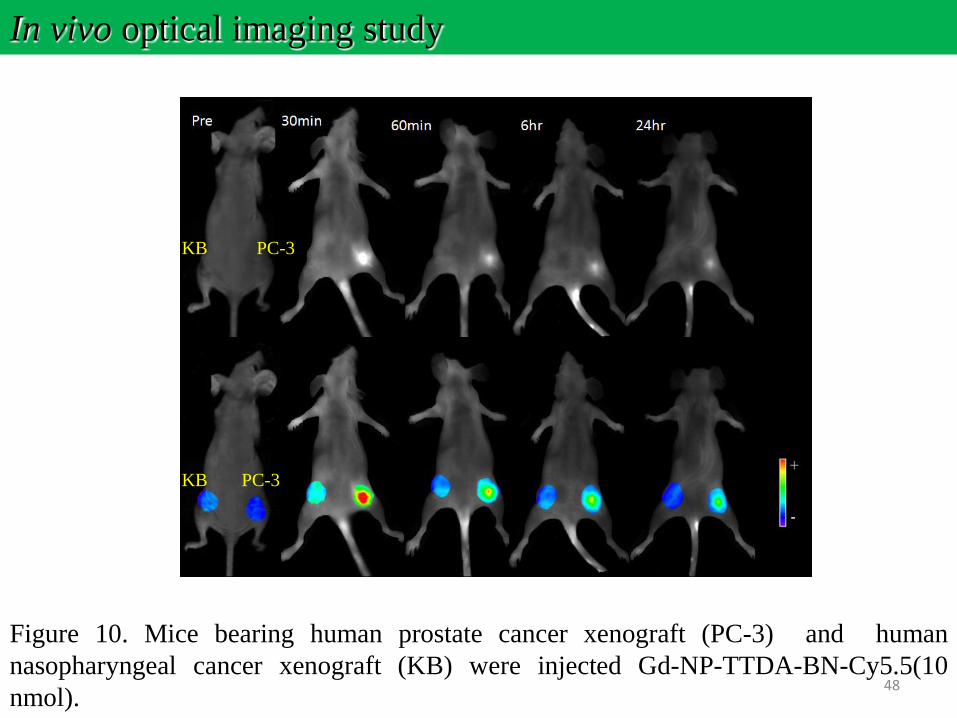
Figure 10. Mice bearing human prostate cancer xenograft (PC-3) and human
nasopharyngeal cancer xenograft (KB) were injected Gd-NP-TTDA-BN-Cy5.5(10
nmol).
In vivo optical imaging study
PC-3KB
PC-3KB
48
Conclusion
• Gd-TTDA-NP-BN complex has the ability to target PC-3 tumor cells, as proven by in vitro and in vivo MR imaging studies.
• Thus, the Gd-TTDA-NP-BN-Cy 5.5 can be potentially used as a dual contrast agent for optical/MR imaging of prostate cancer.
49

Peptide-based MRI contrast agent and near-infrared fluorescent probe for intratumoral legumain detection
50Biomaterials, 2014, 35, 304-315.

Legumain is a lysosomal cysteine protease that is over-expressed in response to hypoxic stress
on mammary adenocarcinoma, breast, colorectal cancer, proliferating endothelial cells, and
tumor-associated macrophages.
Cancer Res. 2003, 63, 2957-2964.
.
51
Introduction

Scheme 1. Synthetic scheme of NIR fluorescence probe (CyTE777-
Leg(L)-CyTE807) and control probe (CyTE777-Leg(D)-CyTE807).
R = L form, CyTE777-Leg(L)-CyTE807, 13
R = D form, CyTE777-Leg(D)-CyTE807, 14 (control probe)
(ex/em = 777/812) (ex/em = 807/840)
52
Asparagine (Asn)
Alanine (Ala)
CyTE777 CyTE807
Figure 2. Cell cytotoxicity of CyTE777-Leg(L)-CyTE807 (A) and
CyTE777-Leg(D)-CyTE807 (B) as function of different concentrations
(0.01 to 10 μM) in MTT assay.
Structure of NIR Fluorescent Probes and andCell Cytotoxicity Studies

Figure 3. Fluorescent spectra of CyTE777-Leg(L)-CyTE807 incubated with legumain-transduced 3T3
(legumain+) cell lysate (solid line) and CyTE777-Leg(L)-CyTE807 alone (dotted line) in 0.1 M PBS
(excitation: 745 nm).
CyTE777-Leg(L)-CyTE807 alone
CyTE777-Leg(L)-CyTE807 / 3T3 (legumain+)
820 nm
840 nm
53
Fluorescence Spectrum Studies

CyTE777-Leg(L)-CyTE807 alone
CyTE777-Leg(L)-CyTE807 / 3T3 (legumain+)
CyTE777-Leg(L)-CyTE807 / 3T3
CyTE777-Leg(D)-CyTE807 alone
CyTE777-Leg(D)-CyTE807 / 3T3 (legumain+)
CyTE777-Leg(D)-CyTE807 / 3T3
54
(A) (B)
pre 24 h pre 24 h
In Vitro and In Vivo Optical Imaging Study
(A) CyTE777-Leg(L)-CyTE807
(B) CyTE777-Leg(D)-CyTE807
CT-26 (legumain+) tumor
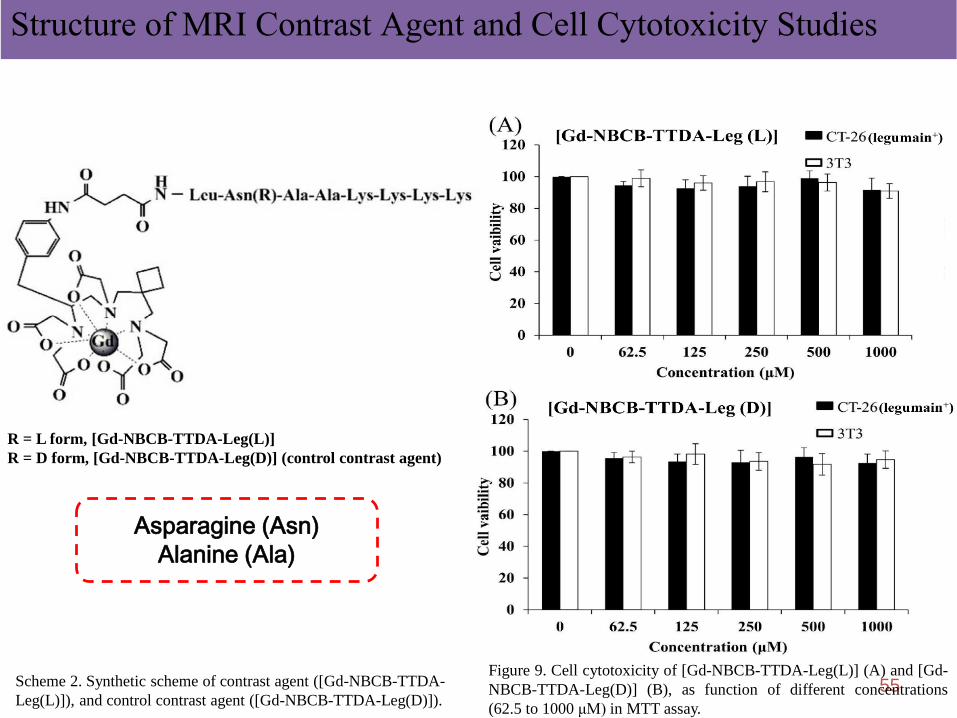
Scheme 2. Synthetic scheme of contrast agent ([Gd-NBCB-TTDA-
Leg(L)]), and control contrast agent ([Gd-NBCB-TTDA-Leg(D)]).
R = L form, [Gd-NBCB-TTDA-Leg(L)]
R = D form, [Gd-NBCB-TTDA-Leg(D)] (control contrast agent)
55
Asparagine (Asn)
Alanine (Ala)
Figure 9. Cell cytotoxicity of [Gd-NBCB-TTDA-Leg(L)] (A) and [Gd-
NBCB-TTDA-Leg(D)] (B), as function of different concentrations
(62.5 to 1000 μM) in MTT assay.
Structure of MRI Contrast Agent and Cell Cytotoxicity Studies

The contrast agent ([Gd-NBCB-TTDA-Leg(L)]) and the
NIR fluorescent probe (CyTE777-Leg(L)-CyTE807) can
specifically and efficiently target legumain-expressing
cancers in vivo.
This development of MRI contrast agent and optical probe
may be useful for in vivo legumain detection in biomedical
studies.
Biomaterials, 2014, 35, 304-315.56
Conclusions

![Non-invasive PET Imaging of PARP1 Expression in ... · or even prognostic biomarker. Based on this data, we tested a fluorescent imaging agent, PARPi-FL [12, 13], for imaging of PARP1](https://img.pdfslide.tips/doc/110x75/603a71765e49804fca009563/non-invasive-pet-imaging-of-parp1-expression-in-or-even-prognostic-biomarker.jpg)