Embed Size (px)
Citation preview
European Association of the Machine Tool Industries where manufacturing begins
CECIMO aisbl 66, avenue Louise 1050 Brussels Belgium Tel: +32 2 502 70 90 Fax: +32 2 502 60 82 Email: [email protected] www.cecimo.eu For more information: [email protected]
CECIMO Statistical Toolbox July 2010 Edition
0 Executive Summary 1 Machine Tool Orders 1.1 Orders per Country 1.2 Peter Meier’s Forecast
2 Macro‐economic indicators in the EU & correlation with MT orders 2.1 GDP 2.2 Interest Rates ‐ Euribor 2.3 New Orders of Capital Goods 2.4 Industrial Production in Manufacturing 2.5 Gross Fixed Capital Formation (GFCF) 2.6 Capacity Utilisation in the Investment Goods Sector 2.7 Bank Lending Survey
3 Business Expectations 3.1 Business Confidence Indicator in Europe of OECD 3.2 Purchasing Manager Indexes (PMI)
4 MT‐IX 5 Machine Tool Indicators 5.1 External trade in Q1 2010 5.2 CECIMO and Global Production since 2001
Inside this edition...
NB: only the highlighted indicators are available in this edition of the toolbox
EXECUTIVE SUMMARY – CECIMO STATISTICAL TOOL BOX – JULY 2010
After some signs of relief on the financial markets in May 2010 following the EU package aimed at supporting the sovereign debt of some
European countries, investors seemed less confident in June. A recent Bloomberg survey of global investors has found that less than a quarter
of respondents think that the region’s €750bn support package will prevent the monetary union’s break up or a member nation’s default. Yet
business confidence is a key indicator in cyclical industrial sectors such as machine tools.
Production statistics for April 2010 show that industrial production continued to rise almost everywhere. With 18% over the same period last
year, the Indian industrial output was even stronger than forecasted. In the Eurozone, a growing industrial production of intermediate and
investment goods did, in fact, offset the decreasing production of consumer goods over the previous month.
Liquidity is scarce, and companies continue to face credit crunch. The European central bank buys some assets (such as sovereign debt) in
order to give some liquidity to the market. Building up the necessary European recovery during a period of decreasing monetary mass may
become a real challenge.
The dilemma of debt versus growth was key during the Toronto G20 meeting on 26th and 27th June. Although financial markets reacted
positively to the Chinese sign of flexibility as regards the Yuan value, markets are still concerned by the lack of perspectives for growth in the
medium term in the developed economies, which may explain the recent volatility of markets.
Volatility, lack of liquidity, easing of confidence and concerns about the sustainable recovery in Europe and in the US over the end of 2010 is
also what was observed in the different indicators of the tool box in June 2010.
2
EXECUTIVE SUMMARY – CECIMO STATISTICAL TOOL BOX – JULY 2010
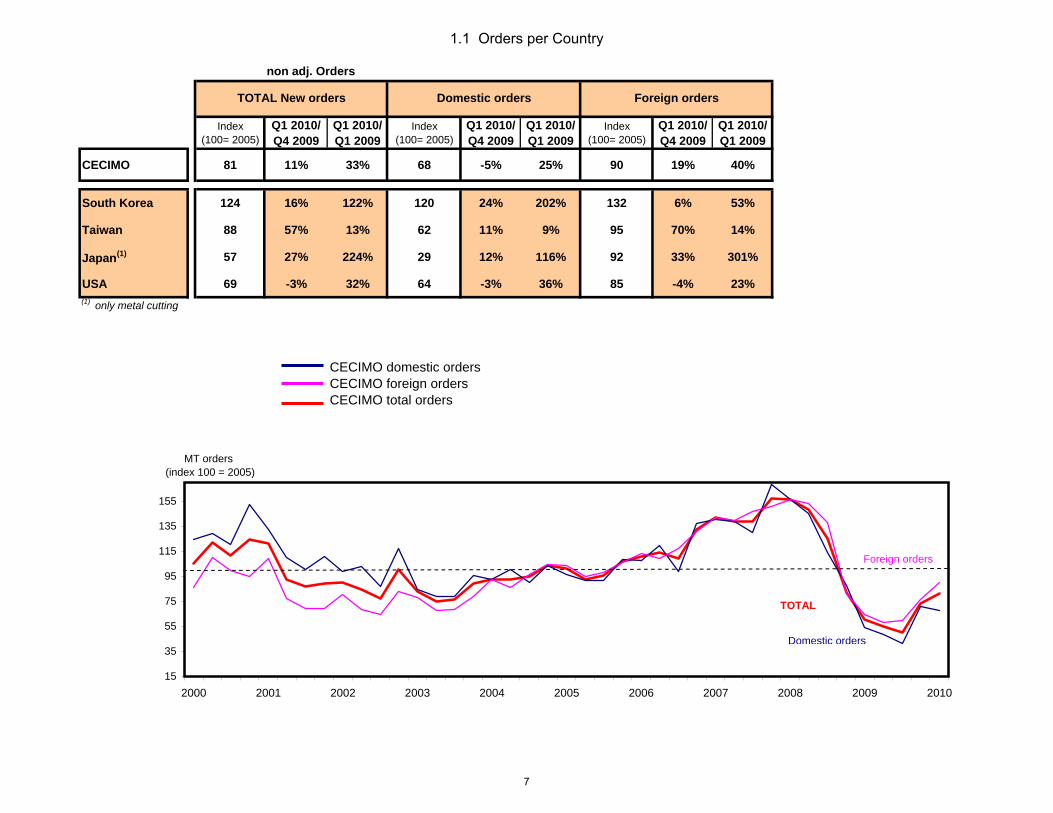
1.1. Machine Tool Orders
Final data confirmed the trend observed with the preliminary results last month. The upturn observed in machine tool orders in CECIMO
countries in the last quarter of 2009 was confirmed in the first quarter of 2010, at least for foreign and total orders. This shows the evidence of
an export-led recovery (and notably exports to the emerging economies).
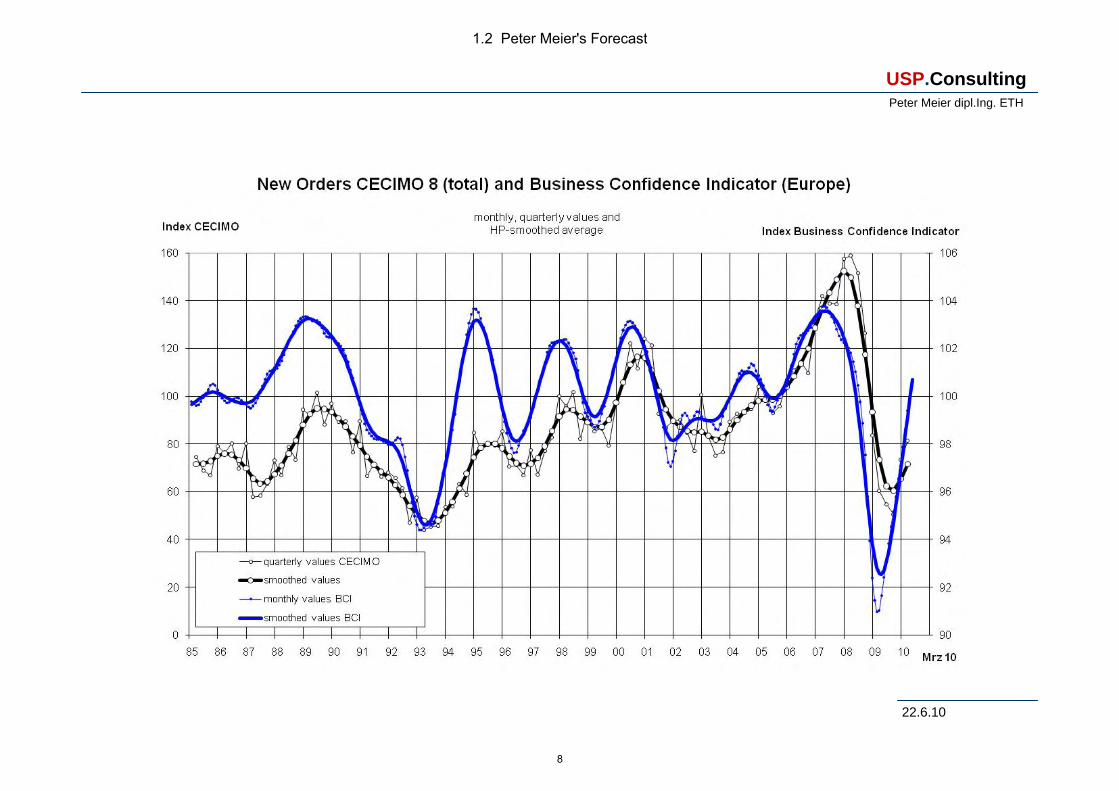
1.2. Peter Meier’s Forecast
Final data confirmed the trend observed with the preliminary results last month. The business confidence indicator reached a level of 100.6 in
May 2010. That means for the first time since mid 2008 production is just about to expand. Comparing the two curves we see, that the usual
time lag of about 6 months for machine tools was also maintained during the crisis of 2009.
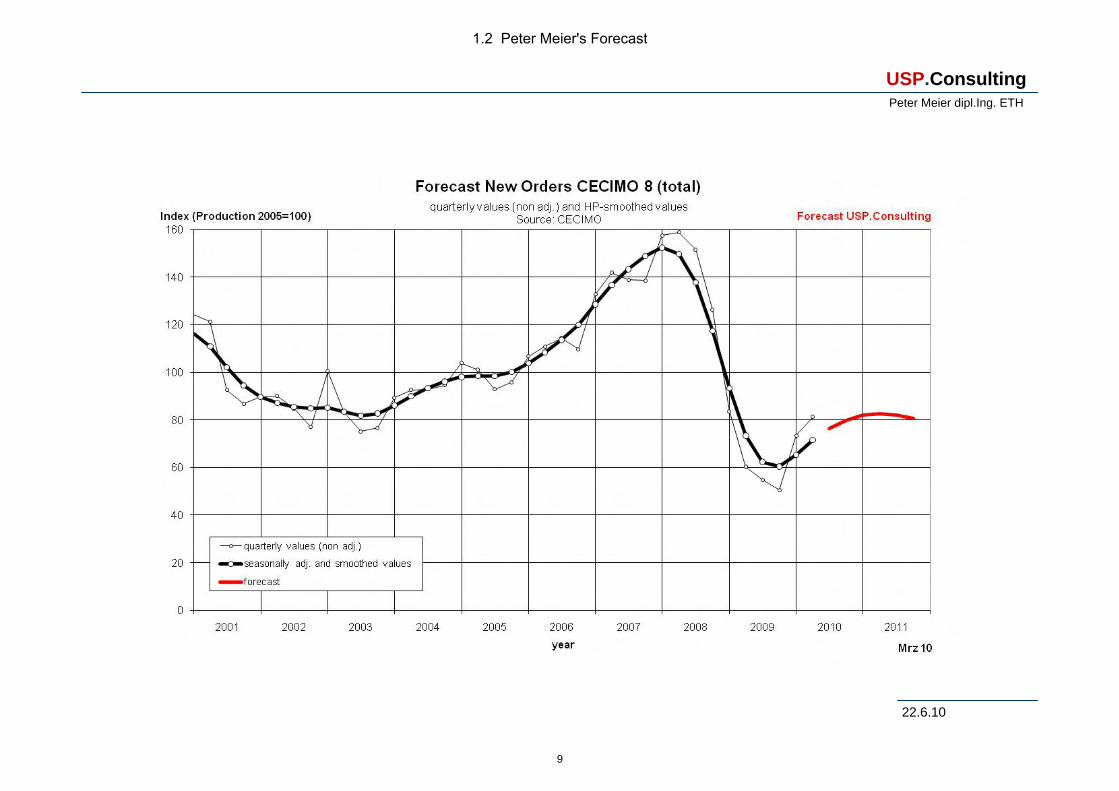
The development of machine tool orders was ahead of expectations in the first quarter of 2010. This effect can also be observed in other
various machinery branches. It looks like after a negative overshooting in 2009 there is a positive overshooting going on now. There is a danger
that this will lead to a next turning point by the end of 2010. Forerunning branches like semiconductor production equipment may already be
close to this turning point. The next few months will show whether we really will have to consider this scenario.
2.1. GDP
The GDP grew by 1.3% in the EU 27 in the first quarter of 2010. Year on year, this is a 2.6% growth. Turnaround in GDP occurred in the
second quarter of 2009. It took 3 quarters for machine tool orders to turn around following GDP (on a 12-month rolling basis)
3
EXECUTIVE SUMMARY – CECIMO STATISTICAL TOOL BOX – JULY 2010
2.2. Interest rates – EURIBOR
Even though the Euribor interbank 3-month rate increased by 3% in the second quarter of 2010 in comparison with the previous quarter, it
remains at its lowest level since the beginning of the historical series in 1999, and decreased by 48% over the same period last year. The
European Central Bank announced in June 2010 that interest rates are expected to remain on hold until at least 2011, as a result of uneven
growth and low inflation in the Eurozone. Despite the low interest rates, the recovery is still hampered by a depressed money supply in Europe.
2.3. New Orders in Capital Goods
New orders of capital goods increased by 2% in April 2010 in comparison with March 2010. On a yearly basis, this is a 13% increase. Given the
84% correlation observed between 12-month rolling capital orders and 12-month rolling MT orders since 1998, our forecasts for MT orders are
so far optimistic as regards the second quarter of 2010.
2.4. Industrial Production in Manufacturing
The April 2010 data for industrial production in the Eurozone shows a 2.4% increase compared with the quarterly average of the first quarter of
2010. However, Eurostat points out that the situation differs strongly from country to country. All in all, this is a 7% increase year on year (with a
8% annual drop, the 12-month rolling basis has still not turned around)
4
EXECUTIVE SUMMARY – CECIMO STATISTICAL TOOL BOX – JULY 2010
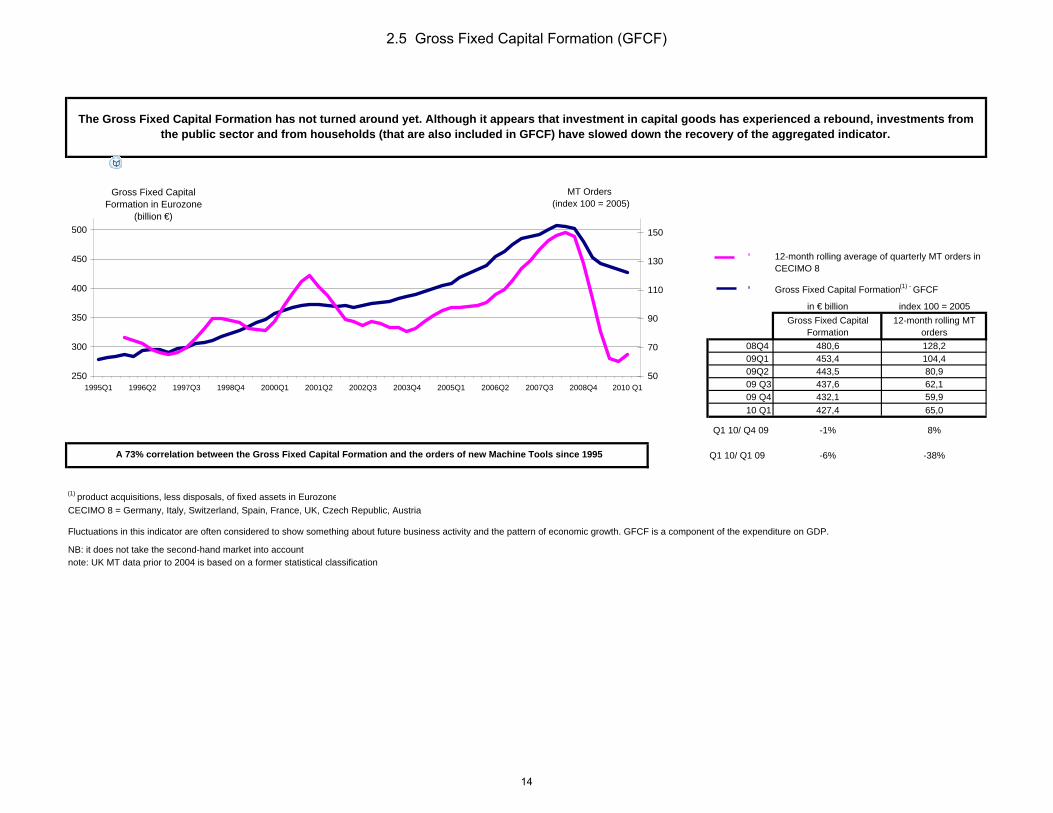
2.5. Gross Fixed Capital Formation (GFCF) The Gross Fixed Capital Formation has not turned around yet. Although investment in capital goods has already experienced a rebound.
Investments from the public sector and from households (also included in GFCF) have slowed down the recovery of the aggregated indicator.
2.7. Bank Lending Survey
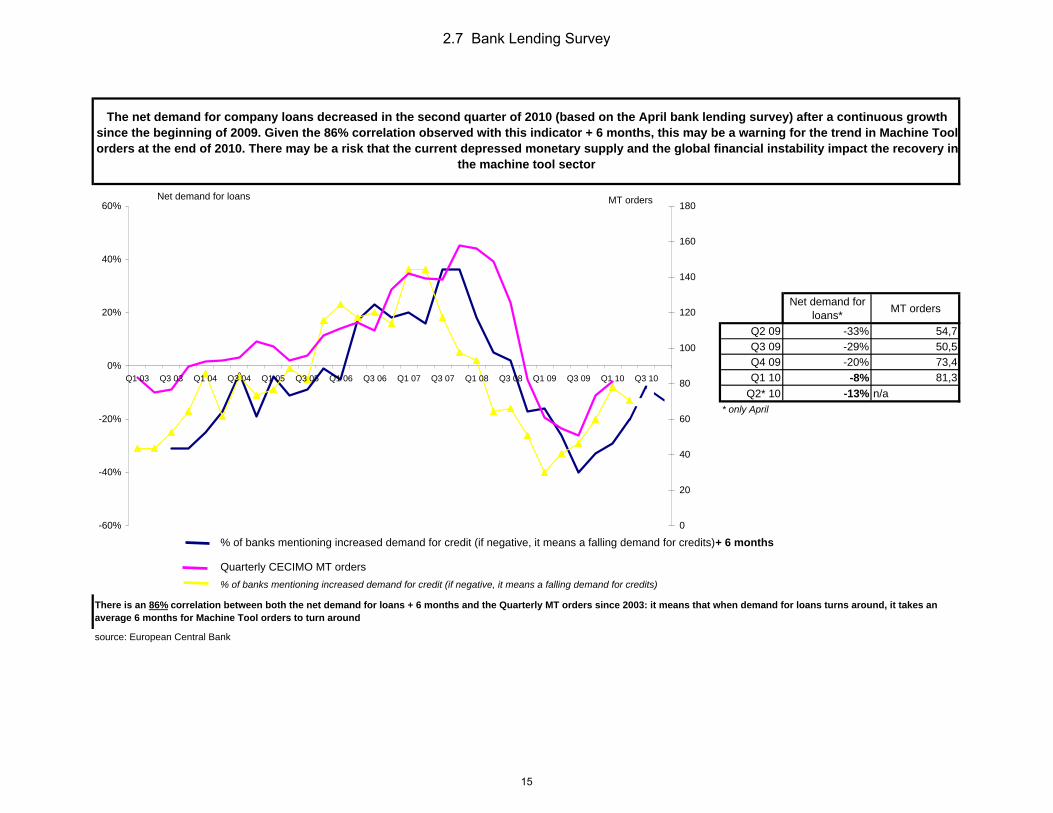
The net demand for company loans decreased in the second quarter of 2010 (based on the April bank lending survey) after a continuous
growth since the beginning of 2009. Given the 86% correlation observed with this indicator + 6 months, this may be a warning for the trend in
Machine Tool orders at the end of 2010. There may be a risk that the current depressed monetary supply and the global financial instability’s
impact the recovery in the machine tool sector).
3.1. Business Confidence in Europe
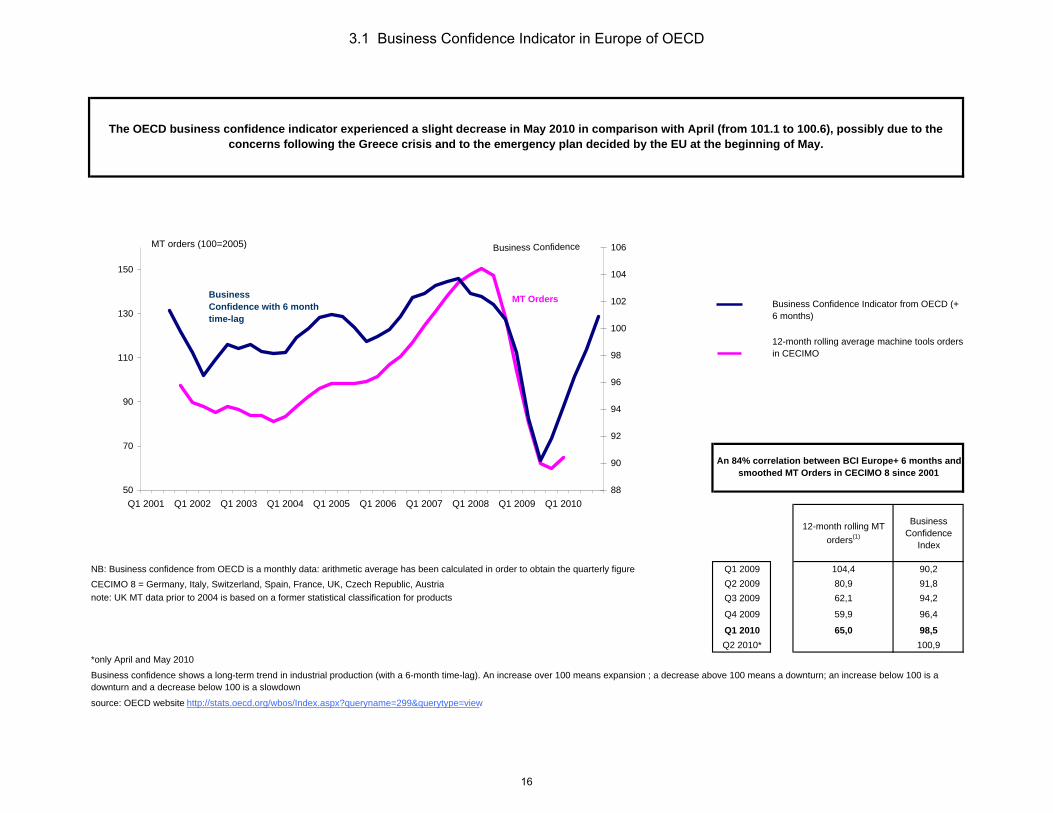
The OECD business confidence indicator experienced a slight decrease in May 2010 in comparison with April (from 101.1 to 100.6), possibly
due to concerns following the Greece crisis and to the emergency plan decided by the EU at the beginning of May.
3.2. PMI Index
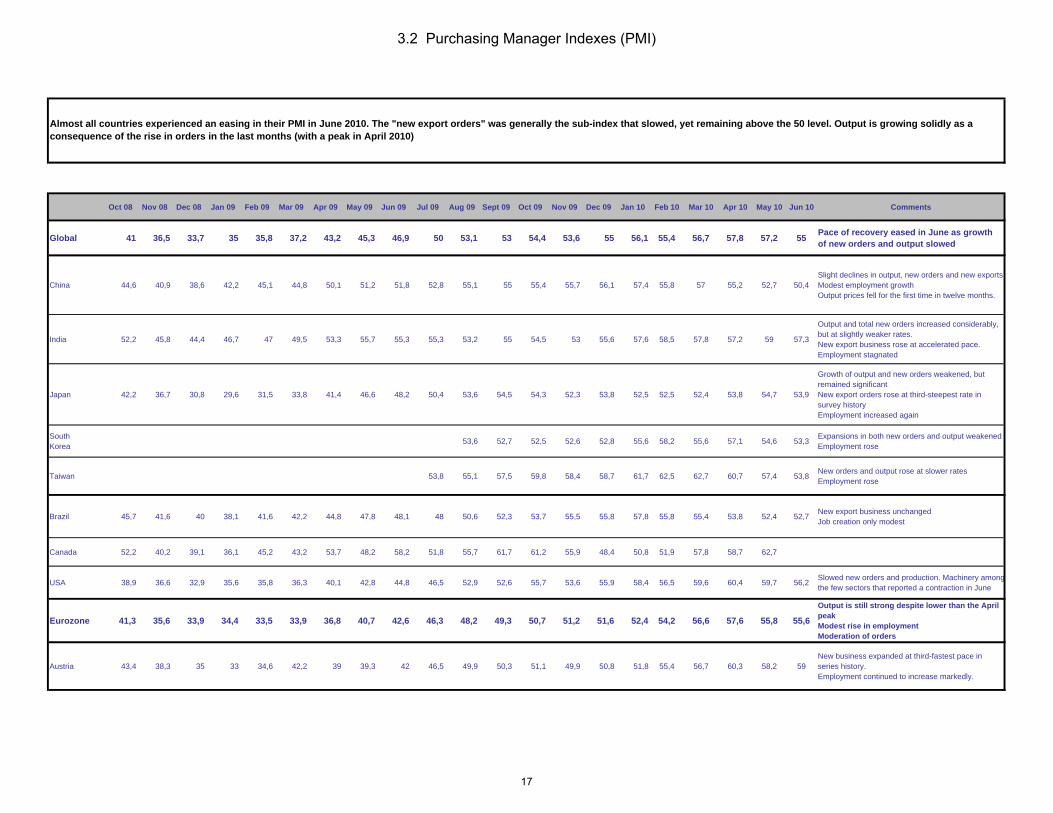
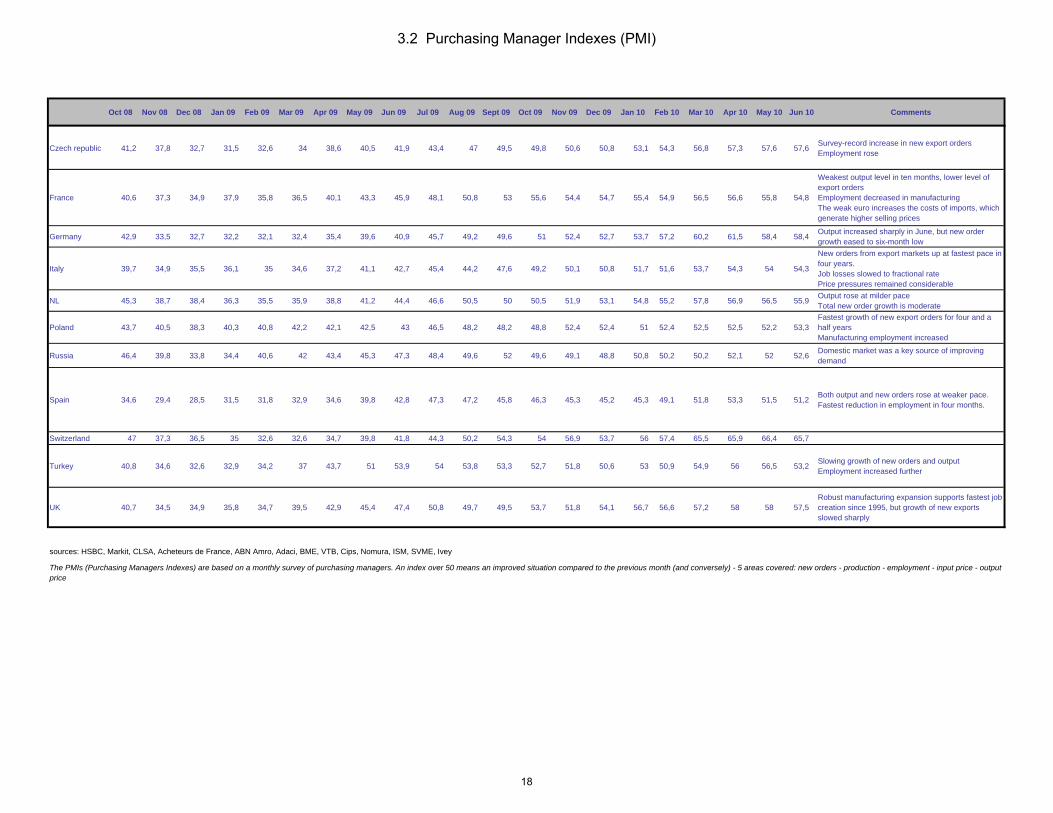
Almost all countries experienced an easing in their PMI in June 2010. The "new export orders" were generally the sub-index that slowed most,
yet remaining above the 50 level. Output is still growing solidly as a consequence of the rise in orders in the last months (with a peak in April
2010).
5
EXECUTIVE SUMMARY – CECIMO STATISTICAL TOOL BOX – JULY 2010
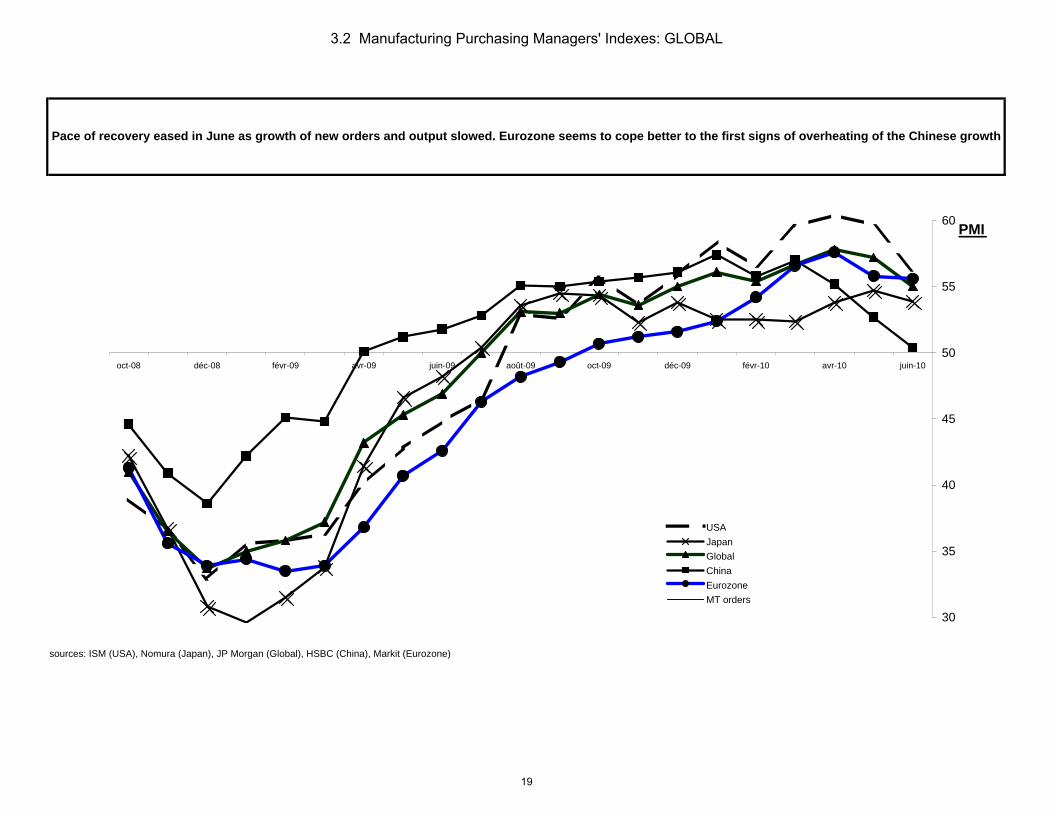
The pace of recovery is therefore easing, and may be linked to the first signs of the overheating of the Chinese economy together with the
social riots that took place last month. The latter may have generated some concerns on the sustainability and the pace of the Chinese growth.
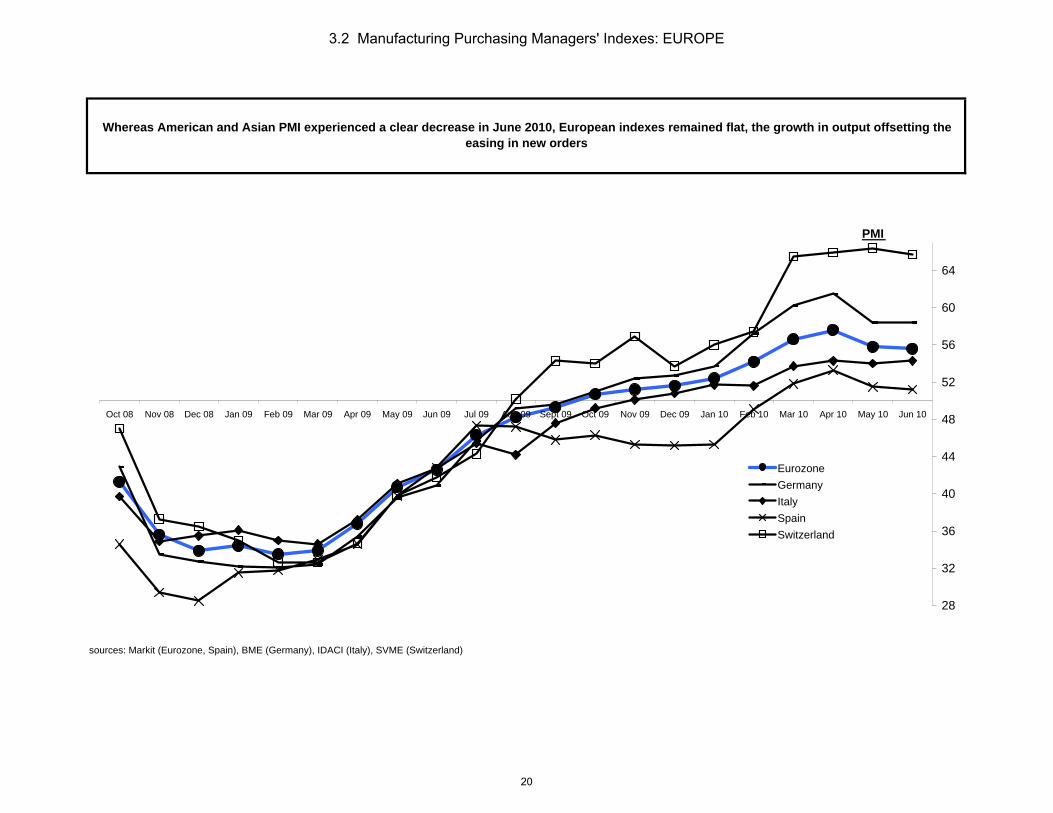
Whereas American and Asian PMI experienced a clear decrease in June 2010, European indexes remained flat, with the growth in output
offsetting the easing in new orders.
4. MT-IX
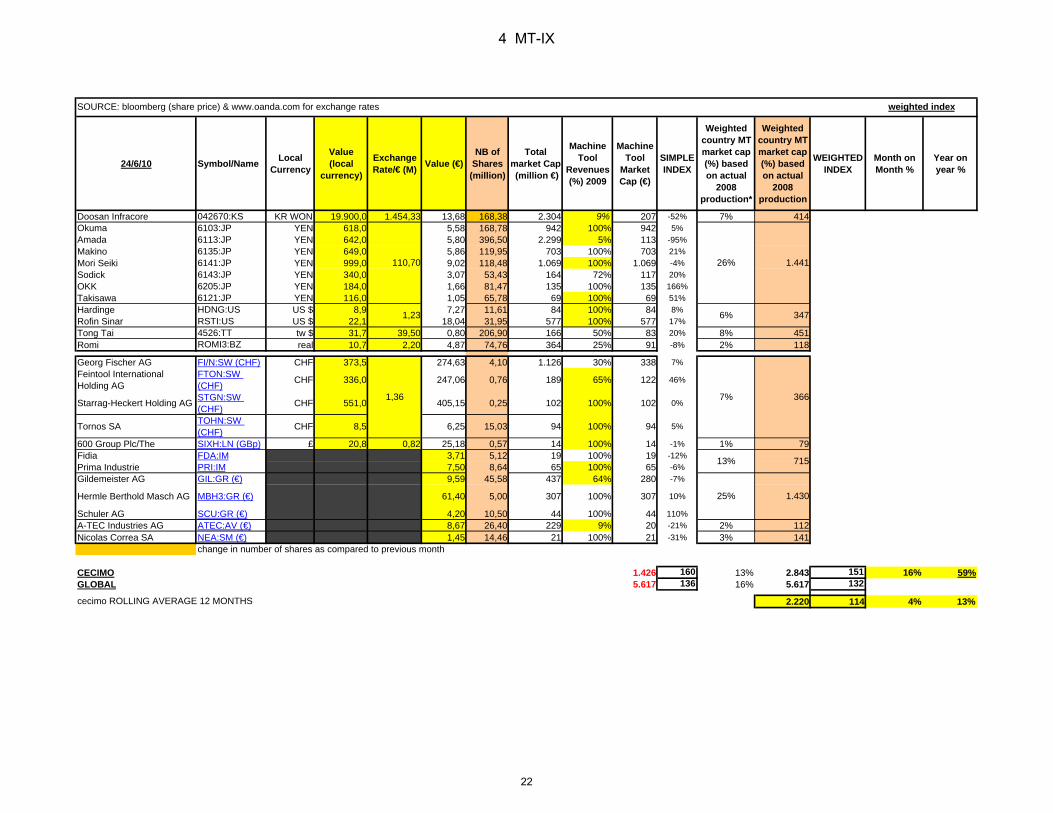
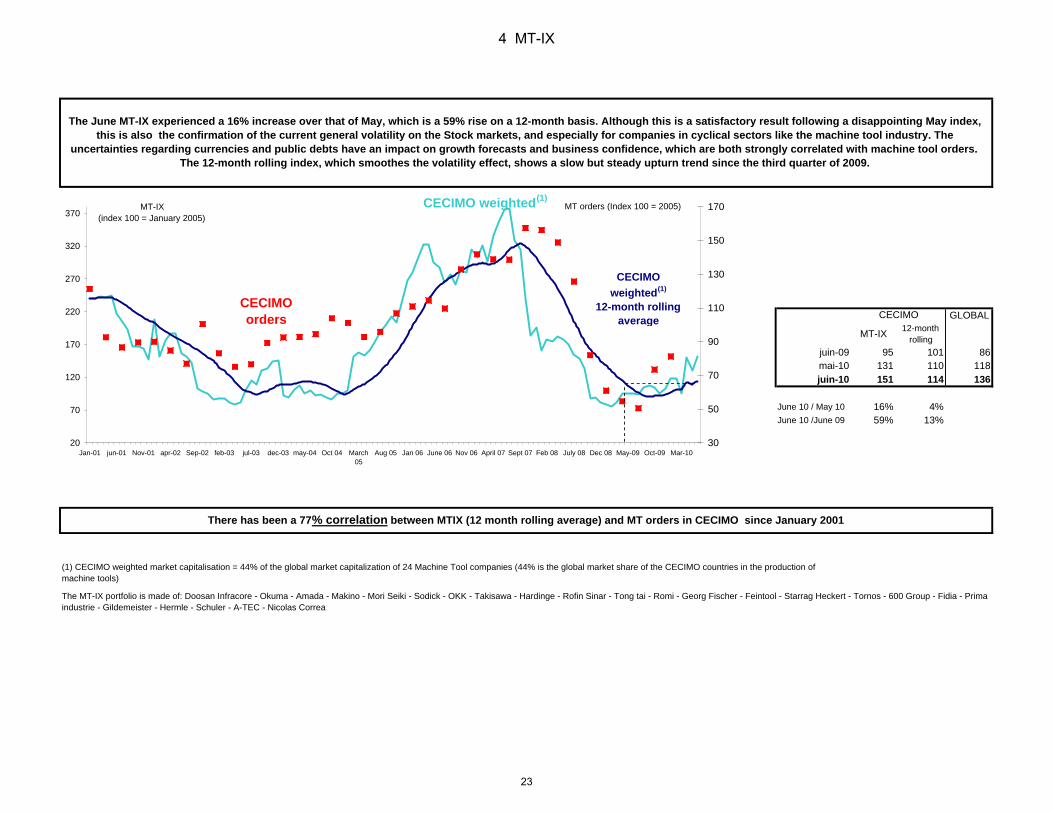
The June MT-IX saw a 16% increase over that of May, which is a 59% rise on a 12-month basis. Although this is a satisfactory result following
a disappointing May index, this is also the confirmation of the current general volatility on the Stock markets, and especially for companies in
cyclical sectors like the machine tool industry. The uncertainties regarding currencies and public debts have an impact on growth forecasts and
business confidence, which are both strongly correlated with machine tool orders. The 12-month rolling index, which smoothes the volatility
effect, shows a slow but steady upturn trend since the third quarter of 2009.
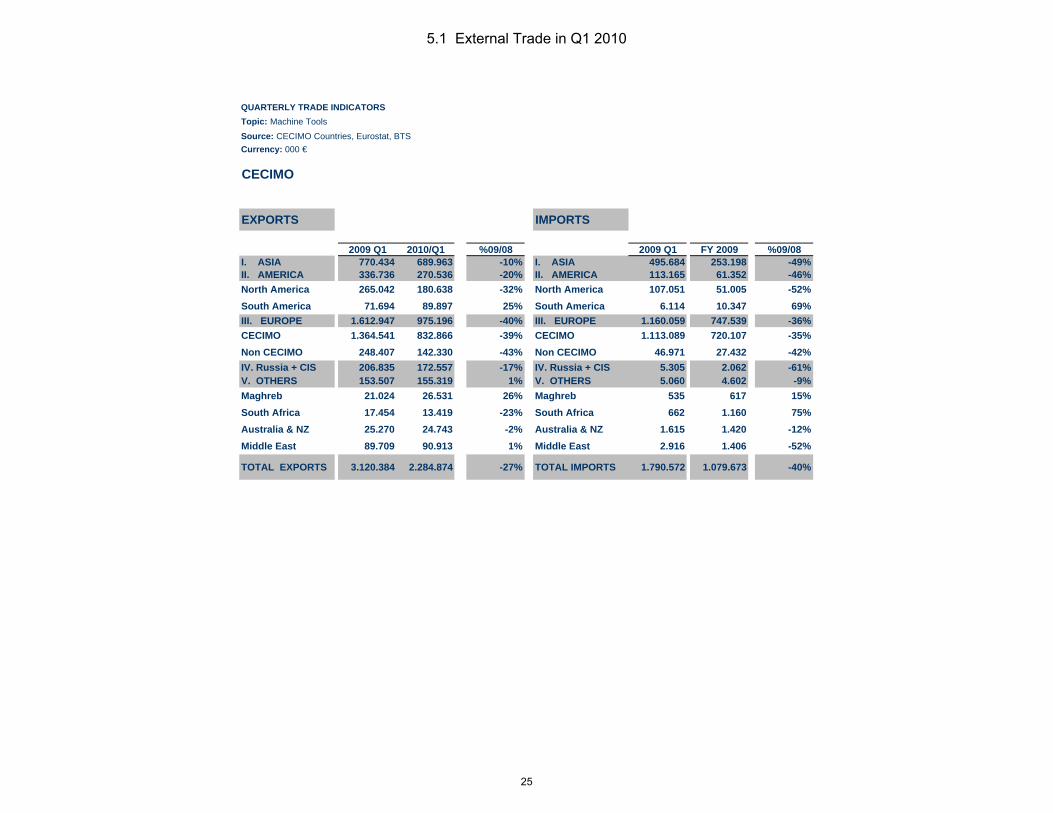
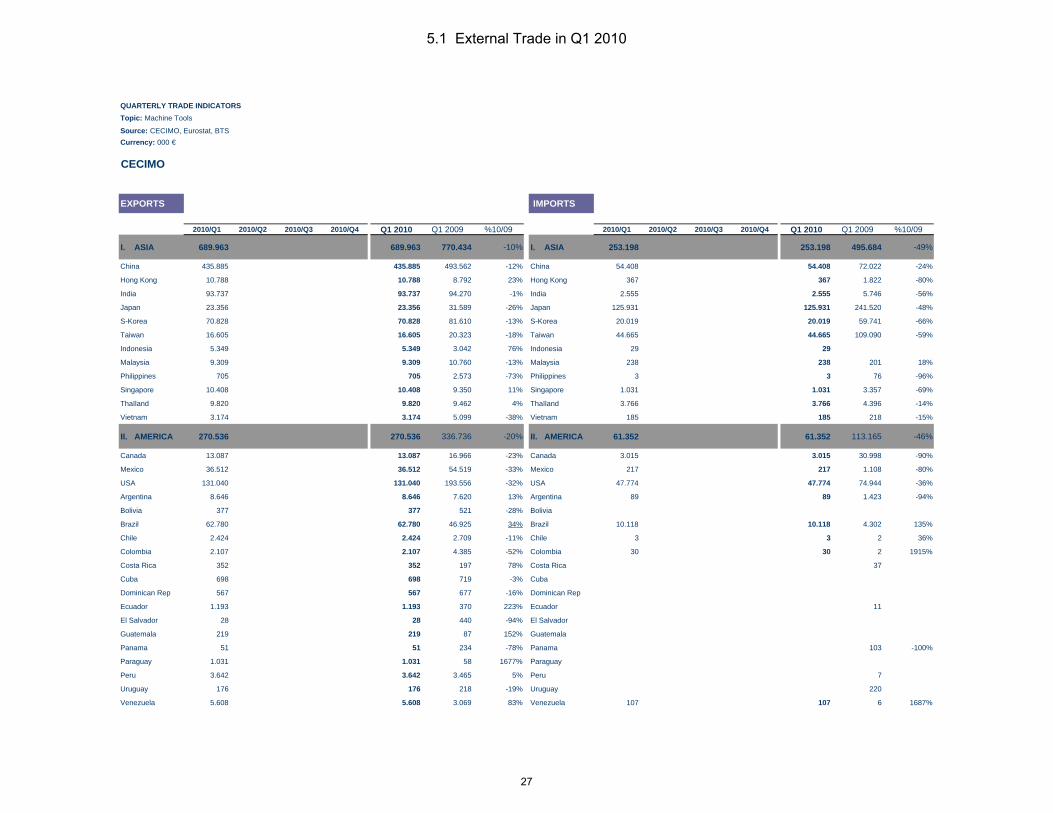
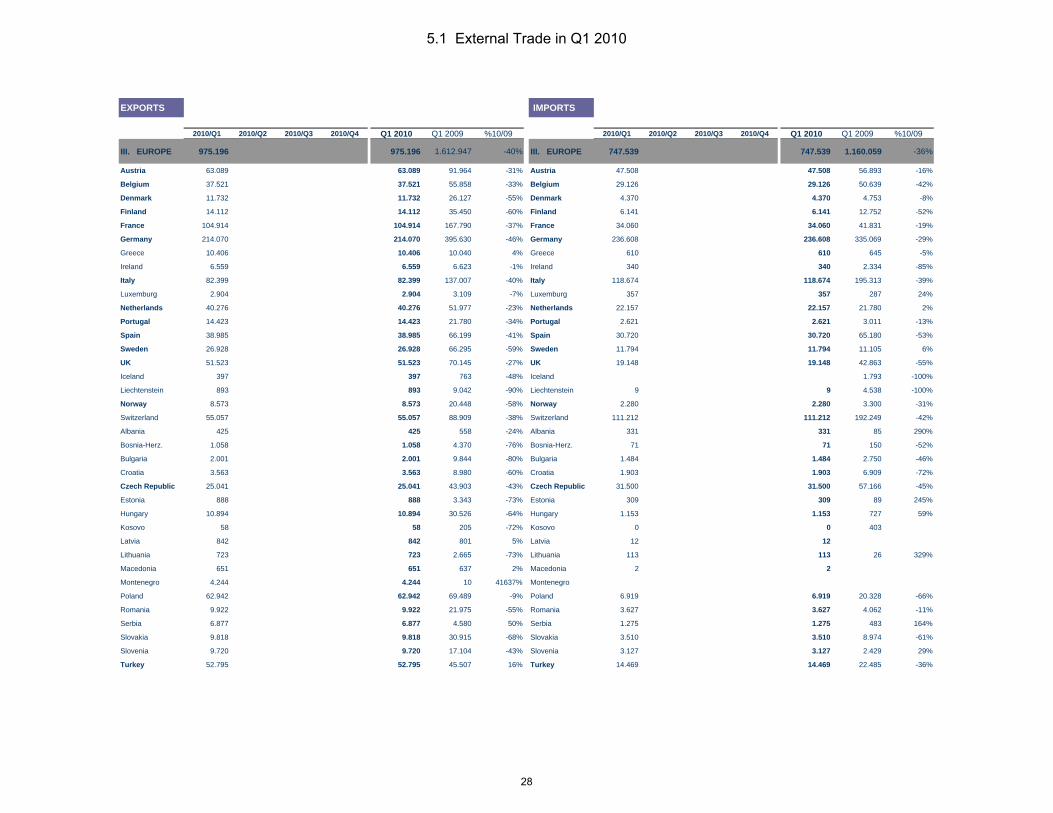
5. CECIMO External trade of machine tools in Q1 2010
After a good end of 2009 for CECIMO exports and an increase of its global market share, the first quarter of 2010 was disappointing with a 27%
decrease over the same period last year. In the same period, Japan increased its exports by 6%, confirming the upturn since the third quarter
of 2009.
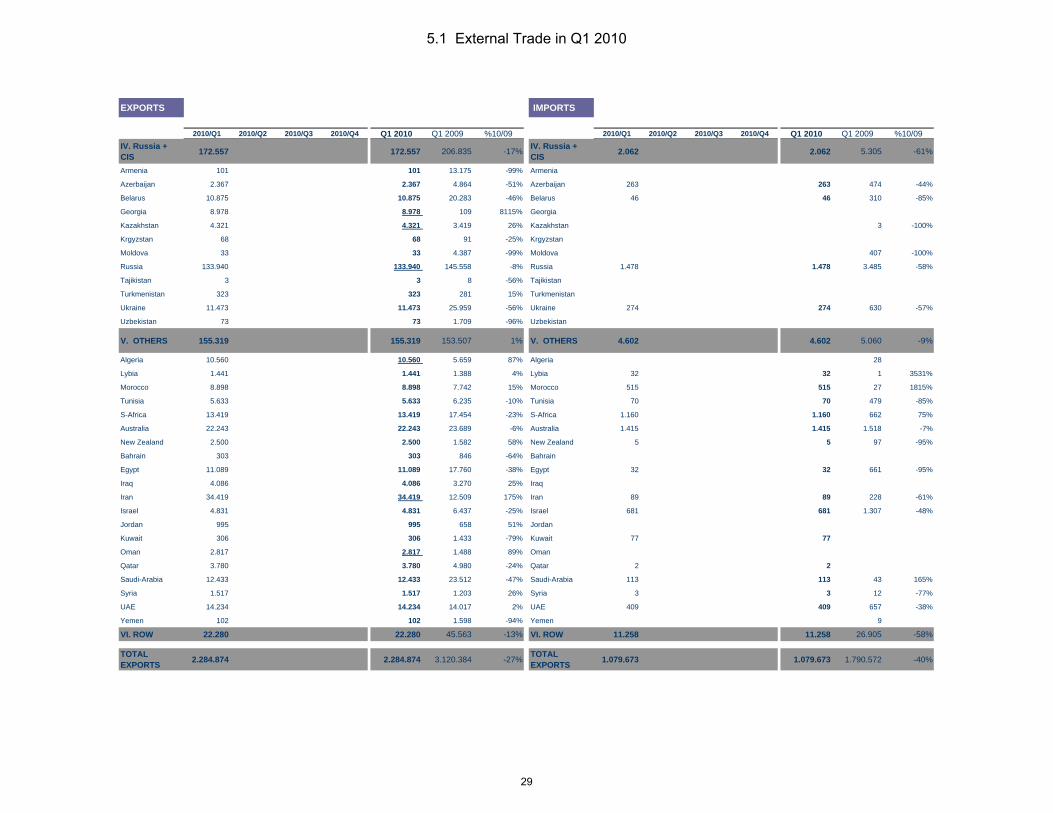
Russia surpassed the USA as the second largest client country of CECIMO in the first quarter of 2010.
Strong rise of CECIMO exports towards the Middle East countries
64% of CECIMO sales outside of CECIMO countries in Q1 2010 (56% in the first quarter of 2009)
6
non adj. Orders
Index(100= 2005)
Q1 2010/Q4 2009
Q1 2010/Q1 2009
Index(100= 2005)
Q1 2010/Q4 2009
Q1 2010/Q1 2009
Index(100= 2005)
Q1 2010/Q4 2009
Q1 2010/Q1 2009
CECIMO 81 11% 33% 68 -5% 25% 90 19% 40%
South Korea 124 16% 122% 120 24% 202% 132 6% 53%
Taiwan 88 57% 13% 62 11% 9% 95 70% 14%
Japan(1) 57 27% 224% 29 12% 116% 92 33% 301%
USA 69 -3% 32% 64 -3% 36% 85 -4% 23%
CECIMO domestic ordersCECIMO foreign ordersCECIMO total orders
(1) only metal cutting
TOTAL New orders Domestic orders Foreign orders
15
35
55
75
95
115
135
155
2000 2001 2002 2003 2004 2005 2006 2007 2008 2009 2010
MT orders (index 100 = 2005)
Domestic orders
Foreign orders
TOTAL
1.1 Orders per Country
7
USP.ConsultingPeter Meier dipl.Ing. ETH
22.6.10
1.2 Peter Meier's Forecast
8
USP.ConsultingPeter Meier dipl.Ing. ETH
22.6.10
1.2 Peter Meier's Forecast
9
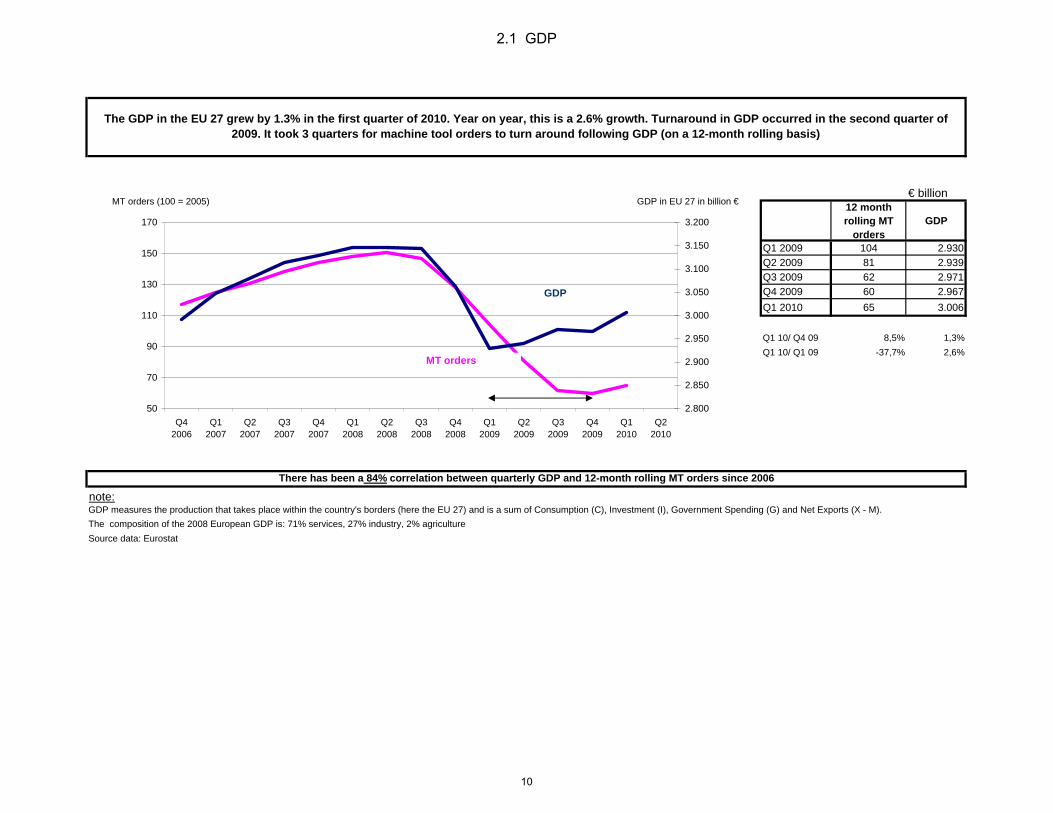
€ billion12 month rolling MT
ordersGDP
Q1 2009 104 2.930Q2 2009 81 2.939Q3 2009 62 2.971Q4 2009 60 2.967Q1 2010 65 3.006
Q1 10/ Q4 09 8,5% 1,3%Q1 10/ Q1 09 -37,7% 2,6%
note:
The composition of the 2008 European GDP is: 71% services, 27% industry, 2% agricultureSource data: Eurostat
The GDP in the EU 27 grew by 1.3% in the first quarter of 2010. Year on year, this is a 2.6% growth. Turnaround in GDP occurred in the second quarter of 2009. It took 3 quarters for machine tool orders to turn around following GDP (on a 12-month rolling basis)
GDP measures the production that takes place within the country's borders (here the EU 27) and is a sum of Consumption (C), Investment (I), Government Spending (G) and Net Exports (X - M).
There has been a 84% correlation between quarterly GDP and 12-month rolling MT orders since 2006
50
70
90
110
130
150
170
Q42006
Q12007
Q22007
Q32007
Q42007
Q12008
Q22008
Q32008
Q42008
Q12009
Q22009
Q32009
Q42009
Q12010
Q22010
MT orders (100 = 2005)
2.800
2.850
2.900
2.950
3.000
3.050
3.100
3.150
3.200
GDP in EU 27 in billion €
GDP
MT orders
2.1 GDP
10
Euribor12-month
MT Orders(1)
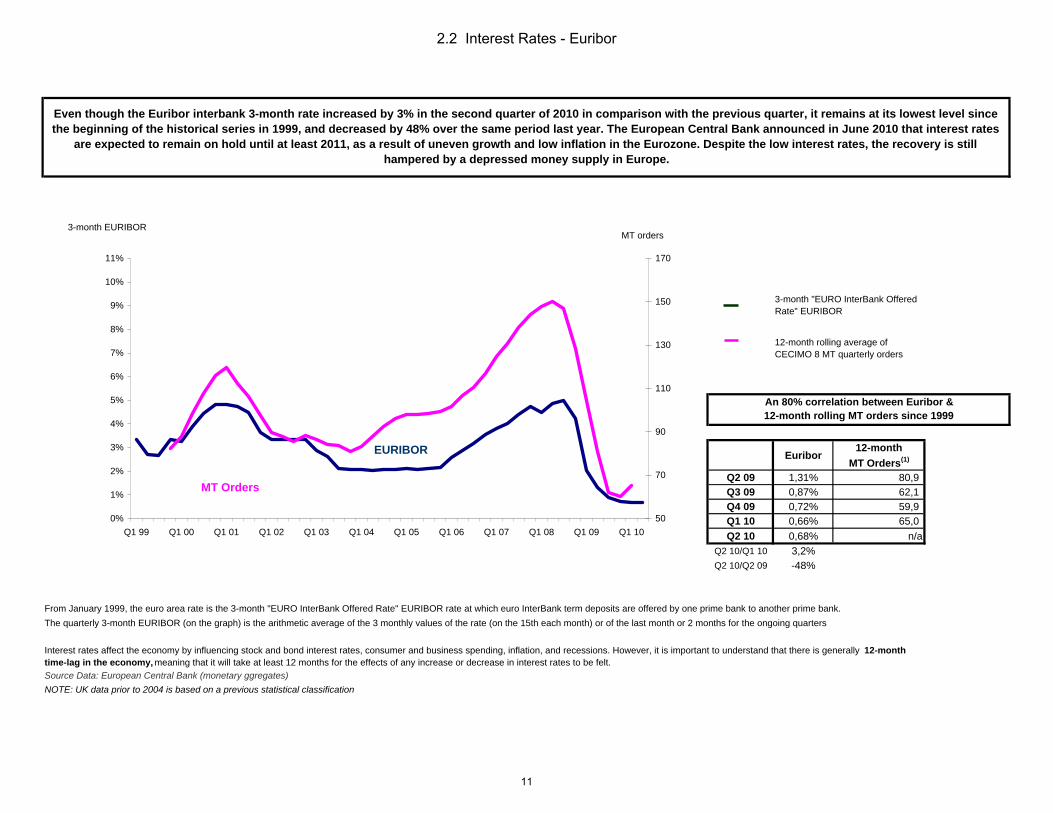
Q2 09 1,31% 80,9 Q3 09 0,87% 62,1 Q4 09 0,72% 59,9 Q1 10 0,66% 65,0 Q2 10 0,68% n/a
Q2 10/Q1 10 3,2%Q2 10/Q2 09 -48%
Source Data: European Central Bank (monetary ggregates)
The quarterly 3-month EURIBOR (on the graph) is the arithmetic average of the 3 monthly values of the rate (on the 15th each month) or of the last month or 2 months for the ongoing quarters
Interest rates affect the economy by influencing stock and bond interest rates, consumer and business spending, inflation, and recessions. However, it is important to understand that there is generally 12-month time-lag in the economy, meaning that it will take at least 12 months for the effects of any increase or decrease in interest rates to be felt.
NOTE: UK data prior to 2004 is based on a previous statistical classification
From January 1999, the euro area rate is the 3-month "EURO InterBank Offered Rate" EURIBOR rate at which euro InterBank term deposits are offered by one prime bank to another prime bank.
Even though the Euribor interbank 3-month rate increased by 3% in the second quarter of 2010 in comparison with the previous quarter, it remains at its lowest level since the beginning of the historical series in 1999, and decreased by 48% over the same period last year. The European Central Bank announced in June 2010 that interest rates
are expected to remain on hold until at least 2011, as a result of uneven growth and low inflation in the Eurozone. Despite the low interest rates, the recovery is still hampered by a depressed money supply in Europe.
3-month "EURO InterBank Offered Rate" EURIBOR
12-month rolling average of CECIMO 8 MT quarterly orders
An 80% correlation between Euribor & 12-month rolling MT orders since 1999
0%
1%
2%
3%
4%
5%
6%
7%
8%
9%
10%
11%
Q1 99 Q1 00 Q1 01 Q1 02 Q1 03 Q1 04 Q1 05 Q1 06 Q1 07 Q1 08 Q1 09 Q1 10
3-month EURIBOR
50
70
90
110
130
150
170
MT orders
EURIBOR
MT Orders
2.2 Interest Rates - Euribor
11
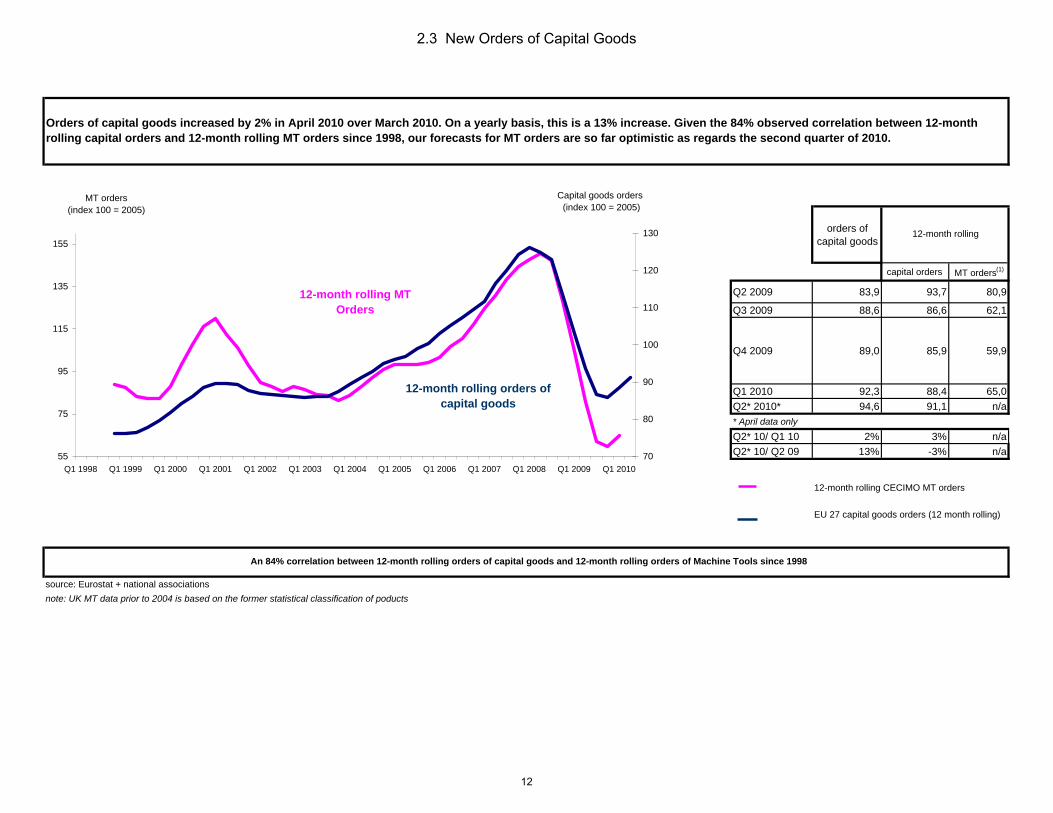
orders of capital goods
capital orders MT orders(1)
Q2 2009 83,9 93,7 80,9
Q3 2009 88,6 86,6 62,1
Q4 2009 89,0 85,9 59,9
Q1 2010 92,3 88,4 65,0Q2* 2010* 94,6 91,1 n/a* April data only
Q2* 10/ Q1 10 2% 3% n/aQ2* 10/ Q2 09 13% -3% n/a
source: Eurostat + national associationsnote: UK MT data prior to 2004 is based on the former statistical classification of poducts
An 84% correlation between 12-month rolling orders of capital goods and 12-month rolling orders of Machine Tools since 1998
Orders of capital goods increased by 2% in April 2010 over March 2010. On a yearly basis, this is a 13% increase. Given the 84% observed correlation between 12-month rolling capital orders and 12-month rolling MT orders since 1998, our forecasts for MT orders are so far optimistic as regards the second quarter of 2010.
12-month rolling
12-month rolling CECIMO MT orders
EU 27 capital goods orders (12 month rolling)
55
75
95
115
135
155
Q1 1998 Q1 1999 Q1 2000 Q1 2001 Q1 2002 Q1 2003 Q1 2004 Q1 2005 Q1 2006 Q1 2007 Q1 2008 Q1 2009 Q1 2010
MT orders (index 100 = 2005)
70
80
90
100
110
120
130
Capital goods orders (index 100 = 2005)
12-month rolling MT Orders
12-month rolling orders of capital goods
2.3 New Orders of Capital Goods
12
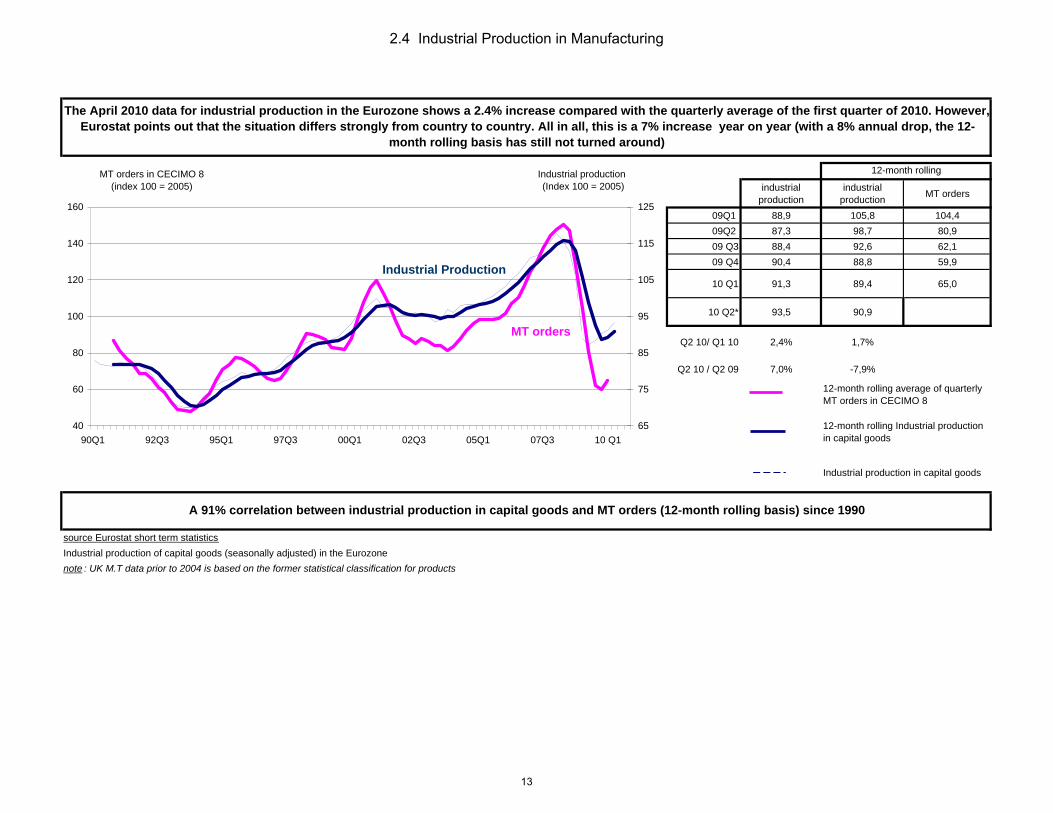
industrial production
industrial production MT orders
09Q1 88,9 105,8 104,409Q2 87,3 98,7 80,909 Q3 88,4 92,6 62,109 Q4 90,4 88,8 59,9
10 Q1 91,3 89,4 65,0
10 Q2* 93,5 90,9
Q2 10/ Q1 10 2,4% 1,7%
Q2 10 / Q2 09 7,0% -7,9%
source Eurostat short term statisticsIndustrial production of capital goods (seasonally adjusted) in the Eurozonenote : UK M.T data prior to 2004 is based on the former statistical classification for products
A 91% correlation between industrial production in capital goods and MT orders (12-month rolling basis) since 1990
The April 2010 data for industrial production in the Eurozone shows a 2.4% increase compared with the quarterly average of the first quarter of 2010. However,Eurostat points out that the situation differs strongly from country to country. All in all, this is a 7% increase year on year (with a 8% annual drop, the 12-
month rolling basis has still not turned around)
12-month rolling average of quarterly MT orders in CECIMO 8
12-month rolling Industrial production in capital goods
Industrial production in capital goods
12-month rolling
40
60
80
100
120
140
160
90Q1 92Q3 95Q1 97Q3 00Q1 02Q3 05Q1 07Q3 10 Q1
MT orders in CECIMO 8 (index 100 = 2005)
65
75
85
95
105
115
125
Industrial production (Index 100 = 2005)
MT orders
Industrial Production
2.4 Industrial Production in Manufacturing
13
in € billion index 100 = 2005Gross Fixed Capital
Formation12-month rolling MT
orders08Q4 480,6 128,209Q1 453,4 104,409Q2 443,5 80,909 Q3 437,6 62,109 Q4 432,1 59,910 Q1 427,4 65,0
Q1 10/ Q4 09 -1% 8%
Q1 10/ Q1 09 -6% -38%
(1) product acquisitions, less disposals, of fixed assets in EurozoneCECIMO 8 = Germany, Italy, Switzerland, Spain, France, UK, Czech Republic, Austria
Fluctuations in this indicator are often considered to show something about future business activity and the pattern of economic growth. GFCF is a component of the expenditure on GDP.
NB: it does not take the second-hand market into accountnote: UK MT data prior to 2004 is based on a former statistical classification
A 73% correlation between the Gross Fixed Capital Formation and the orders of new Machine Tools since 1995
12-month rolling average of quarterly MT orders in CECIMO 8
Gross Fixed Capital Formation(1) - GFCF
The Gross Fixed Capital Formation has not turned around yet. Although it appears that investment in capital goods has experienced a rebound, investments from the public sector and from households (that are also included in GFCF) have slowed down the recovery of the aggregated indicator.
250
300
350
400
450
500
1995Q1 1996Q2 1997Q3 1998Q4 2000Q1 2001Q2 2002Q3 2003Q4 2005Q1 2006Q2 2007Q3 2008Q4 2010 Q1
Gross Fixed Capital Formation in Eurozone
(billion €)
50
70
90
110
130
150
MT Orders (index 100 = 2005)
2.5 Gross Fixed Capital Formation (GFCF)
14
Net demand for loans* MT orders
Q2 09 -33% 54,7Q3 09 -29% 50,5Q4 09 -20% 73,4Q1 10 -8% 81,3
Q2* 10 -13% n/a* only April
% of banks mentioning increased demand for credit (if negative, it means a falling demand for credits) + 6 months
Quarterly CECIMO MT orders % of banks mentioning increased demand for credit (if negative, it means a falling demand for credits)
source: European Central Bank
The net demand for company loans decreased in the second quarter of 2010 (based on the April bank lending survey) after a continuous growth since the beginning of 2009. Given the 86% correlation observed with this indicator + 6 months, this may be a warning for the trend in Machine Tool orders at the end of 2010. There may be a risk that the current depressed monetary supply and the global financial instability impact the recovery in
the machine tool sector
There is an 86% correlation between both the net demand for loans + 6 months and the Quarterly MT orders since 2003: it means that when demand for loans turns around, it takes an average 6 months for Machine Tool orders to turn around
-60%
-40%
-20%
0%
20%
40%
60%
Q1 03 Q3 03 Q1 04 Q3 04 Q1 05 Q3 05 Q1 06 Q3 06 Q1 07 Q3 07 Q1 08 Q3 08 Q1 09 Q3 09 Q1 10 Q3 10
Net demand for loans
0
20
40
60
80
100
120
140
160
180MT orders
2.7 Bank Lending Survey
15
12-month rolling MT orders(1)
Business Confidence
Index
NB: Business confidence from OECD is a monthly data: arithmetic average has been calculated in order to obtain the quarterly figure Q1 2009 104,4 90,2CECIMO 8 = Germany, Italy, Switzerland, Spain, France, UK, Czech Republic, Austria Q2 2009 80,9 91,8
Q3 2009 62,1 94,2
Q4 2009 59,9 96,4
Q1 2010 65,0 98,5Q2 2010* 100,9
*only April and May 2010
source: OECD website http://stats.oecd.org/wbos/Index.aspx?queryname=299&querytype=view
The OECD business confidence indicator experienced a slight decrease in May 2010 in comparison with April (from 101.1 to 100.6), possibly due to the concerns following the Greece crisis and to the emergency plan decided by the EU at the beginning of May.
An 84% correlation between BCI Europe+ 6 months and smoothed MT Orders in CECIMO 8 since 2001
Business confidence shows a long-term trend in industrial production (with a 6-month time-lag). An increase over 100 means expansion ; a decrease above 100 means a downturn; an increase below 100 is a downturn and a decrease below 100 is a slowdown
Business Confidence Indicator from OECD (+ 6 months)
12-month rolling average machine tools ordersin CECIMO
note: UK MT data prior to 2004 is based on a former statistical classification for products
50
70
90
110
130
150
Q1 2001 Q1 2002 Q1 2003 Q1 2004 Q1 2005 Q1 2006 Q1 2007 Q1 2008 Q1 2009 Q1 2010
MT orders (100=2005)
88
90
92
94
96
98
100
102
104
106Business Confidence
Business Confidence with 6 month time-lag
MT Orders
3.1 Business Confidence Indicator in Europe of OECD
16
Oct 08 Nov 08 Dec 08 Jan 09 Feb 09 Mar 09 Apr 09 May 09 Jun 09 Jul 09 Aug 09 Sept 09 Oct 09 Nov 09 Dec 09 Jan 10 Feb 10 Mar 10 Apr 10 May 10 Jun 10 Comments
Global 41 36,5 33,7 35 35,8 37,2 43,2 45,3 46,9 50 53,1 53 54,4 53,6 55 56,1 55,4 56,7 57,8 57,2 55 Pace of recovery eased in June as growth of new orders and output slowed
China 44,6 40,9 38,6 42,2 45,1 44,8 50,1 51,2 51,8 52,8 55,1 55 55,4 55,7 56,1 57,4 55,8 57 55,2 52,7 50,4Slight declines in output, new orders and new exportsModest employment growthOutput prices fell for the first time in twelve months.
India 52,2 45,8 44,4 46,7 47 49,5 53,3 55,7 55,3 55,3 53,2 55 54,5 53 55,6 57,6 58,5 57,8 57,2 59 57,3
Output and total new orders increased considerably, but at slightly weaker rates.New export business rose at accelerated pace.Employment stagnated
Japan 42,2 36,7 30,8 29,6 31,5 33,8 41,4 46,6 48,2 50,4 53,6 54,5 54,3 52,3 53,8 52,5 52,5 52,4 53,8 54,7 53,9
Growth of output and new orders weakened, but remained significantNew export orders rose at third-steepest rate in survey historyEmployment increased again
South Korea 53,6 52,7 52,5 52,6 52,8 55,6 58,2 55,6 57,1 54,6 53,3 Expansions in both new orders and output weakened
Employment rose
Taiwan 53,8 55,1 57,5 59,8 58,4 58,7 61,7 62,5 62,7 60,7 57,4 53,8 New orders and output rose at slower ratesEmployment rose
Brazil 45,7 41,6 40 38,1 41,6 42,2 44,8 47,8 48,1 48 50,6 52,3 53,7 55,5 55,8 57,8 55,8 55,4 53,8 52,4 52,7 New export business unchanged Job creation only modest
Canada 52,2 40,2 39,1 36,1 45,2 43,2 53,7 48,2 58,2 51,8 55,7 61,7 61,2 55,9 48,4 50,8 51,9 57,8 58,7 62,7
USA 38,9 36,6 32,9 35,6 35,8 36,3 40,1 42,8 44,8 46,5 52,9 52,6 55,7 53,6 55,9 58,4 56,5 59,6 60,4 59,7 56,2 Slowed new orders and production. Machinery amongthe few sectors that reported a contraction in June
Eurozone 41,3 35,6 33,9 34,4 33,5 33,9 36,8 40,7 42,6 46,3 48,2 49,3 50,7 51,2 51,6 52,4 54,2 56,6 57,6 55,8 55,6
Output is still strong despite lower than the April peakModest rise in employmentModeration of orders
Austria 43,4 38,3 35 33 34,6 42,2 39 39,3 42 46,5 49,9 50,3 51,1 49,9 50,8 51,8 55,4 56,7 60,3 58,2 59New business expanded at third-fastest pace in series history.Employment continued to increase markedly.
Almost all countries experienced an easing in their PMI in June 2010. The "new export orders" was generally the sub-index that slowed, yet remaining above the 50 level. Output is growing solidly as a consequence of the rise in orders in the last months (with a peak in April 2010)
3.2 Purchasing Manager Indexes (PMI)
17
Oct 08 Nov 08 Dec 08 Jan 09 Feb 09 Mar 09 Apr 09 May 09 Jun 09 Jul 09 Aug 09 Sept 09 Oct 09 Nov 09 Dec 09 Jan 10 Feb 10 Mar 10 Apr 10 May 10 Jun 10 Comments
Czech republic 41,2 37,8 32,7 31,5 32,6 34 38,6 40,5 41,9 43,4 47 49,5 49,8 50,6 50,8 53,1 54,3 56,8 57,3 57,6 57,6 Survey-record increase in new export ordersEmployment rose
France 40,6 37,3 34,9 37,9 35,8 36,5 40,1 43,3 45,9 48,1 50,8 53 55,6 54,4 54,7 55,4 54,9 56,5 56,6 55,8 54,8
Weakest output level in ten months, lower level of export ordersEmployment decreased in manufacturing The weak euro increases the costs of imports, which generate higher selling prices
Germany 42,9 33,5 32,7 32,2 32,1 32,4 35,4 39,6 40,9 45,7 49,2 49,6 51 52,4 52,7 53,7 57,2 60,2 61,5 58,4 58,4 Output increased sharply in June, but new order growth eased to six-month low
Italy 39,7 34,9 35,5 36,1 35 34,6 37,2 41,1 42,7 45,4 44,2 47,6 49,2 50,1 50,8 51,7 51,6 53,7 54,3 54 54,3
New orders from export markets up at fastest pace in four years.Job losses slowed to fractional ratePrice pressures remained considerable
NL 45,3 38,7 38,4 36,3 35,5 35,9 38,8 41,2 44,4 46,6 50,5 50 50,5 51,9 53,1 54,8 55,2 57,8 56,9 56,5 55,9 Output rose at milder paceTotal new order growth is moderate
Poland 43,7 40,5 38,3 40,3 40,8 42,2 42,1 42,5 43 46,5 48,2 48,2 48,8 52,4 52,4 51 52,4 52,5 52,5 52,2 53,3Fastest growth of new export orders for four and a half yearsManufacturing employment increased
Russia 46,4 39,8 33,8 34,4 40,6 42 43,4 45,3 47,3 48,4 49,6 52 49,6 49,1 48,8 50,8 50,2 50,2 52,1 52 52,6 Domestic market was a key source of improving demand
Spain 34,6 29,4 28,5 31,5 31,8 32,9 34,6 39,8 42,8 47,3 47,2 45,8 46,3 45,3 45,2 45,3 49,1 51,8 53,3 51,5 51,2 Both output and new orders rose at weaker pace.Fastest reduction in employment in four months.
Switzerland 47 37,3 36,5 35 32,6 32,6 34,7 39,8 41,8 44,3 50,2 54,3 54 56,9 53,7 56 57,4 65,5 65,9 66,4 65,7
Turkey 40,8 34,6 32,6 32,9 34,2 37 43,7 51 53,9 54 53,8 53,3 52,7 51,8 50,6 53 50,9 54,9 56 56,5 53,2 Slowing growth of new orders and outputEmployment increased further
UK 40,7 34,5 34,9 35,8 34,7 39,5 42,9 45,4 47,4 50,8 49,7 49,5 53,7 51,8 54,1 56,7 56,6 57,2 58 58 57,5Robust manufacturing expansion supports fastest job creation since 1995, but growth of new exports slowed sharply
sources: HSBC, Markit, CLSA, Acheteurs de France, ABN Amro, Adaci, BME, VTB, Cips, Nomura, ISM, SVME, Ivey
The PMIs (Purchasing Managers Indexes) are based on a monthly survey of purchasing managers. An index over 50 means an improved situation compared to the previous month (and conversely) - 5 areas covered: new orders - production - employment - input price - output price
3.2 Purchasing Manager Indexes (PMI)
18
sources: ISM (USA), Nomura (Japan), JP Morgan (Global), HSBC (China), Markit (Eurozone)
Pace of recovery eased in June as growth of new orders and output slowed. Eurozone seems to cope better to the first signs of overheating of the Chinese growth
30
35
40
45
50
55
60
oct-08 déc-08 févr-09 avr-09 juin-09 août-09 oct-09 déc-09 févr-10 avr-10 juin-10
PMI
USAJapanGlobalChinaEurozoneMT orders
3.2 Manufacturing Purchasing Managers' Indexes: GLOBAL
19
sources: Markit (Eurozone, Spain), BME (Germany), IDACI (Italy), SVME (Switzerland)
Whereas American and Asian PMI experienced a clear decrease in June 2010, European indexes remained flat, the growth in output offsetting the easing in new orders
28
32
36
40
44
48
52
56
60
64
Oct 08 Nov 08 Dec 08 Jan 09 Feb 09 Mar 09 Apr 09 May 09 Jun 09 Jul 09 Aug 09 Sept 09 Oct 09 Nov 09 Dec 09 Jan 10 Feb 10 Mar 10 Apr 10 May 10 Jun 10
PMI
EurozoneGermanyItalySpainSwitzerland
3.2 Manufacturing Purchasing Managers' Indexes: EUROPE
20
sources: HSBC
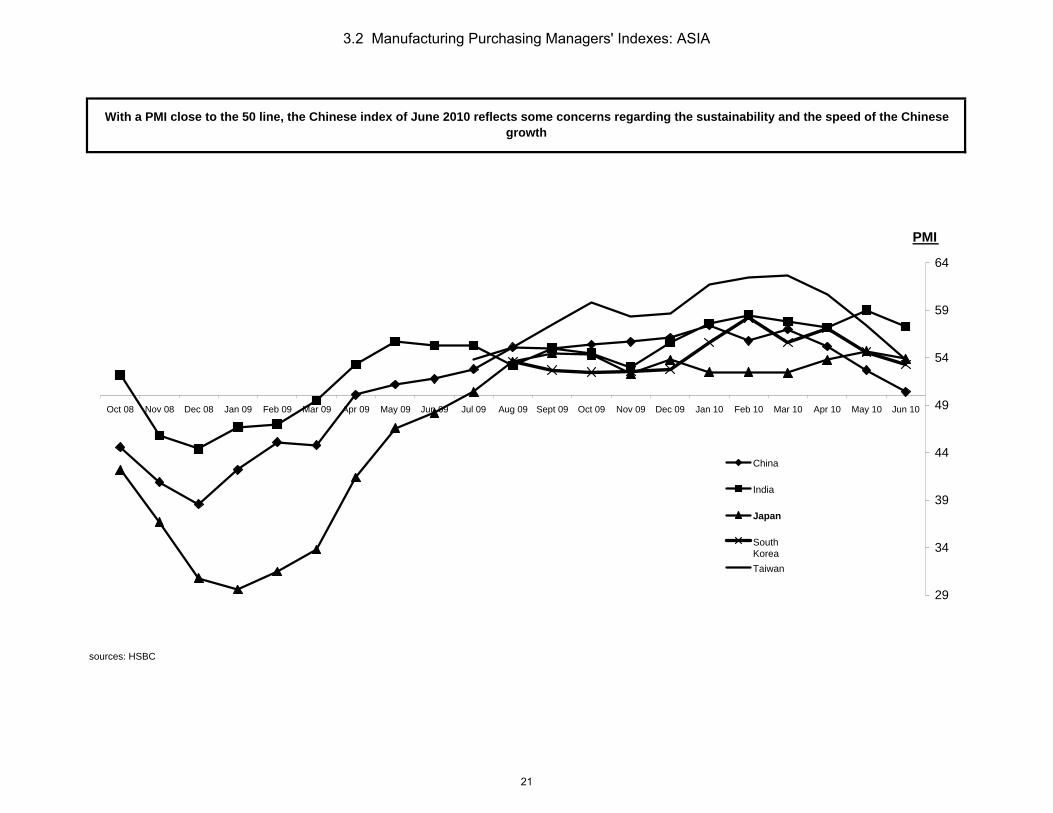
With a PMI close to the 50 line, the Chinese index of June 2010 reflects some concerns regarding the sustainability and the speed of the Chinese growth
29
34
39
44
49
54
59
64
Oct 08 Nov 08 Dec 08 Jan 09 Feb 09 Mar 09 Apr 09 May 09 Jun 09 Jul 09 Aug 09 Sept 09 Oct 09 Nov 09 Dec 09 Jan 10 Feb 10 Mar 10 Apr 10 May 10 Jun 10
PMI
China
India
Japan
South KoreaTaiwan
3.2 Manufacturing Purchasing Managers' Indexes: ASIA
21
24/6/10 Symbol/Name Local Currency
Value (local
currency)
Exchange Rate/€ (M) Value (€)
NB of Shares (million)
Total market Cap (million €)
Machine Tool
Revenues (%) 2009
Machine Tool
Market Cap (€)
SIMPLE INDEX
Weighted country MT market cap (%) based on actual
2008 production*
Weighted country MT market cap (%) based on actual
2008 production
WEIGHTED INDEX
Month on Month %
Year on year %
Doosan Infracore 042670:KS KR WON 19.900,0 1.454,33 13,68 168,38 2.304 9% 207 -52% 7% 414Okuma 6103:JP YEN 618,0 5,58 168,78 942 100% 942 5%Amada 6113:JP YEN 642,0 5,80 396,50 2.299 5% 113 -95%Makino 6135:JP YEN 649,0 5,86 119,95 703 100% 703 21%Mori Seiki 6141:JP YEN 999,0 9,02 118,48 1.069 100% 1.069 -4%Sodick 6143:JP YEN 340,0 3,07 53,43 164 72% 117 20%OKK 6205:JP YEN 184,0 1,66 81,47 135 100% 135 166%Takisawa 6121:JP YEN 116,0 1,05 65,78 69 100% 69 51%Hardinge HDNG:US US $ 8,9 7,27 11,61 84 100% 84 8%Rofin Sinar RSTI:US US $ 22,1 18,04 31,95 577 100% 577 17%Tong Tai 4526:TT tw $ 31,7 39,50 0,80 206,90 166 50% 83 20% 8% 451Romi ROMI3:BZ real 10,7 2,20 4,87 74,76 364 25% 91 -8% 2% 118
Georg Fischer AG FI/N:SW (CHF) CHF 373,5 274,63 4,10 1.126 30% 338 7%Feintool International Holding AG
FTON:SW (CHF) CHF 336,0 247,06 0,76 189 65% 122 46%
Starrag-Heckert Holding AG STGN:SW (CHF) CHF 551,0 405,15 0,25 102 100% 102 0%
Tornos SA TOHN:SW (CHF) CHF 8,5 6,25 15,03 94 100% 94 5%
600 Group Plc/The SIXH:LN (GBp) £ 20,8 0,82 25,18 0,57 14 100% 14 -1% 1% 79Fidia FDA:IM 3,71 5,12 19 100% 19 -12%Prima Industrie PRI:IM 7,50 8,64 65 100% 65 -6%Gildemeister AG GIL:GR (€) 9,59 45,58 437 64% 280 -7%
Hermle Berthold Masch AG MBH3:GR (€) 61,40 5,00 307 100% 307 10%
Schuler AG SCU:GR (€) 4,20 10,50 44 100% 44 110%A-TEC Industries AG ATEC:AV (€) 8,67 26,40 229 9% 20 -21% 2% 112Nicolas Correa SA NEA:SM (€) 1,45 14,46 21 100% 21 -31% 3% 141
CECIMO 2.647 54% 1.426 160 13% 2.843 151 16% 59%GLOBAL 11.524 49% 5.617 136 16% 5.617 132
1.229 2.220 114 4% 13%
715
7%
13%
weighted index
cecimo ROLLING AVERAGE 12 MONTHS
1.43025%
change in number of shares as compared to previous month
SOURCE: bloomberg (share price) & www.oanda.com for exchange rates
1.441
347
366
26%
6%
110,70
1,23
1,36
4 MT-IX
22
GLOBAL
MT-IX 12-month rolling
juin-09 95 101 86mai-10 131 110 118juin-10 151 114 136
June 10 / May 10 16% 4%June 10 /June 09 59% 13%
The MT-IX portfolio is made of: Doosan Infracore - Okuma - Amada - Makino - Mori Seiki - Sodick - OKK - Takisawa - Hardinge - Rofin Sinar - Tong tai - Romi - Georg Fischer - Feintool - Starrag Heckert - Tornos - 600 Group - Fidia - Prima industrie - Gildemeister - Hermle - Schuler - A-TEC - Nicolas Correa
(1) CECIMO weighted market capitalisation = 44% of the global market capitalization of 24 Machine Tool companies (44% is the global market share of the CECIMO countries in the production of machine tools)
The June MT-IX experienced a 16% increase over that of May, which is a 59% rise on a 12-month basis. Although this is a satisfactory result following a disappointing May index, this is also the confirmation of the current general volatility on the Stock markets, and especially for companies in cyclical sectors like the machine tool industry. The
uncertainties regarding currencies and public debts have an impact on growth forecasts and business confidence, which are both strongly correlated with machine tool orders. The 12-month rolling index, which smoothes the volatility effect, shows a slow but steady upturn trend since the third quarter of 2009.
CECIMO
There has been a 77% correlation between MTIX (12 month rolling average) and MT orders in CECIMO since January 2001
20
70
120
170
220
270
320
370
Jan-01 jun-01 Nov-01 apr-02 Sep-02 feb-03 jul-03 dec-03 may-04 Oct 04 March05
Aug 05 Jan 06 June 06 Nov 06 April 07 Sept 07 Feb 08 July 08 Dec 08 May-09 Oct-09 Mar-10
MT-IX (index 100 = January 2005)
30
50
70
90
110
130
150
170MT orders (Index 100 = 2005)CECIMO weighted(1)
CECIMO weighted(1)
12-month rolling average
CECIMO orders
4 MT-IX
23

in million €2010
ranking2009
ranking 2010 Q1 % total Growth 10/09 (%)
1 1 China & HK 446,7 30,8% -12%2 3 Russia 133,9 9,2% -8%3 2 USA 131,0 9,0% -32%4 4 India 93,7 6,5% -1%5 6 S. Korea 70,8 4,9% -13%6 5 Poland 62,9 4,3% -9%7 7 Brazil 62,8 4,3% 34%8 8 Mexico 36,5 2,5% -33%9 20 Iran 34,4 2,4% 175%
10 12 Maghreb 26,5 1,8% 26%11 15 Australia + NZ 24,7 1,7% -2%12 9 Japan 23,4 1,6% -26%13 Taiwan 16,6 1,1% -18%14 14 United Arab Emirates 14,2 1,0% 2%15 South Africa 13,4 0,9% -23%16 Canada 13,1 0,9% -23%17 18 Saudi Arabia 12,4 0,9% -47%18 16 Ukraine 11,5 0,8% -56%19 17 Egypt 11,1 0,8% -38%20 11 Hungary 10,9 0,8% -64%
Total cecimo exports 2.285Total to non CECIMO countries 1.452
Exports to non CECIMO countries in % of total exports 145200772%
source : CECIMO associations and Eurostat
Russia surpassed the USA as the second largest client country of CECIMO in the first quarter of 2010. The strong rise of Middle East countries (Iran first) needs to be noticed. 64% of CECIMO sales occured outside of CECIMO countries in Q1 2010 (56% in the first quarter of 2009)
5.1 External Trade in Q1 2010
24
QUARTERLY TRADE INDICATORSTopic: Machine Tools
Source: CECIMO Countries, Eurostat, BTSCurrency: 000 €
CECIMO
EXPORTS IMPORTS
2009 Q1 2010/Q1 %09/08 2009 Q1 FY 2009 %09/08I. ASIA 770.434 689.963 -10% I. ASIA 495.684 253.198 -49%II. AMERICA 336.736 270.536 -20% II. AMERICA 113.165 61.352 -46%North America 265.042 180.638 -32% North America 107.051 51.005 -52%South America 71.694 89.897 25% South America 6.114 10.347 69%III. EUROPE 1.612.947 975.196 -40% III. EUROPE 1.160.059 747.539 -36%CECIMO 1.364.541 832.866 -39% CECIMO 1.113.089 720.107 -35%Non CECIMO 248.407 142.330 -43% Non CECIMO 46.971 27.432 -42%IV. Russia + CIS 206.835 172.557 -17% IV. Russia + CIS 5.305 2.062 -61%V. OTHERS 153.507 155.319 1% V. OTHERS 5.060 4.602 -9%Maghreb 21.024 26.531 26% Maghreb 535 617 15%South Africa 17.454 13.419 -23% South Africa 662 1.160 75%Australia & NZ 25.270 24.743 -2% Australia & NZ 1.615 1.420 -12%Middle East 89.709 90.913 1% Middle East 2.916 1.406 -52%
TOTAL EXPORTS 3.120.384 2.284.874 -27% TOTAL IMPORTS 1.790.572 1.079.673 -40%
5.1 External Trade in Q1 2010
25
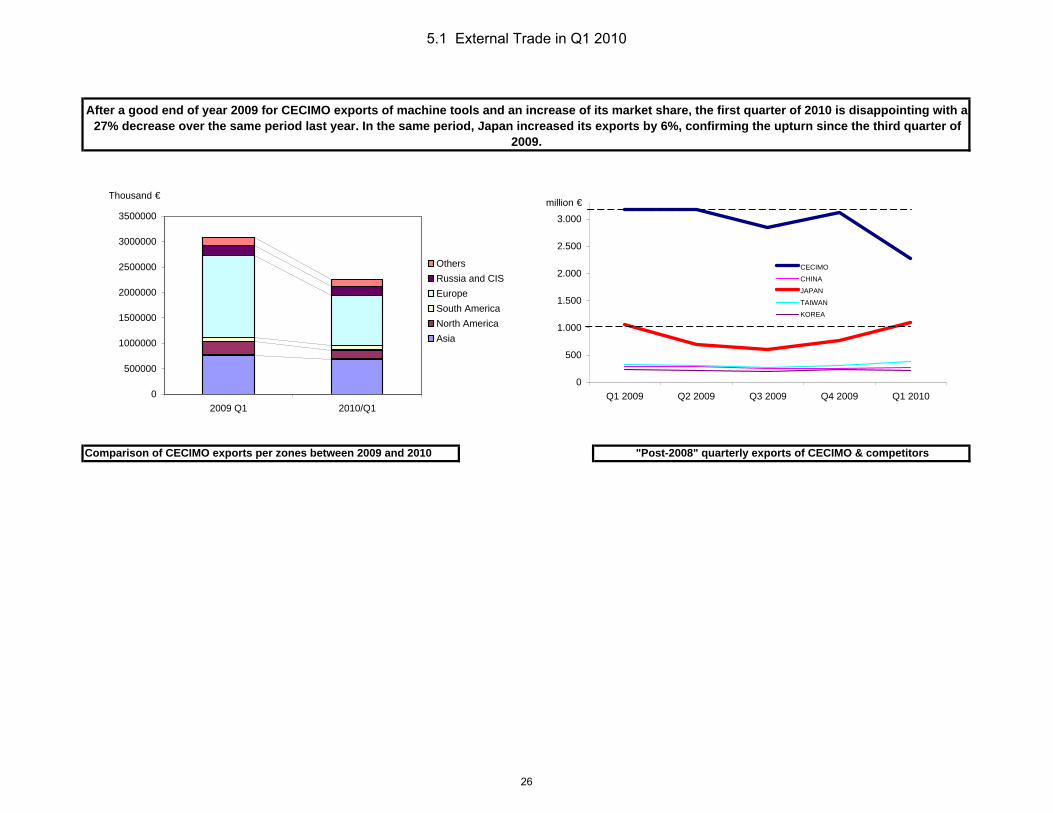
Comparison of CECIMO exports per zones between 2009 and 2010
After a good end of year 2009 for CECIMO exports of machine tools and an increase of its market share, the first quarter of 2010 is disappointing with a 27% decrease over the same period last year. In the same period, Japan increased its exports by 6%, confirming the upturn since the third quarter of
2009.
"Post-2008" quarterly exports of CECIMO & competitors
0
500
1.000
1.500
2.000
2.500
3.000
Q1 2009 Q2 2009 Q3 2009 Q4 2009 Q1 2010
million €
CECIMO
CHINA
JAPAN
TAIWAN
KOREA
0
500000
1000000
1500000
2000000
2500000
3000000
3500000
2009 Q1 2010/Q1
Thousand €
OthersRussia and CISEuropeSouth AmericaNorth AmericaAsia
5.1 External Trade in Q1 2010
26
QUARTERLY TRADE INDICATORSTopic: Machine Tools
Source: CECIMO, Eurostat, BTSCurrency: 000 €
CECIMO
EXPORTS IMPORTS
2010/Q1 2010/Q2 2010/Q3 2010/Q4 Q1 2010 Q1 2009 %10/09 2010/Q1 2010/Q2 2010/Q3 2010/Q4 Q1 2010 Q1 2009 %10/09
I. ASIA 689.963 689.963 770.434 -10% I. ASIA 253.198 253.198 495.684 -49%
China 435.885 435.885 493.562 -12% China 54.408 54.408 72.022 -24%
Hong Kong 10.788 10.788 8.792 23% Hong Kong 367 367 1.822 -80%
India 93.737 93.737 94.270 -1% India 2.555 2.555 5.746 -56%
Japan 23.356 23.356 31.589 -26% Japan 125.931 125.931 241.520 -48%
S-Korea 70.828 70.828 81.610 -13% S-Korea 20.019 20.019 59.741 -66%
Taiwan 16.605 16.605 20.323 -18% Taiwan 44.665 44.665 109.090 -59%
Indonesia 5.349 5.349 3.042 76% Indonesia 29 29
Malaysia 9.309 9.309 10.760 -13% Malaysia 238 238 201 18%
Philippines 705 705 2.573 -73% Philippines 3 3 76 -96%
Singapore 10.408 10.408 9.350 11% Singapore 1.031 1.031 3.357 -69%
Thaïland 9.820 9.820 9.462 4% Thaïland 3.766 3.766 4.396 -14%
Vietnam 3.174 3.174 5.099 -38% Vietnam 185 185 218 -15%
II. AMERICA 270.536 270.536 336.736 -20% II. AMERICA 61.352 61.352 113.165 -46%
Canada 13.087 13.087 16.966 -23% Canada 3.015 3.015 30.998 -90%
Mexico 36.512 36.512 54.519 -33% Mexico 217 217 1.108 -80%
USA 131.040 131.040 193.556 -32% USA 47.774 47.774 74.944 -36%
Argentina 8.646 8.646 7.620 13% Argentina 89 89 1.423 -94%
Bolivia 377 377 521 -28% Bolivia
Brazil 62.780 62.780 46.925 34% Brazil 10.118 10.118 4.302 135%
Chile 2.424 2.424 2.709 -11% Chile 3 3 2 36%
Colombia 2.107 2.107 4.385 -52% Colombia 30 30 2 1915%
Costa Rica 352 352 197 78% Costa Rica 37
Cuba 698 698 719 -3% Cuba
Dominican Rep 567 567 677 -16% Dominican Rep
Ecuador 1.193 1.193 370 223% Ecuador 11
El Salvador 28 28 440 -94% El Salvador
Guatemala 219 219 87 152% Guatemala
Panama 51 51 234 -78% Panama 103 -100%
Paraguay 1.031 1.031 58 1677% Paraguay
Peru 3.642 3.642 3.465 5% Peru 7
Uruguay 176 176 218 -19% Uruguay 220
Venezuela 5.608 5.608 3.069 83% Venezuela 107 107 6 1687%
5.1 External Trade in Q1 2010
27
EXPORTS IMPORTS
2010/Q1 2010/Q2 2010/Q3 2010/Q4 Q1 2010 Q1 2009 %10/09 2010/Q1 2010/Q2 2010/Q3 2010/Q4 Q1 2010 Q1 2009 %10/09
III. EUROPE 975.196 975.196 1.612.947 -40% III. EUROPE 747.539 747.539 1.160.059 -36%
Austria 63.089 63.089 91.964 -31% Austria 47.508 47.508 56.893 -16%
Belgium 37.521 37.521 55.858 -33% Belgium 29.126 29.126 50.639 -42%
Denmark 11.732 11.732 26.127 -55% Denmark 4.370 4.370 4.753 -8%
Finland 14.112 14.112 35.450 -60% Finland 6.141 6.141 12.752 -52%
France 104.914 104.914 167.790 -37% France 34.060 34.060 41.831 -19%
Germany 214.070 214.070 395.630 -46% Germany 236.608 236.608 335.069 -29%
Greece 10.406 10.406 10.040 4% Greece 610 610 645 -5%
Ireland 6.559 6.559 6.623 -1% Ireland 340 340 2.334 -85%
Italy 82.399 82.399 137.007 -40% Italy 118.674 118.674 195.313 -39%
Luxemburg 2.904 2.904 3.109 -7% Luxemburg 357 357 287 24%
Netherlands 40.276 40.276 51.977 -23% Netherlands 22.157 22.157 21.780 2%
Portugal 14.423 14.423 21.780 -34% Portugal 2.621 2.621 3.011 -13%
Spain 38.985 38.985 66.199 -41% Spain 30.720 30.720 65.180 -53%
Sweden 26.928 26.928 66.295 -59% Sweden 11.794 11.794 11.105 6%
UK 51.523 51.523 70.145 -27% UK 19.148 19.148 42.863 -55%
Iceland 397 397 763 -48% Iceland 1.793 -100%
Liechtenstein 893 893 9.042 -90% Liechtenstein 9 9 4.538 -100%
Norway 8.573 8.573 20.448 -58% Norway 2.280 2.280 3.300 -31%
Switzerland 55.057 55.057 88.909 -38% Switzerland 111.212 111.212 192.249 -42%
Albania 425 425 558 -24% Albania 331 331 85 290%
Bosnia-Herz. 1.058 1.058 4.370 -76% Bosnia-Herz. 71 71 150 -52%
Bulgaria 2.001 2.001 9.844 -80% Bulgaria 1.484 1.484 2.750 -46%
Croatia 3.563 3.563 8.980 -60% Croatia 1.903 1.903 6.909 -72%
Czech Republic 25.041 25.041 43.903 -43% Czech Republic 31.500 31.500 57.166 -45%
Estonia 888 888 3.343 -73% Estonia 309 309 89 245%
Hungary 10.894 10.894 30.526 -64% Hungary 1.153 1.153 727 59%
Kosovo 58 58 205 -72% Kosovo 0 0 403
Latvia 842 842 801 5% Latvia 12 12
Lithuania 723 723 2.665 -73% Lithuania 113 113 26 329%
Macedonia 651 651 637 2% Macedonia 2 2
Montenegro 4.244 4.244 10 41637% Montenegro
Poland 62.942 62.942 69.489 -9% Poland 6.919 6.919 20.328 -66%
Romania 9.922 9.922 21.975 -55% Romania 3.627 3.627 4.062 -11%
Serbia 6.877 6.877 4.580 50% Serbia 1.275 1.275 483 164%
Slovakia 9.818 9.818 30.915 -68% Slovakia 3.510 3.510 8.974 -61%
Slovenia 9.720 9.720 17.104 -43% Slovenia 3.127 3.127 2.429 29%
Turkey 52.795 52.795 45.507 16% Turkey 14.469 14.469 22.485 -36%
5.1 External Trade in Q1 2010
28
EXPORTS IMPORTS
2010/Q1 2010/Q2 2010/Q3 2010/Q4 Q1 2010 Q1 2009 %10/09 2010/Q1 2010/Q2 2010/Q3 2010/Q4 Q1 2010 Q1 2009 %10/09IV. Russia + CIS 172.557 172.557 206.835 -17% IV. Russia +
CIS 2.062 2.062 5.305 -61%
Armenia 101 101 13.175 -99% Armenia
Azerbaijan 2.367 2.367 4.864 -51% Azerbaijan 263 263 474 -44%
Belarus 10.875 10.875 20.283 -46% Belarus 46 46 310 -85%
Georgia 8.978 8.978 109 8115% Georgia
Kazakhstan 4.321 4.321 3.419 26% Kazakhstan 3 -100%
Krgyzstan 68 68 91 -25% Krgyzstan
Moldova 33 33 4.387 -99% Moldova 407 -100%
Russia 133.940 133.940 145.558 -8% Russia 1.478 1.478 3.485 -58%
Tajikistan 3 3 8 -56% Tajikistan
Turkmenistan 323 323 281 15% Turkmenistan
Ukraine 11.473 11.473 25.959 -56% Ukraine 274 274 630 -57%
Uzbekistan 73 73 1.709 -96% Uzbekistan
V. OTHERS 155.319 155.319 153.507 1% V. OTHERS 4.602 4.602 5.060 -9%
Algeria 10.560 10.560 5.659 87% Algeria 28
Lybia 1.441 1.441 1.388 4% Lybia 32 32 1 3531%
Morocco 8.898 8.898 7.742 15% Morocco 515 515 27 1815%
Tunisia 5.633 5.633 6.235 -10% Tunisia 70 70 479 -85%
S-Africa 13.419 13.419 17.454 -23% S-Africa 1.160 1.160 662 75%
Australia 22.243 22.243 23.689 -6% Australia 1.415 1.415 1.518 -7%
New Zealand 2.500 2.500 1.582 58% New Zealand 5 5 97 -95%
Bahrain 303 303 846 -64% Bahrain
Egypt 11.089 11.089 17.760 -38% Egypt 32 32 661 -95%
Iraq 4.086 4.086 3.270 25% Iraq
Iran 34.419 34.419 12.509 175% Iran 89 89 228 -61%
Israel 4.831 4.831 6.437 -25% Israel 681 681 1.307 -48%
Jordan 995 995 658 51% Jordan
Kuwait 306 306 1.433 -79% Kuwait 77 77
Oman 2.817 2.817 1.488 89% Oman
Qatar 3.780 3.780 4.980 -24% Qatar 2 2
Saudi-Arabia 12.433 12.433 23.512 -47% Saudi-Arabia 113 113 43 165%
Syria 1.517 1.517 1.203 26% Syria 3 3 12 -77%
UAE 14.234 14.234 14.017 2% UAE 409 409 657 -38%
Yemen 102 102 1.598 -94% Yemen 9
VI. ROW 22.280 22.280 45.563 -13% VI. ROW 11.258 11.258 26.905 -58%
TOTAL EXPORTS 2.284.874 2.284.874 3.120.384 -27% TOTAL
EXPORTS 1.079.673 1.079.673 1.790.572 -40%
5.1 External Trade in Q1 2010
29
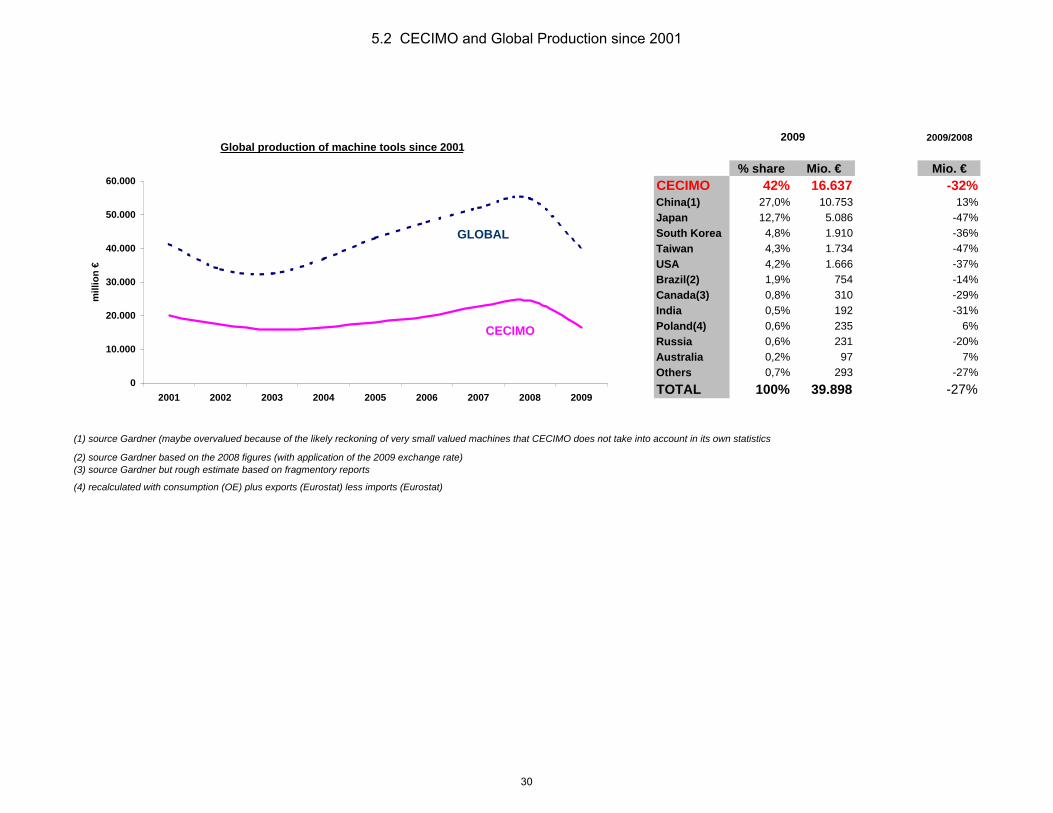
2009/2008
% share Mio. € Mio. €CECIMO 42% 16.637 -32%China(1) 27,0% 10.753 13%Japan 12,7% 5.086 -47%South Korea 4,8% 1.910 -36%Taiwan 4,3% 1.734 -47%USA 4,2% 1.666 -37%Brazil(2) 1,9% 754 -14%Canada(3) 0,8% 310 -29%India 0,5% 192 -31%Poland(4) 0,6% 235 6%Russia 0,6% 231 -20%Australia 0,2% 97 7%Others 0,7% 293 -27%TOTAL 100% 39.898 -27%
(1) source Gardner (maybe overvalued because of the likely reckoning of very small valued machines that CECIMO does not take into account in its own statistics
2009
(2) source Gardner based on the 2008 figures (with application of the 2009 exchange rate)(3) source Gardner but rough estimate based on fragmentory reports
(4) recalculated with consumption (OE) plus exports (Eurostat) less imports (Eurostat)
Global production of machine tools since 2001
0
10.000
20.000
30.000
40.000
50.000
60.000
2001 2002 2003 2004 2005 2006 2007 2008 2009
mill
ion
€
GLOBAL
CECIMO
5.2 CECIMO and Global Production since 2001
30