Embed Size (px)
Citation preview

第24回 環境化学討論会
環境化学の新たな展開─ 環境毒性学の視点を加えて ─
要 旨 集
日時:2015年6月24日水~26日金Dates: 24th-26th June 2015
会場:札幌コンベンションセンターVenue: Sapporo Convention Center
後援:北海道大学Supported by Hokkaido University
協力:SETAC JAPAN 北海道大学大学院獣医学研究科In cooperation with SETAC JAPAN Graduate School of Veterinary Medicine, Hokkaido University
[主催]一般社団法人日本環境化学会Organized by Japan Society for Environmental Chemistry
24th Symposium on Environmental ChemistryProgram and Abstracts

International session
24th June(WED) Room C 09:00 - 10:15 International session 1C-1st
PPCP etc., Environmental levels, Screening and non-targeted analysis Reg.
No
Present.
No. Title Autohors
100047 1C-01 Monitoring of 1300 organic micro-pollutants in
surface waters from Tianjin, Northern China
○Lingxiao Kong 1, Kiwao Kadokami 1, Shaopo Wang 2,
Hanh Thi Duong 1, Hong Thi Cam Chau 1 (1 Graduate
schoolof Environmental Engineering, The University of
Kitakyushu; 2 Facultyof Environmental and Municipal
Engineering, Tianjin Chengjian University)
100071 1C-02
Screening and analysis of 940 organic micro-
pollutants in groundwaters in Hanoi and
Hochiminh City, Vietnam
○Duong Thi Hanh 1, Kiwao Kadokami 1, Katayama
Shinsuke 1, Trung Quang Nguyen 2 (1 Univ of Kitakyushu; 2 Inst of Environ T echnol, VAST, Vietnam)
100265 1C-03 Insights into sub-tropical lowland river food webs
using stable isotopes
○Ruan Gerber 1, Nico J. Smit 2, Johan H.J. Van Vuren 1,
Shouta M.M. Nakayama 3, Yoshinori Ikenaka 2, Mayumi
Ishizuka 3, Victor Wepener 2 (1 Centre for Aquatic Research,
Department of Zoology, Kingsway Campus, University of
Johannesburg; 2 School of Environmental Sciences and
Development, Potchefstroom Campus, North West
University; 3 Laboratory of Toxicology, Department of
Environmental Veterinary Sciences, Graduate school of
Veterinary Medicine, Hokkaido University)
100226 1C-04 Antibiotic residue monitoring for freshwater
products in Ho Chi Minh City, Vietnam
○Kotaro Uchida 1,2, Yoshimasa Konishi 1, Kazuo Harada 2,4,
Masahiro Okihashi 1,2,4, Takahiro Yamaguchi 1,2, Mai
Hoang Ngoc Do 3, Long Thi Bui 3, Thinh Duc Nguyen 3,
Phuc Do Nguyen 3, Keiji Kajimura 1, Yuko Kumeda 1, Ninh
Hoang Le 3, Chinh Van Dang 3, Kazumasa Hirata 2,4 and
Yoshimasa Yamamoto 1,4 (1 Osaka Prefectural Institute of
Public Health; 2 Graduated School of Pharmaceutical
Sciences, Osaka University; 3 Institute of Public Health, Ho
Chi Minh City; 4 Global Collaboration Center, Osaka
University)
100338 1C-05
Occurrence and distribution of micropollutants
(triclocarban and benzotriazole UV stabilizers) in
sediments from south Indian Rivers
○R. Babu Rajendran, K. Vimalkumar1, Nikhil Nishikant
Patil, S. Krishna Kumar1and E. Arun (Department of
Environmental Biotechnology, Bharathidasan University)
24th June(WED) Room C 10:30 - 11:30 International session 1C-2nd
Physiologically active substance, Environmental levels, Toxiic effects
100221 1C-06
Toxic profiling of river waters from Vietnam and
India: Major estrogens and androgens are natural
hormones
○Nguyen Minh Tue 1,2, Hidenori Matsukami 3, Le Huu
Tuyen 1,2, Go Suzuki 3, Shin Takahashi 1,4, Pham Hung Viet 2, Annamalai Subramanian 1, Tatsuya Kunisue 1, Shinsuke
Tanabe 1 (1 Center for Marine Environmental Studies,
Ehime University; 2 Hanoi University of Science; 3 National Institute for Environmental Studies; 4 Center of
Advanced Technology for the Environment, Ehime
University)
100330 1C-07 Occurrence of endocrine disrupting chemicals in
wastewater treatment plants in Taiwan
○Cheng-Chun Huang 1, Yi-Po Yeh 1, Masanobu Kawanishi 2, Takashi Yagi 2, Pei-Hsin Chou 1 (1 Department
ofEnvironmental Engineering, National Cheng Kung
University, Taiwan; 2 Department of Biology, Graduate
School of Science, Osaka Prefecture University)
100054 1C-08
Nitrate content in Egyptian meat products and its
modulatory effects on xenobiotic metabolizing
enzymes
○Wageh Sobhy Darwish 1, 2, Mohamed Abdallah Hussein 2,Yoshinori Ikenaka 1, Shouta M.M. Nakayama 1, Hazuki
Mizukawa 1, Mayumi Ishizuka 1 (1 Graduate School of
Veterinary Medicine, Hokkaido University; 2 Food Control

Department, Faculty of Veterinary Med icine, Zagazig
University, Egypt)
100209 1C-09
Concentrations of polycyclic aromatic
hydrocarbon metabolites (OH-PAHs) in
domestic animal in Kumasi, Ghana
○Nesta Bortey-Sam 1, Yoshinori Ikenaka 1, Osei Akoto 2,
Shouta M.M. Nakayama 1, Jemima Marfo 1, Hazuki
Mizukawa 1, Mayumi Ishizuka 1 (1 Graduate School of
VeterinaryMedicine, Hokkaido University; 2 Department of
Chemistry, Kwame Nkrumah University of Science and
Technology, Kumasi, Ghana)
24th June(WED) Room C 14:15 - 15:30 International session 1C-3rd
Environment effects, VOC source, Environmental levels, monitoring
100263 1C-11 Screening of aryl hydrocarbon ligands in
sediment from three harbours in South Africa
Natasha Vogt 1, Pieter Holtzhausen 1, Rialet Pieters 1, Brent
Newman 2, John Giesy 3 (1 North West University; 2
Council for Scientific and Industrial Research (CSIR); 3 University of Saskatchewan)
100211 1C-12 Vector-controlling pesticides in free-ranging
chickens in KwaZulu-Natal, South Africa
○Lesa A Thompson 1, Yoshinori Ikenaka 1, Johan J van
Vuren 2, Victor Wepener 3, Nico Smit 3, Wynand Vlok 4,
Yared B Yohannes 1, Hazuki Mizukawa 1, Shouta M M
Nakayama 1, Mayumi Ishizuka 1 (1 Hokkaido University; 2
University of Johannesburg. 3 North-West University; 4 BioAssets)
100218 1C-13 Congener specific analysis of PCBs after
bioremediation of contaminated river sediment.
Aleksandra Djuric 1,○Takeshi Nakano 2,Vladimir P.
Beskoski 1 , Ivana Ugljesic 1, SrdjanMiletic 3 ,
JelenaAvdalovic 3,GordanaGojgic-Cvijovic 3,Mila Ilic 3,Miroslav M. Vrvic 1 (1 Faculty of Chemistry, University of
Belgrade; 2 Research Center for Environmental
Preservation, Osaka University; 3 Department of
Chemistry-Institute of Chemistry, Technology and
Metallurgy, University of Belgrade)
100235 1C-14 Development of mobile source air toxic emission
factors in Thailand
○Ittipol Paw-armart 1, Shirane Yoshiharu 2, Natchanok
Pala-end 3 (1,3 Environmentalist , Pollution Control
Department (PCD), Thailand, 2 ShiranACE , Ltd , Japan)
100234 1C-15 Emission Estimation from Gas Stations in
Rayong Province, Thailand
○Natchanok Pala-En, Ph. (Environmentalist, Pollution
Control De partment, Thailand)
24th June(WED) Room C 15:45 - 17:00 International session 1C-4th
Hevy metals & trace elements, Environmental levels, Kinetic analysis
100186 1C-16
Trace metals contamination in surface water,
sediment, some fishes and sea foods in the coastal
area, Bangladesh
○Mohammad Raknuzzaman 1, Mohammad
Raknuzzaman1, Md Kawser Ahmed 2, Md Saiful Islam 3,
Md Habibullah-Al-Mamun 1, Shigeki Masunaga 1
(1 Graduate School and Faculty of Environment and
Information Sciences, Yokohama National University; 2 Department of Oceanography, University of Dhaka; 3 Department of Soil Science, Patuakhali Science and
Technology University, Bangladesh)
100264 1C-17
Does It Really Work? Ten-Year Monitored
Natural Recovery of Pb-Contaminated Mine
Tailing in Klity Creek, Kanchanaburi Province,
Thailand
○Tanapon Phenrat 1,2, Ashijya Otwong 3,4, Aphichart
Chantharit 1,2 (1 Department of Civil Engineering, Faculty of
Engineering, Naresuan University, Phitsanulok, Thailand; 2
Faculty of Engineering, Naresuan University, Phitsanulok,
Thailand; 3 ENLAWTHAI Foundation, Bangkok,
Thailand; 4 Faculty of Law, Naresuan University,
Phitsanulok, Thailand)
100231 1C-18
Removal of heavy metals from mine tailings by
rhamnolipid biosurfactant using a continuous
column laboratory system
○GordanaDj.Gojgic-Cvijovic 1 , Ivana Peric 2 ,
VladimirP.Beskoski 2, Latinka Slavkovic-Beskoski 3,
Biljana Dojcinovic 1, Miroslav M. Vrvic 2 (1 Institute of
Chemistry, Technology and Metallurgy, University of
Belgrade; 2 Faculty of Chemistry, University of Belgrade,

Belgrade; 3 Vinca Institute of Nuclear Science, University
of Belgrade, Belgrade)
100317 1C-19 Arsenic and Lead Contaminations in Some Rural
Villages in India
○Jun Noda 1 , Reika Hakamada 1 , Kazuyki Suzuki 1 , Teruo
Miura 2 , and Koichiro Sera 3 (1 Rakuno Gakuen University; 2 Sam Higginbottom Institute of Agriculture, Technology &
Sciences; 3 Cyclotron Research Center, Iwate Medical
University)
100166 1C-20
Trace element concentrations in marine
sediments from coastal area of middle Philippines
shattered by Typoon Yolanda and their
possibilities of bioaccumulation
○Takashi Tokumaru1, Hirokazu Ozaki1, Izumi Watanabe1,
Haruhiko Nakata2, Socorro E. AGUJA 3,Maricar S.
Prudente 3 (1Tokyo Univ. of Agricuture and Technol.,2Kumamot Univ.,3De la sale Univ, Philipines)
25th June(THU) Room C 09:30 ~ 10:45 International session 2C-1st
PAH, Halogenated PAH, BFR Environmental levels, monitoring
100179 2C-01
Concentrations and distribution patterns of
chlorinated and brominated polycyclic aromatic
hydrocarbons in e-waste open burning soils in
Vietnam, the Philippines, and Ghana
○Chiya Nishimura1, Yuichi Horii2, Satoshi Kawanishi1,
Shuhei Tanaka1, Tetsuro Agusa3, Takaaki Itai3, Go Suzuki4,
Nguyen M. Tue 3, Kwadwo A. Asante 5, Florencio C.
Ballesteros Jr. 6, Pham H. Viet 7, Masaki Takaoka1, Shin
Takahashi3, Shinsuke Takahashi3, Hidetaka Takigami4,
Takashi Fujimori1 (1Kyoto Univ.,2 2Center for Environ.
Sci. in Saitama,3Ehime Univ.,4NIES,5 CSIR Water
Research Institute,6 Univ. of the Philippines, Diliman, 7 Hanoi Univ. of Sci.)
100297 2C-02
Flame Retardants and Related Substances in the
Interior Parts and Cabin Dusts of End-of-life
Vehicles (4th Report)
○Natsuko Kajiwara1,Hidetaka Takigami1,Tomohiro
Kose2,Go Suzuki1,Shin0-ichi Sakai3 (1NIES,2Niigata
Univ. of Pharmacy and Applied Life Sciences,3Kyoto
Univ.)
100251 2C-03 Calculation of PCB congener's Sampling rate
using passive air sampler
○Takuya Yoshida 1,Yuki Haga 2,Chisato Matsumura 2,
Masahiro Tsurukawa 2,Eiichi Kato 1,Takeshi Nakano 3 (1
NEOS Company Limited,2 Hyogo Prefectural Institute of
Environmental sciences,3 Graduate School of
Engineering, Osaka University)
100192 2C-04
Development of a comprehensive analytical
method of polar organic pollutants in water
samples by liquid chromatography-time of flight-
mass spectrometry
○ Chau Thi Cam Hong,Kiwao Kadokami
(The University of Kitakyushu)
100236 2C-05
Long-term trends in concentrations of
perfluorooctane sulfonate (PFOS) in seawater: A
modeling assessment
○ Xianming Zhang 1,2,Yanxu Zhang 1,Elsie Sunderland 1, 2 (1 HarvardSchool of Engineering and Applied Sciences,
Harvard University ; 2 Harvard T.H. Chan School of Public
Health, Harvard University)

Special session for Mercury Monitoring Network
25th June(THU) Room A 15:00 - 16:15 2A-2nd
2A-06 Environmental Monitoring of Mercury
Concentration in Lake and Sea Water in Indonesia
○Alffrida Esther Suoth, Ernawita Nazir, Dyah Apriyanti
(Researcher Environmental Management Center-Ministry
of Environment and Forestry)
2A-07 Mercury Monitoring in Coal-Fired Power Plants
in the Philippines
○Teresita A. Peralta, Ma. Fatima Anneglo R. Molina
(Environmental Management Bureau-DENR Philippines )
2A-08 Environmental mercury level in Thailand
◌Hathairatana Garivait1, Nittaya Chaisa-ard2, Daisy
Morknoy1, Chanthiraporn Tangsuwan1 (1 Environmental
Research and Training Center, 2Air Quality and Noise
Management Bureau)
2A-09
Continuous Monitoring of Mercury Deposition in
North America: the National Atmospheric
Deposition Program
○David A. Gay 1, David Schmeltz 2, Mark Olson 1
(1 National Atmospheric Deposition Program, University of
Illinois (USA), United States, 2 United States Environmental
Protection Agency)
2A-10 Mercury Pollution and Current state of Mercury
Monitoring in Vietnam
○Nguyen Van Thuy, Bui Hong Nhat (Centre for
Environmental Monitoring, Vietnam Environmental
Administration, Ministry of Natural Resources and
Environment )

24th Symposium of Environmental Chemistry, Lingxiao Kong, Oral presentation (Sapporo; 2015)
Fig.1 Map of surface waters monitoring locations in
Tianjin Municipality
J2
S1H5
J4H4
J6
H9
H8
H11
H7
H10
H6
J3
H2
H1
H3
J1
J5
S2
D10 5 10km
N
Monitoring of 1300 organic micro-pollutants in surface waters from Tianjin, Northern China ○Lingxiao Kong 1, Kiwao Kadokami 1, Shaopo Wang 2, Hanh Thi Duong 1, Hong Thi Cam Chau 1 (1 Graduate school of Environmental Engineering, The University of Kitakyushu,2 Faculty of Environmental and Municipal Engineering, Tianjin Chengjian University)
[Introduction] Water quality in China has deteriorated in the last decade as a result of the rapid expansion of industrialization
and urbanization. The presence of xenobiotic compounds especially organic micro-pollutants in aquatic ecosystems is a major concern worldwide. Although there are more than 100 000 registered chemicals, of which 30 000–70 000 are in daily use (EINECS, European Inventory of Existing Chemical Substances). Most studies of trace organic chemicals in the aquatic environment have focused on a limited number of priority pollutants, so widespread screening for thousands of organic chemicals in surface water is urgently needed.
In this work, a novel automated screening gas chromatographic-mass spectrometric (GC-MS) method was employed for simultaneous identification and quantification of nearly 1000 semi-volatile organic compounds (SVOCs), along with an analogous method utilizing liquid chromatography-time of flight mass spectrometry (LC-TOF-MS) in conjunction accurate mass database to allow for screening of around 300 compounds. This study performed the first systematic survey on the occurrence of 1300 substances in surface waters of Tianjin, Northern China, selected as representative area. [Materials and Methods]
A total of 20 sampling sites were selected from Tianjin; these sites were chosen to represent the dominant surface water quality (Figure 1). Samples were taken from waters no deeper than 1.0 m depth using amber glass bottles in December 2013. Samples were prepared for measurement of 949 SVOCs by GC-MS and 81 persistent organic pollutants by GC-MS/MS following the same method from Jinya et al.1). Samples were prepared for measurement of 303 polar and/or non-volatile organic chemicals (NVOCs) by filtration of surface water (1 L) through a 47 mm glass microfiber filter GF/C (Whatman). The suspended solid (SS) was subjected to sonication extraction with methanol twice. The filtrate was passed through a PS 2 Sep-Pak and an AC 2 Sep-Pak cartridge (Waters Associates) at a flow rate of 10 mL min–1. The cartridges were eluted with methanol and dichloromethane prior to LC-TOF/MS analysis.
All data were subjected to strict quality control procedures. The lowest quantification limits of each chemical for GC-MS, GC-MS/MS, and LC-TOF-MS were 5-1000 ng L–1, 0.1-1.0 ng L–1 and 4-200 ng L–1, respectively. For GC-MS/MS and GC-MS, average of recovery rates for 10 surrogates ranged from 67%-135%,
24th Symposium of Environmental Chemistry, Lingxiao Kong, Oral presentation (Sapporo; 2015)
1C-01

24th Symposium of Environmental Chemistry, Lingxiao Kong, Oral presentation (Sapporo; 2015)
while for LC-TOF-MS the average of recovery rates for 3 surrogate standards ranged from 64% to 85%. [Results and discussion]
A total of 227 compounds were detected, including sterols, antioxidants, pharmaceuticals and personal care products (PPCPs), PAHs, organophosphate ester flame retardants, plasticizers, and pesticides as well as other industrial chemicals in concentrations ranging from nanograms to micrograms per liter. The number of substances detected in the twenty surface waters ranged from 50 to 105. Concentration of ubiquitous compounds detected in all sits was showed in Table 1. Elevated levels of sum of four benzothiazoles (benzothiazole, 2-(methylthio)-benzothiazol, 2(3H)-benzothiazolone and 2-methylbenzothiazole) were found in the north sewage canal (S1, 89 µg L–1), J1 (61µg L–1) and J5 (9.7 µg L–1). Sine benzothiazoles were used as vulcanisation accelerator, the high concentration observed in above three sites may be ascribed to wastewater discharge from tire manufacturing industries located upstream. The anti-diabetic drug metformin was determined with the highest value observed at S1 (20 µg L–1), followed by H3 (2.9 µg L–
1) and H1 (2.4 µg L–1). Site S2 may be impacted by the discharge from metformin production upstream whereas sites H3 and H1 are both located in urban areas and may indicate large amounts usage of this drug within Tianjin’s large population. To our best knowledge, this is the first report concerning the occurrence of metformin in surface waters in China. Principle component analysis identified four factors, corresponding to industrial wastewater, domestic discharge, tire production and atmospheric deposition in the data set of Tianjin (Table 2). [Conclusion]
The surface waters in China are heavily polluted with a large number of organic micro-pollutants. The causes of pollution are industrialization, modernization and urbanization, and the current management systems for controlling contaminants discharge cannot catch up the rapid expansion of these factors. In the present study it was confirmed that monitoring for 1300 organic micro-pollutants provided a much more holistic picture of pollution and revealed that the distribution of each chemical class varied among sample locations due to the differences of population density, geographic condition, level and distribution of industry and agriculture. [References] 1) Jinya D., et al., Comprehensive Analytical Method for Semi-volatile Organic Compounds in Water Samples
by Combination of Disk-type Solid-phase Extraction and Gas Chromatography–Mass Spectrometry Database System. Analytical Sciences, pp483–486 (2013).
ChemicalsMedian
ng/LMinimum
ng/LMaximum
ng/LCholesterol 2770 1141 6378β-sitosterol 1210 665 3270DEHP 259 85 5454Siduron 198 51 428Coprostanone 126 15 1310Lidocaine 96 7.5 218Antipyrine 76 13 293Hexachlorobenzene 2.1 0.14 39p,p’-DDD 0.7 0.12 5.5
Table 1 Concnetration of compounds detected in all waters
Table 1 Principle components loadings matrix for data of surface waters in Tianjin
Variable PC1 PC2 PC3 PC4Disinfectant 0.98 -0.01 0.12 -0.03Intermediate in organic synthesis 0.97 0.02 0.12 0.04Intermediate for dyes 0.96 -0.02 0.11 0.09Fragrance 0.94 -0.05 0.06 -0.01Fire retardant 0.79 0.14 0.22 -0.04Pestcide 0.72 0.10 0.50 0.00Leaching from tire 0.05 0.97 0.03 0.03PPCPs -0.04 0.96 0.21 -0.01Benzothiazole -0.09 0.88 -0.05 -0.05Antioxidant 0.53 0.60 -0.25 -0.02Phytosetrol 0.02 -0.24 0.84 -0.18Cholesterol 0.13 0.33 0.79 -0.10Plasticizer 0.43 -0.05 0.67 0.03Zoosterol 0.35 0.49 0.63 -0.05Intermediate for resin -0.09 0.08 0.01 0.94PAH 0.11 -0.16 -0.22 0.91Fatty acid methy ester 0.00 -0.12 -0.05 -0.05Industry 0.28 0.25 -0.04 0.35Eigenvalues 6.3 3.5 2.7 1.6% Variance explained 31 20 15 8.6% Cumulative variance 35 54 70 78
24th Symposium of Environmental Chemistry, Lingxiao Kong, Oral presentation (Sapporo; 2015)

24th Symposium on Environmental Chemistry, Duong Thi Hanh, Oral presentation (Sapporo; 2015)
Fig. 1 Location of 26 wells sampled in HN and HCM. (underline indicated the wells with single sample collection whereas other wells were sampled twice)
Screening and analysis of 940 organic micro-pollutants in groundwaters
in Hanoi and Hochiminh City, Vietnam
○Duong Thi Hanh1, Kiwao Kadokami1, Katayama Shinsuke1, Trung Quang Nguyen2 (1 Univ of Kitakyushu, 2Inst of Environ Technol, VAST, Vietnam)
【Introduction】 Two biggest cities (Hanoi (HN) and Ho Chi Minh City (HCM)) are the most highly industrialized and urbanized in Vietnam, which may result in both an increased demand for fresh-water and the generation of wastewater. Groundwater is the major source of water supply for tap water in HN and HCM and the main source of drinking water for rural population. Since our previous studies had revealed that a wide range of organic micro-pollutants contaminated the Vietnamese aquatic environment, hence it may cause groundwater pollution. Therefore, a comprehensive study of 940 organic micro-pollutants representing a wide variety of uses and origins in 26 groundwater wells of HN and HCM was carried out in order to: (1) gain an overview of the occurrence of organic-micro pollutants in groundwater; (2) find potential sources and assess the potential risk of detected contaminants.
【Materials and Methods】 Samples and chemical analysis Forty-three groundwater samples from 26 wells were collected twice (2013, 2014) in HN and HCM (Fig.1). Nine hundred and forty semi-volatile organic compounds (SVOCs) were analyzed by solid-phase extraction. Briefly, after addition of surrogates (1 g) to 1-L of pH adjusted water sample (7.0). The sample was loaded on to disks in the sequence of a GMF 150, XD and AC. Then the disks were dried for 30 min and eluted with 10 mL of acetone and 5 mL of dichloromethane (XD), and 10 mL of acetone (AC). The eluate was concentrated to 1 mL and was spiked with 1 g of a IS solution prior to measurement by GC-MS-SIM/Scan and GC-MS-MS/SRM Quality control Quality control consisted of blank analysis, reproducibility and confirmation of recoveries of 13 surrogates spiked to samples prior to extraction.
【Results and discussion】 Seventy-four of the 940 analytes were detected at least once, and the median number of detections per well was 16. Total 62 and 37 compounds were detected in the first (2013) and the second round (2014), respectively. There was no sample free of organic chemicals. Six out of 10 sterols were detected with cholesterol observed in 100% wells. Caffeine was detected in No. 14 and No. 21 with
24th Symposium on Environmental Chemistry, Duong Thi Hanh, Oral presentation (Sapporo; 2015)
1C-02

24th Symposium on Environmental Chemistry, Duong Thi Hanh, Oral presentation (Sapporo; 2015)
concentration up to 2.7 g L-1. Diethyltoluamide, L-menthol and squalane were detected in two-third of the wells with sum concentrations of less than 0.4 g L-1. Bisphenol A and 4-tert-octylphenol were sporadically found at concentrations of less than 0.06 g L-1. Phthalates (DBP and DEHP) were the most frequently detected pollutants (>70%) with the greatest concentrations (>6.2 g L-1). Some organochlorine pesticides (OCPs) and polychlorinated biphenyls (PCBs) were detected, in which o,p'-DDD, p,p'-DDT and endrin were the most frequently detected OCP with the greatest concentrations. No. 20 was seriously polluted by PCBs and OCPs with sum
Fig. 2 Frequency of detection of SVOCs by general use category and percent of total measured concentration of SVOCs by general use category in the first round (September 2013) and the second round (August 2014). Number of compounds in each category is shown above bar. concentration of 20 ng L-1, followed by No. 3A, No. 4 and No. 5, which was in good agreement with our previous studies dealing with surface waters and sediments pollution carried out at these sites. The 74 compounds were divided into 18 contaminant groups based on their general use category (Fig. 2). The detection frequency of over 40% was seen for 9 and 5 groups in the first and the second round, respectively. Compared to surface water (235), the number of detected substances (74) in groundwaters was smaller. Although only 3 wells had total concentrations of higher than 10 g L-1, 50% of surface waters had sum concentrations greater than 120 g L-1. A fecal sterol (coprostanol), pemethrin and fenobucarb were seriously polluted in surface waters but not in groundwaters. The sources of detected contaminants in No. 14 were probably due to direct influence from surface or leak of underground septic systems, while the leakage of surface waters contaminated with sewage from the decrepit sewer canals was probably the sources of pollutants in No. 13, No. 16 – 17. Non-point source pollution (storm water and urban runoff, leakage from urban sewerage system and diffuse aerial deposition) was not excluded however this hypothesis should be tested in the further study. As a result of health risk assessment, 19 out of 74 contaminants detected, which we could obtain toxicity data, gave no risk to human health.
【 Conclusions】 This is the first comprehensive study of a wide range of organic micro-pollutants in groundwater in Vietnam. The presence of pollutants in groundwaters in HN and HCM alarmed for the human health even though most detected contaminants are not currently regulated or were present at levels much lower than drinking water standards or health advisories. However, the results obtained in this study will assist in determining the direction and priority of further deep studies on primary fate, degradation and transport processes in impacted aquifers as well as a full evaluation of potential risks for other detected contaminants.
24th Symposium on Environmental Chemistry, Duong Thi Hanh, Oral presentation (Sapporo; 2015)

24th Symposium of Environmental Chemistry, Ruan Gerber, Oral presentation (Sapporo; 2015)
Insights into sub-tropical lowland river food webs using stable isotopes.
Ruan Gerbera, Nico J. Smitb, Johan H.J. Van Vurena, Shouta M.M. Nakayamac, Yoshinori
Ikenakabc, Mayumi Ishizukac, Victor Wepenerb a Centre for Aquatic Research, Department of Zoology, Kingsway Campus, University of Johannesburg, PO Box 524,
Auckland Park 2006, South Africa b School of Environmental Sciences and Development, Potchefstroom Campus, North West University Private Bag
X6001 Potchefstroom, South Africa c Laboratory of Toxicology, Department of Environmental Veterinary Sciences, Graduate school of Veterinary Medicine,
Hokkaido University, Kita 18, Nishi 9, Kita-ku, Sapporo 060-0818, Japan
[Introduction] Stable isotopes have been increasingly used in ecosystem research such as ecology based food web studies (Adams & Sterner, 2000). These food web studies form the basis of research into ecosystem function, and the analysis of specifically δ15N is not only useful in ecological studies but also in conservation biology. Many studies have found that δ15N values are significantly correlated with the bioaccumulation of organochlorines (Kidd et al., 1995). Further, SIA has been used successfully in determining food web structure changes caused by anthropogenic inputs (Cabana & Rasmussen, 1996). In a developing country, such as South Africa, large scale developments are currently in progress and are expected to continue (Nel et al., 2007). Increased pressure on aquatic resources has led to the decreasing water quality in South African river systems. This applies directly to the rivers that enter the Kruger National Park (KNP), as they are being subjected to ever increasing agricultural and mining activities, industrial development and urbanisation. The increased pressures placed on these systems are a cause for concern, especially for downstream water users such as the KNP, who are mandated to conserve terrestrial and aquatic ecosystems which can only be fully achieved by providing the KNP with water of a good quality (McLoughlin et al., 2011).
[Methods] The study area consisted of stretches of the Luvuvhu and Olifants Rivers within the KNP. As many
different elements forming the respective food webs were collected from each of the rivers. A total of
289 samples were analysed for their respective δ13C and δ15N values and consisted of various primary
producers (45), invertebrates (39) and various fishes (205) from the two selected systems. Primary
producers sampled included; leaf litter, grasslitter/ hippo dung, particulate organic matter (POM)/
sediment, plankton and biofilm. Invertebrates from different taxa were collected with a greater diversity
from the Luvuvhu River. Similar fish species from both systems comprising 18 species from six families
were collected. These species represent all available habitats and different feeding modes in the two
systems.
[Results and discussion] The SIA revealed that the Luvuvhu River food web is in an unaltered state, but that there were a number of differences between the two systems, namely longer food chains in the Olifants River along with fish and invertebrate species from the Olifants River being reliant on a more carbon depleted basal food source (refer to Figure 1). Differences were attributed to food web disturbances caused by
24th Symposium of Environmental Chemistry, Ruan Gerber, Oral presentation (Sapporo; 2015)
1C-03

24th Symposium of Environmental Chemistry, Ruan Gerber, Oral presentation (Sapporo; 2015)
anthropogenic inputs of specifically allochtonous materials. These inputs are in turn responsible for an overabundance of filamentous algae in the Olifants system, resulting in filamentous algae becoming the main basal food source for consumers in the Olifants system.
Luvuvhu River
Olifants River
Figure 1: Biplots showing mean δ13C and δ15N isotopic signatures (±1 SE) of the different trophic components sampled from the selected rivers in the Kruger National Park.
[Conclusion] These excess allochtonous resources have been shown to cause fundamental shifts in nutrient and carbon availability within aquatic ecosystems, not only affecting the growth, relative abundance and feeding dynamics of the various consumer functional groups, but also the overall diversity and carrying capacity of the community. These changes may result in cascading effects across the ecosystem,.e.g. the crocodile mortalities in the Olifants River. However this will most likely also happen to the Luvuvhu River in the future. Olifants River has a longer history of use and abuse, but the Luvuvhu River is following closely in its footsteps. Water quality results indicate the similar levels of eutrophication in both systems. Highest levels of OCP bioaccumulation were found from tigerfish in Luvuvhu River.
[References] Adams T.S. & Sterner R.W. (2000) The effect of dietary nitrogen content on trophic level 15N enrichment. Limnology and
Oceanography, 45, 601–607.
Cabana G. & Rasmussen J.B. (1996) Comparison of aquatic food chains using nitrogen isotopes. Proceedings of the
National Academy of Sciences, 93, 10844–10847.
Kidd K.A., et al. (1995) Correlation between stable nitrogen isotope ratios and concentrations of organochlorines in biota
from a freshwater food web. Science of the Total Environment, 160/161, 381–390.
McLoughlin C.A., et al. (2011) History, rationale, and lessons learned: Thresholds of potential concern in Kruger national
Park river adptive management. Koedoe, 53, doi:10.4102/koedoe.v53i2.996
Nel J.L. et al. (2007) Rivers in peril inside and outside protected areas: a systematic approach to conservation assessment
of river ecosystems. Diversity and Distributions, 13, 341–352.
24th Symposium of Environmental Chemistry, Ruan Gerber, Oral presentation (Sapporo; 2015)

24th Symposium of Environmental Chemistry, Kotaro Uchida, Oral presentation (Sapporo; 2015)
Antibiotic residue monitoring for freshwater products in Ho Chi Minh City, Vietnam ○Kotaro Uchida1,2, Yoshimasa Konishi1, Kazuo Harada2,4, Masahiro Okihashi1,2,4, Takahiro Yamaguchi1,2, Mai Hoang Ngoc Do3, Long Thi Bui3, Thinh Duc Nguyen3, Phuc Do Nguyen3, Keiji Kajimura1, Yuko Kumeda1, Ninh Hoang Le3, Chinh Van Dang3, Kazumasa Hirata2,4 and Yoshimasa Yamamoto1,4 ( 1Osaka Prefectural Institute of Public Health, 2Graduated School of Pharmaceutical Sciences, Osaka University, 3Institute of Public Health, Ho Chi Minh City, 4Global Collaboration Center, Osaka University)
[Introduction] Vietnam is located in south-east Asia and
has wide coastline and vast area for inland fisheries. They are now one of the most developing countries and one of the richest in freshwater products. The biggest contributor to the freshwater production in Vietnam is aquaculture1).
Many countries governments have inspection program of the residue of veterinary drugs. From the analysis results by European Union, United States, Canada, and Japan from 2002 to 2009, it was revealed that Asian seafood products, including shrimp, catfish, crab, tilapia and eel were most frequently in violation of veterinary drug residues2).
Table 1. Compounds and their LOQ
Fig. 1. Preparation method for analysis of 39 veterinary drugs from freshwater products
Sulfonamide Sulfabenzamide <10Sulfacetamide 20Sulfachlorpyridazine 20Sulfaclozine 20Sulfadimethoxine <10Sulfadimidine <10Sulfadoxine <10Sulfamerazine <10Sulfamethoxazole 20Sulfamethoxypyridazine <10Sulfamonomethoxine <10Sulfapyridine <10Sulfathiazole 20Sulfisozole 20
Quinolone Ciprofloxacin <10Danofloxacin 80Difloxacin 20Enrofloxacin <10Flumequine <10Marbofloxacin <10Nalidixic acid <10Norfloxacin <10Ofloxacin <10Orbifloxacin <10Oxolinic acid <10Sarafloxacin 80
β-Lactam Amoxicillin 200Ampicillin 20Cefapirin 20Cefoperazone 40Cefquinome 20Oxacillin 20Penicillin V 80
Macrolide Spyramycin 80Tilmicosin 200Tylosin 20
Hormone Clenbuterol <10Ractopamine <10
Antimetabolite Trimethoprim <10
Class Compound LOQ (µg/kg)
+2%Formic acid acetonitrile 8mL Homogenization, Centrifugation
+0.3g dispersive-ODSAgitation, Centrifugation
+Water 3mL Filtration (PTFE0.2µm)
Sample
Extract
Upper Solution
Test Solution
+Water (up to 10 mL)
1mL
2 g
24th Symposium of Environmental Chemistry, Kotaro Uchida, Oral presentation (Sapporo; 2015)
1C-04

24th Symposium of Environmental Chemistry, Kotaro Uchida, Oral presentation (Sapporo; 2015)
Detection rate Detection rate(%) (%)
Enrofloxacin 14 / 110 12.7 9 / 66 13.6Ciprofloxacin 6 / 110 5.5 1 / 66 1.5Sulfadimidine 2 / 110 1.8 1 / 66 1.5Trimethoprim 3 / 110 2.7 0 / 66 0Sulfamethoxazole 1 / 110 0.9 0 / 66 0
Fish ShrimpCompoundDetected / Analyzed Detected / Analyzed
The aim of this work was to develop a method for monitoring the antibiotic residues in freshwater products and assess the situation of antibiotic residues in products collected at Ho Chi Minh City (HCMC). In this study, we have analyzed 110 fishes and 66 shrimps and revealed the antibiotic residue situation. [Methods]
Samples were collected at eight local markets and one whole sale market in HCMC during March 2014 to March 2015. Preparation method was modified method of our previous reports3) (Fig.1). The accuracy, precision, linearity and detection limit were confirmed. 39 compounds including 14 sulfonamides, 12 quinolones, 7 β–lactams were analyzed (Table 1). [Results and discussion]
Out of 176 samples analyzed, antibiotic residues, such as enrofloxacin, ciprofloxacin, sulfadimidine, sulfamethoxazole and trimethoprim were found in 27 samples. Enrofloxacin and its metabolite ciprofloxacin were most often detected, and their detection rates were 13.1% and 4.0% (Table 2). Sulfamethazine which is major antibiotics detected from pork and chicken4) was also detected from freshwater products. Sulfamethoxazole and trimethoprim were detected from only fish samples. Detected concentrations of these compounds were relatively low (Fig.2).
Enrofloxacin has been included in the list of antibiotics prohibited from use in fishery production and trade in Vietnam, despite which the rate of freshwater products containing residual enrofloxacin has been shown to be relatively high. Our results imply that the inappropriate use of antibiotics in aquaculture, and/or contamination due to human activities still persists. [References] 1) http://www.fao.org/countryprofiles/index/en/?iso3=VNM 2) David C. Love et al. 2011. Environ. Sci. Technol. 45: 7232-7240. 3) Takahiro Yamaguchi et al. 2015. J. Agr. Food. Chem. DOI: 10.1021/jf505254y 4) Takahiro Yamaguchi et al. 2015. J. Agr. Food. Chem. DOI: 10.1021/acs.jafc.5b00170
Table 2. Detection rate of antibiotics in freshwater products collected at HCMC
Fig. 2. Detected concentration of antibiotics
10
100
1,000
10,000
Fish
Shrimp
Con
cent
ratio
n (µ
g/kg
)
Sulfa
met
hoxa
zole
Trim
etho
prim
Sulfa
dim
idin
e
Cip
roflo
xaci
n
Enro
floxa
cin
24th Symposium of Environmental Chemistry, Kotaro Uchida, Oral presentation (Sapporo; 2015)

24th Symposium on Environmental Chemistry, R. Babu Rajendran, Oral presentation (Sapporo; 2015)
Occurrence and distribution of micropollutants (triclocarban and benzotriazole UV stabilizers) in sediments from south Indian Rivers ○R. Babu Rajendran1, K. Vimalkumar1, Nikhil Nishikant Patil1, S. Krishna Kumar1 and E. Arun 1 ( 1 Department of Environmental Biotechnology, Bharathidasan University, Tiruchirappalli - 620 024, Tamilnadu, India)
[Introduction] Triclocarban (TCC - a common antibacterial agent) and Benzotriazoles (organic ultraviolet stabilizer to absorb UV-A and UV-B radiations) are added in formulations of PCP such as shampoo, sunscreen, moisturizing cream, soap, toothpaste, hair dye, nail polish, lipstick, etc. Other than PCPs, they are also used in industrial products such as textile, plastics, building materials, and automobile components to prevent yellowing and degradation of the products (Ramaswamy, 2015). Although these products are intended for the benefit for mankind, after their usage, mostly they enter the natural waters through point and non-point sources such as urban and industrial sewage and sewage treatment plant (STP) effluents. In natural waters, these lipophilic and persistent contaminants sorb to sediments, therefore they persist over time and can pose deleterious effects in resident organisms (Daughton et al., 1999). Recent studies indicated multiple biological activity of TCC in wildlife including enlargement of male accessory organs, activation of nuclear receptors (estrogen, androgen), thyroid hormone and altered embryo production. Benzotriazoles were reported to cause coral bleaching (Ramaswamy, 2015). Personal care products are being reported widely in environment all over the globe. In India, although personal care products rated second (22%) among the fast moving consumer goods with a market size of 9.8 billion USD (FMCG, 2014), no studies are available to report the fate of TCC and Benzotriazoles in rivers. Therefore, the present investigation performed on the spatial distribution of selected PCPs in three major rivers (Kaveri, Vellar and Thamiraparani) flowing in Tamilnadu province, southern part of India. A detailed perspective of these rivers is provided in our earlier publication (Ramaswamy et al., 2011). [Methods] Sediments samples were collected from 29 locations during wet season (October-January 2015) from three major southern Indian rivers such as Kaveri (n=15), Vellar (n=4) and Thamiraparani (n=10) were subjected for PCPs estimation. Dried sediment sample (5g) were taken in glass bottle and extracted twice with 25 ml of hexane: dichloromethane (1:1) for 30 min in an Ultrasonic water bath. Then the extract was condensed to 1 ml and analyzed in GC-MS (Shimadzu QP-2010). Further, the recovery was determined by spiking sediment samples with 50 ng/g of each PCPs (TCC and Benzotriazoles). The recovery obtained for TCC was 76% and Benzotriazoles (UV-9, -326, -327, -328, -329, -P) were in the range of 102 – 118%. The LOQ for TCC was 0.73 ng/g, whereas for Benzotriazoles the values were in the range of 0.45-0.93 ng/g.
24th Symposium on Environmental Chemistry, R. Babu Rajendran, Oral presentation (Sapporo; 2015)
1C-05

24th Symposium on Environmental Chemistry, R. Babu Rajendran, Oral presentation (Sapporo; 2015)
[Results and discussion] The occurrence of TCC in rivers was found to be ubiquitous with an average of 3.4 ng/g. Further, the levels in Kaveri Vellar and Thamiraparani rivers were found in the range of 0.5 - 26.3 ng/g, 0.4 – 1.6 ng/g and 0.2 – 9.2 ng/g, respectively. The highest concentration was observed at Vangal (26.3 ng/g) in Kaveri river. Among the benzotriazoles, UV-329 and UV-9 were highly detected with detection frequency of 97% and 90%, respectively. Other benzotrizoles such as UV-328, UV-327, UV-326 and UV-P were found in 76%, 72%, 62% and 52% of the samples, respectively. The highest detected UV-329 also showed the highest concentration of 2 ng/g in Thamiraparani river (Alwarkurichi) among the benzotriazoles. The mean concentration of total benzotriazoles in all the three rivers, Kaveri (5.9 ng/g), Vellar (5 ng/g) and Thamiraparani (6.9 ng/g) are comparable. The major contributor was UV-329 (40 %), whereas UV-327, -328, -326, -P and -9 contributed about 20%, 14%, 12%, 8% and 6%, respectively. Like TCC, UV-329 was also found high at Vangal (Kaveri river) (6.6 ng/g). Among other Benzotriazoles, UV-328, UV-327, UV-326, UV-P and UV-9 were recorded up to 3.9 ng/g, 7.3 ng/g, 4.6 ng/g, 2.1 ng/g and 1.1 ng/g, respectively. Although Vangal is a rural location, higher levels of PCPs may be a result of large input of municipal and industrial (paper, textile, dyeing, etc.) from its surrounding location. Among the rivers, total load of PCPs was high in Kaveri river with almost equal contribution TCC and Benzotriazoles. In case of Vellar and Thamiraparani rivers, Benzotrialzoles were the highest contributors. This indicates the variation in usage pattern of PCPs in different parts of Tamilnadu. In addition to TCC and Benzotriazoles, other PCPs such as Triclosan and Parabens were already reported in these rivers by us (Ramaswamy et al., 2011). Since the toxicity threshold are mostly restricted to water concentration, performing proper risk assessment for sediments is not feasible. However, it is certain that their persistence in sediment will provide continuous exposure to sediment dwelling organisms. Also, the sediment can act as reservoir for contaminants. Further, the aquatic organisms are often exposed to myriad synthetic chemicals along with PCPs, therefore, the negative effect may increase. [Conclusion] From the study, it is understood that Indian rivers are ubiquitously contaminated with TCC and Benzotriazoles. The difference in occurrence and distribution pattern clearly signifies the variable usage of PCPs among the population in different basins. Moreover, the study adds up the evidence of growing PCPs signature in Indian environment. Further, monitoring of these PCPs in water column is also warranted for identifying the risk and mitigation measures. [References] 1. Daughton, C.G., and Ternes, T.A. (1999). Pharmaceuticals and personal care products in the environment: agents of subtle change? Environmental Health Perspectives, 107, 907-938. 2. FMCG (2014). Fast moving consumer goods (FMCG) sector in India. Accessed from http://www.slideshare.net/iimjobs/india-fmcg-sector-report-may-2014 on 1.04.2015 3. Ramaswamy, B. R., Shanmugam, G., Velu, G., Rengarajan, B., Larsson, D. G. J. (2011). GC-MS analysis and ecotoxicological risk assessment of triclosan, carbamazepine and parabens in Indian rivers. Journal of Hazardous Materials, 186, 1586–93. 4. Ramaswamy, B.R. (2015). Environmental risk assessment of personal care products. In “Personal care products in the aquatic environment” Eds. Diaz‐Cruz, M.S. and Barcelo, D. Doi:10.1007/698_2014_297.
24th Symposium on Environmental Chemistry, R. Babu Rajendran, Oral presentation (Sapporo; 2015)
24th Symposium of Environmental Chemistry, Nguyen Minh Tue, Oral presentation (Sapporo; 2015)
Toxic profiling of river waters from Vietnam and India: Major estrogens andandrogens are natural hormones○Nguyen Minh Tue1,2,*, Hidenori Matsukami3, Le Huu Tuyen1,2, Go Suzuki3, Shin Takahashi1,4,
Pham Hung Viet2, Annamalai Subramanian1, Tatsuya Kunisue1, Shinsuke Tanabe1
(1 Center for Marine Environmental Studies, Ehime University, 3-5 Bunkyo-cho, Matsuyama, Japan,2 Hanoi University of Science, 334 Nguyen Trai, Hanoi, Vietnam, 3 National Institute forEnvironmental Studies, 16-2 Onogawa, Tsukuba, Japan, 4 Center of Advanced Technology for theEnvironment, Ehime University, 3-5-7 Tarumi, Matsuyama, Japan, * Tel./Fax: +81-89-927-8196, e-mail:[email protected])
[Introduction]
Due to rapid urbanization and lack of appropriate wastewater treatment, an estimated 90% of all wastewater indeveloping countries is discharged untreated to water bodies1. Such direct discharge of wastewater leads to a widerange of chemicals of domestic, industrial, medical origins entering the rivers. A recent study2 analyzing riversediments from major Vietnamese cities found a total of 185 compounds including household-related chemicals,endocrine disrupting chemicals, pharmaceutical and personal care products. The study indicated that rivers fromdeveloping countries could be polluted heavily by various chemicals originated from untreated domestic discharges.
Considering the large number of contaminants occurring in urban river water of developing countries, a multi-endpoint evaluation of potential toxicities, identification of potentially toxic compounds, and understanding the toxicrelevance of artificial chemicals as compared with naturally produced hormones are necessary. This study aimed to bethe first evaluation of various endocrine and hormone disrupting endpoint in surface water from Vietnam and Indiausing a panel of Chemical-Activated LUciferase gene eXpression (CALUX) assays. Tentative identification of majorcontributors to estrogenic and androgenic activities in water was also conducted using effect-directed fractionation andchemical analysis.
[Methods]
Sample collection and extraction: In Vietnam, surface water samples were collected near populated areas in Hanoi(n = 7, Kim Nguu and Nhue Rivers) in January 2014. In India, the sampling of surface water was conducted inChennai (Buckingham Canal, Adyer and Korttalaiyar Rivers, n = 11) and Bangalore (Vrishabhavathi River, n = 8) inSeptember 2014. Each sample was passed through a 1-µm glass fiber filter. Compounds in the suspended phase wereextracted from the filter by successive sonication with distilled acetone, dichloromethane, and hexane. The filtrate wasloaded on a prewashed Oasis® HLB Plus LP cartridge (Waters Corporation), then compounds in the dissolved phasewere eluted with 6 ml methanol. All extracts were solvent-exchanged into biochemical-grade dimethyl sulfoxide forsubsequent analyses.
CALUX assays: Activities of water extracts were evaluated using a panel of CALUX assays for estrogen,androgen, progesterone, glucocorticoid and aryl-hydrocarbon receptors (ERα-, AR-, PR-, GR- and PAH-CALUX)3–5
using cell lines licensed from BioDetection System b.v (The Netherlands). Agonist activities were expressed in termsof equivalent of 17β-estradiol (E2EQ), dihydrotestosterone (DHTEQ), dexamethasone (DexEQ), progesterone(ProgEQ) and benzo[a]- pyrene (BaPEQ), respectively. The procedures for cell cultures and assays have beendescribed elsewhere5–6.
Identification of estrogens and androgens: Pooled HLB extracts were prepared for Hanoi and Bangalore fromsamples with high CALUX activities and were fractionated into 35 fractions using high performance liquidchromatography (HPLC) with a Synergi Polar-RP column (10×250 mm, 4 µm, Phenomenex) and a mobile phaseconsisting of 10% acetonitrile and increasing proportions of methanol in MilliQ water (60%–75%). Chemicalidentification analyses of significant estrogenic and androgenic fractions were conducted using a 1290 Infinity/6530Accurate Mass Quadrupole Time-of-Flight LC–MS system (Agilent) with a Zorbax Eclipse Plus C18 column(2.1×100 mm, 1.8 µm, Agilent).
[Results and discussion]
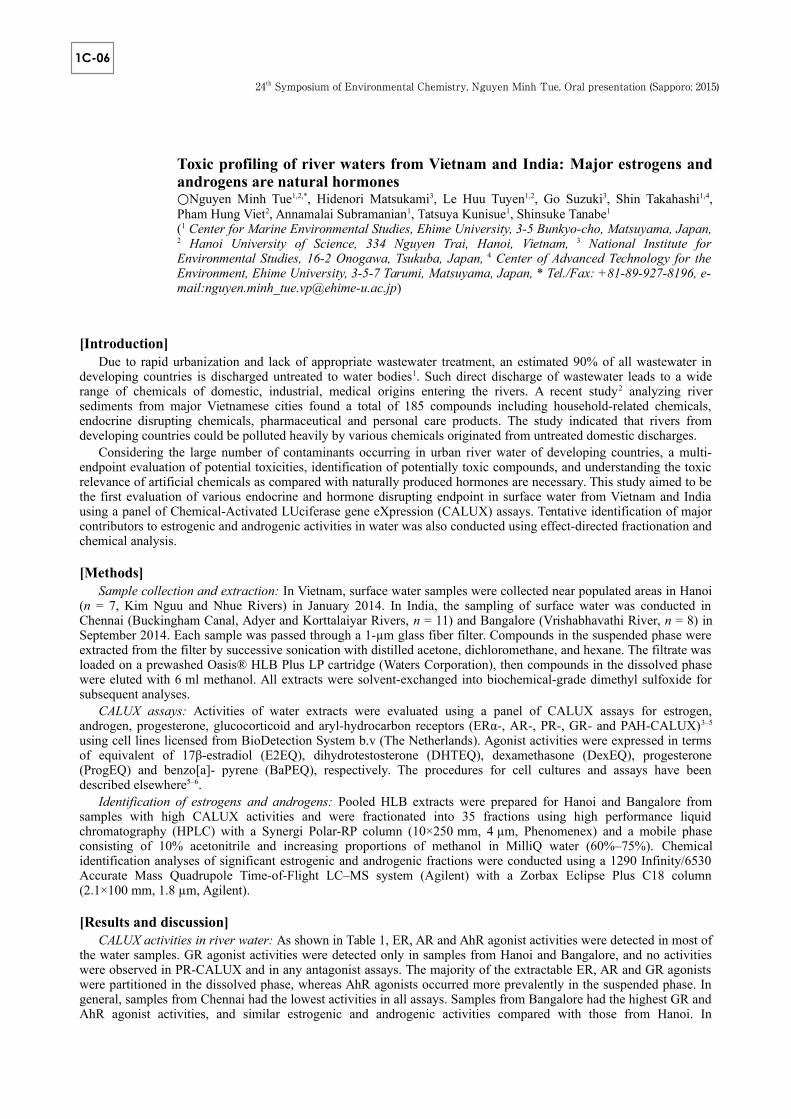
CALUX activities in river water: As shown in Table 1, ER, AR and AhR agonist activities were detected in most ofthe water samples. GR agonist activities were detected only in samples from Hanoi and Bangalore, and no activitieswere observed in PR-CALUX and in any antagonist assays. The majority of the extractable ER, AR and GR agonistswere partitioned in the dissolved phase, whereas AhR agonists occurred more prevalently in the suspended phase. Ingeneral, samples from Chennai had the lowest activities in all assays. Samples from Bangalore had the highest GR andAhR agonist activities, and similar estrogenic and androgenic activities compared with those from Hanoi. In
24th Symposium of Environmental Chemistry, Nguyen Minh Tue, Oral presentation (Sapporo; 2015)
1C-06

24th Symposium of Environmental Chemistry, Nguyen Minh Tue, Oral presentation (Sapporo; 2015)
comparison with other studies, the E2EQ levels in Hanoi and Bangalore rivers were in the same range previouslyreported in surface waters from Asia and Europe (up to 50 ng/L4,7) but lower than reported for effluents from USA (upto 100 ng/L8). There are only a few studies on the androgenic activities in surface water4,9, all reported a similar rangeof DHTEQ levels to those found for Hanoi and Bangalore rivers in this study. The DexEQ levels in samples fromBangalore were higher than those reported for municipal effluents in Europe and Australia (up to 78 ng/L4,10,11).
Table 1.ER, AR, GR and AhR agonistic activities (ng EQ/L) in water samples from Vietnamese and Indian rivers
Hanoi Chennai Bangalore
Min Median Max Min Median Max Min Median Max
E2EQ (dissolved phase) 7.4 23 31 0.13 0.95 6.5 0.16 36 55E2EQ (totala) 7.5 23 31 0.14 0.98 6.6 0.18 37 56
DHTEQ (dissolved phase)b 5.2 61 110 ND 0.99 30 0.92 36 85
DexEQ (dissolved phase)b ND 40 61 ND ND ND ND 69 150
BaPEQ (dissolved phase) 36 280 540 20 70 200 40 590 720BaPEQ (totaal) 140 420 970 30 250 760 47 1400 6600a Dissolved and suspended phases, b Activities not detected in suspended phase
Identification of major estrogens and androgens: CALUXresults of HPLC fractions obtained from pooled HLB extractsfrom Hanoi and Bangalore indicated four significant estrogenicfractions (FE1–4) contributing 67%, 11%, 18%, 1.4% (Hanoi)and 28%, 5.6%, 65%, 0.7% (Bangalore) of the total E2EQ levelsin all fractions, respectively (Fig. 1). Fraction FE1, FE3 and FE4contained natural estrogens: respectively estriol (E3), E2 andestrone (E1). In FE1, E3 accounted for 110% and 40% of theCALUX-derived E2EQ levels for Hanoi and Bangalore,respectively. E2 contributed 96% and 77% for FE3 fractions,whereas E1 contributed 60% and 46% for FE4 fractions.Fractions FE2 for both Hanoi and Bangalore contained bisphenolA accounting for <10% of CALUX-derived E2EQ levels.
There were three main fractions with significant androgenicactivities (FA1–3) for each of the HLB pooled extracts,accounting for 32%, 28%, 21% (Hanoi) and 9%, 68%, 9.5%(Bangalore) of the total DHTEQ levels in all fractions,respectively (Fig. 1). FA2 contained DHT, explaining 81% of themeasured activity in this fraction for Hanoi and 39% forBangalore. Fractions FA1 and FA3 contained compoundstentatively identified as the natural androgens androstenedioneand androstanedione, with chemical formulae of C19H26O2 andC19H28O2, respectively. Confirmation of the identities andCALUX potencies of these compounds using authentic standardsis necessary.
[Conclusions]
Significant ER, AR, GR and AhR agonist activities weredetected in river waters from Hanoi, Vietnam and Bangalore,India. Large activity contribution from natural estrogens andandrogens in river waters suggest household discharge as a majorsource of surface water pollution in these countries.
[References]
1) UN Water, http://www.wsscc.org/fileadmin/files/pdf/publication/IYS_2008_-_tackling_a_global_crisis.pdf.2) Duong H.T. et al., 2014, Chemosphere 107:462–472.3) Sonneveld E. et al., 2005, Toxicol. Sci. 83:136–148.4) van der Linden S.C. et al., 2008, Environ. Sci. Technol. 42:5814–5820.5) Sonneveld E. et al., 2011, Toxicol. In Vitro 25:545–554; Pieterse B. et al., 2013, Environ. Sci. Technol. 47:11651–11659.6) Suzuki G. et al., 2013, Environ. Sci. Technol. 47:2898–2908.7) Hashimoto T. et al., 2008, Water Res. 41:2117–2126; Schiliro T. et al., 2009, Chemosphere 75:335–340.8) Tyler C.R. et al., 2005, Environ. Sci. Technol. 39:2599–2607.9) Thomas K.V. et al., 2002, Environ. Toxicol. Chem. 21:1456–1461.10) Macicova P. et al., 2014, Environ. Sci. Technol. 48:12902–12911; Bain P.A. et al., 2014, Environ. Toxicol. Chem. 33:2297–2307.
Fig. 1. Estrogenic (FE) and androgenic (FA)fractions from pooled dissolved phase waterextracts (A), and calculated activity contributionof identified estrogens (B) and androgens (C)
24th Symposium of Environmental Chemistry, Nguyen Minh Tue, Oral presentation (Sapporo; 2015)

24th Symposium of Environmental Chemistry, Cheng-Chun Huang, Oral presentation (Sapporo; 2015)
Occurrence of endocrine disrupting chemicals in wastewater treatment plants in Taiwan ○Cheng-Chun Huang1, Yi-Po Yeh1, Masanobu Kawanishi2, Takashi Yagi2, Pei-Hsin Chou1 (1Department of Environmental Engineering, National Cheng Kung University, Taiwan. 2Department of Biology, Graduate School of Science, Osaka Prefecture University, Japan.)
[Introduction] The issues of endocrine disrupting chemicals (EDCs) have been taken more seriously in recent
years. EDCs can be found in daily necessities, such as pharmaceuticals, pesticides and plastic products. Through water, soil and air, EDCs may be spread into the environment to influence development and health of organisms. In this study, recombinant yeast bioassays were used to investigate whether samples from wastewater treatment plants (WWTPs) in Taiwan showed estrogen receptor, androgen receptor and aryl hydrocarbon receptor (AhR) disrupting activities. Liquid chromatography electrospray ionization-tandem mass spectrometry (LC-ESI-MS/MS) was also used to analyze EDCs in WWTP samples, and the contributions of selected EDCs to the endocrine disrupting activities were evaluated. [Methods]
Samples were collected from two domestic WWTPs (DH and AP) and one swine WWTP (L) in Taiwan. The yeast cells used for bioassays contained expression plasmids carrying different receptor genes and lac-Z gene reporter plasmids. If a sample contains EDCs capable of binding to target receptors, β-galactosidase is induced to metabolize o-nitrophenyl-β-D-galactopyranoside / chlorophenol red-β-D-galactopyranoside to nitrophenol/chlorophenol red that can be measured by reading the absorbance at 405/540 nm. The LC system was Agilent 1260 Infinity (Agilent, USA) equipped with a Xbridge BEH C18 column (75×2.1 mm i.d., 2.5 μm, Water, USA). The MS/MS system was Thermo TSQ Quantum Ultra (Thermo, USA), and multiple reaction monitoring was applied to identify selected EDCs. The mobile phase was composed of water and methanol with 0.2% formic acid/ammonium hydroxide in positive/negative ion mode. [Results and discussion]
Bioassay results showed that estrogenic, anti-estrogenic, androgenic, anti-androgenic and AhR agonist activities were detected in WWTP influent and effluent samples, which were similar to or lower than those found in other countries. Though nuclear receptor disrupting activities generally decreased after wastewater treatment processes, detectable activities were still found in effluent samples, indicating incomplete removal of EDCs in WWTPs in Taiwan. LC-MS/MS results revealed that estrone, 17β-estradiol, estriol, bisphenol A, nonylphenol, triclosan, progesterone and
24th Symposium of Environmental Chemistry, Cheng-Chun Huang, Oral presentation (Sapporo; 2015)
1C-07

24th Symposium of Environmental Chemistry, Cheng-Chun Huang, Oral presentation (Sapporo; 2015)
testosterone were detected at ng/L levels in domestic wastewater samples, and the removal efficiencies were better for natural hormones. The estimated estrogenic activities calculated from LC-MS/MS results were slightly higher than the bioassay-derived estrogenic activities, which may be due to the presence of anti-estrogenic compounds in wastewater samples. In contrast, bioassay-derived anti-androgenic activities were much higher than the anti-androgenic activities estimated from LC-MS/MS results, showing that unidentified anti-androgenic compounds may occur in Taiwanese wastewater samples.
Figure 1: Comparison of estimated estrogenic activities calculated from LC-MS/MS and bioassay-derived estrogenic activities (*: lower than detection limit)
[Conclusion]
By using bioassays and LC-MS/MS analysis, various kinds of EDCs were detected in the treated effluents of domestic and swine WWTPs. WWTP effluents may be one of the main sources of EDCs in Taiwan’s aquatic environment. [Reference] 1. S. C. Van der Linden, et al. Environmental Science & Technology 2008, 42(15): 5814–5820.2. K. Shiizaki, et al. Toxicology in Vitro 2010, 24:638-644. 3. E. J. Routledge, et al. Environmental Toxicology and Chemistry 1996, 15(3): 241-248. 4. C. A. Miller III. Toxicology and Applied Pharmacology 1999, 160(3):297-303.
24th Symposium of Environmental Chemistry, Cheng-Chun Huang, Oral presentation (Sapporo; 2015)
24th Symposium on Environmental Chemistry, Wageh Sobhy Darwish, Oral presentation (Sapporo; 2015)
Nitrate content in Egyptian meat products and its modulatory effects on xenobiotic metabolizing enzymes ○Wageh Sobhy Darwish1, 2,Mohamed Abdallah Hussein2, Yoshinori Ikenaka1,
Shouta M.M. Nakayama1, Hazuki Mizukawa1, Mayumi Ishizuka1 1Graduate School of Veterinary Medicine, Hokkaido University, Japan. 2Food Control Department, Faculty of Veterinary Medicine, Zagazig University, Egypt
[Introduction] Nitrates are chemical preservatives that used to be added to meat products especially canned meat to prevent the deadly bacteria Clostridium botulinum. Additionally, nitrates give the meat products the attractive red color and extend shelf life of meat [1]. Meat products can provide human with 5-20% of the total dietary nitrates, while the rest amount comes from vegetables and drinking water [1]. Ingested nitrates reduced to nitrites can bind with hemoglobin to form methemoglobin. In methemoglobinemia, the hemoglobin is unable to release oxygen effectively to body tissues leading to many problems such as blue baby syndrome [2]. Dietary nitrates can also increase the endogenous formation of the carcinogenic N-nitroso compounds [1]. On the other hand, nitrates and nitrites can also converted to nitric oxide. This pathway has very beneficial effects in lowering the blood pressure, treating of cardiovascular diseases and reducing cardiac attacks [3]. Living organisms have developed enzyme systems that metabolize xenobiotics to hydrophilic and readily excretable metabolites called Xenobiotic metabolizing enzymes (XMEs). Such metabolism usually proceeds through distinct stages: phase I metabolism introduces a functional group into the molecule such as cytochrome P450 (CYP)1A1 and 1A2, and phase II metabolism involves conjugation of the phase I metabolites through the functional group, with substrates such as glutathiones and glucuronic acids. The paradox between the harmful and healthful effects of nitrates pushed us to firstly screen the contents of nitrates in some Egyptian meat products and secondly to investigate the constitutive effects of nitrates on XMEs in the human colon (HCT-15) cell line. [Methods] Hundred meat product samples including corned beef, canned meat, luncheon and sausage (25 each) were collected randomly from supermarkets in Zagazig city, Egypt. Nitrate contents were measured according to the method of AOAC. HCT-15 cell lines were exposed to sodium nitrate in a concentration range of (0-100 mg/L). Cell viability was assayed. RNA extraction and cDNA synthesis were performed. mRNA expression of phase I, II enzymes and transcriptional elements were examined using Real-Time PCR method [4]. Mutagenicity assay was performed using Ames assay. Reactive Oxygen Species (ROS) was measured. Statistical analysis was done. Nitrate content in Egyptian meat products and its modulatory effects on xenobiotic metabolizing enzymes Presenters: ○Wageh Sobhy Darwish1, 2,Mohamed Abdallah Hussein2, Yoshinori Ikenaka1,Shouta M.M. Nakayama1,Hazuki Mizukawa1, Mayumi Ishizuka1 1Graduate School of Veterinary Medicine, Hokkaido University, Japan. 2Food Control Department, Faculty of Veterinary Medicine, Zagazig University, Egypt.
24th Symposium on Environmental Chemistry, Wageh Sobhy Darwish, Oral presentation (Sapporo; 2015)
1C-08

24th Symposium on Environmental Chemistry, Wageh Sobhy Darwish, Oral presentation (Sapporo; 2015)
[Results and discussion]
[Conclusion] This study indicated that Egyptian meat products had acceptable nitrate contents except for canned meats. Nitrate modulated XMEs in human HCT-15 cells. Nitrate had novel antimutagenic effects. Low concentrations of nitrate is advisable in meat industry however higher doses should be avoided. [References] 1. Cunningham E. 2013. J. Acad. Nutr. Diet. Doi:10.1016/j.jand.2013.07.014. 2. Hord NG., Tang Y. and Bryan NS. 2009. Am. J. Clin. Nutr. 90: 1-10. 3. Greer FR. and Shannon M. 2005. Pediatrics. 116: 784-786. 4. Darwish W., Ikenaka Y., Nakayama S. and Ishizuka M. 2014. Biol. Trace Elem. Res.158: 243-248.
Fig 1. Nitrate contents and its modulatory effects on XMEs A) Nitrate content, B) Cell viability, C) Nitrate mutagenicity, D) ROS Production, E-J) mRNA
expression of E) CYP1A1, F) CYP1A2, G) UGT1A6, H) SULT1A1/2, I) NQO1, J) HO-1.
Columns carrying different letters are significantly different from each other at P< 0.05.
This study screened the nitrate content in the Egyptian meat products. The permissible limits of nitrate content given by Egyptian authorities are 125 ppm for canned luncheon and sausage and 50 ppm for corned beef and canned meat. The results indicated that the 25 % of corned beef, 95 % of canned sausage and 100% of canned luncheon met these limits, while all canned meat exceeded the limits and were at the top on their nitrate content among examined samples (Fig 1A). There is a large debate between the helpful and hazardous effects of nitrate on the human. We further extended our study to investigate the modulatory effects of nitrates on XMEs in the human HCT-15 cells. Nitrate treatment did not alter cell viability (Fig. 1B). Nitrate not only did not have any mutagenic activities in the Ames mutagenicity assay, but also it can reduce B[a]P mutagenicity on a dose based fashion (Fig. 1C). However, nitrate produced ROS on a concentration-dependent model (Fig. 1D). By studying the modulatory effects of nitrate on XMEs, we observed that nitrate reduced Phase I enzymes (CYP1A1 & CYP1A2) mRNA expression, induced phase II detoxifying enzymes like UGT1A6, SULT1A1/2 and NQO1 & strongly induced HO-1 (Fig. 1 E-J). These results declare that low concentrations of nitrate may have other beneficial effects as antimutagenic substances. However, high concentrations should be avoided to reduce the resultant oxidative stress.
24th Symposium on Environmental Chemistry, Wageh Sobhy Darwish, Oral presentation (Sapporo; 2015)
24th Symposium on Environmental Chemistry、Nesta BORTEY-SAM、Oral presentation (Sapporo; 2015)
Concentrations of polycyclic aromatic hydrocarbon metabolites (OH-PAHs) in domestic animal in
Kumasi, Ghana ○ Nesta Bortey-Sam1, Yoshinori Ikenaka1, Osei Akoto2, Shouta M.M. Nakayama1, Jemima Marfo1,
Hazuki Mizukawa1, Mayumi Ishizuka1
1Graduate School of Veterinary Medicine, Hokkaido University 2Department of Chemistry, Kwame Nkrumah University of Science and Technology, Kumasi, Ghana
[Introduction]
As a developing country, the economic and population growth rates in Ghana over the past few years have seen
tremendous increase. The growing rate of industrialization is gradually leading to contamination and deterioration
of the environment and pollution is likely to reach disturbing levels. This has led to an increase in levels of
polycyclic aromatic hydrocarbons (PAHs) in the environment. The assessment of the health risk of humans
exposed to PAHs is primarily based on results from animal studies and this has indicated that PAHs can produce
carcinogenic and mutagenic effects. Based on high levels of PAHs in air and soils in Kumasi (Bortey-Sam et al.
2014), we developed and validated a method for the quantification of 13 OH-PAHs in human and domestic animal
urine since there is currently no study on OH-PAHs in human urine in Kumasi, Ghana.
[Materials and methods]
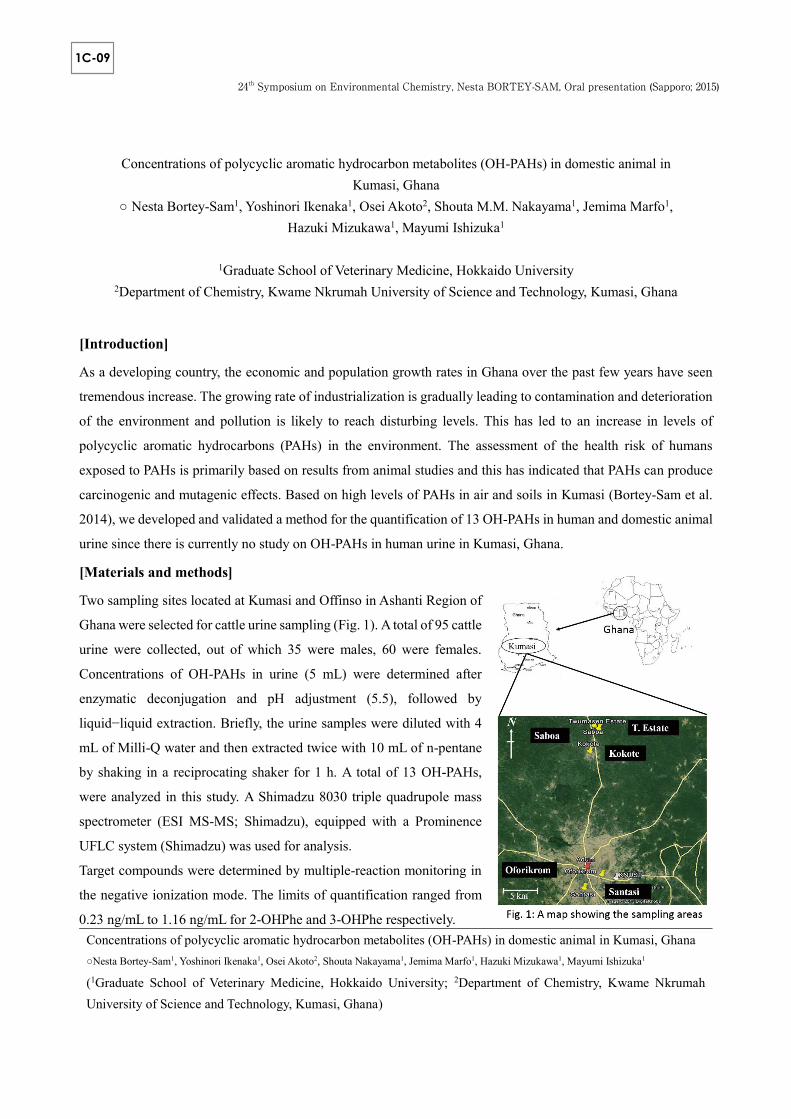
Two sampling sites located at Kumasi and Offinso in Ashanti Region of
Ghana were selected for cattle urine sampling (Fig. 1). A total of 95 cattle
urine were collected, out of which 35 were males, 60 were females.
Concentrations of OH-PAHs in urine (5 mL) were determined after
enzymatic deconjugation and pH adjustment (5.5), followed by
liquid−liquid extraction. Briefly, the urine samples were diluted with 4
mL of Milli-Q water and then extracted twice with 10 mL of n-pentane
by shaking in a reciprocating shaker for 1 h. A total of 13 OH-PAHs,
were analyzed in this study. A Shimadzu 8030 triple quadrupole mass
spectrometer (ESI MS-MS; Shimadzu), equipped with a Prominence
UFLC system (Shimadzu) was used for analysis.
Target compounds were determined by multiple-reaction monitoring in
the negative ionization mode. The limits of quantification ranged from
0.23 ng/mL to 1.16 ng/mL for 2-OHPhe and 3-OHPhe respectively. Concentrations of polycyclic aromatic hydrocarbon metabolites (OH-PAHs) in domestic animal in Kumasi, Ghana ○Nesta Bortey-Sam1, Yoshinori Ikenaka1, Osei Akoto2, Shouta Nakayama1, Jemima Marfo1, Hazuki Mizukawa1, Mayumi Ishizuka1
(1Graduate School of Veterinary Medicine, Hokkaido University; 2Department of Chemistry, Kwame Nkrumah University of Science and Technology, Kumasi, Ghana)
24th Symposium on Environmental Chemistry, Nesta BORTEY-SAM, Oral presentation (Sapporo; 2015)
1C-09

24th Symposium on Environmental Chemistry、Nesta BORTEY-SAM、Oral presentation (Sapporo; 2015) [Results]
From the results, 2-OHNap, OHPhe and 1-OHPyr were detected in the cattle urine samples collected. There was
no significant correlation between age of the cattles and measured OH-PAHs (p > 0.05) but there was significant
correlation among measured OH-PAHs (p ˂ 0.05). OH-PAHs accumulation in male and female cattles was not
statistically significant (p > 0.05) except for 2-OHNap and 1-9-OHPhe. The high molecular weight (HMW) PAHs
were not detected in the samples collected. High levels of 1-OHPyr was observed and levels were higher compared
to similar study by Saengtienchai et al. (2014).
[Discussion]
The results from cattle studies showed that high levels of OH-PAHs were measured compared to other studies. 2-
OHNap was the most abundant OH-PAH (2.7 ± 5.9; p ˂ 0.01) and was reported to reflect more specifically the
exposure to PAHs in ambient air. Levels of 2-OHNap measured in Kokote was significantly higher compared to
the other sites (p ˂ 0.05). High levels of 1 OH-Pyr were measured in samples and could be due to the high vehicular
activities and rampant combustion. The high levels of OH-PAHs in cattle urine could also be the use of pesticides
and mothballs containing
naphthalene. Strong
positive correlation
between all OH-PAHs
indicated similar
source/route of exposure.
However, there was no
correlation between age
(cattle) and OH-PAHs,
possibly due to the short
half-life of PAHs. The study
showed that there wasn’t any differences in sex in terms of OH-PAHs accumulation except for 2-OHNap and 1-9-
OHPhe. Principal component analysis (Fig. 2) of the results showed a clear separation between samples collected
in Kokote and the other sites. 2-OHNap, 1-9-OHPhe and 1-OHPyr were highly associated with Kokote indicating
high contamination within the sample site (Fig. 2). Kokote has several farmlands, and the use and sometimes abuse
of pesticides containing PAHs was possible. Therefore, human urine were collected from hospitals in Kumasi to
determine the concentrations of 13 OH-PAH, OHPyrene Glucuronide and Sulfate; estimate health risk to PAHs
using 8-hydroxy-2-deoxyguanosine, a biomarker for oxidative stress due to exposure to carcinogenic compounds.
[References] 1. Bortey-Sam N, Ikenaka Y, Nakayama M.M.S, Akoto O, Yared YB, Baidoo E, Mizukawa H, Ishizuka M..
Occurrence, distribution, sources and toxic potential of Polycyclic Aromatic Hydrocarbons (PAHs) in surface soils from the Kumasi metropolis, Ghana. Sci Total Environ 496: 471-478 (2014).
2. Saengtienchai A, Ikenaka Y, Nakayama S, Mizukawa H, Kakehi M, Bortey-Sam N, Darwish W, Tsubota T, Terasaki M, Poapolathep A, Ishizuka M. Determination of metabolites in the urine of 16 mammalian species exposed to environmental pyrene. Environ Toxicol and Chem 33(9): 2062-2069 (2014).
24th Symposium on Environmental Chemistry, Nesta BORTEY-SAM, Oral presentation (Sapporo; 2015)

24th Symposium if Environmental Chemistry, Natasha Vogt, Oral presentation (Sapporo, 2015)
Screening of aryl hydrocarbon ligands in sediment from three harbours in South Africa Natasha Vogt1, Pieter Holtzhausen1, Rialet Pieters1, Brent Newman2, John Giesy3 (1 North West University, 2 Council for Scientific and Industrial Research (CSIR), 3 University of Saskatchewan)
[Introduction]
Polychlorinated dibenzo-para-dioxins and -furans (PCDD/Fs) and other dioxin-like (dl)
compounds, such as dioxin-like polychlorinated biphenyls (dl-PCBs) and some polycyclic
aromatic hydrocarbons (PAHs), are industrially produced organic chemical compounds. These
tend to accumulate and persist in sediments and soils either because of continued introduction
into the environment, like the PAHs, or because of their resistance to degradation. These
compounds pose a health risk to sediment dwelling organisms. On account of their ability to
biomagnify and bioaccumulate they can affect organisms throughout the food web where they
create detrimental effects due to their carcinogenic, mutagenic and endocrine disrupting
properties (Brack, 2003). Even though there has been an increase in the attention on identifying
the presence and impacts that these compounds may have in South Africa, the level of attention
is lower than what it is in other countries around the world and although South Africa has
guidelines in place for other pollutants, such as metals, there are no such guidelines in place to
monitor for these compounds.
[Methods]
Sediment from three South African harbours, namely Port Elizabeth, Cape Town, and Durban
were collected. The biological assessment was done with genetically modified rat hepatoma–
H4IIE-luc cells–that screen for—and semi-quantify those ligands able to bind to the aryl
hydrocarbon receptor (AhR) (such as dl-compounds and selected PAHs) (Baston and Denison,
2011). To target for these AhR ligands an extraction and clean-up of the collected harbour
sediment was prepared. Duplicate extracts were produced, one containing persistent AhR
ligands (dl-compounds) and another with all-AhR ligands (mostly PAH) (Nieuwoudt et al., 2009).
By comparing the cells’ responses elicited by the extracts (measured as bioassay equivalences
(BEQs)) to the Canadian sediment quality guideline (SQG) it is possible to determine whether
the concentrations present could cause detrimental effects to the exposed organisms in the
sampled systems (Canadian Council of Ministers of the Environment, 2001).
[Results and discussion] The extracts containing persistent compounds only elicited BEQs of <LOQ–0.04 ng BEQ/g,
<LOQ–0.23 ng BEQ/g and <LOQ–0.5 ng BEQ/g for Durban, Cape Town and Port Elizabeth
harbours respectively. The all-AhR ligands extracts elicited BEQs of 0.1–0.65 ng BEQ/g,
24th Symposium if Environmental Chemistry, Natasha Vogt, Oral presentation (Sapporo, 2015)
1C-11

24th Symposium if Environmental Chemistry, Natasha Vogt, Oral presentation (Sapporo, 2015)
<LOQ–1.2 ng BEQ/g, and <LOQ–1.19 ng BEQ/g for Durban, Cape Town and Port Elizabeth
harbours respectively. These data were compared to Canadian sediment quality guidelines,
which are represented as a 1% proportion of the organic carbon. Cape Town harbour had levels
of all-AhR ligands that exceeded the probable effect level (PEL) at 14 sites. Levels of persistent
compound exceeded the PEL at 10 sites, and exceeded the interim sediment quality guideline
(ISQG) at two sites. The Durban harbour had levels of all-AhR ligands that exceeded the ISQG
at one site, and exceeded the PEL at 16 sites. There were levels of persistent AhR ligands in
excess of the ISQG at five sites, and the PEL at five sites. The Port Elizabeth harbour had levels
of all-AhR ligands that exceeded the PEL at six sites, and there were four sites that exceeded
the PEL due to the persistent compound levels.
The PEL was exceeded with persistent compound levels at 83%, 21% and 40% at Cape Town,
Durban and Port Elizabeth respectively, indicating that benthic organisms at these sites would
experience frequent adverse effects. This is particularly concerning due to their long
degradation time and their detrimental effects.
[Conclusion] These South African harbours are seriously impacted by AhR ligands, and it is expected that
the biota inhabiting these regions are experiencing detrimental effects due to these compounds.
It would be beneficial to perform chemical analysis to identify the compounds responsible for
the effects on the H4IIE-luc bioassay.
[References]
Baston, D.S., Denison, M.S., 2011. Considerations for potency equivalent calculations in the Ah
receptor-based CALUX bioassay: Normalization of superinduction results for improved sample
potency estimation. Talanta 83, 1415-1421.
Brack, W., 2003. Effect-directed analysis: a promising tool for the identification of organic toxicants
in complex mixtures? Analytical and Bioanalytical Chemistry 377, 397-407.
Environment, C.C.o.M.o.t., 2001. Canadian Sediment Quality Guidelines for the Protection of
Aquatic Life: Polychlorinated dioxins and furans (PCDD/Fs). Canadian Council of Ministers of the
Environment, Winnipeg.
Nieuwoudt, C., Quinn, L.P., Pieters, R., Jordaan, I., Visser, M., Kylin, H., Borgen, A.R., Giesy, J.P.,
Bouwman, H., 2009. Dioxin-like chemicals in soil and sediment from residential and industrial areas
in central South Africa. Chemosphere 76, 774-783.
24th Symposium if Environmental Chemistry, Natasha Vogt, Oral presentation (Sapporo, 2015)

24th Symposium of Environmental Chemistry, Lesa Thompson, Oral presentation (Sapporo; 2015)
Vector-controlling pesticides in free-ranging chickens in KwaZulu-Natal, South Africa ○Lesa A Thompson1, Yoshinori Ikenaka1, Johan J van Vuren2, Victor Wepener3, Nico Smit3, Wynand Vlok4, Yared B Yohannes1, Hazuki Mizukawa1, Shouta M M Nakayama1, Mayumi Ishizuka1 (1 Hokkaido University, 2 University of Johannesburg, 3 North-West University, 4 BioAssets)
[Introduction] It was estimated that there were 198 million cases of malaria worldwide in 2013, with 584,000 deaths [WHO, 2014]. The vector of the Plasmodium parasite, the Anopheles mosquito, is often controlled using pesticides such as dichloro-diphenyl-trichloroethane (DDT). Toxicity in wildlife resulted in banning of DDT in many countries, and use is now strictly regulated. Although thought to be relatively safe for humans, some reports suggest exposure may result in neurotoxic, carcinogenic, immunotoxic and reproductive effects [Van den Berg, 2009]. South Africa has an integrated malaria control programme in three provinces, including KwaZulu-Natal (KZN) [Maharaj R et al, 2012]. Intervention focusses on indoor residual spraying (IRS) using insecticides, along with timely diagnosis and effective therapy to control the parasite. [Methods] The study area is located in the Jozini (3,442km2 area) and uMhlabuyalingana (3,964km2) Local
Municipalities, in uMkhanyakude District of KZN Province. Sampling was conducted in October 2014.
Free-ranging chickens (n=48) living in homesteads where DDT is sprayed annually and broiler chickens
(n=6) from local shops were purchased and muscle samples collected. Samples were analysed for DDT
and its metabolites DDD and DDE, including o,p’- and p,p’-isomers. Estimated daily intake (EDI) values
for chicken in the region were acquired by questionnaires (n=20) conducted with local people, in order
to calculate human health risk (HR, carcinogenic) values for consumption of chicken meat. [Results and discussion] The predominant DDT congener detected was the p,p’-DDE metabolite (mean, 10.09ug/g wet weight).
The mean ΣDDT detected in free-ranging chicken muscle was 11.98ug/g ww. Results from the
questionnaire of local people showed that estimated daily intake (EDI) of chicken meat is much lower in
the study area (32.17g/d) than the national level. Based on this EDI value, HR values were much greater
than one for DDTs detected in free-ranging chickens. However, most chicken eaten in the area is
intensively-reared broilers. Analysis of these showed much lower levels of ΣDDTs (mean, 0.19ug/g ww). Cooking meat reduces DDT levels, particularly if the cooking broth is discarded after boiling. However,
local people should be advised against regular consumption of meat from free-ranging chickens. The
Vector-controlling pesticides in free-ranging chickens in KwaZulu-Natal, South Africa ○Lesa A Thompson1, Yoshinori Ikenaka1, Johan J van Vuren2, Victor Wepener3, Nico Smit3, Wynand Vlok4, Yared B Yohannes1, Hazuki Mizukawa1, Shouta M M Nakayama1, Mayumi Ishizuka1 (1 Hokkaido University, 2 University of Johannesburg, 3 North-West University, 4 BioAssets)
24th Symposium of Environmental Chemistry, Lesa Thompson, Oral presentation (Sapporo; 2015)
1C-12

24th Symposium of Environmental Chemistry, Lesa Thompson, Oral presentation (Sapporo; 2015)
most abundant DDT detected was p,p’-DDE, the congener commonly associated with fertility problems
in wild avian species [Gómez-Ramírez P et al, 2012]. Presence of p,p’-DDT is an indicator of recent
release of DDT into the environment.
[Conclusion]
The Jozini and uMhlabuyalingana Local Municipalities encompass the Ndumo Game Reserve, home to
over 400 bird species – the effect of DDT on these has not been ascertained. The Phongolo River
passes from here to cross into Mozambique—where it becomes the Maputo River—and thence to the
Indian Ocean at Maputo Bay, entering the global aquatic ecosystem. Resistance by vectors to pesticides
(including DDT) and therapeutic agents have been recorded in many malaria areas, including KZN. The
benefits of using this chemical may soon be outweighed by the costs—both financially and to the
environment—and other methods of malaria control need to be developed and implemented. However,
the persistence of DDT in the environment ensures that its detrimental effects will be seen for some time
to come on the environment and organisms, including humans and their livestock living in the area. [References]
Gómez-Ramírez, P., Martínez-López, E., García-Fernández, A. J., Zweers, A. J., & Van den Brink, N. W. (2012).
Organohalogen exposure in a Eurasian Eagle owl (Bubo bubo) population from Southeastern Spain: Temporal–spatial
trends and risk assessment. Chemosphere, 88(8), 903-911.
Maharaj, R., Morris, N., Seocharan, I., Kruger, P., Moonasar, D., Mabuza, A., Raswiswi, E., & Raman, J. (2012). The
feasibility of malaria elimination in South Africa. Malar J, 11, 423.
van den Berg, H. (2009). Global status of DDT and its alternatives for use in vector control to prevent
disease. Environmental Health Perspectives, 117(1), 1656-1663.
World Health Organisation (WHO). 2014. World Malaria Report, 2014.
24th Symposium of Environmental Chemistry, Lesa Thompson, Oral presentation (Sapporo; 2015)

24thSymposium on Environmental Chemistry, Takeshi Nakano, Oral presentation (Sapporo; 2015)
Congener specific analysis of PCBs after bioremediation of contaminated river sediment Aleksandra Djuric1,○Takeshi Nakano2,Vladimir P. Beskoski1,Ivana Ugljesic1, Srdjan Miletic3,Jelena Avdalovic3,Gordana Gojgic-Cvijovic3,Mila Ilic3,Miroslav M. Vrvic1(1Faculty of Chemistry, University of Belgrade,2Research Center for Environmental Preservation, Osaka University , 3Department of Chemistry-Institute of Chemistry, Technology and Metallurgy, University of Belgrade)
[Introduction] Persistent Organic Pollutants, (POPs) are chemical substances that persist in the
environment, bioaccumulate through the food chain and cause adverse effects on human health and the environment [1, 2]. They include the group of Polychlorinated Biphenyls, (PCBs), industrial chemicals which may be substituted with 1 - 10 chlorine atoms [3-6]. Due to their chemical inertness, heat resistance and low dielectric constants PCBs were used as insulations in transformers and large capacitors, as heat exchangers and color additives in the production of plastics [3-6]. We have studied the biodegradation of PCBs in sediment samples collected from rivers in the territory of Belgrade, Serbia. The aim of our study was to analyze the potential of allochthonous and autochthonous microorganisms in the process of biodegradation of PCBs from sediments of the river to protect the environment and future potential treatment of these sites. [Methods]
For the study of bioremediation PCBs, sediment composite samples from the four depths in the ratio 1: 2: 3: 4 (w/w) were made. In Bushnell - Haas medium (modified, chloride-free) sand and composite samples, 1: 1 (w / w) were added. The experiment lasted 70 days with alternating anaerobic - aerobic cycles and inoculation on 21st and 56th day. Inoculation was performed by a consortium of the genera Pseudomonas (sp. NS009 and CHNSH-17), Rodococcus (sp. RNP05 and CHP-NR31) and Achromobacter (sp. NS014). These allochthonous microorganisms were isolated from sites contaminated by petroleum products and after microbiological and biochemical characterization their 16S rRNA sequences were deposited in GenBank. In parallel, activity of autochtonous microorganisms on PCB transformation were followed. As abiotic control sterilized sample were used. Biodegradation processes are interrupted by sterilization. Then extraction was carried out with a mixture of acetone: hexane, 1: 1 (V / V). The PCB content was analyzed congener specifically in obtained samples by GC-MS/MS method. Sample analysis was performed by HRGC/HRMS(JEOL JMS-800D) and GC-TQMS (450-GC/320-MS, Bruker). The congener assignment was confirmed using HT8-PCB capillary column (Kanto , 60m × 0.25mm). [Results and discussion]
The river sediment samples were collected from four locations in the territory of Belgrade: confluence of the Topčider river with Čukarički Rukavac (CR), Marina Dorćol (MD), Zemunski Kej (ZK) and the confluence of the river Sava and the Danube, Usce (U).
24th Symposium on Environmental Chemistry, Takeshi Nakano, Oral presentation (Sapporo; 2015)
1C-13
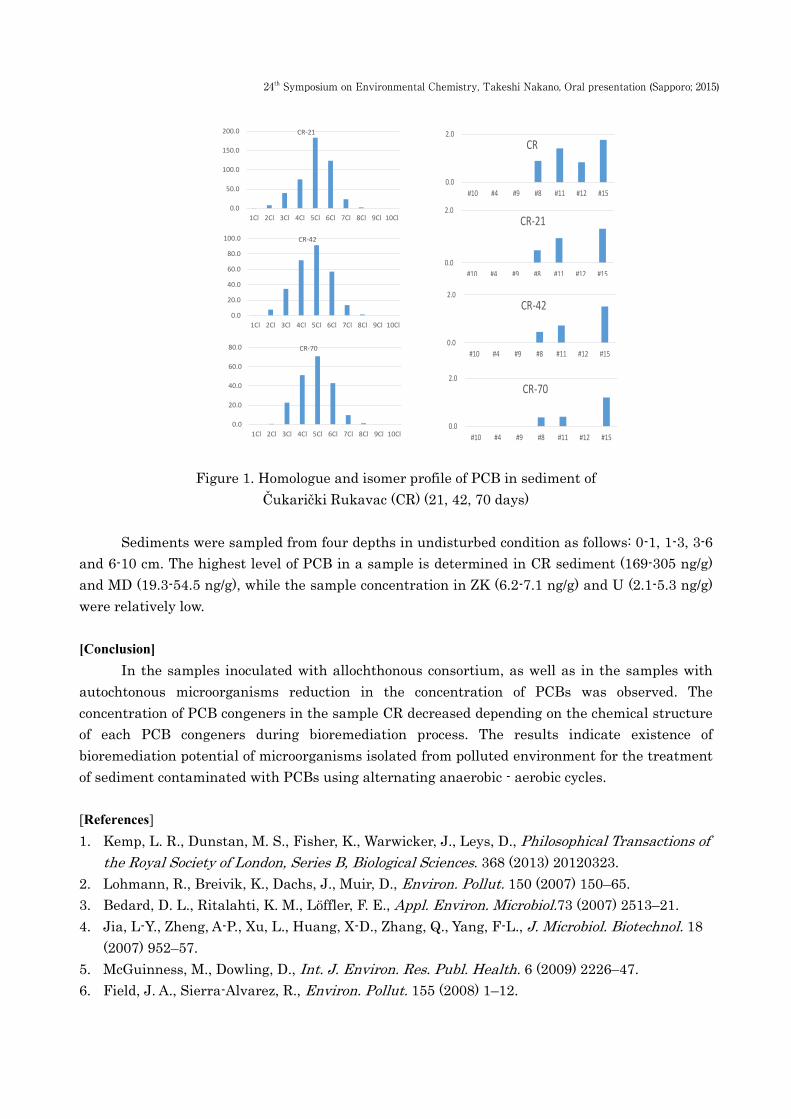
24thSymposium on Environmental Chemistry, Takeshi Nakano, Oral presentation (Sapporo; 2015)
Figure 1. Homologue and isomer profile of PCB in sediment of Čukarički Rukavac (CR) (21, 42, 70 days)
Sediments were sampled from four depths in undisturbed condition as follows: 0-1, 1-3, 3-6
and 6-10 cm. The highest level of PCB in a sample is determined in CR sediment (169-305 ng/g) and MD (19.3-54.5 ng/g), while the sample concentration in ZK (6.2-7.1 ng/g) and U (2.1-5.3 ng/g) were relatively low. [Conclusion]
In the samples inoculated with allochthonous consortium, as well as in the samples with autochtonous microorganisms reduction in the concentration of PCBs was observed. The concentration of PCB congeners in the sample CR decreased depending on the chemical structure of each PCB congeners during bioremediation process. The results indicate existence of bioremediation potential of microorganisms isolated from polluted environment for the treatment of sediment contaminated with PCBs using alternating anaerobic - aerobic cycles. [References] 1. Kemp, L. R., Dunstan, M. S., Fisher, K., Warwicker, J., Leys, D., Philosophical Transactions of
the Royal Society of London, Series B, Biological Sciences. 368 (2013) 20120323. 2. Lohmann, R., Breivik, K., Dachs, J., Muir, D., Environ. Pollut. 150 (2007) 150–65. 3. Bedard, D. L., Ritalahti, K. M., Löffler, F. E., Appl. Environ. Microbiol.73 (2007) 2513–21. 4. Jia, L-Y., Zheng, A-P., Xu, L., Huang, X-D., Zhang, Q., Yang, F-L., J. Microbiol. Biotechnol. 18
(2007) 952–57. 5. McGuinness, M., Dowling, D., Int. J. Environ. Res. Publ. Health. 6 (2009) 2226–47. 6. Field, J. A., Sierra-Alvarez, R., Environ. Pollut. 155 (2008) 1–12.
0.0
50.0
100.0
150.0
200.0
1Cl 2Cl 3Cl 4Cl 5Cl 6Cl 7Cl 8Cl 9Cl 10Cl
CR-21
0.0
20.0
40.0
60.0
80.0
100.0
1Cl 2Cl 3Cl 4Cl 5Cl 6Cl 7Cl 8Cl 9Cl 10Cl
CR-42
0.0
20.0
40.0
60.0
80.0
1Cl 2Cl 3Cl 4Cl 5Cl 6Cl 7Cl 8Cl 9Cl 10Cl
CR-70
0.0
2.0
#10 #4 #9 #8 #11 #12 #15
CR
0.0
2.0
#10 #4 #9 #8 #11 #12 #15
CR-21
0.0
2.0
#10 #4 #9 #8 #11 #12 #15
CR-42
0.0
2.0
#10 #4 #9 #8 #11 #12 #15
CR-70
24th Symposium on Environmental Chemistry, Takeshi Nakano, Oral presentation (Sapporo; 2015)
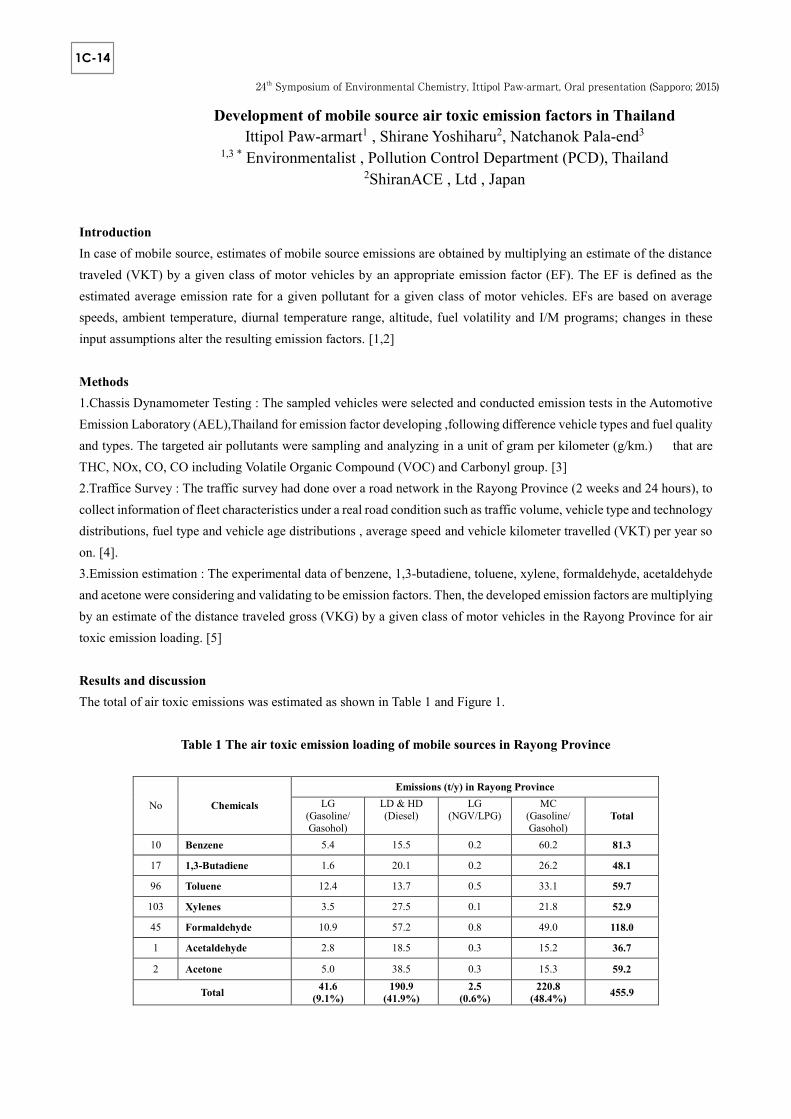
24thSymposium of Environmental Chemistry, Ittipol Paw-armart, Oral presentation (Sapporo; 2015)
Development of mobile source air toxic emission factors in Thailand Ittipol Paw-armart1 , Shirane Yoshiharu2, Natchanok Pala-end3
1,3 * Environmentalist , Pollution Control Department (PCD), Thailand 2ShiranACE , Ltd , Japan
Introduction In case of mobile source, estimates of mobile source emissions are obtained by multiplying an estimate of the distance traveled (VKT) by a given class of motor vehicles by an appropriate emission factor (EF). The EF is defined as the estimated average emission rate for a given pollutant for a given class of motor vehicles. EFs are based on average speeds, ambient temperature, diurnal temperature range, altitude, fuel volatility and I/M programs; changes in these input assumptions alter the resulting emission factors. [1,2]
Methods 1.Chassis Dynamometer Testing : The sampled vehicles were selected and conducted emission tests in the Automotive Emission Laboratory (AEL),Thailand for emission factor developing ,following difference vehicle types and fuel quality and types. The targeted air pollutants were sampling and analyzing in a unit of gram per kilometer (g/km.) that are THC, NOx, CO, CO including Volatile Organic Compound (VOC) and Carbonyl group. [3] 2.Traffice Survey : The traffic survey had done over a road network in the Rayong Province (2 weeks and 24 hours), to collect information of fleet characteristics under a real road condition such as traffic volume, vehicle type and technology distributions, fuel type and vehicle age distributions , average speed and vehicle kilometer travelled (VKT) per year so on. [4]. 3.Emission estimation : The experimental data of benzene, 1,3-butadiene, toluene, xylene, formaldehyde, acetaldehyde and acetone were considering and validating to be emission factors. Then, the developed emission factors are multiplying by an estimate of the distance traveled gross (VKG) by a given class of motor vehicles in the Rayong Province for air toxic emission loading. [5]
Results and discussion The total of air toxic emissions was estimated as shown in Table 1 and Figure 1.
Table 1 The air toxic emission loading of mobile sources in Rayong Province
No Chemicals
Emissions (t/y) in Rayong Province LG
(Gasoline/ Gasohol)
LD & HD (Diesel)
LG (NGV/LPG)
MC (Gasoline/ Gasohol)
Total
10 Benzene 5.4 15.5 0.2 60.2 81.3
17 1,3-Butadiene 1.6 20.1 0.2 26.2 48.1
96 Toluene 12.4 13.7 0.5 33.1 59.7
103 Xylenes 3.5 27.5 0.1 21.8 52.9
45 Formaldehyde 10.9 57.2 0.8 49.0 118.0
1 Acetaldehyde 2.8 18.5 0.3 15.2 36.7
2 Acetone 5.0 38.5 0.3 15.3 59.2
Total 41.6 (9.1%)
190.9 (41.9%)
2.5 (0.6%)
220.8 (48.4%) 455.9
24th Symposium of Environmental Chemistry, Ittipol Paw-armart, Oral presentation (Sapporo; 2015)
1C-14

24thSymposium of Environmental Chemistry, Ittipol Paw-armart, Oral presentation (Sapporo; 2015)
Figure 1 Total VOC emissions of mobile sources and VOC contributions in Rayong Province (2013)
Combining the real fleet data with the developed emission factors, the following air toxic emissions inventory from mobile sources in the Rayong Province are 220.8 tons/year of MC , 190.9 tons/year of LD & HD , 41.6 tons/year of LG and 2.5 tons/year of LG which have been used the CNG and LPG.. To determine in air toxic species, formaldehyde is the most contribution which is 26%, following with benzene (18%), acetone and toluene which are 13% respectively. In case of the Rayong Province, motorcycles are most contribution of air toxic emissions because they are mostly driven under "urban" driving conditions and their population numbers are huge compared with others. The traffic survey results indicated that the 2 stroke motorcycles are available on the real road conditions and contribute for 40 % of the number of motorcycles. Since motorcycles are mostly driven in residential areas, contribution of their air toxic emissions need to be concerned and implemented for any appropriated policy and counter measure such as proper approaches in clean engine technology, clean and alternative fuel, sustainable traffic management and I/M program for an in-used vehicles for better air quality and quality of life of the people in the Rayong Province. Conclusion The emission factor development and emission inventory in study region are needed and important for policy makers to establish and implement appropriated policy and counter measure for solving air pollution problem sustainability. However, the user of this approach should understand that there is the potential for significant error in some cases to develop emission factors and emission inventory. In case of mobile sources, emission factors are related with specific variables such as vehicle characteristics, traffic volume, fleet on the real condition, fuel types including driving behaviors for example. It must be noted that uncertainty of development of emission factors and the emission estimation data need to be concerned and validated with several of data sources such as data of monitoring station, emission models and other research studies and then it will be accepted finally. References
1.Vicente Franco, Marina Kousoulidou, Marilena Muntean, Leonidas Ntziachristos, Stefan Hausberger , Panagiota Dilara,2013, Road vehicle emission factors development: A review, Atmospheric Environment 70 (2013) 84-97.
2.Westerdahl, D., Wang, X., Pan, X., Zhang, K., 2009. Characterization of on-road vehicle emission factors and microenvironmental air quality in Beijing, China. Atmospheric Environment 43, 697-705.
3. 40 CFR Part 86 – Control of Emissions from new and in-use highway vehicles and engines, https://www.law.cornell.edu/cfr/text/40/part-86
4.Pavlos S. Kanaroglou , Ron N. Buliung.,2008, Estimating the contribution of commercial vehicle movement to mobile emissions in urban areas, Transportation Research Part E 44 (2008) 260–276.
5.Methods for calculating the emissions of transport in the Netherlands.,2007, http://www.cbs.nl/NR/rdonlyres/1B91772D-52E2-48FE-B117-45BB9E1E948A/0/...
LG(Gasoline/Gasohol)9%
LD & HD (Diesel)42%LG
(NGV/LPG)1%
MC(Gasoline/Gasohol)48%
Total VOC emissions in Rayong Province (2013)
Benzene18%
1,3-Butadiene10%
Toluene13%Xylenes
12%
Formaldehyde
26%
Acetaldehyde
8%
Acetone13%
Contribution of VOC emissions of mobile sources in Rayong Province (2013)
24th Symposium of Environmental Chemistry, Ittipol Paw-armart, Oral presentation (Sapporo; 2015)
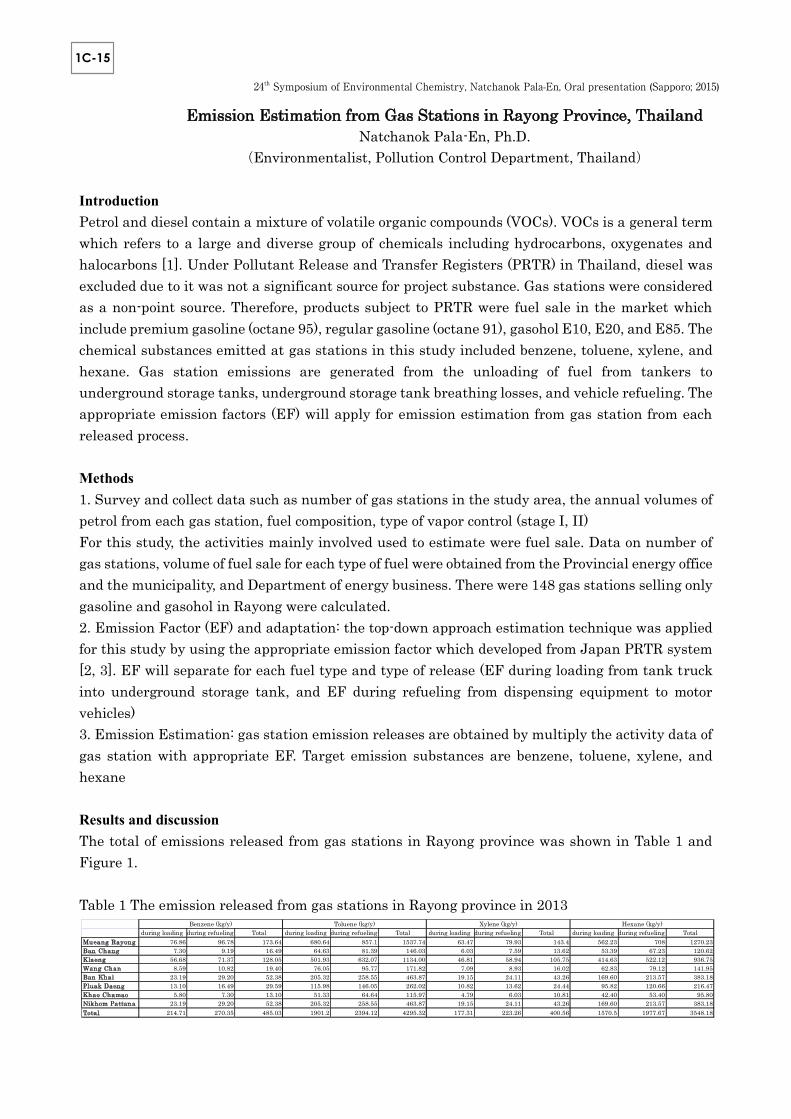
24th Symposium of Environmental Chemistry, Natchanok Pala-En, Oral presentation (Sapporo; 2015)
Emission Estimation from Gas Stations in Rayong Province, Thailand Natchanok Pala-En, Ph.D.
(Environmentalist, Pollution Control Department, Thailand) Introduction Petrol and diesel contain a mixture of volatile organic compounds (VOCs). VOCs is a general term which refers to a large and diverse group of chemicals including hydrocarbons, oxygenates and halocarbons [1]. Under Pollutant Release and Transfer Registers (PRTR) in Thailand, diesel was excluded due to it was not a significant source for project substance. Gas stations were considered as a non-point source. Therefore, products subject to PRTR were fuel sale in the market which include premium gasoline (octane 95), regular gasoline (octane 91), gasohol E10, E20, and E85. The chemical substances emitted at gas stations in this study included benzene, toluene, xylene, and hexane. Gas station emissions are generated from the unloading of fuel from tankers to underground storage tanks, underground storage tank breathing losses, and vehicle refueling. The appropriate emission factors (EF) will apply for emission estimation from gas station from each released process. Methods 1. Survey and collect data such as number of gas stations in the study area, the annual volumes of petrol from each gas station, fuel composition, type of vapor control (stage I, II) For this study, the activities mainly involved used to estimate were fuel sale. Data on number of gas stations, volume of fuel sale for each type of fuel were obtained from the Provincial energy office and the municipality, and Department of energy business. There were 148 gas stations selling only gasoline and gasohol in Rayong were calculated. 2. Emission Factor (EF) and adaptation: the top-down approach estimation technique was applied for this study by using the appropriate emission factor which developed from Japan PRTR system [2, 3]. EF will separate for each fuel type and type of release (EF during loading from tank truck into underground storage tank, and EF during refueling from dispensing equipment to motor vehicles) 3. Emission Estimation: gas station emission releases are obtained by multiply the activity data of gas station with appropriate EF. Target emission substances are benzene, toluene, xylene, and hexane Results and discussion The total of emissions released from gas stations in Rayong province was shown in Table 1 and Figure 1. Table 1 The emission released from gas stations in Rayong province in 2013
during loading during refueling Total during loading during refueling Total during loading during refueling Total during loading during refueling TotalMueang Rayong 76.86 96.78 173.64 680.64 857.1 1537.74 63.47 79.93 143.4 562.23 708 1270.23Ban Chang 7.30 9.19 16.49 64.63 81.39 146.03 6.03 7.59 13.62 53.39 67.23 120.62Klaeng 56.68 71.37 128.05 501.93 632.07 1134.00 46.81 58.94 105.75 414.63 522.12 936.75Wang Chan 8.59 10.82 19.40 76.05 95.77 171.82 7.09 8.93 16.02 62.83 79.12 141.95Ban Khai 23.19 29.20 52.38 205.32 258.55 463.87 19.15 24.11 43.26 169.60 213.57 383.18Pluak Daeng 13.10 16.49 29.59 115.98 146.05 262.02 10.82 13.62 24.44 95.82 120.66 216.47Khao Chamao 5.80 7.30 13.10 51.33 64.64 115.97 4.79 6.03 10.81 42.40 53.40 95.80Nikhom Pattana 23.19 29.20 52.38 205.32 258.55 463.87 19.15 24.11 43.26 169.60 213.57 383.18Total 214.71 270.35 485.03 1901.2 2394.12 4295.32 177.31 223.26 400.56 1570.5 1977.67 3548.18
Benzene (kg/y) Toluene (kg/y) Xylene (kg/y) Hexane (kg/y)
24th Symposium of Environmental Chemistry, Natchanok Pala-En, Oral presentation (Sapporo; 2015)
1C-15

24th Symposium of Environmental Chemistry, Natchanok Pala-En, Oral presentation (Sapporo; 2015)
Figure 1 Pollutants released from gas stations in Rayong province (2013) Results indicated that the maximum emissions released from gas stations in Rayong was Toluene approximately released 4,295 kg/yr (49%), follow by Hexane 3,548 kg/yr (41%), Benzene 485 kg/yr (5%), and Xylene 401 kg/yr (5%) respectively. All emissions were released maximum in Rayong district where the main industrial estates were located and a large number of vehicles when compared with other districts in Rayong. However, the result of each emission released quite low than expected. Since the fuel quality and fuel types between Thailand and Japan were different. Therefore, EF of gas station in this study will be affected to the emission estimation. In addition, gas stations in Rayong province do not install the vapor control unit (VRU stage II) therefore; the emission release from gas station should be higher. As a result, the emission factor from gas station in Thailand should be developed. Conclusion This project was aimed to estimate emission released from gas stations in Rayong province, Thailand using the top-down approach estimation technique with the base year 2013. There were 148 gas stations selling only gasoline and gasohol in Rayong were calculated. Toluene was the maximum release substance follow by Hexane, Benzene, and Xylene. The results shown the amount of emission released from gas station quite low. Therefore, the gas station estimation should be update by using the appropriate EF which was developed for Thailand. It will be indicated that the gas station emission factor development and emission inventory are necessary and should be improve for the specific area. References 1. Environment Australia, 1999, Emission Estimation Technique Manual for Aggregated Emissions from Service Station. 2. Use of the actual measurements conducted by the association of industry or the member enterprise Petroleum Association of Japan, Japan National Federation Petroleum Commercial Association; PRTR system and gas station (March 2003). 3. Data used for calculating the released or transferred quantity. https:/www.env.go.jp/en/chemi/prtr/manual/pdf/mat03-10.pdf
Benzene, 485 kg/y
(5%)
Toluene, 4295 kg/y
(49%)
Xylene, 401 kg/y
(5%)
Hexane, 3548 kg/y
(41%)
24th Symposium of Environmental Chemistry, Natchanok Pala-En, Oral presentation (Sapporo; 2015)

24th Symposium of Environmental Chemistry, Mohammad Raknuzzaman Oral presentation (Sapporo; 2015)
Trace metals contamination in surface water, sediment, some fishes and sea foods in the coastal area, Bangladesh ○Mohammad Raknuzzaman 1, Mohammad Raknuzzaman 1, Md Kawser Ahmed 2, Md Saiful Islam 3, Md Habibullah-Al-Mamun 1, Shigeki Masunaga 1 1 Graduate School and Faculty of Environment and Information Sciences, Yokohama National University, Japan, 2 Department of Oceanography, University of Dhaka, Dhaka 1000, Bangladesh,
3 Department of Soil Science, Patuakhali Science and Technology University, Dumki, Patuakhali 8602, Bangladesh
[Introduction] Accumulation of trace metals in aquatic ecosystems has become a great problem throughout the world, especially in developing countries like Bangladesh. Trace metals contamination in sediment has been regarded as a critical problem of marine ecosystem due to their toxicity and bioaccumulation (Chapman et al., 1998). In recent, the trace metals contamination in fish and sea foods have also become an important and severe issue to human health risk (Cid et al., 2001). The increased unplanned industrialization, urbanization, huge population growth and overall trans-boundary rivers problem accelerate the coastal water pollution in Bangladesh. The concerned authorities and general people have not been aware and no complete study carried out so far regarding this issue that makes vital public health problem in near future. Thus, the aim of the study is to determine the concentrations of certain trace metals (Cr, Ni, Cu, Zn, As, Cd and Pb) and their distribution in surface water, sediment, some fishes and sea foods in the Bangladeshi Coastal area. [Methods] Four coastal sampling sites; Cox’s Bazar (St1), Chittagong (St2), Meghna Estuary (St3) and Sunderbans (St4) with three different stations of each were investigated Fig. 1. The water, sediment, fish and sea foods composite samples were collected in August, 2013. The surface water samples were collected in 100 ml polyethylene bottles previously washed with dilute nitric acid and deionized water. Coastal bed sediment (top to 5 cm) was collected by Ekman grab sampler. Sub-samples were oven dried at 105°C for 24 hour. Fish samples were rinsed in deionized water to remove surface adherents. About 100 g of fish muscle were taken for freeze drying and stored in polypropylene Ziploc bag. Heavy metals were analyzed by ICP-MS (Agilent 7700, USA). [Results and discussion] Metal concentrations in water samples are shown in Fig. 2. Among the sites, the Cox’s Bazar hatchery showed the highest levels of Zn (1392), Cu (510) and Pb (109 µg/L). It might be due to huge discharge of different salts and chemicals from hatcheries through the underground pipeline to the beach area. Metal concentrations in different fish and see foods are shown in Table 1 where significantly higher metal concentration was observed in crabs than in fishes. Crabs may be considered as an absolutely discrepant aquatic species and represent a totally different bioaccumulation pattern (Ololade et al., 2011). Arsenic (As) concentration was remarkably high in Cox’s Bazar fish and crab samples (Table 1) due to illegal operation of hatcheries and other industries near
0.001
0.01
0.1
1
10
100
1000
10000
Cr Ni Cu Zn As Cd Pb
Con
cent
ratio
n [µ
g/L]
Metals
Cox,s Bazar Cox,s Bazar-Hatchery Chittagong portSunderbans Bhola
Fig. 1: Map showing sampling sites in the coastal area of Bangladesh
Fig. 2: Mean (± SD) values of metal concentrations (µg/L) in water.
St 4
St 3
St 1
St 2
24th Symposium of Environmental Chemistry, Mohammad Raknuzzaman Oral presentation (Sapporo; 2015)
1C-16

24th Symposium of Environmental Chemistry, Mohammad Raknuzzaman Oral presentation (Sapporo; 2015)
beach area. Interestingly, remarkable high concentration of Zn was observed in every fish and sea foods. Metal concentrations of sediment samples are shown in Fig. 3. Among the sites, the Chittagong ship breaking area showed the highest levels of Cr (56), Ni (37) Cu (28) and Pb (41 mg/kg dw) which exceeded the Canadian Sediment Quality Guidelines Table 2. It might be due to huge ship breaking and different activities of chemical industries.
Table 1: Mean metal concentrations (mg/kg wet-weight) in fish and sea foods. Sampling sites Species Cr Ni Cu Zn As Cd Pb
Cox’s Bazar Fish (n = 9) 2.2 0.56 14 138 13 0.075 0.63 Shrimp (n =18) 1.1 1.30 13 131 2.5 0.086 0.38 Crab (n = 9) 29 43 400 1480 53 8.3 68
Chittagong port Fish (n = 9) 1.1 0.51 5.9 53 2.7 0.06 0.51 Shrimp (n = 18) 1.0 1.40 22 107 2.0 0.12 0.31 Crab (n = 9) 14 34 305 902 34 4.2 79
Sunderbans Fish (n = 9) 0.15 0.10 1.3 31 1.1 0.033 0.07 Shrimp (n = 18) 0.34 0.49 63 53 0.92 0.022 0.10 Crab (n = 9) 0.48 1.40 80 157 1.3 0.094 0.49
Bhola Fish (n = 9) 0.32 0.28 1.6 34 0.76 0.051 0.25 Shrimp (n =18) 0.27 0.77 52 114 0.30 0.097 0.13 Crab (n = 9) 0.29 0.81 111 137 1.5 0.19 0.24
Table 2: Guidelines levels of metals in marine sediment described in the literature and range of concentrations (mg/kg dw) found in the studied area.
International Standard Cr Ni Cu Zn As Cd Pb References Range of concentration 14−56 20−37 3−28 20−54 2−4 0.003−0.07 8−40 Present study Canadian Sediment Quality 52.3 15.9 18.7 124 7.24 0.7 30.2 *ISQG *ISQG: Interim Marine Sediment Quality Guidelines, Canadian Sediment Quality Guidelines for the Protection of Aquatic Life.
Summary tables, 2001. ISBN 1- 896997-34-1.
Fig. 3: Mean (± SD) values of metal concentrations in sediment for each sampling site (n=18, mg/kg dw).
[Conclusion] Cox’s Bazaar hatchery water was more contaminated by the metals. Crab and Sole (benthic fish) were more susceptible to possess high metal accumulation than other fishes. Arsenic (As) and Zink (Zn) concentration was remarkably high in Cox’s Bazar fish and crab. Metal concentrations in sediment were also very high in Chittagong ship breaking area. The high concentration of metals in this coastal ecosystem is highly affecting the aquatic life and increasing the ecological risk in the coastal area of Bangladesh that must be continued taking into account and remediating. [References] Cid et al (2001), Food Chemistry, 75, 93-100. Chapman et al (1998), Canadian Journal of Fisheries and Aquatic Sciences, 55, 2221–2243. Ololade et al (2011), J. Environ. Sci. Health A 46, 898–908.
010203040506070
Cr Ni Cu Zn As Cd Pb
Conc
entr
atio
n m
g/kg
Metals
Cox,s Bazar Cox,s Bazar-Hatchery Chittagong port
Chittagong ship Sunderbans Bhola
00.020.040.060.08
0.1
Cd
24th Symposium of Environmental Chemistry, Mohammad Raknuzzaman Oral presentation (Sapporo; 2015)

24th Symposium of Environmental Chemistry, Tanapon Phenrat, Oral presentation (Sapporo; 2015)
Does It Really Work? Ten-Year Monitored Natural Recovery of Pb-Contaminated Mine Tailing in Klity Creek, Kanchanaburi Province, Thailand Tanapon Phenrat1,2*, Ashijya Otwong3,4, and Aphichart Chantharit1,2(1Research Unit
for Integrated Natural Resources Remediation and Reclamation (IN3R), Department of Civil Engineering, Faculty of
Engineering, Naresuan University, Phitsanulok, Thailand, 650002Center of Excellence for Sustainability of Health,
Environment and Industry (SHEI), Faculty of Engineering, Naresuan University, Phitsanulok, Thailand, 3 ENLAWTHAI
Foundation, Bangkok, Thailand , 4 Faculty of Law, Naresuan University, Phitsanulok, Thailand, 65000)
Introduction Contaminated by lead (tens to hundreds of thousands mg/kg) from the spill of lead mine tailing in 1998, Klity Creek has become Thailand’s first official remediation ordered by the court in 2013. Related government agencies decided to restore the creek by monitored natural recovery (MNR) since 2006. Nevertheless, partly due to unclear evidence of the natural recovery (NR) potential by the creek, Klity villagers and NGOs won a lawsuit in 2013 against the government agencies. Up to now, no scientific study has evaluated the feasibility of using MNR to restore the creek. This study qualitatively and quantitatively evaluated the feasibility of using MNR to clean up the creek.
Fig.1 (Left) Klity Creek and Sampling Stations and (Right) Conceptual Site Model of Pb Exposure and Pb Transformation via Klity Creek Contamination.
24th Symposium of Environmental Chemistry, Tanapon Phenrat, Oral presentation (Sapporo; 2015)
1C-17

24th Symposium of Environmental Chemistry, Tanapon Phenrat, Oral presentation (Sapporo; 2015)
Methods We analyzed the physical and chemical transformation of lead contaminated sediment (LCS) in the creek and empirically determined the NR rates using ten years of data monitoring of water and sediment samples from eight monitoring stations. Results and discussion Since LCS in Klity Creek can pose human health and ecological risks, the probable remedial action goal may include restoration of Klity Creek to be safe for Klity villagers to live their traditional lifestyles (drinking water, catching fish, and growing vegetables using water from the creek) and to safely support aquatic lives and their ecological functions. Thus, the ecological PEC of lead according to a sediment quality guideline (130 mg/kg) is a good choice of CL to achieve the goals. Nevertheless, one might argue that Klity Creek is in a natural lead occurrence zone of which the natural lead background concentration is already higher than the PEC. Thus, the 95th percentile of the background lead concentration in the creek (4,627 mg/kg in sediment and 0.039 mg/L in water) is also a reasonable choice of CL. After 16 years of interaction with Klity Creek, abiotic transformation of the spilled mine tailing is observable. The lead mine tailing from KT3P (not spilled to the creek) still contains the greatest amount of exchangeable lead (15.50% or 4,885.70 mg/kg) while the dredged lead-contaminated mine tailing in KT2W (one-year interaction with the creek) has a smaller amount of exchangeable lead (1.690% or 1,688.70 mg/kg). The exchangeable fraction of lead becomes smallest in the LCS at KC4 15 years after the spill is the largest (7.56x10⁻³% or 3.99 mg/kg). Qualitatively, the exchangeable fraction in the contaminated sediment samples decreases exponentially with respect to the interaction time with the creek. Similarly, the sulphide fraction of lead in lead-contaminated mine tailing from KT3P (12.40% or 3,907.8 mg/kg) is much greater than that of the LCS at KC4 (3.59% or 1,895 mg/kg) after 15 years of interaction with the creek in good agreement with the assumption of oxidative transformation by the creek. Burial and in-place dilution of spilled lead-contaminated mine tailing by non-contaminated sediment followed by sediment consolidation is a very important physical phenomenon, which can effectively recover the creek. On the other hand, sediment resuspension by flow turbulence and bioturbation can seriously retard the NR of the creek. Certainly, these two phenomena operate at Klity Creek to some degree. Nevertheless, we cannot separately evaluate their contribution based on the physical and chemical characteristics of sediment we have. We must evaluate their roles together with the contribution of other prohibiting or promoting phenomena through the analysis of the NR rate constant. The NR rates of lead in water ranged from 0.0617±0.0235 to 0.7505±0.2631 month-1, and the creek could restore the water back to the background concentration within 20 to 46 months. However, NR rates of lead in sediment ranged from 0.0053±0.0024 to 0.0111±0.0030 month-1, between 11 to 68 times slower than the water. Conclusion If MNR is selected as the sole remedial approach, it may require up to 107 years to restore the sediment to the background lead concentration of the creek (95th percentile = 4,627 mg/kg) and up to 282 years until reaching the probable effect concentration (PEC) (130 mg/kg).
24th Symposium of Environmental Chemistry, Tanapon Phenrat, Oral presentation (Sapporo; 2015)

24thSymposium of Environmental Chemistry, G. Dj.GOJGIC-CVIJOVIC, Oral presentation (Sapporo; 2015)
Removal of heavy metals from mine tailings by rhamnolipid biosurfactant using a continuous column laboratory system ○Gordana Dj. Gojgic-Cvijovic1,Ivana Peric2,Vladimir P. Beskoski2,Latinka Slavkovic-Beskoski3, Biljana Dojcinovic1, Miroslav M. Vrvic2 (1 Institute of Chemistry, Technology and Metallurgy, University of Belgrade, 2Faculty of Chemistry, University of Belgrade, Belgrade, 3Vinca Institute of Nuclear Science, University of Belgrade, Belgrade)
[Introduction] The use of biosurfactants to enhance the removal of organic and inorganic contaminants has been widely studied in recent years. In comparison to their chemically synthesized equivalents, biosurfactants have numerous advantages, such as high specificity, biodegradability, low toxicity and the ability to be produced from renewable feedstock. Consequently, technology based on these natural products can be considered as environmentally friendly and nondestructive methods for remediation of polluted water, soil or sediments. Heavy metals pose a persistent threat to all living organisms due to their toxic nature and, unlike organic contaminants, non-biodegradability. One of the main sources of heavy metals is mining activity – besides degradation of large areas of land, the disposal of large volumes of flotation tailings can cause serious ecological problems with time, particularly if the tailing pond is not properly stabilized. Bor region in east Serbia has been characterized as an environmental hot spot due to copper industry activities. It is estimated that during more than 100 years of exploitation of copper ore, 207 Mt of flotation tailings and 450 Mt of overburden were disposed of on the territory of this region1. The aim of this study is to evaluate the effect of rhamnolipid, a glycolipid surfactant, on removal of heavy metals from mine tailings originating from the copper mine Veliki Krivelj (the Copper Mining and Smelting Complex Bor), in a continuous column laboratory system. Two aspects are of particular importance: 1) to predict environmental behavior of metals from mine tailings due to exposure to naturally occuring biosurfactants and 2) to assess whether rhamnolipids can be used in the remediation procedure. [Methods] Rhamnolipid was prepared from fermentation broth of Pseudomonas aeruginosa D3 (Genbank JN995664) by acidic precipitation and chloroform: methanol (2:1, V/V) extraction.2 To evaluate the extraction efficiency of rhamnolipid, a mine tailings sample was washed with biosurfactant solution in a model system with continuous flow to simulate a potential in situ flow. The sample (20g) was packed in a column (diameter 50 mm) with glass wool and quartz sand. Five successive elution steps were performed with 200 ml 0.1 % rhamnolipid solution in NaOH (pH 11.0), where each volume circulated four times through column. NaOH solution (pH 11.0) was used as a control. Flow rate was 2.4 ml/min. Content of heavy metals in all eluates was determined by ICP-OES after digestion with HNO3.
24th Symposium of Environmental Chemistry, Gordana Dj. Gojgic-Cvijovic, Oral presentation (Sapporo; 2015)
1C-18

24thSymposium of Environmental Chemistry, G. Dj.GOJGIC-CVIJOVIC, Oral presentation (Sapporo; 2015)
[Results and discussion] The total content of Fe, Cu, Mn, Zn and Cr in the mine tailings sample was 32584, 485, 270, 98 and 42 mg/kg respectively. The pH value (1:2.5 H2O) was measured to be 9.85, weight loss at 550° C was 3.57% and S content was 3.81%, The effect of rhamnolipids from Pseudomonas sp. D3 on removal of heavy metals from the mine tailings sample is shown in Figure 1. Rhamnolipids form complexes and/or micelles with metals, and due to the reducing interfacial tension, these complexes are desorbed from the solid matrix to the solution. The main functional groups of rhamnolipids that interact with metals are probably the carboxylic groups.
Figure 1. Sequential removal of metals from Veliki Krivelj mine tailings by rhamnolipids during elution In control series, the cumulative removal for Fe, Cu, Zn, Mn and Cr was 9559 (0.03), 1135 (0.23), 3444 (3.52), 232 (0.09) and 163 (0.39) µg/kg (%) respectively. For rhamnolipid biosurfactant, the cumulative removal for Fe, Cu, Zn, Mn and Cr was 30838 (0.09), 33458 (6.9), 8257 (8.44), 645 (0.24) and 197 (0.47) µg/kg (%) respectively. The highest percentages of removal achieved for Cu and Zn are in accordance with the results reported by other authors. 3 Also, in elution series with rhamnolipids, high positive correlations between mobilization of Fe and Cr and Fe and Mn was found. [Conclusion] The results of this research have shown that the presence of rhamnolipid biosurfactant could increase mobilization of heavy metals, especially Cu and Zn, from mine tailings. At the same time and based on the percentage of metal removed, the treatment with rhamnolipids could be used as an initial procedure for continuous treatment methods such as solidification or bioremediation. [References]
1. Antonijevic M. et al., J. Hazard. Mater. 158 (2008) 23-34 2. Rikalovic M. et al., J. Surfactants Deterg. 16 (2013) 673–682 3. Wang S. & Mulligan C.N., Process Biochem. 44 (2009) 296-301
24th Symposium of Environmental Chemistry, Gordana Dj. Gojgic-Cvijovic, Oral presentation (Sapporo; 2015)

24th Symposium on Environmental Chemistry, Noda, Oral presentation (Sapporo; 2015)
Arsenic and Lead Contaminations in Some Rural Villages in India
○Jun Noda, Reika Hakamada, Kazuyki Suzuki Teruo Miura, and Koichiro Sera
(1Rakuno Gakuen University, 2Sam Higginbottom Institute of Agriculture, Technology & Sciences, 3Cyclotron Research Center, Iwate Medical University)
[Introduction]
Arsenic pollution causes health problems throughout the world through different exposure mechanisms. Citizens of the countries of India and Bangladesh have shown chronic health problems due to their usage of arsenic-contaminated groundwater1. It is well known that arsenic-contaminated groundwater is a major source of chronic arsenic exposure, which causes the toxic effect known as arsenicosis, which involves skin abrasion, endocrine abnormalities, cancer, and other health related problems. This investigation focuses on the arsenic contamination problems in tube well groundwater systems and the different forms of arsenic and other toxic elements accumulated in human hair samples taken in a rural area of Allahabad, Utter Pradesh, India. [Methods]
The sample sites were three small villages, Kanua, Chota Kanjasa, and Bada Kanjasa near Allahabad, Uttar Pradesh, India. These three villages are located near the Yamna River. Their relative positions (from upstream to downstream) are Kanua, Chota Kanjasa, and Bada Kanjasa with approximately 1.5 km between each of the villages. The numbers of the sampled tube wells from each village were Kanua (n=13), Chota Kanjasa (n=11), and Bada Knajasa (n=15). A river water sample was taken near Kanua Village. The arsenic concentrations, pH, and Oxidation Reduction Potential (ORP) of water samples were measured in India with a calorimetric arsenic test kit Merckoquant® (Merck, Germany) and portable pH, ORP meter (Horiba, Japan). The measurements of the pH and ORP were conducted directly after the sampling due to the rapid changes of oxidation reduction potentials.
All human hair samples were obtained at three villages near the well water measurement sites in Kanua (n=9), Chota Kanjasa (n=12), and Bada Kanjasa (n=13). Hair samples were analyzed at the Nishina Memorial Cyclotron Center, (NMCC) with a multi-elemental analysis using a Particle Induced X-ray Emission (PIXE) to obtain information on a wide range of elemental contaminants from a limited number of hair samples according to the methods of Sera et al. (1992)2 and further analysis was conducted using the Atomic Absorption Spectrometer (AAS), AAnalyst 800 (Perkin-Elmer, USA) at Rakuno Gakuen University. Since the number of hair samples was limited to orders of milligrams, the multi-elemental analysis by PIXE measurement was both suitable and necessary to obtain an overview of the levels of trace elements in the hair samples. Student’s t-test was used to determine statistically significant differences. A P value of <0.05 was considered to be statistically significant. [Results and discussion]
The results of the arsenic measurements in ground water at the three villages indicated Bada Kanjas, Kanua, and Chota Kanjasa wih 71.1 ppb, 5.0 ppb, and 3.5 ppb, respectively. The AAS measurement results for the hair sample from Bada Kanjas, Kanua, and Chota Kanjasa were 1687 ppb, 656 ppb, and 555 ppb, respectively. The results indicated that the concentrations of arsenic in groundwater and human hair were
24th Symposium on Environmental Chemistry, Jun Noda, Oral presentation (Sapporo; 2015)
1C-19

24th Symposium on Environmental Chemistry, Noda, Oral presentation (Sapporo; 2015)
significantly higher in the village of Bada Kanjasa than in the villages of Kanua and Chota Kanjasa (P<0.05). The PIXE analysis also revealed an unusually high concentration of lead in human hair samples from Chota Kanjasa.
All of the groundwater samples showed average ORP values in the range of -106 to -80 mV in comparison to the river water sample, which showed +57 mV; all of the groundwater samples could therefore said to contain reduced ORP. The average pH values for the groundwater samples were between 7.0 and 7.3, while the pH of the river water was 8.1. The significant finding is that the concentrations of lead in the hair samples from Chota Kanjasa (822 ppm) were much higher than the highest levels of lead sampled in Japan (1.1-22.9 ppm), in 1976 to 19853. This must be due to a regional difference; the exposures can occur via the direct intake of water, air, and dust, or indirect intake from food such as vegetables, meat, and dairy products. A possible source of the lead pollution may be a nearby power plant. Although there were no air-quality measurements at the villages in the study site, coal can contain lead and without good after treatment of exhaust, the combustion process can release particles with high concentrations of lead into the atmosphere. The significantly lower value of lead at Bada Kanjasa, may be explained by wind patterns and the local topography. It is necessary to monitor the air quality of the three villages and to perform meteorological measurements at a local scale to understand the movement of the air pollution. In the case of Kanua village, the concentrations of lead varied to a greater extent. This can be explained by the differences in the exposure patterns of individuals. Since there were more male residents who participated in this survey, lifestyle factors such as working outside of the village might have been an important factor. Furthermore, the lead poisoning may affect the children to a greater extent than adults, it is necessary to further investigate lead exposure of children in the villages and to determine the source or sources of lead emission. Furthermore, the combined health effects of arsenic and lead may be a possible health risk among the local people; although a full health assessment was beyond the scope of this study. [Conclusion]
From these results clearly indicating that the higher arsenic concentration in groundwater reflected the accumulation of arsenic in human hair in the residents of Bada Kanjasa. PIXE measurement allowed us to reveal a possible lead poisoning problem in three rural villages. The possible existence of multiple exposure pathways should be carefully investigated to protect the villagers from arsenic and lead-related health problems. In this investigation, we did not survey individual water consumption practices in detail, thus the precise route of exposure is difficult to estimate. Further health risk assessment is needed to safeguard the local people in India.
[References]1. Mukherjee et al., Arsenic contamination in groundwater: a global perspective with emphasis on the Asian scenario, J Health Popul Nutr., 24(2), (2006) 142-63.
2. Sera, et al, PIXE Facility Combined with a Baby Cyclotron for Positron Nuclear Medicine, Int'l Journal of PIXE Vol. 2(1), (1992) 47-55.
3. Matsuda, K., Tamura, M., Trace elements found in human hair, Japan Environmental Science center annual report 12, 13, (1986) 101-110.
24th Symposium on Environmental Chemistry, Jun Noda, Oral presentation (Sapporo; 2015)

第 24 回環境化学討論会,得丸貴司,口頭発表(札幌;2015 年)
フィリピン中部台風被災地における底質の微量元素濃度と生物蓄積の可能性 ○得丸 貴司1, 尾崎 宏和 1, 渡邉 泉 1, 中田 晴彦 2, Socorro E. AGUJA3,Maricar S. PRUDENTE3
(東京農工大学院 1, 熊本大学院 2, デラサール大学 3) 【はじめに】
大規模な自然災害は, 周辺に有害な化学物質を流出させ, ヒトや生態系に二次被害をもたらす可能
性がある. 2013年 11月 8日, 大型台風”Yolanda”がフィリピンに上陸し, 同国中部レイテ島中心に深刻
な被害を引き起こした. 台風により発生した高潮は陸上を遡上し, 甚大な被害をもたらすだけではな
く, 海底の化学物質レベルを攪乱した可能性が懸念された. つまりレイテ島の北東部タクロバンでは, このときの高潮が 7m もの高さになり, 海岸線 150km において内陸部 400mにまで海水が達した. そのため内陸部の家屋を破壊し瓦礫や汚染物を海に流出させており, その影響が考えられた. 一方, 同国
パナイ島エスタンシアではパワーバージが座礁, およそ 800 万 L もの重油が流出, 沿岸環境を汚染し
た 1). 重油中には発がん性のある PAHs が含まれるだけではなく, 生物に有害な V, Ni, Fe および Cuなどの重金属類も含まれることが知られている 2). 重金属類は有機汚染物質とは異なり各種分解作用
を受けず環境中に蓄積するため, 長期にわたり生態系へ影響を及ぼす可能性がある. 本研究は台風被
災から半年後にレイテ島タクロバンおよび, パナイ島エスタンシア沿岸から底質を採取し, 微量元素
分析を行うことで, 海洋生物への蓄積状況の把握も検討した. 【方法】
2014年 6月に, フィリピン共和国のレイテ島タクロバンとパナイ島エスタンシア沿岸(Fig. 1)におい
て底質および表層土壌をそれぞれ 57, 15 地点, 海洋生物を 45 個体ずつ採取した. 試料は化学分析まで
-20℃で保存され, 室温で解凍後, 底質および土壌は 50℃で 24時間乾燥させた. 海洋生物は解剖後, 摘出した各部位を 90℃で 16 時間乾燥させた. 底質および土壌試料は約 0.5g を精秤し, EL 硝酸, 過塩素
酸およびフッ化水素酸を用いホットプレート分解を行った. その後, 超純水で約 1000 倍希釈し, 精秤
したものを試料溶液とした. 生物試料は粉砕後, 約 0.1g を精秤し, EL 硝酸約 2.0ml でマイクロウェー
ブ分解を行った. その後, 超純水で約 25ml に希釈・精秤したものを試料溶液とした. 重金属類および
微量元素分析は ICP-MSにより 7Li, 23Na, 24Mg, 27Al, 39K, 43Ca, 51V, 52Cr, 55Mn, 56Fe, 59Co, 60Ni, 63Cu, 66Zn, 71Ga, 75As, 82Se, 85Rb, 88Sr, 89 Y, 95Mo, 111 Cd, 115In, 118Sn, 121Sb, 133Cs, 137Ba, 139La, 140Ce, 205Tl, 208Pb および 209Bi の 32 元素濃度を測定した. 【結果と考察】
パナイ島エスタンシアではパワーバージが座礁した地点から重油が流出し, 南西に移流していった
ことが観察されている. 座礁地点付近では V, Fe および Cu の濃度が高く, また座礁地点から 4,000mまでは沿岸・沖合ともに距離減衰を示した(Fig. 2). 上記の元素間には正の相関が認められた(p<0.01, Spearman の順位相関). また 4,000m 以上離れた場所で再び高濃度を示すパターンが認められ, この
Trace element concentrations in marine sediments from coastal area of middle Philippines shattered by Typoon Yolanda and their possibilities of bioaccumulation. Takashi Tokumaru1*,Hirokazu Ozaki1, Izumi Watanabe1, Haruhiko Nakata2, Socorro E. AGUJA3,
Maricar S. PRUDENTE3 1Tokyo University of Agriculture and Technology, 2Kumamoto University, 3De la sale University, Philippines *E-mail;[email protected]
第24回環境化学討論会,得丸 貴司,口頭発表(札幌;2015年)
1C-20

第 24 回環境化学討論会,得丸貴司,口頭発表(札幌;2015 年)
高濃度を示した地点は重油が最終的に到達したとされ
る湾部であった. そのため重油は座礁地点から減少し
ながら南西に移流し, 湾に堆積した可能性が考えられ
た.しかし湾部の底質におけるPAHs濃度は比較的低値
であった 3). そのため各種分解作用を受けない重金属
類は残留することで重油汚染のトレーサーとして利用
出来る可能性が示唆された. またパワーバージ座礁地
点より北側の地域でも高濃度を示した微量元素が認め
られた. この地点では漁港や市街地に面しており人為
活動が盛んな場所である. そのため人為由来の微量元
素の流入も考えられた. 高潮で街が壊滅したレイテ島タクロバン沿岸の底質
における微量元素の濃度分布は, 湾奥部と人為活動
が盛んな漁港付近で高濃度の Zn, Mo, Cd, Sb および Pb が認められた. とくに湾部では Pb が 196µg/g d.w.と高値であった. これら元素は Enrichment Factor を
試算した結果, 人為由来であることが示唆された. 一方で元素間相関では地点グループごとに異なる傾きを
示したため, 発生源が異なる可能性も考えられた. 湾部で高濃度を示した重金属は, 高潮により壊滅した市
街地からの流入だと推察された. タクロバン湾奥部で採取された海洋無脊椎生物は
Co, Ni, Cu および Pb で比較的高濃度であった(Fig. 3). とくに Pb 濃度が高かったが, PTWI の試算から健康に
及ぼす影響は低いと結論された. 【結論】 重油流出が起きたパナイ島エスタンシアでは座礁地
点付近と南西に位置する湾部で高い重金属濃度を示し,重油による汚染影響が懸念された. 今後は重油による
汚染がどの程度寄与しているかを調べるために, 重油
の分析を行い, さらに湾部での詳細な汚染源の探索も
求められる. 高潮による被害が深刻であったレイテ島タクロバン
では湾部で高濃度の Pb が検出され, 海洋生物におい
ても高い生物蓄積を示した. そのため, 底質と野生生
物の長期にわたるモニタリングの必要性が示唆された. 【参考文献】 1 UNEP(http://www.who.int/hac/crises/phl/sitreps/philippines_oil_spill_joint_assessment_30november2013.pdf)
2 Wang et al.(2003) Atoms. Environ. 37:4637-4643.
3 中村, 中田, 渡邉, AGUJA, PRUDENTE(2015), 第 24 回環境化学討論会講演要旨集.
4 FAO and WHO (2011). JPOMT FAO/WHO FOOD STAND ARDS PROGRAMME CODEX COMMITTEE ON CONTAMINANTS IN FOODS.
Fig.3 Biological concentrations for living things at Tacloban, Philippines
Fig.2 Distribution of V concentration in the sediments from Estancia, Philippines
Fig.1 Location of the study sites from Estancia, Philippines
1km
第24回環境化学討論会,得丸 貴司,口頭発表(札幌;2015年)

24th Symposium on Environmental Chemistry, Alffrida Esther Suoth, Oral presentation (Sapporo; 2015)
Environmental Monitoring of Mercury Concentration in Lake and Sea Water in Indonesia ○Alffrida Esther Suoth ,Ernawita Nazir , Dyah Apriyanti (Researcher Environmental Management Center-Ministry of Environment and Forestry)
[Introduction]As the biggest archipelagic country in the world, Indonesia has 17. 408 island which divided into 34 provinces. Indonesia has six percent of world water suply or approximately 21% of water suply in Asia-Pacific. However, in fact, the supply of clean water tends to decrease as the result of damage and pollution of environment. In many developing Asian countries in which population increase caused economic growth , environmental pollution from anthropogenic (human activities) sources become a serious problem. In Indonesia, although many the environmental laws have been produced to protect the environmental quality, they implementation is not so effective. Environmental contamination by toxic chemicals is a matter of concern in Indonesia, especially Mercury (Hg). Environmental pollution by mercury (Hg) has a great concern due to it is one of the most toxic elements and its potential as a neurotoxin. Mercury has been listed as one of the priority pollutants by many international agencies, such as United Nations Environment Program, World Health Organization and Food and Agriculture Organization of the United Nations, due to its possible toxicity to living organisms . Although mercury is naturally occurring, its parent material levels generally not exceed 0.1 mg/ kg. Many human activities may contribute to enrichment of Hg concentrations such as municipal solid waste incineration, coal burning, electronics, paper, and pharmaceutical industries.Minamata disease is the most serious Hg poisoning occurred after consumption of Hg-contaminated fish and other seafood from Hg-contaminated wastewater, which was discharged from an industrial plant into the coastal area in Minamata, Japan. Inorganic Hg released into the environment and transformed to organic Hg (mostly methylated form), which is then accumulated in higher trophic animals through food chain. Environmental Management Center also known as Pusarpedal as a technical unit of Ministry of Environmet and Forestry, was established in August 1993 granted by JICA with the main function as a national reference laboratory and also as center for environmental quality monitoring. Since 1995, Pusarpedal has been monitored Hg concentration in water, sediment and biota. The latest data of Hg monitoring was produced in 2014 from lake water and seawater in several provinces in Indonesia. The locations of lake water quality monitoring from 2006 until 2014 were Sumatra province: Maninjau Lake and Singkarak Lake; Bali Province: Batur Lake; Sulawesi Province: Tondano Lake; Java Province: Rawa Pening Lake; Papua Province: Sentani Lake; Kalimantan Province: Semayang Lake and Melintang Lake. For seawater monitoring located in bigest harbour were Tanjung Priuk (Jakarta), Ciwandan (Banten), Tanjung Perak (Surabaya), Tanjung Emas (semarang), dan teluk Tomini (Palu), Batam (Batam). This study is aimed to determine the concentration of mercury level in water as one of parameter mentioned in PP No. 82 year 2001 about Water Quality Management and Water Pollution Control. The possible sources of water contamination will also be investigated along as location such as Artisanal and Small-Scale Gold Mining (ASGM) and industrial activities.
[Methods]Water samples were collected from different distances and depth of water using grab sampling method. The sampling locations, in general were selected to represent representative sites each area. The samples of water then preserved using H2SO4 until the pH below 2 then analyzed in Pusarpedal laboratory to determine total Hg concentration by using JIS method modified with Akagi method (In house methode) . Total Hg was measured by using the Mercury Analyzer.
24th Symposium on Environmental Chemistry, Alffrida Esther Suoth, Oral presentation (Sapporo; 2015)
2A-06

24th Symposium on Environmental Chemistry, Alffrida Esther Suoth, Oral presentation (Sapporo; 2015)
[Results and discussion]Lake waterThis study was conducted in order to determine the concentration of mercury (Hg) in water from some priority lakes and some harbours in Indonesia. The output results indicated that the concentrations of Hg in lake water were below of the methode detection limit of instrumen (MDL < 0,0004 ug/L) and also means below of permissible environmental standard quality PP No. 82 year 2001 about Water Quality and Water Pollution Control (0,002 mg/L).Sea waterThe levels of total Hg in seawater samples during year 2006 - 2014 were relatively same as levels in waterlake which no presence of total Hg among different sites of sampling location. The result showed in most sampling location, the concentration of Total Hg were below the methode detection limit of instrumen (MDL < 0,0004 ug/L), except in year 2012 for Ciwandan Harbour was detected 1,4 ug/L, Gorontalo harbour (0,5 – 0,7 ug/L), Parigi (0,5 ug/L), and Makassar(0,5-0,7 ug/L); for year 2013 in Parigi harbour was 0,6 ug/L. When compared to government regulation, allconcentraion of total Hg was below of environmental standard quality 3 ug/L according to KepMen LH No. 51 year 2004 about Marine Quality Standard .
[Conclusion]From the results obtained the following points can be concluded:1. All samples from lake and horbour were below of the MDL.2. The activities along of the location were less contributes for Hg pollution.3. Both lake water and seawater in all location in safe level from Hg pollution based on government water
standard quality in Indonesia.
[Recommendations]There are some recommendations to drawing deeper of status of Hg pollution in our study:1. The conclusion initiates an idea for new study about the measuring organic Hg in the water samples and/or
other matrix (sediment, soil etc)2. Continuous monitoring of Hg should be carried out intergrate with biota that mostly consume by people
around the sampling location to know the health effect.3. Continuous health monitoring for residents should be carried out especially for children and pregnant women
by taken human sample such as hair .4. Enhancing the environmental awareness for both residents and workers who using mercury (ASGM) through
the government and non-governmental organizations.
[References]1. State of Environement Report in Indonesia 2012, Ministry of Environment Republic of Indonesia.2. Tetsuro Agusaa, Takashi Kunitob, Hisato Iwataa, In Moniritha, Touch Seang Tanac, Annamalai
Subramaniana, Shinsuke Tanabea, Mercury contamination in human hair and fish from Cambodia: levels, specific accumulation and risk assessment. Environmental Pollution 134 (2005) 79–86.
3. Mohamed Rashad. Environmental monitoring of mercury in urban soils, air and plants of a Mediterranean area, Alexandria, Egypt. International Journal of Energy and Environment (IJEE), Volume 4, Issue 2, 2013, pp.311-320.
4. Chen, C.Y., C.T. Driscoll, K.F. Lambert, R.P. Mason, L. R. Rardin, C.V. Schmitt, N.S. Serrell, and E.M. Sunderland. 2012. Sources to Seafood: Mercury Pollution in the Marine Environment. Hanover, NH: Toxic Metals Superfund Research Program, Dartmouth College.
5. Yayu Indriati Arifin , Masayuki Sakakibara and Koichiro Sera. Impacts of Artisanal and Small-Scale Gold Mining (ASGM) on Environment and Human Health of Gorontalo Utara Regency, GorontaloProvince, Indonesia. Geosciences 2015, 5, 160-176; doi:10.3390/geosciences5020160. ISSN 2076-3263 www.mdpi.com/journal/geosciences.
24th Symposium on Environmental Chemistry, Alffrida Esther Suoth, Oral presentation (Sapporo; 2015)
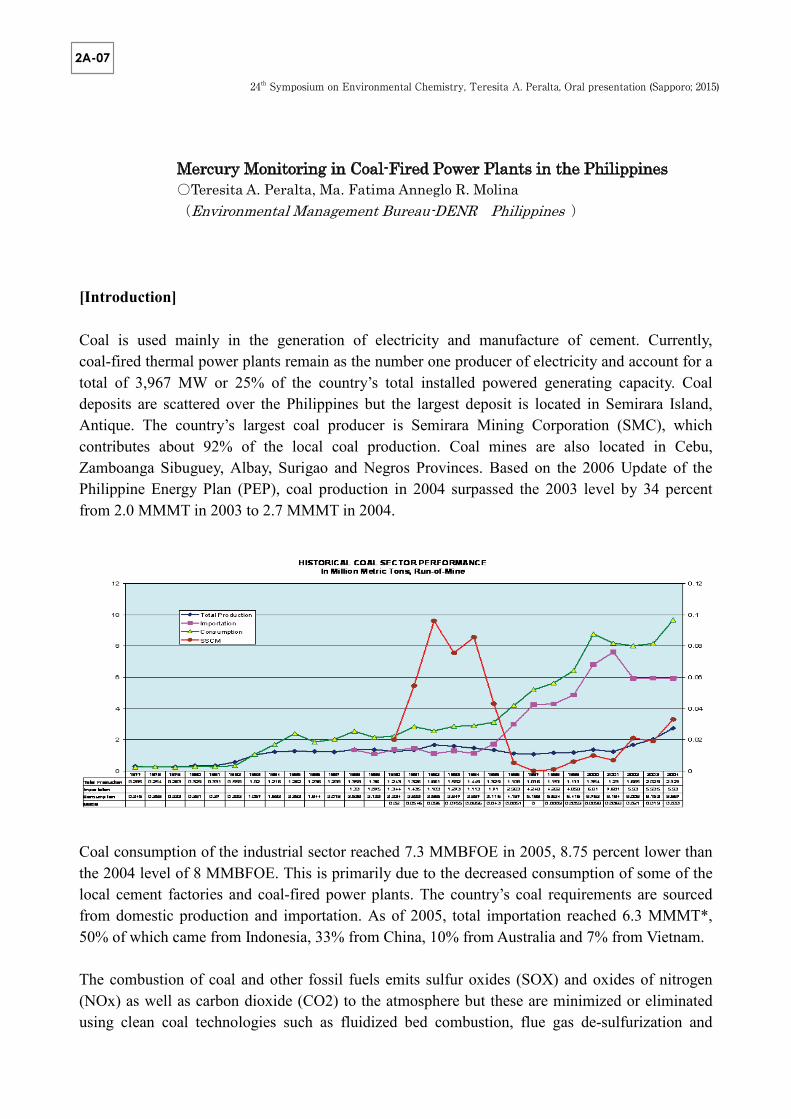
24th Symposium on Environmental Chemistry, Teresita A. Peralta, Oral presentation (Sapporo; 2015)
Mercury Monitoring in Coal-Fired Power Plants in the Philippines ○Teresita A. Peralta, Ma. Fatima Anneglo R. Molina (Environmental Management Bureau-DENR Philippines )
[Introduction]
Coal is used mainly in the generation of electricity and manufacture of cement. Currently, coal-fired thermal power plants remain as the number one producer of electricity and account for a total of 3,967 MW or 25% of the country’s total installed powered generating capacity. Coal deposits are scattered over the Philippines but the largest deposit is located in Semirara Island, Antique. The country’s largest coal producer is Semirara Mining Corporation (SMC), which contributes about 92% of the local coal production. Coal mines are also located in Cebu, Zamboanga Sibuguey, Albay, Surigao and Negros Provinces. Based on the 2006 Update of the Philippine Energy Plan (PEP), coal production in 2004 surpassed the 2003 level by 34 percent from 2.0 MMMT in 2003 to 2.7 MMMT in 2004.
Coal consumption of the industrial sector reached 7.3 MMBFOE in 2005, 8.75 percent lower than the 2004 level of 8 MMBFOE. This is primarily due to the decreased consumption of some of the local cement factories and coal-fired power plants. The country’s coal requirements are sourced from domestic production and importation. As of 2005, total importation reached 6.3 MMMT*, 50% of which came from Indonesia, 33% from China, 10% from Australia and 7% from Vietnam.
The combustion of coal and other fossil fuels emits sulfur oxides (SOX) and oxides of nitrogen (NOx) as well as carbon dioxide (CO2) to the atmosphere but these are minimized or eliminated using clean coal technologies such as fluidized bed combustion, flue gas de-sulfurization and
24th Symposium on Environmental Chemistry, Teresita A. Peralta, Oral presentation (Sapporo; 2015)
2A-07

24th Symposium on Environmental Chemistry, Teresita A. Peralta, Oral presentation (Sapporo; 2015)
electrostatic precipitation. On the issue of mercury emissions, selected coal-fired power plants from Table 1 were investigated.
Table 1. Coal Power Plants Generation and Location
Power Plant Generation, MW LocationPagbilao 1 382 QuezonPagbilao 2 382 QuezonCalaca 1 300 BatangasCalaca 2 300 BatangasMasinloc 1 300 ZambalesMasinloc 2 300 ZambalesSual 1 300 PangasinanSual 2 300 PangasinanQuezon Power 511 QuezonToledo Power Corp. 88 CebuCebu TPP1 100 Cebu
[Methods]
The USEPA Methods 1 through 5 and 29 were used to collect mercury samples and analyzed using the dichromate method, cold vapor technique. Results and DiscussionsThe results showed low levels of mercury emissions compared to the National Emission Source Specific Air Standards for stationary sources of 5 mg/Ncm as elemental mercury.ConclusionThere are mounting opposition of coal-fired power plants. In order to address environmental concerns, there is a need to mandate the operation of coal power plants to utilize clean coal technologies. There will be efforts to educate the public on the real impact of and the available mitigating measures for coal. Regular monitoring of mercury emissions shall be mandated.
[References]
USEPA 40 Code of Federal Regulations Part 60 Method 29,National Air Quality Status Report EMB-DENR, 2008
24th Symposium on Environmental Chemistry, Teresita A. Peralta, Oral presentation (Sapporo; 2015)

24th Symposium of Environmental Chemistry, Hathairatana Garivait, Oral presentation (Sapporo; 2015)
Introduction
Mercury (Hg) is considered as a global pollutant, because Hg0, the predominant form of atmospheric Hg, is capable of being transported aerially for very long distances (tens of thousands of kilometers) which can be deposited to remote places even 1000 km away from the sources [1]. Furthermore, Hg can be converted to methylmercury (Me-Hg) and accumulated in the food chain, posing a potential threat to humans’ health. The concern of Hg pollution arises from the health effects caused by Me-Hg through the consumption of fish and marine products [2,3]. Asia is considered the largest contributor of anthropogenic atmospheric mercury, responsible for over half of the global emission. The mercury contaminated sites in Asia were derived from gold mining, chemical industry, metal smelting, coal combustion, and agricultural sources [4]. Thailand is not free from mercury pollution. Trace amount of mercury in the Gulf of Thailand commonly is ascribed to subsurface natural gas deposits. Nowadays there is an increment of the number of platforms for oil and gas exploration and production in the Gulf, which is immensely tied to the exploration, development, and production. Waste discharges containing trace amount of mercury related to such activity are deemed as a primary source of mercury in the Gulf of Thailand. The other sources of mercury are from mining activities, hospitals, chemical and paint industries, fluorescence production and power plants [5], thereby, leading to a number of serious incidences of Hg pollution to the local environment in Thailand which were reported [6,7,8]. From the past, the measurement of environmental mercury level in Thailand was limited to water, sediment and aquatic tissue in order to protect human health. However, more effort is still needed to develop high quality measurements of atmospheric pollution and deposition of mercury to understand the characteristic of mercury transport and deposition as well as determining source-oriented mercury changes as well as the biogeochemistry cycle of Hg that associated with health effects in Thailand. Methods
Total Hg concentration is one of chemical water quality parameters in Thailand since 1994. Monitoring of Hg level in surface water, coastal water, and sediment has been done by Pollution Control Department (PCD) to recognize the status of environmental quality with respect to National Water Quality Standard. Besides, with the raised awareness of human health risks ascribed to the consumption of Hg-polluted fish, shrimp, mollusk and so forth, these marine organisms have been sampled and examined time to time for Hg to assess the extent of such risk. For surface water monitoring, sixteen main rivers, which are the Bang Pa Kong, Chao Phra Ya, Tha Chin, Mae Klong, Rayong, Phang Rat, Trad, Phetchaburi, Pran Buri, Lang Suan, Tapee, Pak Phanang, Tepa, Trang, Pattani, Sai Buri have been monitored between two to four times annually depending upon annual budgetary supports from the Thai Government. In addition, the potential effects of Hg on the marine environment of the inner Gulf of Thailand, during the 2011 Thailand floods, has been investigated. The preliminary measurement of total gaseous mercury (TGM) has just started by PCD since November 2014 using automatic analyzer Tekran 2537 (Cold Vapor Atomic Fluorescence). The analyzer was installed in a mobile air quality monitoring unit in order to survey the level of TGM in various locations.
ENVIRONMENTAL MERCURY LEVEL IN THAILAND
Hathairatana Garivait1, Nittaya Chaisa-ard2, Daisy Morknoy1, Chanthiraporn Tangsuwan1, Duangdeun Chanatorn1. (1 Environmental Research and Training Center, Department of Environmental Quality Promotion, Technopolis, Klong Luang, Pathumthani 12120, Thailand. 2 Air Quality and Noise Management Bureau, Pollution Control Department, 92 Phahonyothin Road, Samsennai, Phayathai, Bangkok 10400, Thailand. )
24th Symposium of Environmental Chemistry, Hathairatana Garivait, Oral presentation (Sapporo; 2015)
2A-08

24th Symposium of Environmental Chemistry, Hathairatana Garivait, Oral presentation (Sapporo; 2015)
Results and discussion The results of coastal water quality monitoring during 2001-2003 showed Hg concentrations ranged
between 0.02-0.09 g/l which were all in compliance with the National Coastal Water Quality Standard of 0.1µg/l. In 2003 with the slightly less number of monitoring stations, it was found that the range of Hg concentration for the entire Thai coastline was from 1.1 to 87.6 ng/l with an average value of 9.22 ng/l [9]. Total Hg concentration measured during 1996 to 2000 in 16 major rivers in Thailand varied from < 0.05 to 1.5 µg/l, which are smaller than the National Surface Water Quality Standard of 2 µg/l. Higher results have been found in those rivers during 2011-2013 in which mercury concentrations were varied between 0.5 to 6.4 µg/l [10-12]. Hg levels in sediments in Chao Praya river have also been quantified. The study was done on the particles whose sizes are smaller than 63 micron by comparing the results between dry and wet season. The results showed that total Hg concentration varied from 0.05 to 0.397 µg/g dry wt. and from 0.304 to 0.448 µg/g dry wt. during the dry and wet period respectively. Furthermore, the marine sediment in the Gulf of Thailand after the Thailand floods period has been investigated. The results demonstrated that Hg concentrations in sediments were relatively low compared to the proposed marine and coastal sediment quality guidelines for Thailand 2006. As for the preliminary survey of TGM in ambient air in four provinces over Thailand showed Hg level of one hour average ranged between 1.55-3.05 ng/m3. These levels are consistent with the study in Chiangmai, in biomass burning region of Thailand, where Hg concentrations ranged between 1.66 and 2.95 ng/m3 with an overall mean value of 2.18 ng/m3 [14]. Conclusion
It is pronounced that the existing data indicate that slight elevations in Hg concentrations were occasionally observed in coastal water and sediments in some areas, especially in the Gulf of Thailand and near the industrial estates of the east coast. However, the overall situation of Hg contamination in all compartments (seawater, sediments and marine organisms) is still within a safe level. As for atmospheric mercury, it is important for Thailand to develop high quality measurements of atmospheric pollution and deposition of Hg to understand the characteristic of Hg transport and deposition as well as the biogeochemistry cycle of Hg that associated with health effects in the country. References 1. Schroeder H.W. and Munthe J. (1998); Atmospheric Environment, vol. 32 (5), 809-822. 2. Agusa T., Kunito T., Sudaryanto A., In Monirith, Kan-Atireklap S., Iwata H., Ismail A., Sanguansin J.,
Muchtar M., Seang Tana T. and Tanabe S. (2007); Environmental Pollution, 145, 766-777. 3. Zarcinas B. A., Pongsakul P., Mike J. McLaughlin M. J. and Cozens G. (2004); Environmental Geochemistry
and Health (26), 359–371. 4. Li P., Feng X.B., Qiu G.L., Shang L.H. and Li Z.G. (2009); Journal of Hazardous Materials, 168, 591–601. 5. Pollution Control Department (2009); The study of mercury and heavy metals emission from industrial
combustion process, Final report, PCD 03-104 vol. 2/2. 6. Pataranawat P., Parkpian P., Polprasert C., Delaune R. D. and Jugsujinda A. (2007); Journal of Environmental
Science and Health Part A 42, 1081–1093. 7. http://www.prachatai.com/english/node/3477 8. Pollution Control Department (2002); Thailand State of Environment Report: The Decade of 1990s. 9. Thongra-ar W. and Parkpian P. (2002); ScienceAsia, 301-312 10. Pollution Control Department (2011), Annual Report on Water Quality Management. 11. Pollution Control Department (2012), Annual Report on Water Quality Management. 12. Pollution Control Department (2013), Annual Report on Water Quality Management. 13. Pollution Control Department (2012), Assessment of sediment quality of the inner Gulf of Thailand after the
2011 Thailand floods. 14. Guey-Rong S., Neng-Huei L., Chung-Te L., Jia-Lin W., Ming-Tung C., Sheng-Hsiang W., Kai Hsine C. and
Chang-Feng O-Y. (2013), Atmospheric Environment 78, 174-183.
24th Symposium of Environmental Chemistry, Hathairatana Garivait, Oral presentation (Sapporo; 2015)
24th Symposium of Environmental Chemistry, David A. Gay, Oral presentation (Sapporo; 2015)
[Introduction]Since 1978, the National Atmospheric Deposition Program (NADP) has tracked the status and changes in the many different chemical compounds within precipitation across North America. The NADP monitors the removal of pollutants from the atmosphere; but more importantly, it monitors the addition of chemical compounds into the Biosphere. NADP developed and operates two collaborative networks for mercury: the Mercury Deposition Network (MDN) for wet deposition measurements, and the Atmospheric Mercury Network (AMNet) for atmospheric mercury concentrations and dry deposition calculations.
[Methods]The AMNet measures concentrations of atmospheric mercury fractions using automated, continuous mercury speciation systems, and includes concentrations of hourly gaseous elemental mercury (GEM), and two-hour gaseous oxidized mercury (GOM) and particulate-bound mercury less than 2.5 microns in size (PBM2.5). This includes one site in Taiwan, and a second in Hawaii. As of March 2015, over 900,000 valid observations were available from 30 different locations. The MDN operates wet-only samplers, and makes weekly integrated wet deposition of mercury measurements at over 118 currently operating sites. As of March 2015, over 80,000 observations were available. The NADP operating and quality assurance procedures are fixed to ensure that the network makes scientifically valid and consistent measurements. All data and methods are publically available through an online database on the NADP website (http://nadp.isws.illinois.edu).
[Results and discussion]Wet deposition of mercury ranges from more than 25 ug m-2 yr-1 in south Florida to less than3 ug m-2 yr-1 in northern California. Volume-weighted total mercury concentrations are statistically different between defined regions overall (Southeast > Midwest > Ohio River > Northeast), with the highest in Florida, Minnesota, and several Southwest locations (10–16 ng L-1). Total mercury wet-deposition is significantly different between defined regions (Southeast > Ohio River > Midwest > Northeast). Mercury deposition is strongly seasonal in eastern North America. The average mercury concentration is about two times higher in summer than in winter, and the average deposition is approximately more than three times greater in summer than in winter. Forty-eight sites with validated datasets of five years or more were tested for trends using the non-parametric seasonal Kendall trend test. Significant decreasing mercury wet deposition concentration trends were found at about half of the sites, particularly across Pennsylvania and extending up through the Northeast over the ten year period ending in 2006. However, there is significant increases in certain concentrations and depositions in the years after 2008 to 2013.
For 15 of the 21 AMNet sites (excluding Hawaii), the median and mean GEM values were between 1.3 and
Continuous Monitoring of Mercury Deposition in North America: the National Atmospheric Deposition Program○David A. Gay1,David A. Gay1,David Schmeltz2,Mark Olson1
(1 National Atmospheric Deposition Program, University of Illinois (USA), United States,2 United States Environmental Protection Agency)
24th Symposium of Environmental Chemistry, David A. Gay, Oral presentation (Sapporo; 2015)
2A-09

24th Symposium of Environmental Chemistry, David A. Gay, Oral presentation (Sapporo; 2015)
1.5 ng m-3, with a typical interquartile range of about 0.25 ng m-3. These values are similar to the range observed in total gaseous Hg and GEM measurements at long-term sites in Ireland (Ebinghaus et al., 2011; Slemr et al., 2011), multiple sites in the Canada (Temme et al., 2007), and a relatively new rural Germany site (Weigelt et al., 2013). Three of 21 sites with means and medians well above this GEM range are urban or urban-influenced sites. Most sites observed GEM below 2.0 ng m-3 for the overwhelming number of hours during all years and rarely below 0.5 ng m-3. The 95th percentile GEM concentrations for the sites were highly variable, and ranged from 1.6 to 2.85 ng m-3. Year to year, the median change at these AMNet sites was small and limited to 0.1 or 0.2 ng m-3. Nearly all sites had multiple events above 3 ng m-3, with some sites with a great frequency of extreme values.
The median GOM concentrations were typically between 1.2 and 2.5 pg m-3. The more remote sites were clearly the lowest. Here, the GOM concentrations rarely exceeded 10 pg m-3. The highest medians were at two of the urban sites (Salt Lake City and Rochester, 5 - 12 pg m-3) which also had the largest interquartile range and 95th percentiles. However, a similar median and range was also measured in western Maryland.Conversely, New York City and Washington, D.C. were somewhat suppressed. PBM2.5 medians were typically between 2.5 and 5.0 pg m-3. The highest two medians were measured at NY95 and UT96 (10 pg m-3, north of Salt Lake UT97), and the lowest at the coastal and continental remote sites (~ 2.5 pg m-3). PBM2.5 was less than 15 pg m-3 for the majority of sites and observations. The interquartile ranges were usually between 2.0 and 7.5 pg m-3. The largest ranges were measured at NY95 and UT96, following with the highest medians. Both NY95 (Rochester, NY) and UT96 are within urban influenced air sheds with active and historical industrial sources. Comparing the GOM values to PBM2.5 values, we observed that all of the sites, save three, had median PBM2.5 levels greater than GOM, and more variable PBM2.5 values.
The site group with the highest GEM median, variability and maximum concentrations was the urban group.Interestingly, sites that are continental and remote had the lowest median. For GOM, the median GOM for the continental near-sources group is high, and very similar to the urban group. A coastal depletion in GOM relative to other groups is evident, and distinct from GEM observations. Similar to GOM, the highest PBM2.5 medians and interquartile ranges were observed for the continental near sources and urban site groups. The lowest median values and ranges were observed for the Pacific and coastal remote groups. The overall higher PBM2.5 to lower GOM relationship is clearly shown in all site groupings.
[References]Ebinghaus, R., et al.: Atmos. Environ., 45, 3475–3480, 2011.Slemr, F., et al.: Atmos. Chem. Phys., 11, 4779–4787, 2011.Weigelt, A., et al.: Env. Chem., 10, 102–110, 2013.Temme, C., et al.: Atmos. Environ., 41, 5423–5441, 2007.
24th Symposium of Environmental Chemistry, David A. Gay, Oral presentation (Sapporo; 2015)

24th Symposium on Environmental Chemistry, Nguyen Van Thuy, Oral presentation (Sapporo; 2015)
MERCURY POLLUTION AND CURRENT STATE OF MERCURY MONITORING IN VIETNAM ○Nguyen Van Thuy ,Bui Hong Nhat (Centre for Environmental Monitoring, Vietnam Environmental Administration, Ministry of Natural Resources and Environment )
Viet Nam has experienced rapid economic growth over the past two decades. Political and economic reforms (DoiMoi) launched in 1986 have transformed Viet Nam from one of the poorest countries in the world, with per capita income below $100, to a lower middle income country within a quarter of a century with per capita income of $1,960 by the end of 2013. Viet Nam has already attained four of its ten original Millennium Development Goal targets and is likely toattain three more by 2015.
Following relatively rapid pace of growth thanks to DoiMoi, Viet Nam also had to struggle with a period of slowed development due to global recession since 2008. The Socio-Economic Development Strategy (SEDS) 2011-2020 gives attention to structural reforms, environmental sustainability, social equity, and emerging issues of macroeconomic stability.
Viet Nam’s economic growth has generated environmental risks. Population growth, industrialisation, urbanisation, and major changes in patterns of rural development have been causing adverse impacts on the country’s socio-economic sustainability.
Considering that urgency, the Government has approved “the National Environmental Protection Strategies by 2020”. Accordingly, one of those strategies to promote the emission control and to lessen the extent of environmental pollution, which are based on the consolidation and completion of the master-plan for national environmental monitoring network.
However, Vietnam is incapable in solving all the emerging environmental issues including the “headache issues” namely mercury pollution.
During the recent 3 decades of promoting industrial development and exploitation of natural resources, the mercury discharge to environment is increasing. The effect of mercury pollution from outside countries is also a problem. Meanwhile, the mercury pollution was not considerably taken into concern. There were only a few investigations on mercury inventory in Vietnam, the assessment on the effect of mercury pollution sources from outside countries is also incomplete.
In the recent years, Vietnam has been taken the mercury pollution into concern by implementing the assessment of mercury emission from different sources to environment as well as the state of environmental pollution caused by mercury.
24th Symposium on Environmental Chemistry, Nguyen Van Thuy, Oral presentation (Sapporo; 2015)
2A-10

24th Symposium on Environmental Chemistry, Nguyen Van Thuy, Oral presentation (Sapporo; 2015)
This presentation will focus on some main issues on mercury emission in Vietnam and the initial activities for conducting mercury monitoring in Vietnam.
Overview of the National monitoring network, focus on some hazardous chemical substances.
24th Symposium on Environmental Chemistry, Nguyen Van Thuy, Oral presentation (Sapporo; 2015)

第 24 回環境化学討論会,西村智椰,口頭発表(札幌;2015 年)
ベトナム、フィリピン、ガーナでの E-waste 野焼き土壌における塩素化および臭素化多環芳香族炭化水素の発生状況 ○西村智椰 1, 堀井勇一 2, 川西理史 1, 田中周平 1, 阿草哲郎 3, 板井啓明 3, 鈴木剛 4, Nguyen M. Tue3, Kwadwo A. Asante5, Florencio C. Ballesteros Jr.6, Pham H. Viet7, 高岡昌輝1, 高橋真 3, 田辺信介 3, 滝上英孝 4, 藤森崇 1 (1京都大,2埼玉環科国セ,3愛媛大, 4国環研, 5CSIR Water Research Institute, 6フィリピン大ディリマン校, 7ハノイ理科大)
【はじめに】 多環芳香族炭化水素(PAHs)は燃焼に伴い非意図的に生成し、一部が発がん性や変異原性を示し大気
汚染防止法の優先取組物質に指定されている。水素がハロゲンに置換された塩素化および臭素化
PAHs(Cl/BrPAHs)は、PAHs以上に生体内蓄積性・環境残留性および発がん性・変異原性を有し 1),2)、新
規残留性汚染物質候補とされている。廃電気・電子製品(E-waste)野焼き土壌中ダイオキシン類以外の有機塩素化合物の存在示唆 3)や、ダイオキシン類以上の高濃度が報告されている PAHs4)等の先行研究
から、E-waste野焼き土壌における Cl/BrPAHsの生成・汚染が懸念される。大気中や、廃棄物処理施設の排ガス・焼却灰中 Cl/BrPAHs濃度の報告はあるが 5)、E-waste野焼き土壌における報告例はない。本研究では、ベトナム、フィリピン、ガーナの E-waste野焼き土壌に着目し、土壌中の Cl/BrPAHsによる汚染実態を明らかにすることを目的とした。 【方法】 試料:E-waste 野焼き跡地の表層土壌を以下「野焼き土壌」とする。2011
年に対照土壌としてベトナム北部 Hung Yung省 Duong Quangで 1地点(VN-1)を採取し、野焼き土壌を同年にベトナム同省のBui Dauで 2地点(VN-2, VN-3)、2010年にフィリピン北部 Caloocanの Marilao川土手で 2地点(PHI-1, PHI-2)、2013年にガーナ南部 Accraの Agbogbloshieで 2地点(GH-1, GH-2)採取した。これら土壌試料は分析まで冷暗所に保存した。 前処理および分析方法:本研究では 26 種の ClPAHs、14 種の BrPAHs、15
種の PAHsを分析した。対象とした PAHs、Cl/BrPAHsの親 PAHsの略称をTable 1に示した。Cl/BrPAHsは先行研究 5)に基づき前処理を行い GC/MSで、PAHsは先行研究 6)に基づき前処理後 HPLC/FLで分析した。 【結果と考察】 総濃度:各土壌における 26種の ClPAHs総濃度(ΣClPAHs)、14種の BrPAHs総濃度(ΣBrPAHs)、15種
の PAHsの総濃度(ΣPAHs)を Fig.1aに示す。E-waste野焼き土壌は総じて ΣPAHs > ΣClPAHs > ΣBrPAHs
Concentrations and distribution patterns of chlorinated and brominated polycyclic aromatic hydrocarbons in e-waste open burning soils in Vietnam, the Philippines, and Ghana Chiya Nishimura1, Yuichi Horii2, Satoshi Kawanishi 1, Shuhei Tanaka1, Tetsuro Agusa3, Takaaki Itai3, Go Suzuki4, Nguyen M. Tue3, Kwadwo A. Asante5, Florencio C. Ballesteros Jr.6, Pham H. Viet7, Masaki Takaoka1, Shin Takahashi3, Shinsuke Tanabe3, Hidetaka Takigami4, Takashi Fujimori1,* (1Kyoto Univ., 2Center for Environ. Sci. in Saitama, 3Ehime Univ., 4NIES, 5CSIR Water Research Institute, 6Univ. of the Philippines, Diliman, 7Hanoi Univ. of Sci.) *Kyoto University, Katsura, Nishikyo-ku, 615-8540, Kyoto, Japan. E-mail: [email protected]
Nap Naphthalene Ace Acenaphthene Fle Fluorene Phe Phenanthrene Ant Anthracene Flu Fluoranthene Pyr Pyrene Chr Chrysene BaA Benzo[a ]anthracene
Benzo[b ]fluorantheneBenzo[k ]flooranthene
BaP Benzo[a ]pyreneDA Dibenz[a,h ]anthraceneIP Indeno[1,2,3-cd ]pyreneBP Benzo[g,h,i ]perylene
BbkF
Abbreviation of PAHs
Table 1. Target PAHs.
第24回環境化学討論会,西村 智椰,口頭発表(札幌;2015年)
2C-01

第 24 回環境化学討論会,西村智椰,口頭発表(札幌;2015 年)
の傾向にあり、対照土壌と桁違いの高値、かつ、
各国固有の濃度範囲を示した。野焼き土壌中
ΣClPAHs は、ガーナで 21~29 ng/g(VN-1 の 200倍以上)、フィリピンで 110~250 ng/g(1千倍以上)、ベトナムで最も高く1200~2800 ng/g(1万倍以上)であった。E-waste関連試料 7)および廃棄物焼却
灰 5)と比較すると同等もしくは上回る濃度であ
った。ΣBrPAHs は VN-1 では検出されず、3 カ国の野焼き土壌では 5.8~530 ng/gであり、廃棄物焼却灰 5)と同等以上の値であった。ΣPAHsはVN-1 で 30 ng/g、3 カ国の野焼き土壌では480~7100 ng/g であり、GH-1 を除き中国のE-waste野焼き土壌 4)と同等の値であった。 毒性等量:17種の ClPAHs、9種の BrPAHs異
性体 iに関してBaPに対する毒性係数REP BaP, i1)
と濃度値 Ciを用い、毒性等量(TEQ)値を求めた。PAHsの内 7種の TEQ値を REPPAHs5)を用い計算した。結果を Fig.1aの第 2軸に示す。ClPAHsは VN-1で 0.14 pg-TEQ/g、野焼き土壌ではガーナで 78~110 pg-TEQ/g、フィリピンで 360~1000 pg-TEQ/g、ベトナムで最も高く 7600~12000 pg-TEQ/gであった。野焼き土壌における BrPAHsは 0.90~160 pg-TEQ/g、PAHsは 0.048~12 pg-TEQ/gであり、TEQ値は総じて ΣClPAHs > ΣBrPAHs > ΣPAHsの序列を示した。ΣClPAHsおよび ΣBrPAHsは ΣPAHsの数%から数十%程の低濃度にも関わらず、TEQ値は PAHs由来の数百倍以上であった。同地点において先行研究で測定したダイオキシン類由来の TEQ値 3)と比べると
ClPAHs由来の毒性等量は 3.9~54 %に相当した。VN-2, VN-3, PHI-2では ClPAHs由来の毒性等量のみで日本の土壌中のダイオキシン類の環境基準 1,000 pg-TEQ/gを上回った。以上より、E-waste野焼き土壌中 Cl/BrPAHsはダイオキシン類様の高い毒性を有していることが明らかとなった。 分布パターン: 各地点での各化合物総濃度に対する異性体分布パターンを Fig.1bに示す。フィリピ
ンを除く野焼き土壌で各国固有の分布パターンをとった。PHI-1, 2では小規模で突発的な野焼きが行われており、GH-1, 2では大規模な広場一帯で雑多な E-wasteの野焼き、VN-2, 3では畦道で定期的に廃ケーブルを主とする野焼きが確認されており、分布パターンの差は、野焼きの対象物や焼却方法等によ
るものと考えられる。特にベトナム野焼き土壌中 ClPAHsは、廃ケーブルの塩ビ(PVC)被膜と銅線との同時燃焼による固有の分布パターンと推測され、今後模擬野焼き実験により検証予定である。廃棄物
焼却灰 5)と比べると分布パターンは大きく異なり、野焼き土壌では Phe、Antを親とする Cl/BrPAHsが占める割合が高かったがこれは燃焼温度の違いによるものと推測される。野焼き土壌において ClBaA、BrBaAは、総濃度への寄与は 0.23 ~15 %と小さかったが、TEQ値への寄与は 16~61 %と多くを占めた。 【結論】 本研究は、E-waste野焼き土壌中 Cl/BrPAHs汚染の初めての報告であり、途上国 3カ国での汚染レベ
ルや特長を明らかにした。TEQ 値の結果から、特に ClPAHs は野焼き土壌においてダイオキシン類に匹敵する毒性寄与因子であると考えられる。今回測定した 40種の Cl/BrPAHsの他、同族体とみられるピークも多数検出され、更なる Cl/BrPAHsの探索・同定が必要と考えられる。 【謝辞】本研究は、科研費・若手(A)26701012の助成を受け実施した。 【参考文献】1) Ohura T et al. Chem. Res. Toxicol.., 2007, 20, 1237-1241. 2) Horii Y et al., Environ. Sci. Technol., 2009, 43, 2159-2165. 3) Nishimura C et al. Organohalogen Cmpds., 2014, 76, 7038-7042. 4) Wang Y et al., Sci. Tot. Environ., 2012, 439, 187-193. 5) Horii Y et al., Environ. Sci. Technol., 2008, 42, 1904-1909. 6) 川西ら, 日本水環境学会シンポジウム講演集, 2014, 17, 20-21. 7) Ma J et al., Environ. Sci. Technol., 2009, 43, 643-649.
Ant
Phe
Chr
BbkF BaA
FluPyr
FleAceNap
DA
BPIP BaP
10
0
1
10
100
1000
10000
100000
0
0
1
10
100
1000
10000
100000
1.00 0
0
1
10
100
1000
10000
100000
1.00 0
0
1
10
100
1000
10000
100000
1.000.01
0.1
10
103
102
1
Conc
entr
atio
n (n
g/g)
(a)
104
105
TEQ (pg-TEQ
/g)
0.01
0.1
10
103
102
1
104
105
ΣBrPAHs(TEQ)
ΣClPAHs(Conc.)
ΣBrPAHs(Conc.)
ΣClPAHs(TEQ)
ΣPAHs(Conc.)
ΣPAHs(TEQ)
0%10%20%30%40%50%60%70%80%90%
100%
VN-1 VN-2 VN-3 GH-1 GH-2 PHI-1 PHI-20%
10%20%30%40%50%60%70%80%90%100%
VN-1 VN-2 VN-3 GH-1 GH-2 PHI-1 PHI-20%
10%20%30%40%50%60%70%80%90%100%
VN-1 VN-2 VN-3 GH-1 GH-2 PHI-1 PHI-2Co
mpo
sitio
n (%
)
100
80
60
40
20
0
(b)
VN-2 VN-3 GH-1 GH-2 PHI-1 PHI-2VN-1Figure 1. (a) Concentrations and Toxic equivalency (TEQ) values of ∑PAHs, ∑ClPAHs and ∑BrPAHs in soils. (b) Compositions of individual PAHs, ClPAHs and BrPAHs to each ∑PAHs, ∑ClPAHs and ∑BrPAHs concentraitons in soils.
第24回環境化学討論会,西村 智椰,口頭発表(札幌;2015年)

第 24回環境化学討論会,梶原夏子,口頭発表(札幌;2015年)
使用済み自動車部材および車内ダスト中の難燃剤等の調査(第 4報) ○梶原夏子 1,滝上英孝 1,小瀬知洋 2,鈴木 剛 1,酒井伸一 3
(1国環研・循環セ,2新潟薬大・応用生命科、3京都大・環科セ) 【はじめに】 自動車に使用される化学物質のうち、車室内で人へ曝露する可能性のある懸念物質としては、POPs条約の
対象である臭素系難燃剤に加え、他の難燃剤やフタル酸エステル類を含む様々な樹脂添加剤や揮発性有機
化合物、有害金属類等が挙げられる。フタル酸エステル類は、主にポリ塩化ビニル(PVC)などのプラスチックやゴムの可塑剤として建物や自動車の内装材としても幅広く使用されていることから、内装材に添加されたフタ
ル酸エステル類が車内ダストに移行し、ダストを介してヒトに取り込まれるリスクが懸念される。有害重金属類の
うち、Pb、Hg、Cd、Cr+6は欧州 ELV 指令により自動車の部品・材料中の最大許容濃度が定められているが、これまでに自動車内装材中のこれら重金属類等の含有実態についての報告例は乏しい。 そこで本研究では、これまで実施してきた臭素系難燃剤 1)およびリン系難燃剤 2)の調査に引き続き、フタル
酸エステル類のうち未規制物質を含む 10 物質および有害重金属類やレアメタル等 17 元素に着目して、自動車内装材および車内ダスト中の含有量を把握することを目的とした。 【試料と方法】 国内の ELV 解体工場において合計 52 台の ELV を対象に、乗用部分で表面積の大きい内装部材(シート
布地、シートウレタン、シート側面プラスチック、ダッシュボード、ドアトリム、フロアマット、フロア内装材、天井内
装材、防振材)に対して可搬型XRFによる元素濃度のスクリーニングを行うとともに部材を切り取り採取した。また、各車両乗車スペースの床面からと座面・ダッシュボード上からの 2種類に分けてダストを採取した(以降、それぞれ床面ダスト/座面ダストと表記)。 フタル酸エステル類:内装部材のうち、塩素含有量が 15 wt%を超過した 17 試料(PVC 含有素材と推定)お
よび塩素濃度が低い 8 試料を化学分析に供試し(ダッシュボード n=8;ドアトリム n=10;床材 n=1;フロアマットn=1;シートウレタン n=3;防音材 n=2)、フタル酸エステル類 10種類(DEHP、DBP、BBP、DINP、DIDP、DNOP、DMP、DEP、DIBP、DHP)を GC/MS にて定性・定量した。また、座面ダスト 4 検体および床面ダスト 6 検体に含まれるフタル酸エステル類も測定した。 金属元素:車内ダストのうち、座面ダスト 15 検体および床面ダスト 8 検体について、過塩素酸・ふっ酸・硝酸
分解の後、ICP-OES もしくは ICP-MS にて 17 元素(As、Cd、Ce、Co、Cr、Cu、Fe、La、Mn、Mo、Nd、Ni、Pb、Sb、Sn、V、Zn)の含有量を測定した。ダストへの土壌の寄与およびダストへの元素の濃縮性を推定するため、濃縮係数(Enrichment factor, EF)を以下の式で求めた。
𝐸𝐸𝐸𝐸𝑒𝑒 =[𝐶𝐶/𝑀𝑀𝑀𝑀]𝑑𝑑𝑑𝑑𝑑𝑑𝑑𝑑[𝐶𝐶/𝑀𝑀𝑀𝑀]𝑐𝑐𝑐𝑐𝑑𝑑𝑑𝑑𝑑𝑑
ここで EFeはある元素 e の EF、C はダスト中 e 濃度もしくは地殻中 e 存在度 3)、Mn はダスト中あるいは地殻中 Mn 濃度である。EF が 1 に近い場合、その対象元素は地殻起源であることを示唆し、EF>1 の元素は地殻中に比べるとダスト中により濃縮していることを表す。
Flame Retardants and Related Substances in the Interior Parts and Cabin Dusts of End-of-life Vehicles (4th Report) Natsuko KAJIWARA1, Hidetaka TAKIGAMI1, Tomohiro KOSE2, Go SUZUKI1, Shin-ichi SAKAI3: 1National Institute for Environmental Studies, 2Niigata University of Pharmacy and Applied Life Sciences, 3Kyoto University Tel: +81-29-850-2845 / Fax: +81-29-850-2759, E-mail: [email protected]
第24回環境化学討論会,梶原 夏子,口頭発表(札幌;2015年)
2C-02

第 24回環境化学討論会,梶原夏子,口頭発表(札幌;2015年)
【結果と考察】 1. フタル酸エステル類 調査対象とした9種類の内装材のうち、ダッシュボードお
よびドアトリムで塩素含有量が 15 wt%を超える部材の検出率が明らかに高かった。選定した 25 検体を化学分析に供試した結果、主に DEHP、DINP、DIDP、DNOP の 4 種類が検出され、対象としたフタル酸エステル類総濃度の 80%以上を占めていた。DHPおよびDMP、BBPの 3物質は検出頻度が明らかに低く、可塑剤として意図的に添加してい
る例は認められなかった。図 1 に部材中塩素濃度とフタル酸エステル類総濃度の関係を示す。本研究で対象とした
ダッシュボードは塩素含有量が高いことから PVC 製品と考えられるが、測定したフタル酸エステル類の濃度はいずれ
も低く、フタル酸エステル系以外の可塑剤が使用されてい
ることが示唆された。ダッシュボード以外では、塩素含有量
が 10 wt%以上の部材において 10–30 wt%程度のフタル酸エステル類の添加が認められ、ドアトリムでは DIDPが主に使用されていることがわかった。 全ての車内ダスト試料からフタル酸エステル類が検出され、内装材からダストへの移行が示唆された。DEHP
が最も高濃度で検出され(150–6,200 mg/kg)、DINP と合わせると総濃度の 90%以上を占めていた。一方、部材中では高濃度の検出が認められた DIDP はダスト中ではほぼ検出されず、部材とダスト中でフタル酸エステル類の組成に差が認められた。 2. 金属元素
610 部材を対象に可搬型 XRF で元素濃度をスクリーニングした結果、全体の 2.5%に相当する 15 検体で0.1 wt%以上の総 Cr 含有が認められたが、その大半がシート布地およびダッシュボードからの検出であったことから、主にメッキや金属表面処理に使用される Cr6+である可能性は低いものと考えられた。また、フロアマット
やダッシュボード、床材を含む 10 検体(全体の 1.6%)で 0.1 wt%以上の Pb が検出され、一部の内装材は欧州・ELV指令の許容濃度を超過することが明らかとなった。 車内ダストからは対象とした 17元素全てが検出された。Mn、V、Asは座面ダストより床面ダストから有意に高
濃度で検出され、Cu、Ce、Ni、La、Sn、Nd、Sbの濃度は座面ダストでより高値を示した。濃縮係数 EFを比較したところ、ほぼ全ての元素で座面ダストの方が高値を示したことから、床面ダストの方が土壌の寄与を受けてい
ることが確認された。中でも、床面ダスト中の Fe、Ce、La、Nd、V、Coは主に土壌由来であることが示唆された。また、車内ダスト中 Pb 濃度は、一般家庭のハウスダスト 4)よりも高値であったことから、今後、調査例数を蓄積
するとともに汚染源の特定や曝露量の推定が必要と考えられた。
【参考文献】 1) 梶原夏子、滝上英孝、小瀬知洋、鈴木 剛、酒井伸一(2013)使用済み自動車部材および車内ダスト中の難燃
剤等の調査(第 3報).第 22 回環境化学討論会、同要旨集 208–209. 2) 戸舘侑孝、小瀬知洋、川田邦明、梶原夏子、鈴木 剛、滝上英孝、酒井伸一(2013)使用済み自動車部材およ
び車内ダスト中の難燃剤等の調査(第 2報).第 22回環境化学討論会、同要旨集 206–207. 3) Wedepohl KH (1995) The composition of the continental crust, Geochimica et Cosmochimica Acta, 59, 1217–1232. 4) 峡戸孝也、高木麻衣、吉永 淳、田中 敦、瀬山春彦、柴田康行(2009)ハウスダスト中元素濃度の変動要因.
環境化学、19、87–94.
図 1.部材中塩素含有量とフタル酸エステル類
総濃度の関係
0
1x10⁵
2x10⁵
3x10⁵
4x10⁵
0 1x10⁵ 2x10⁵ 3x10⁵ 4x10⁵
DashboardDoor trimFloor coveringFloor matSeat PUFSoundproof material
Tota
l pht
hala
te c
onte
nts
(mg/
kg)
Chlorine contents (mg/kg)
第24回環境化学討論会,梶原 夏子,口頭発表(札幌;2015年)

第 回環境化学討論会,吉田卓矢,口頭発表(札幌; 年)
パッシブエアーサンプラーを用いたパッシブエアーサンプラーを用いたパッシブエアーサンプラーを用いたパッシブエアーサンプラーを用いた大気中大気中大気中大気中 各異性体における各異性体における各異性体における各異性体における の算出の算出の算出の算出○吉田卓矢 1,羽賀雄紀 2,松村千里 2,鶴川正寛 2,加藤栄一 1,中野武 3 (1 株式会社ネオス,2兵庫県環境研究センター,3大阪大学環境安全研究管理センター)
【はじめに】【はじめに】【はじめに】【はじめに】大気中の POPs 等のモニタリングにはフィルターや吸着剤を通して既知量の空気をポンプにより吸
引するアクティブエアーサンプラー(Active Air Sampler : AAS)が用いられている。この方法はポンプ
を使用するため電力の確保が必要である。そのため、広域多地点における同時サンプリングを実施す
るには不向きである。そこで広域多地点での同時サンプリングを実施する方法の一つとして、パッシ
ブエアーサンプラー(Passive Air Sampler : PAS)が提案されている。これは分析種をポリウレタンフォ
ームなどの吸着剤に空気の移流と拡散により受動的に捕集されることを利用した捕集方法であり、電
力を必要としないためサンプリングにおける場所の制約は少ない。そのため多地点の同時モニタリン
グの方法として期待されており、様々な研究者が基礎的な検討、結果を報告している 15。 今回は大気中 PCB に対するアクティブエアーサンプラー(AAS)とパッシブエアーサンプラー(PAS)
を用いた同一箇所での同時測定を行い、各異性体の sampling rate を算出したので報告する。 【方法【方法【方法【方法】】】】パッシブエアサンプラー(PAS)は、異なる大きさのボウルを二
つ重ねた UFO 型の容器にポリウレタンフォームプラグ(PUF: 直径 85mm 高さ 50mm)を装着し、1 か月程度の期間、室内で静
的な吸着大気捕集を実施した(Fig. 1)。並行してアクティブエア
サンプラー(AAS)として PSAir (Waters 製)を 2 段直列につな
ぎポンプで室内大気を捕集した。PSAir は 1 週間程度で交換し
ながらパッシブエアサンプラー(PAS)と同一期間大気捕集をし
た。大気捕集中の温度、湿度の測定は、温湿度データロガー
(TR72Ui、T&D 製)で連続モニタリングした。得られた分析
試料はヘキサンで溶出し、濃縮し、溶媒を 2,2,4トリメチルペン
タンに置換して、GCMS/MS(Bruker,320MS)で測定した。GC カラム
は PCB 異性体分析用キャピラリーカラム HT8PCB(関東化学製)を用いた。PCB 濃度は EC5433(CIL 製)を用いた検量線法で定量した。
Takuya Yoshida1, Yuki Haga2, Chisato Matsumura2 , Masahiro Tsurukawa2, Eiichi Kato1, Takeshi Nakano3 1 NEOS Company Limited, 11, Oikecho, Konan, Shiga, 5203213 JAPAN 2 Hyogo Prefectural Institute of Environmental sciences, 3127 Yukihiracho, Sumaku, Kobe 6540037 3 Graduate School of Engineering, Osaka University, 24 Yamadaoka, Suita 5650871 Tel : +81748753161, Fax : +81748750418, email:[email protected]
第24回環境化学討論会,吉田 卓矢,口頭発表(札幌;2015年)
2C-03

第 回環境化学討論会,吉田卓矢,口頭発表(札幌; 年)
IUPACNo.
sampring rate
(m3/day)average
#95 1.1-3.2 1.7#91 0.8-2.9 1.4#92 0.6-1.9 1.2#84 0.3-2.5 1.3#101 0.8-1.9 1.3#99 0.6-1.1 0.9#97 0.8-2.1 1.2#87 0.6-1.7 1.2#85 0.1-0.9 0.6#110 0.8-1.8 1.3#118 0.7-4.0 1.8#105 0.6-3.1 1.5
【結果【結果【結果【結果】】】】PUFに吸着された絶対量(ng)をAASの測定濃度(ng/m3)と比較して各異性体の Sampling rate(m3/day)
を求めた(Fig.2,3,Table 1)。5 塩素化 PCB 12 種類の異性体における sampling rate の平均値は 0.6~1.8 m3/dayとなった。PAS における sampling rate については種々の研究が行われており、最小は 0.57 m3/day、最大は 24 m3/day と報告されている。今回測定した 5 塩素化体の sampling rate はこれまでの報告と同様
のレベルであり、妥当な値と考えている。
【参考文献】【参考文献】【参考文献】【参考文献】1. Shoeib, M.; Harner, T. . , 4142. 2. Zhang, X.; Tsurukawa, M.; Nakano, T.; Lei, Y. D.; Wania, F. . , 10509. 3. Hazrati S.; Harrad, S. , , 448. 4. Melymuk, L.; Robson, M.; Helm, P. A.; Diamond, M. L. , , 1867. 5. Chaemfa, C.; Barber, J. L.; Gocht, T.; Harner, T.; Holoubek, I.; Klanova, J.; Jones, K. C.
, , 1290.
第24回環境化学討論会,吉田 卓矢,口頭発表(札幌;2015年)

24th Symposium on Environmental Chemistry, Chau Thi Cam Hong, Oral presentation (Sapporo; 2015)
Development of a comprehensive analytical method of polar organic pollutants in water samples by liquid chromatography time-of-flight mass spectrometry ○Chau Thi Cam Hong,Kiwao Kadokami (The University of Kitakyushu, 1-1 Hibikino, Wakamatsu, Kitakyushu)
[Introduction] Liquid chromatography time-of-flight mass spectrometry (LC/TOF-MS) is one of the best instruments for
screening of a large number of polar compounds 1-3. Many reports have described applications of LC/TOF-MS to determine pharmaceuticals and pesticides in a variety of samples 4-5. Since full-mass spectrum with accurate masses is obtained by LC/TOF-MS, the number of compounds found and confirmed can be increased unlimitedly, even after analysis. In this study, we developed a comprehensive analytical method consisting of solid-phase extraction (SPE) and LC/TOF-MS analysis equipped with an accurate-mass database of 311 polar-organic compounds (POCs) with accurate masses of molecular related ions and fragment ions, retention times, method detection limits and calibration curves. [Methods] Chemical and Reagents
Two hundred sixty four POCs were selected as model compounds (MCs) having log Pow ranged from -2.20 to 8.53. Reagents of MCs, internal standards (IS, methomyl-d3, pirimicarb-d6, imazalil-d5), surrogates (methamidophos-d6, sulfamethoxazole-d4, sulfadimethoxine-d6, simazine-d10, diflubenzuron-d4, ethofenprox-d5), acetone and dichloromethane (DCM) for pesticide residue analysis, and methanol of LC-MS grade were purchased from Wako Pure Chemical Industries (Osaka, Japan), Kanto Chemical Company and Sigma-Aldrich (Tokyo, Japan). SPE cartridges
Five SPE cartridges were examined for comprehensive extraction performance: C18 SepPak Plus (C18), PS-2 Sep-Pak short cartridge (PS-2), Oasis HLB Plus (HLB), and AC-2 Sep-Pak (AC-2) from Waters and Aqusis PLS-3 (PLS-3) from GL Sciences. SPE procedures
A water sample (200 mL) spiked with 40 μL of surrogates (5 μg/L) was passed through cartridges preconditioned with 5 mL of DCM, 5 mL of methanol and 10 mL of purified water and then rinsed with 10 mL of purified water. The cartridges were then dried with nitrogen to remove water for 40 min. The cartridges were eluted with methanol (5 mL) and DCM (3 mL). The eluate was evaporated to 200 μL and then spiked with 40 μL of IS (5 μg/L). The concentrate was diluted to 400 μL with methanol, filtered through a 0.2-μm syringe filter (Millex-LG) into an analysis vial and subsequently measured by LC-TOF-MS. LC/TOF-MS measurement
Analytical conditions of LC/TOF-MS are shown in Table 1. A final concentrate was measured by using two fragmentor voltage (FV) conditions in Table 1. Quantitation was performed by IS method using a peak area obtained at 100V. In order to certainly identify, we used measurement data obtained at four FV. Method detection
Table 1 Conditions of LC/TOF-MS
LC: Agilent 1200 Column: GL Science ODS-4 HP 2.1mm×150mm, 3μm Mobile phase: A; 5 mmol CH3COONH4 in H2O B; 5 mmol CH3COONH4 in CH3OH Gradient : A 95:B5(0min)-A5:B95 (30min-50min) Column temperature: 40°C Injection volume: 2 μl Flow rate: 0.3 ml/min MS: Agilent 6220 MSD Ionization: ESI-Positive Fragmentor Voltage: 100V for quantification, 100, 150, 200 and 250V for identification VCap voltage: 3500V Drying gas: 10 L/min at 325°C Scan range (m/z): 50-1000
24th Symposium on Environmental Chemistry, Chau Thi Cam Hong, Oral presentation (Sapporo; 2015)
2C-04

24th Symposium on Environmental Chemistry, Chau Thi Cam Hong, Oral presentation (Sapporo; 2015)
limits (MDL) of almost compounds are 8 ng/L that was obtained from the lowest concentration of their calibration curves ranging from 8 ng/L to 2000 ng/L. The correlation coefficients of calibration curves were higher than 0.99 for all the analytes.
[Results and discussion] Cartridge selection
Five SPE cartridges, C18, PS-2, HLB, AC-2 and PLS-3, were used to assess the extraction efficiency by using 200 mL of purified water containing 100 ng of 128 pesticides MCs. The number of MCs with recovery over 50% by using PS-2 or PLS-3 was 100, which was larger than 86 MCs by HLB or other cartridges (Table 2). However, up to 62 MCs were extracted at recoveries of ≧70% by HLB. It was also clarified that AC-2 could effectively extract MCs having low log Pow (highly polar substances). Therefore, two kinds of combinations of PS2-AC2 and HLB-AC2 were selected to simultaneously extract MCs. Recovery test using purified water
Purified water (200 mL) was spiked with 264 MCs at two levels of concentrations (50 ng/L and 200 ng/L), and was extracted by SPE using PS2-AC2 and HLB-AC2 (replication n=7 for each concentration and each combined cartridges). Table 3 showed the results obtained at low-concentration (50 ng/L); the developed method produced recoveries over 70% for 180 and 181 (96%) out of 188 MCs, which had MDL lower than 50 ng/L, by using PS2-AC2 and HLB -AC2, respectively. At high-concentration level, these cartridges also showed the same recoveries in extraction of MCs (PS2-AC2, 219 MCs; HLB-AC2, 218 MCs accounting for 83% out of 264 MCs) (Table 3). Most of low-recovery MCs had log Pow of > 4.
Application to environmental samples
An effluent water (200 mL) of a sewage treatment plant was added with 200 ng of 85 MCs, and then extracted by SPE with PS2-AC2. Recoveries of 80 MCs (94% of spiked MCs) exceeded 50%. Sixty seven MCs were extracted with high recovery rates of over 70% (Table 3). Some MCs that showed high recovery rates (>50%) in the purified water recovery tests, however, showed low recoveries from environmental samples. It is probably due to matrix effects of a sample in LC/TOF-MS measurement. Surrogates with log Pow ranging from -0.78 to 7.3 were useful to confirm recoveries of the analytes in environmental samples.
[Conclusions]
The analytical method for a large number of POCs in water samples was developed by the combination of SPE using PS2-AC2 or HLB-AC2 and LC/TOF-MS analysis. The combination of this developed SPE method and the accurate-mass database of LC/TOF-MS has a potential for not only multi-residue screening but also the quantitative analyses.
[References] (1) Ferrer I, Thurman E.M. (2008), Wiley, 257-257; (2) Mezcua M, et al. (2009), Anal. Chem. 81, 913-929; (3) Akiyama Y, et al. (2009), J. Pestic. Sci. 34, 265-272; (4) Ferrer I, et al. (2012), J. Chromatogr. A. 1259, 148-157; (5) Gómez M, et al. (2007), J. Environ. Monitor. 9, 718-729.
Cartridge Re ≧50% Re ≧70%AC-2 46 6C18 73 45HLB 86 62PS-2 100 55
PLS-3 100 53Re: Recovery
Number of MCs
Table 2 Recoveries of MCs using 5 cartridges
PS2-AC2 (n=5)50 ng/L 200 ng/L 50 ng/L 200 ng/L 200 ng/L
Pharmaceuticals 87 65 74 66 78 50 41Pesticides 177 115 145 115 140 35 26
Total 264 180 219 181 218 85 67
Numbers ofspiked MCs
Numbers ofspiked MCs
Purified water spike test (recovery ≧ 70%)Environmental sample spike test
(recovery ≧ 70%)
Table 3 Numbers of MCs detected in the purified water spike tests and evvironmental sample spike tests
PS2-AC2 (n=7) HLB-AC2 (n=7)
24th Symposium on Environmental Chemistry, Chau Thi Cam Hong, Oral presentation (Sapporo; 2015)

24th Symposium of Environmental Chemistry, Xianming Zhang, Oral presentation (Sapporo; 2015)
Long-term trends in concentrations of perfluorooctane sulfonate (PFOS) in seawater: A modeling assessment Xianming Zhang1, 2,Yanxu Zhang1,Elsie Sunderland 1, 2 (1Harvard School of Engineering and Applied Sciences,2Harvard T.H. Chan School of Public Health, Harvard University)
[Introduction] Exposure to perfluorooctane sulfonate (PFOS), a persistent organic pollutant, has been associated with a suite of negative health impacts on humans and wildlife including immunotoxicity and neonatal mortality. 1, 2 PFOS had been manufactured and used in large quantities between the 1960s and 2000s.3 PFOS enters the environment primarily via effluent of wastewater treatment plants and is transported to oceans by rivers and through direct discharges of wastewater effluent.4 Prior work has established that oceans are the final global sink for PFOS releases and thus oceanic transport processes are critical for its lifetime and global impacts.5, 6, 7 The extreme environmental persistence of PFOS means it continues to pose a risk for human and ecological health more than a decade after the phase out of production by the major global manufacturer. Here we use a global 3-D ocean circulation model (MITgcm) to assess the lifetime and distribution of PFOS in the North Atlantic Ocean. [Methods] We derived a regression model to predict discharges of PFOS from wastewater treatment plants (WWTPs) based on their service population. Based on the regression and database of wastewater treatment information for Canada8and USA,9 we estimated ocean discharges of PFOS from each of the river basins in North America and from wastewater effluent directly loaded to the oceans using GIS tools. The estimated PFOS discharges to the oceans from North American together with previous estimation for Europe10 were used as input for the MIT global 3D general circulation model (MITgcm)11 to simulate the fate and trends of PFOS between 1958 and 2037 in the North Atlantic Ocean. The model was configured with a horizontal resolution of 1° × 1° and 23 vertical levels with resolutions between 10 m (surface ocean) and 500 m (deeper ocean). The ocean circulation is constrained with the Estimating Circulation and Climate of the Ocean (ECCO)12 state estimates. As PFOS is 100% anthropogenic, initial PFOS concentrations (before 1958 when industry production started) in the ocean were set to zero for the model simulations. Within the framework of MITgcm, we implemented the protonized, deprotonized, and particle-bound form of PFOS as three tracers and described their fate and processes in the oceans. Primary processes considered include (1) equilibrium between protonized and deprotonized species as a function of pH of ocean water and pKa of the chemical (2) equilibrium distribution between dissolved and particle-bound
Wastewater��Treatment�Plant� River�Basin�
PFOS�
Ocean�
24th Symposium of Environmental Chemistry, Xianming Zhang, Oral presentation (Sapporo; 2015)
2C-05

24th Symposium of Environmental Chemistry, Xianming Zhang, Oral presentation (Sapporo; 2015)
species of the compound based on empirical distribution coefficients; (3) vertical transport of particle-bound chemical species driven by settling of organic carbon are from the biogeochemical/ecosystem model embedded within the MITgcm; (4) advection and eddy diffusion of the tracers with pre-computed, archived ocean current fields. [Results and discussion] The relationship between discharges of PFOS from wastewater effluent and service population of the WWTPs is nonlinear. A higher per-capita PFOS emission is expected for a WWTP serving a larger population. Large WWTPs generally serve large metropolitan areas, where commercial products enriched with synthetic organic chemicals including PFOS and related chemicals tend to be more extensively used in working and service areas in addition to residential areas. Estimated total annual discharges of PFOS to the oceans from the 106 major rivers in North America were 340 kg (corresponding to the year 2010). The Mississippi and St. Lawrence river basins are the dominant PFOS dischargers with annual discharges of 92 and 82 kg. 65 kg of PFOS was discharged to the oceans directly from WWTPs annually (normalized to 2010). WWTPs in California accounted for over 50% (34kg) of the total direct PFOS discharge from WWTPs in North America. Comparing with measured PFOS concentrations in surface seawater, the model could reproduce the general spatial trend. Discrepancies between modeled and measured PFOS concentrations at specific location and time are within the uncertainty range of the estimated PFOS discharges from continental sources. PFOS concentrations in seawater reached the peak in 2000, after which PFOS was being phased out. At locations close to PFOS sources, PFOS concentrations had a faster response to the source phase-out. Within a decade, over 95% of the North Atlantic ocean area reached concentrations below the 130 pg/L environmental quality standard of sea water proposed by the European Commission. Nevertheless, the model identified Hudson Bay and the western part of Gulf of Mexico as hotspots of PFOS. Even two decades after the source elimination. PFOS concentrations still remains higher than the environmental quality standard. We compared the modeled temporal trend of PFOS in seawater with measured temporal trend of PFOS in ringed seals sampled from Hudson Bay between 1992 and 2012. The temporal profile of PFOS in the ringed seals is associated with the modeled PFOS in seawater close to Arviat, Nunavut, Canada, where the ringed seal samples were taken. From this, we infer PFOS in seawater is a driven factor for bioaccumulation of PFOS in marine food webs, which is in contrast to a previous inference that PFOS in the ringed seal is “possible only if the major exposure route in marine food webs is uptake and metabolism of precursor compounds” 3 [References] (1) Peden-Adams, M. M., et al. J. Toxicol. Environ. Health A 2007, 70, 1130-1141. (2) Alexander, B. H., et al. Occup. Environ. Med. 2003, 60, 722-729. (3) Armitage, J. M., et al. Environ. Sci. Technol. 2009, 43, 9274-9280. (4) Earnshaw, M. R., et al. Environ. Int. 2014, 70C, 25-31. (5) Yamashita, N., et al. Chemosphere 2008, 70, 1247-1255. (6) Ahrens, L. J. Environ. Monit. 2011, 13, 20-31. (7) Muir, D.; Lohmann, R. Trac-Trend Anal. Chem. 2013, 46, 162-172. (8) Environment Canada, 2009 Municipal Water and Wastewater Survey. (9) US EPA. Database associated with the Clean Watersheds Needs Survey (CWNS) 2008 Report to Congress (10) Pistocchi, A.; Loos, R. Environ. Sci. Technol. 2009, 43, 9237-9244. (11) Marshall, J., et al. J Geophys Res-Oceans 1997, 102, 5733-5752. (12) Wunsch, C.; Heimbach, P. Physica D 2007, 230, 197-208.
24th Symposium of Environmental Chemistry, Xianming Zhang, Oral presentation (Sapporo; 2015)


![学校環境衛生管理 マニュアル - mext.go.jp...学校環境衛生管理 マニュアル 「学校環境衛生基準」の理論と実践 [平成30年度改訂版] 文部科学省](https://img.pdfslide.tips/doc/110x75/5e4a97baf0054b58e74a1282/cfeccc-ffff-mextgojp-cfeccc.jpg)