Embed Size (px)
Citation preview
Change of Young’s Modulus with Increasing Applied Tensile Strain
in Open Cell Nickel and Copper Foams
Shojiro Ochiai1, Satoshi Nakano1;*, Yuya Fukazawa1;*, Mohamed Shehata Aly1,Hiroshi Okuda1, Komei Kato2, Takeshi Isobe3, Koichi Kita4 and Keiichi Honma3
1Department of Materials Science and Engineering, Kyoto University, Kyoto 606-8501, Japan2Mitsubishi Materials Corporation, Saitama 330-8508, Japan3Non-ferrous Alloys Research & Technology Laboratory, Mitsubishi Materials Corporation, Kitamoto 364-0023, Japan4Central Research Institute, Mitsubishi Materials Corporation, Kitamoto 364-0022, Japan
The change of Young’s modulus with increasing applied tensile strain in the open cell nickel and copper foams, fabricated by the slurryfoaming process at Mitsubishi Materials Corporation, Japan, was investigated experimentally and analytically. Stress-strain curves weremeasured at room temperature, in which the loading-unloading-reloading process was performed on the sample at various applied strains. Formeasurement of the strain of the sample itself accurately, the non-contact extensometer was employed. The Young’s modulus values at variousapplied tensile strains were estimated from the slope of the elastic region in the stress-strain curve in the unloading process. It was revealed thattwo competitive factors affect on the Young’ modulus value. One is the irreversible morphology-change of cells arising from the plasticdeformation of the metal as a results of which, the cells are elongated and struts are straight forwarded in the tensile direction. This factor acts toraise the Young’s modulus with increasing applied strain. Another factor is the failure of struts, which tends to reduce the Young’s modulus withincreasing applied strain, especially beyond the strain where the struts are failed successively. Accordingly, due to the competition of the formerand latter factors, the Young’s modulus increases, reaching maximum and then decreases with increasing applied strain in both of the foams. Theincrease in Young’s modulus with increasing applied strain due to the change of geometry of struts was confirmed by the experimental test ofmicro-samples composed of several struts and nodes and by the simulation based on the finite element analysis using a model micro-sample.[doi:10.2320/matertrans.M2009384]
(Received November 19, 2009; Accepted February 9, 2010; Published March 25, 2010)
Keywords: nickel foam, copper foam, deformation, failure, Young’s modulus
1. Introduction
The metal foams have been produced by gas-injectionmethod,1,2) directional solidification method,3–5) precursormethod,6–8) slurry foaming method9) and so on.10–13) Amongthem, the metal foam produced by the slurry foaming methodhas a feature of very high porosity fraction (90�97%) in theopen cell structure.9) In the preceding work,14) the deforma-tion and failure behavior of nickel and copper open cellfoams with porosity volume fraction �96% and poresize �600 mm on average, fabricated by the slurry foamingmethod9) at Mitsubishi Materials Corporation, was studied.The following phenomena were found.
(1) The change of the morphology of the struts and cells iscaused by the applied strain-induced plastic deformation,according to which the struts and cells are elongated and arestraight forwarded in the tensile direction.
(2) In the early stage, the number of failed struts increaseswith increasing applied strain, where the failed struts aredistributed spatially. On the other hand, in the later stage, thefailed struts cause the failure of the neighboring struts oneafter another nearly in a limited cross-section.
In the bulk materials, the externally applied stress is borneby the whole body of the sample, and the Young’s modulus isthe material constant, which never varies under deformation.On the other hand, as stated above, in the present foams withhigh porosity (�96%), the stress is carried by the originallycurved cells and struts. The morphology of the stress carrying
metal cells and struts is changed and also the failure of themis caused by the applied strain. It is expected that the Young’smodulus varies with increasing applied strain. The aim of thepresent work is to estimate the Young’s modulus of the foamand to discuss the influence of the change of the morphologyof the cells and struts and failure of the struts on the changeof the Young’s modulus.
2. Experimental and Analytical Procedure
Open cell nickel and copper foam-plates with averageporosity volume fraction �96% and pore size �600 mm,fabricated by the slurry foaming method at MitsubishiMaterials Corporation, were used as similarly as in ourpreceding paper.14) The thicknesses of the nickel and copperfoam plates were 2.0 and 1.5mm, respectively.
Tensile test was carried out at room temperature witha tensile machine (AUTOGRAPH-AG 50kNG, ShimadzuCorp). The width and gage length of tensile samples were10 and 50mm, respectively. The test was conducted at aconstant crosshead speed of 8:3� 10�6 m/s. The strainmeasurement of samples was carried out with a non-contactextensometer (DVW-200 Shimadzu), with which the strain ofthe samples itself was measured accurately without givingdamage and constraint to the samples. Details of the samplespecification and test procedure are shown in our precedingwork.14)
In the measurement of stress-strain curves of the foamsfor estimation of Young’s modulus, the sample was loaded upto a prescribed strain, and was unloaded in a small strain*Graduate Student, Kyoto University
Materials Transactions, Vol. 51, No. 5 (2010) pp. 925 to 932#2010 The Japan Institute of Metals
range, and then was reloaded to the next prescribed strain.Such a loading-unloading-reloading process was given tothe sample repeatedly. The Young’s modulus of the foamsamples was estimated using the elastic deformation regionthat appears in the stress-strain curve upon unloading.
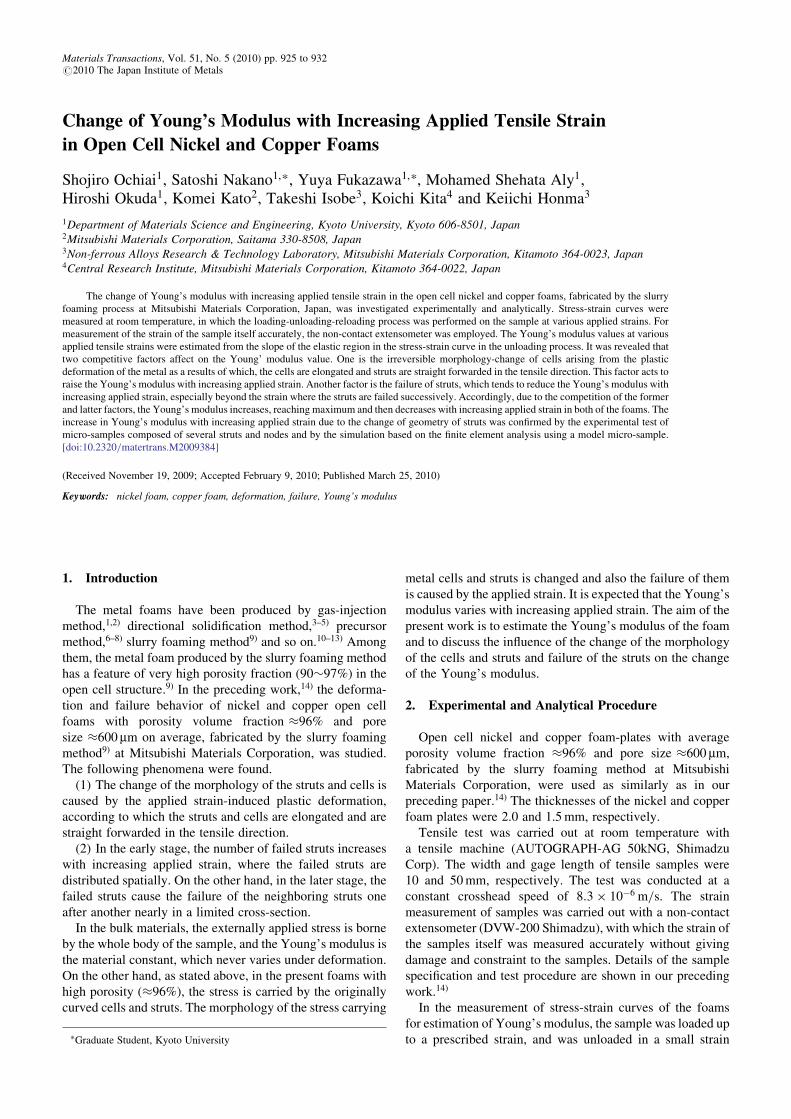
As shown later, the change of the Young’s modulus offoams with increasing applied strain is attributed to themorphology change (straight forwarding of struts and cells)and failure of the struts. In order to confirm the increase inYoung’s modulus due to the morphology change, micro-samples with several struts and nodes were taken out bycutting off from the foams (whose morphology will beshown later in Figs. 2 and 8), and the change of Young’smodulus with applied strain was measured from the slopeof the elastic deformation region in the load-strain curveduring unloading, as similarly as in the foam samples.In the tensile test, the gage length was taken to be 1mm.The end regions of the micro-sample were glued to a100 mm thick paper with an epoxy resin (High Super 30,Cemedine Co., Ltd., Tokyo, Japan), as shown in Fig. 1(a).After gripping the test sample in the tensile machine, thepaper was cut so that the applied load was carried only bythe micro-sample (Fig. 1(b)). The tensile test was carriedout at room temperature with a universal tensile testingmachine (MMT-10N-2, Shimadzu Co., Kyoto, Japan),which is designed for the measurement of strength of smalldiameter (5–20 mm) fibers and has been used for estimationof strength of SiC fiber15) and Nb3Al superconductingfilaments.16) The deformation and failure behavior wasobserved with a digital microscope (KEYENCE VHX-500SP1639).
Fig. 2 Modeling of the micro-sample for FEM analysis to examine the influence of the morphology change on Young’s modulus.
(a) Micro-sample taken out of the nickel foam. (a0) FEM model using the configuration of the micro-sample shown in (a). (b) Failure
morphology of the micro-sample which was straight-forwarded toward the tensile axis by plastic deformation.
Fig. 1 Tensile test method of the micro-samples taken out of the foam.
926 S. Ochiai et al.
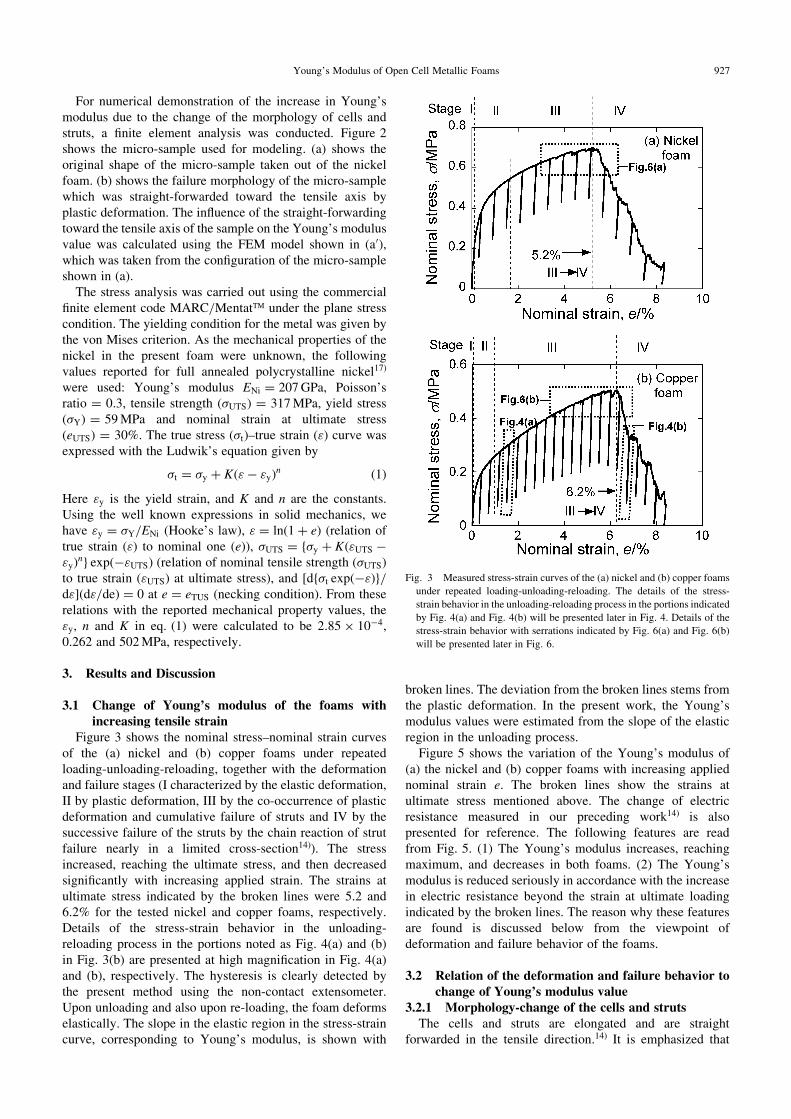
For numerical demonstration of the increase in Young’smodulus due to the change of the morphology of cells andstruts, a finite element analysis was conducted. Figure 2shows the micro-sample used for modeling. (a) shows theoriginal shape of the micro-sample taken out of the nickelfoam. (b) shows the failure morphology of the micro-samplewhich was straight-forwarded toward the tensile axis byplastic deformation. The influence of the straight-forwardingtoward the tensile axis of the sample on the Young’s modulusvalue was calculated using the FEM model shown in (a0),which was taken from the configuration of the micro-sampleshown in (a).
The stress analysis was carried out using the commercialfinite element code MARC/Mentat� under the plane stresscondition. The yielding condition for the metal was given bythe von Mises criterion. As the mechanical properties of thenickel in the present foam were unknown, the followingvalues reported for full annealed polycrystalline nickel17)
were used: Young’s modulus ENi ¼ 207GPa, Poisson’sratio = 0.3, tensile strength (�UTS) = 317MPa, yield stress(�Y) = 59MPa and nominal strain at ultimate stress(eUTS) = 30%. The true stress (�t)–true strain (") curve wasexpressed with the Ludwik’s equation given by
�t ¼ �y þ Kð"� "yÞn ð1Þ
Here "y is the yield strain, and K and n are the constants.Using the well known expressions in solid mechanics, wehave "y ¼ �Y=ENi (Hooke’s law), " ¼ lnð1þ eÞ (relation oftrue strain (") to nominal one (e)), �UTS ¼ f�y þ Kð"UTS �"yÞng expð�"UTSÞ (relation of nominal tensile strength (�UTS)to true strain ("UTS) at ultimate stress), and ½df�t expð�"Þg=d"�ðd"=deÞ ¼ 0 at e ¼ eTUS (necking condition). From theserelations with the reported mechanical property values, the"y, n and K in eq. (1) were calculated to be 2:85� 10�4,0.262 and 502MPa, respectively.
3. Results and Discussion
3.1 Change of Young’s modulus of the foams withincreasing tensile strain
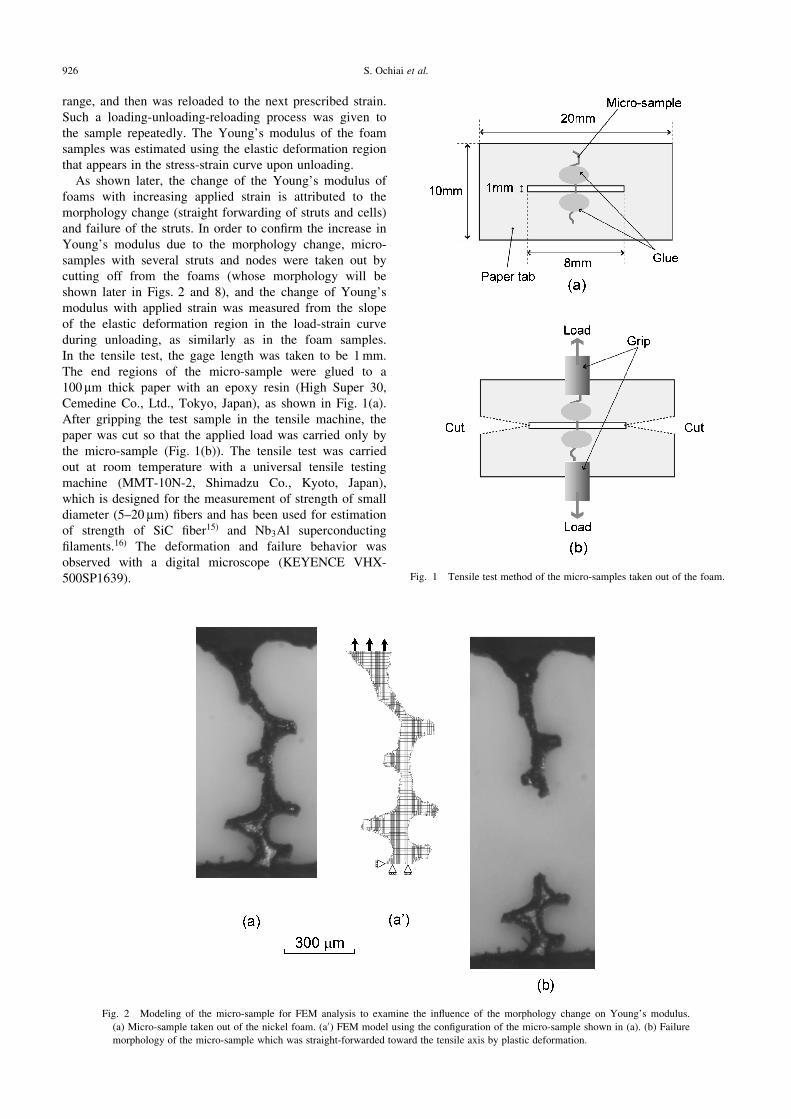
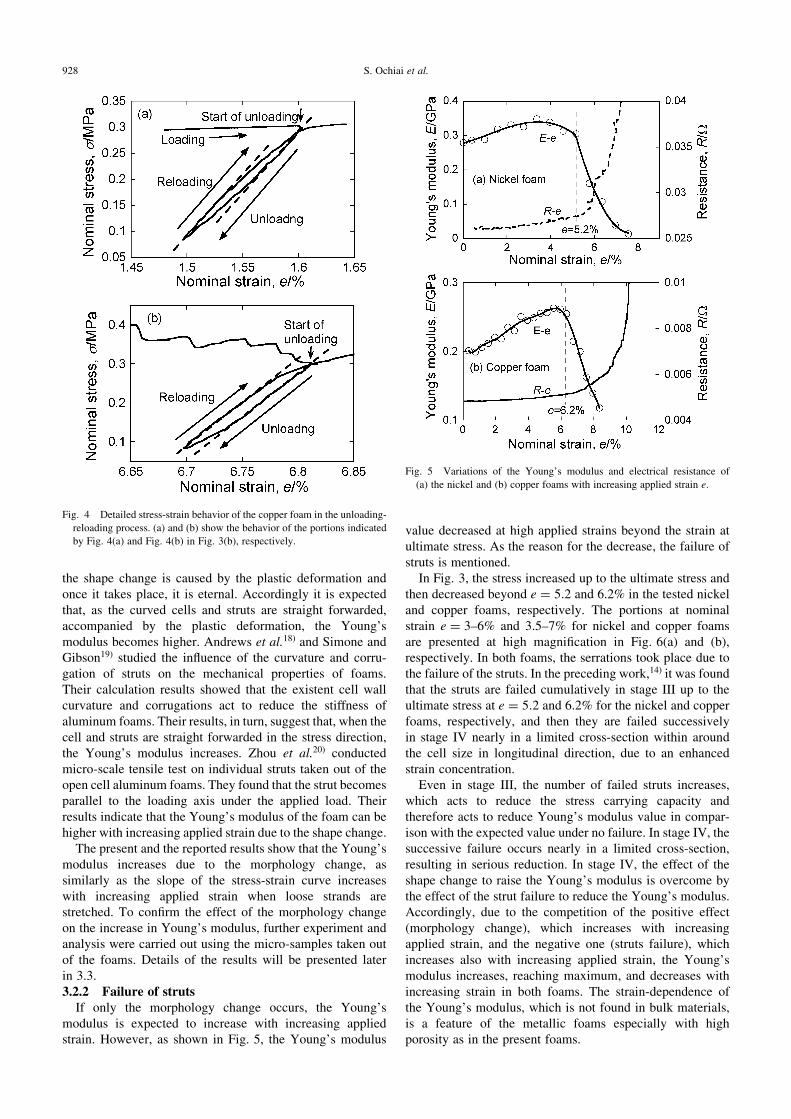
Figure 3 shows the nominal stress–nominal strain curvesof the (a) nickel and (b) copper foams under repeatedloading-unloading-reloading, together with the deformationand failure stages (I characterized by the elastic deformation,II by plastic deformation, III by the co-occurrence of plasticdeformation and cumulative failure of struts and IV by thesuccessive failure of the struts by the chain reaction of strutfailure nearly in a limited cross-section14)). The stressincreased, reaching the ultimate stress, and then decreasedsignificantly with increasing applied strain. The strains atultimate stress indicated by the broken lines were 5.2 and6.2% for the tested nickel and copper foams, respectively.Details of the stress-strain behavior in the unloading-reloading process in the portions noted as Fig. 4(a) and (b)in Fig. 3(b) are presented at high magnification in Fig. 4(a)and (b), respectively. The hysteresis is clearly detected bythe present method using the non-contact extensometer.Upon unloading and also upon re-loading, the foam deformselastically. The slope in the elastic region in the stress-straincurve, corresponding to Young’s modulus, is shown with
broken lines. The deviation from the broken lines stems fromthe plastic deformation. In the present work, the Young’smodulus values were estimated from the slope of the elasticregion in the unloading process.
Figure 5 shows the variation of the Young’s modulus of(a) the nickel and (b) copper foams with increasing appliednominal strain e. The broken lines show the strains atultimate stress mentioned above. The change of electricresistance measured in our preceding work14) is alsopresented for reference. The following features are readfrom Fig. 5. (1) The Young’s modulus increases, reachingmaximum, and decreases in both foams. (2) The Young’smodulus is reduced seriously in accordance with the increasein electric resistance beyond the strain at ultimate loadingindicated by the broken lines. The reason why these featuresare found is discussed below from the viewpoint ofdeformation and failure behavior of the foams.
3.2 Relation of the deformation and failure behavior tochange of Young’s modulus value
3.2.1 Morphology-change of the cells and strutsThe cells and struts are elongated and are straight
forwarded in the tensile direction.14) It is emphasized that
Fig. 3 Measured stress-strain curves of the (a) nickel and (b) copper foams
under repeated loading-unloading-reloading. The details of the stress-
strain behavior in the unloading-reloading process in the portions indicated
by Fig. 4(a) and Fig. 4(b) will be presented later in Fig. 4. Details of the
stress-strain behavior with serrations indicated by Fig. 6(a) and Fig. 6(b)
will be presented later in Fig. 6.
Young’s Modulus of Open Cell Metallic Foams 927
the shape change is caused by the plastic deformation andonce it takes place, it is eternal. Accordingly it is expectedthat, as the curved cells and struts are straight forwarded,accompanied by the plastic deformation, the Young’smodulus becomes higher. Andrews et al.18) and Simone andGibson19) studied the influence of the curvature and corru-gation of struts on the mechanical properties of foams.Their calculation results showed that the existent cell wallcurvature and corrugations act to reduce the stiffness ofaluminum foams. Their results, in turn, suggest that, when thecell and struts are straight forwarded in the stress direction,the Young’s modulus increases. Zhou et al.20) conductedmicro-scale tensile test on individual struts taken out of theopen cell aluminum foams. They found that the strut becomesparallel to the loading axis under the applied load. Theirresults indicate that the Young’s modulus of the foam can behigher with increasing applied strain due to the shape change.
The present and the reported results show that the Young’smodulus increases due to the morphology change, assimilarly as the slope of the stress-strain curve increaseswith increasing applied strain when loose strands arestretched. To confirm the effect of the morphology changeon the increase in Young’s modulus, further experiment andanalysis were carried out using the micro-samples taken outof the foams. Details of the results will be presented laterin 3.3.3.2.2 Failure of struts
If only the morphology change occurs, the Young’smodulus is expected to increase with increasing appliedstrain. However, as shown in Fig. 5, the Young’s modulus
value decreased at high applied strains beyond the strain atultimate stress. As the reason for the decrease, the failure ofstruts is mentioned.
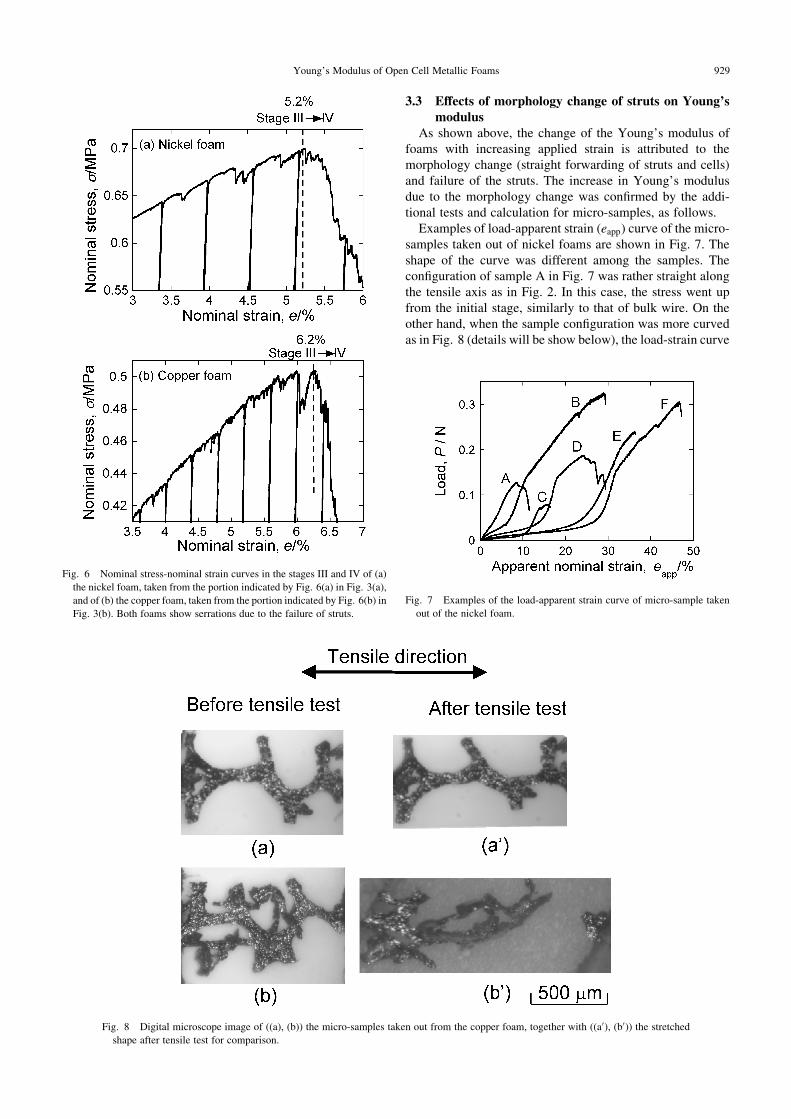
In Fig. 3, the stress increased up to the ultimate stress andthen decreased beyond e ¼ 5:2 and 6.2% in the tested nickeland copper foams, respectively. The portions at nominalstrain e ¼ 3{6% and 3.5–7% for nickel and copper foamsare presented at high magnification in Fig. 6(a) and (b),respectively. In both foams, the serrations took place due tothe failure of the struts. In the preceding work,14) it was foundthat the struts are failed cumulatively in stage III up to theultimate stress at e ¼ 5:2 and 6.2% for the nickel and copperfoams, respectively, and then they are failed successivelyin stage IV nearly in a limited cross-section within aroundthe cell size in longitudinal direction, due to an enhancedstrain concentration.
Even in stage III, the number of failed struts increases,which acts to reduce the stress carrying capacity andtherefore acts to reduce Young’s modulus value in compar-ison with the expected value under no failure. In stage IV, thesuccessive failure occurs nearly in a limited cross-section,resulting in serious reduction. In stage IV, the effect of theshape change to raise the Young’s modulus is overcome bythe effect of the strut failure to reduce the Young’s modulus.Accordingly, due to the competition of the positive effect(morphology change), which increases with increasingapplied strain, and the negative one (struts failure), whichincreases also with increasing applied strain, the Young’smodulus increases, reaching maximum, and decreases withincreasing strain in both foams. The strain-dependence ofthe Young’s modulus, which is not found in bulk materials,is a feature of the metallic foams especially with highporosity as in the present foams.
Fig. 5 Variations of the Young’s modulus and electrical resistance of
(a) the nickel and (b) copper foams with increasing applied strain e.
Fig. 4 Detailed stress-strain behavior of the copper foam in the unloading-
reloading process. (a) and (b) show the behavior of the portions indicated
by Fig. 4(a) and Fig. 4(b) in Fig. 3(b), respectively.
928 S. Ochiai et al.
3.3 Effects of morphology change of struts on Young’smodulus
As shown above, the change of the Young’s modulus offoams with increasing applied strain is attributed to themorphology change (straight forwarding of struts and cells)and failure of the struts. The increase in Young’s modulusdue to the morphology change was confirmed by the addi-tional tests and calculation for micro-samples, as follows.
Examples of load-apparent strain (eapp) curve of the micro-samples taken out of nickel foams are shown in Fig. 7. Theshape of the curve was different among the samples. Theconfiguration of sample A in Fig. 7 was rather straight alongthe tensile axis as in Fig. 2. In this case, the stress went upfrom the initial stage, similarly to that of bulk wire. On theother hand, when the sample configuration was more curvedas in Fig. 8 (details will be show below), the load-strain curve
Fig. 7 Examples of the load-apparent strain curve of micro-sample taken
out of the nickel foam.
Fig. 8 Digital microscope image of ((a), (b)) the micro-samples taken out from the copper foam, together with ((a0), (b0)) the stretched
shape after tensile test for comparison.
Fig. 6 Nominal stress-nominal strain curves in the stages III and IV of (a)
the nickel foam, taken from the portion indicated by Fig. 6(a) in Fig. 3(a),
and of (b) the copper foam, taken from the portion indicated by Fig. 6(b) in
Fig. 3(b). Both foams show serrations due to the failure of struts.
Young’s Modulus of Open Cell Metallic Foams 929
turned to S-shape type (samples B to F), similarly to that ofloose strands.
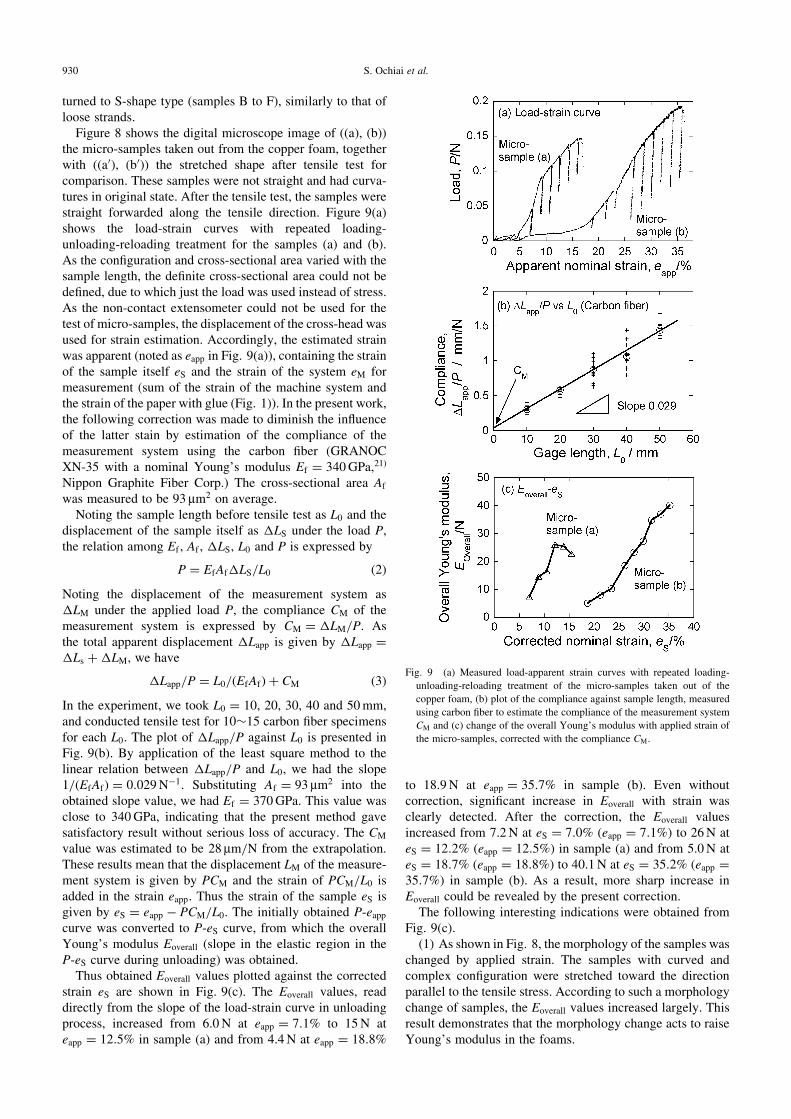
Figure 8 shows the digital microscope image of ((a), (b))the micro-samples taken out from the copper foam, togetherwith ((a0), (b0)) the stretched shape after tensile test forcomparison. These samples were not straight and had curva-tures in original state. After the tensile test, the samples werestraight forwarded along the tensile direction. Figure 9(a)shows the load-strain curves with repeated loading-unloading-reloading treatment for the samples (a) and (b).As the configuration and cross-sectional area varied with thesample length, the definite cross-sectional area could not bedefined, due to which just the load was used instead of stress.As the non-contact extensometer could not be used for thetest of micro-samples, the displacement of the cross-head wasused for strain estimation. Accordingly, the estimated strainwas apparent (noted as eapp in Fig. 9(a)), containing the strainof the sample itself eS and the strain of the system eM formeasurement (sum of the strain of the machine system andthe strain of the paper with glue (Fig. 1)). In the present work,the following correction was made to diminish the influenceof the latter stain by estimation of the compliance of themeasurement system using the carbon fiber (GRANOCXN-35 with a nominal Young’s modulus Ef ¼ 340GPa,21)
Nippon Graphite Fiber Corp.) The cross-sectional area Af
was measured to be 93 mm2 on average.Noting the sample length before tensile test as L0 and the
displacement of the sample itself as �LS under the load P,the relation among Ef , Af , �LS, L0 and P is expressed by
P ¼ EfAf�LS=L0 ð2Þ
Noting the displacement of the measurement system as�LM under the applied load P, the compliance CM of themeasurement system is expressed by CM ¼ �LM=P. Asthe total apparent displacement �Lapp is given by �Lapp ¼�Ls þ�LM, we have
�Lapp=P ¼ L0=ðEfAfÞ þ CM ð3Þ
In the experiment, we took L0 ¼ 10, 20, 30, 40 and 50mm,and conducted tensile test for 10�15 carbon fiber specimensfor each L0. The plot of �Lapp=P against L0 is presented inFig. 9(b). By application of the least square method to thelinear relation between �Lapp=P and L0, we had the slope1=ðEfAfÞ ¼ 0:029N�1. Substituting Af ¼ 93 mm2 into theobtained slope value, we had Ef ¼ 370GPa. This value wasclose to 340GPa, indicating that the present method gavesatisfactory result without serious loss of accuracy. The CM
value was estimated to be 28 mm/N from the extrapolation.These results mean that the displacement LM of the measure-ment system is given by PCM and the strain of PCM=L0 isadded in the strain eapp. Thus the strain of the sample eS isgiven by eS ¼ eapp � PCM=L0. The initially obtained P-eappcurve was converted to P-eS curve, from which the overallYoung’s modulus Eoverall (slope in the elastic region in theP-eS curve during unloading) was obtained.
Thus obtained Eoverall values plotted against the correctedstrain eS are shown in Fig. 9(c). The Eoverall values, readdirectly from the slope of the load-strain curve in unloadingprocess, increased from 6.0N at eapp ¼ 7:1% to 15N ateapp ¼ 12:5% in sample (a) and from 4.4N at eapp ¼ 18:8%
to 18.9N at eapp ¼ 35:7% in sample (b). Even withoutcorrection, significant increase in Eoverall with strain wasclearly detected. After the correction, the Eoverall valuesincreased from 7.2N at eS ¼ 7:0% (eapp ¼ 7:1%) to 26N ateS ¼ 12:2% (eapp ¼ 12:5%) in sample (a) and from 5.0N ateS ¼ 18:7% (eapp ¼ 18:8%) to 40.1N at eS ¼ 35:2% (eapp ¼35:7%) in sample (b). As a result, more sharp increase inEoverall could be revealed by the present correction.
The following interesting indications were obtained fromFig. 9(c).
(1) As shown in Fig. 8, the morphology of the samples waschanged by applied strain. The samples with curved andcomplex configuration were stretched toward the directionparallel to the tensile stress. According to such a morphologychange of samples, the Eoverall values increased largely. Thisresult demonstrates that the morphology change acts to raiseYoung’s modulus in the foams.
Fig. 9 (a) Measured load-apparent strain curves with repeated loading-
unloading-reloading treatment of the micro-samples taken out of the
copper foam, (b) plot of the compliance against sample length, measured
using carbon fiber to estimate the compliance of the measurement system
CM and (c) change of the overall Young’s modulus with applied strain of
the micro-samples, corrected with the compliance CM.
930 S. Ochiai et al.
(2) The Eoverall values of samples (a) and (b) increasedaround by several times in accordance with the increase inapplied strain. In the experimental result of the foams, theincrease in the Young’s modulus from the initial value ate ¼ 0% was, however, 25–30% at e ¼ 5�6% (Fig. 5). Thefollowing two factors could be mentioned as the reason whythe increase in Young’s modulus of the foams is small incomparison with that of micro-samples. (A) Among thestruts, some struts, which are originally rather straight such assample A in Fig. 7, contribute to Young’s modus of foamseven at e ¼ 5�6%. However, the curved struts with S-shapeload-strain curves (samples B to E in Fig. 7) do not contributeeffectively since the strain of 5�6% is not sufficient for themto raise Young’s modulus. Namely there coexist effective andineffective struts and only the effective struts contribute toYoung’s modulus of foams at e ¼ 5�6%. (B) It is notedagain that, though the number of failed struts at e ¼ 5�6% issmall in comparison with the total number of struts, thefailure of struts enhances the strain concentration on theneighboring struts and causes successive failure nearly in alimited cross-section beyond e ¼ 5�6%.14) Such a succes-sive failure reduces seriously the cross-sectional area ofligament in the failing cross-section and therefore the stresscarrying capacity of foams. Accordingly, even though moststruts can exhibit high Young’s modulus when stretched up tohigher strain, the struts in the failing cross-section cannotcontribute to the increase in Young’s modulus of foams dueto the more reduced ligament cross-sectional area. Also as thestress level is reduced in comparison with that at e ¼ 5�6%,the struts outside the failing cross-sectional area cannot bestrained more than 5�6%. Therefore, they cannot exhibithigh Young’s modulus. In this way, the failure of struts actsas a trigger for the suppression of increase in Young’smodulus of foams.
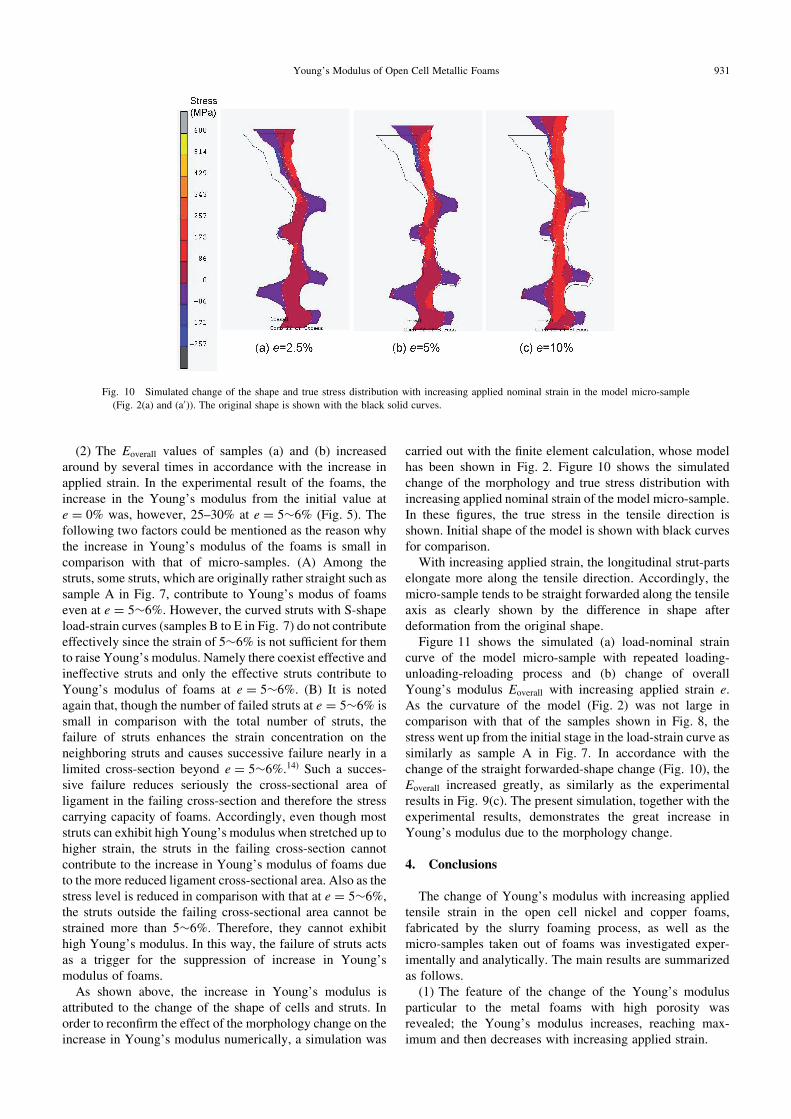
As shown above, the increase in Young’s modulus isattributed to the change of the shape of cells and struts. Inorder to reconfirm the effect of the morphology change on theincrease in Young’s modulus numerically, a simulation was
carried out with the finite element calculation, whose modelhas been shown in Fig. 2. Figure 10 shows the simulatedchange of the morphology and true stress distribution withincreasing applied nominal strain of the model micro-sample.In these figures, the true stress in the tensile direction isshown. Initial shape of the model is shown with black curvesfor comparison.
With increasing applied strain, the longitudinal strut-partselongate more along the tensile direction. Accordingly, themicro-sample tends to be straight forwarded along the tensileaxis as clearly shown by the difference in shape afterdeformation from the original shape.
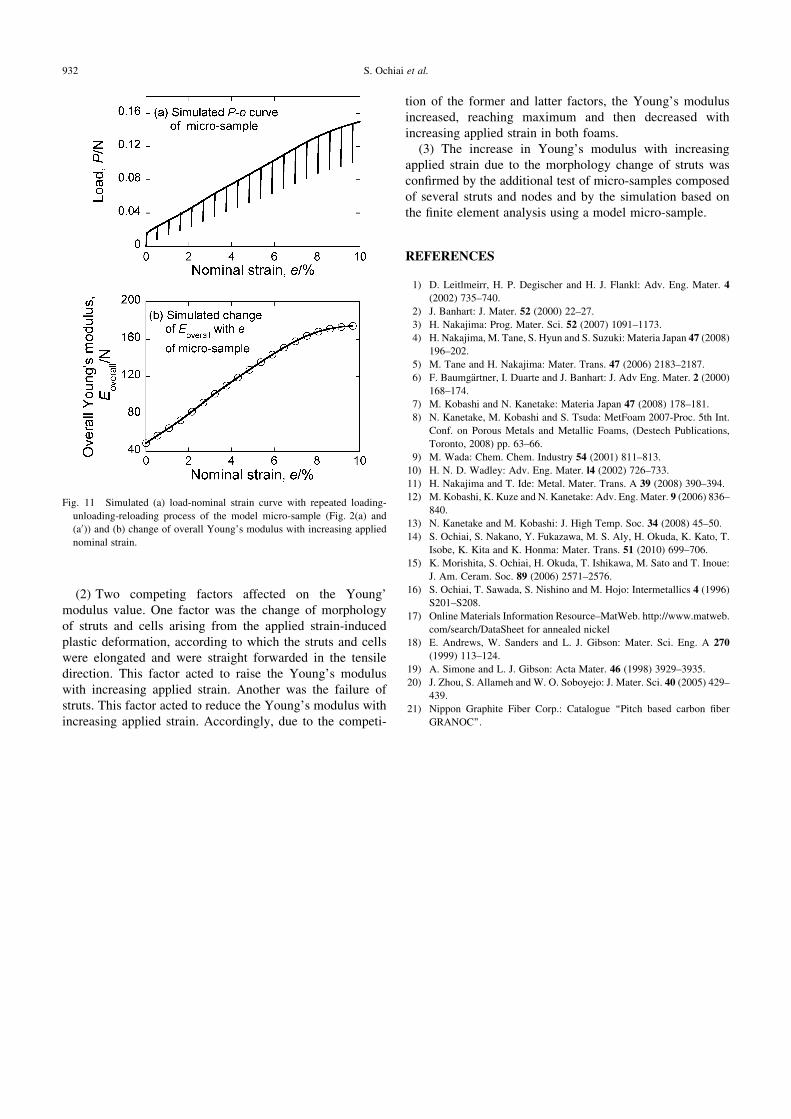
Figure 11 shows the simulated (a) load-nominal straincurve of the model micro-sample with repeated loading-unloading-reloading process and (b) change of overallYoung’s modulus Eoverall with increasing applied strain e.As the curvature of the model (Fig. 2) was not large incomparison with that of the samples shown in Fig. 8, thestress went up from the initial stage in the load-strain curve assimilarly as sample A in Fig. 7. In accordance with thechange of the straight forwarded-shape change (Fig. 10), theEoverall increased greatly, as similarly as the experimentalresults in Fig. 9(c). The present simulation, together with theexperimental results, demonstrates the great increase inYoung’s modulus due to the morphology change.
4. Conclusions
The change of Young’s modulus with increasing appliedtensile strain in the open cell nickel and copper foams,fabricated by the slurry foaming process, as well as themicro-samples taken out of foams was investigated exper-imentally and analytically. The main results are summarizedas follows.
(1) The feature of the change of the Young’s modulusparticular to the metal foams with high porosity wasrevealed; the Young’s modulus increases, reaching max-imum and then decreases with increasing applied strain.
Fig. 10 Simulated change of the shape and true stress distribution with increasing applied nominal strain in the model micro-sample
(Fig. 2(a) and (a0)). The original shape is shown with the black solid curves.
Young’s Modulus of Open Cell Metallic Foams 931
(2) Two competing factors affected on the Young’modulus value. One factor was the change of morphologyof struts and cells arising from the applied strain-inducedplastic deformation, according to which the struts and cellswere elongated and were straight forwarded in the tensiledirection. This factor acted to raise the Young’s moduluswith increasing applied strain. Another was the failure ofstruts. This factor acted to reduce the Young’s modulus withincreasing applied strain. Accordingly, due to the competi-
tion of the former and latter factors, the Young’s modulusincreased, reaching maximum and then decreased withincreasing applied strain in both foams.
(3) The increase in Young’s modulus with increasingapplied strain due to the morphology change of struts wasconfirmed by the additional test of micro-samples composedof several struts and nodes and by the simulation based onthe finite element analysis using a model micro-sample.
REFERENCES
1) D. Leitlmeirr, H. P. Degischer and H. J. Flankl: Adv. Eng. Mater. 4
(2002) 735–740.
2) J. Banhart: J. Mater. 52 (2000) 22–27.
3) H. Nakajima: Prog. Mater. Sci. 52 (2007) 1091–1173.
4) H. Nakajima, M. Tane, S. Hyun and S. Suzuki: Materia Japan 47 (2008)
196–202.
5) M. Tane and H. Nakajima: Mater. Trans. 47 (2006) 2183–2187.
6) F. Baumgartner, I. Duarte and J. Banhart: J. Adv Eng. Mater. 2 (2000)
168–174.
7) M. Kobashi and N. Kanetake: Materia Japan 47 (2008) 178–181.
8) N. Kanetake, M. Kobashi and S. Tsuda: MetFoam 2007-Proc. 5th Int.
Conf. on Porous Metals and Metallic Foams, (Destech Publications,
Toronto, 2008) pp. 63–66.
9) M. Wada: Chem. Chem. Industry 54 (2001) 811–813.
10) H. N. D. Wadley: Adv. Eng. Mater. l4 (2002) 726–733.
11) H. Nakajima and T. Ide: Metal. Mater. Trans. A 39 (2008) 390–394.
12) M. Kobashi, K. Kuze and N. Kanetake: Adv. Eng. Mater. 9 (2006) 836–
840.
13) N. Kanetake and M. Kobashi: J. High Temp. Soc. 34 (2008) 45–50.
14) S. Ochiai, S. Nakano, Y. Fukazawa, M. S. Aly, H. Okuda, K. Kato, T.
Isobe, K. Kita and K. Honma: Mater. Trans. 51 (2010) 699–706.
15) K. Morishita, S. Ochiai, H. Okuda, T. Ishikawa, M. Sato and T. Inoue:
J. Am. Ceram. Soc. 89 (2006) 2571–2576.
16) S. Ochiai, T. Sawada, S. Nishino and M. Hojo: Intermetallics 4 (1996)
S201–S208.
17) Online Materials Information Resource–MatWeb. http://www.matweb.
com/search/DataSheet for annealed nickel
18) E. Andrews, W. Sanders and L. J. Gibson: Mater. Sci. Eng. A 270
(1999) 113–124.
19) A. Simone and L. J. Gibson: Acta Mater. 46 (1998) 3929–3935.
20) J. Zhou, S. Allameh and W. O. Soboyejo: J. Mater. Sci. 40 (2005) 429–
439.
21) Nippon Graphite Fiber Corp.: Catalogue ‘‘Pitch based carbon fiber
GRANOC’’.
Fig. 11 Simulated (a) load-nominal strain curve with repeated loading-
unloading-reloading process of the model micro-sample (Fig. 2(a) and
(a0)) and (b) change of overall Young’s modulus with increasing applied
nominal strain.
932 S. Ochiai et al.