Embed Size (px)
DESCRIPTION
FOCRAII, Beijing, 8 April 2013. Changes in global and regional monsoon precipitation projected by CMIP5 models. Akio Kitoh. Kitoh, A., H. Endo, K. Krishna Kumar, I.F.A. Cavalcanti , P. Goswami , T. Zhou, 2013: Monsoons in a changing world: a regional perspective in a global context. - PowerPoint PPT Presentation
Citation preview
Changes in global and regional monsoon precipitation projected by CMIP5 models
Akio Kitoh
Kitoh, A., H. Endo, K. Krishna Kumar, I.F.A. Cavalcanti, P. Goswami, T. Zhou, 2013: Monsoons in a changing world: a regional perspective in a global context. J. Geophys. Res., 118, doi:10.1002/jgrd.50258.
1
FOCRAII, Beijing, 8 April 2013
Introduction
• Provides a latest view of global and regional monsoonal rainfall changes as projected by CMIP5 multi-models.
• Investigates not only mean precipitation but also some
precipitation extreme indices and monsoon seasonality.
2
Monsoons are responsible for the majority of summer rainfall within the tropics, where billions of people depend on the monsoon rainfall. Thus, reliable future projection for monsoon rainfall, especially on a regional-scale, has been strongly demanded.
3
Previous studies of the global monsoon Historical records
• Decreasing trend in the global land monsoon precipitation over the last half of the 20th century.
Wand and Ding (2006); Zhou et al. (2008)• Increasing trend in the combined (oceanic and land)
monsoon precipitation for recent decades (1979-2008)Wang et al. (2012)
Future projections• Increase of global monsoon area and precipitation
intensity. CMIP3: Hsu et al. (2012) CMIP5: Lee and Wang (2012). Hsu et al. (2013)
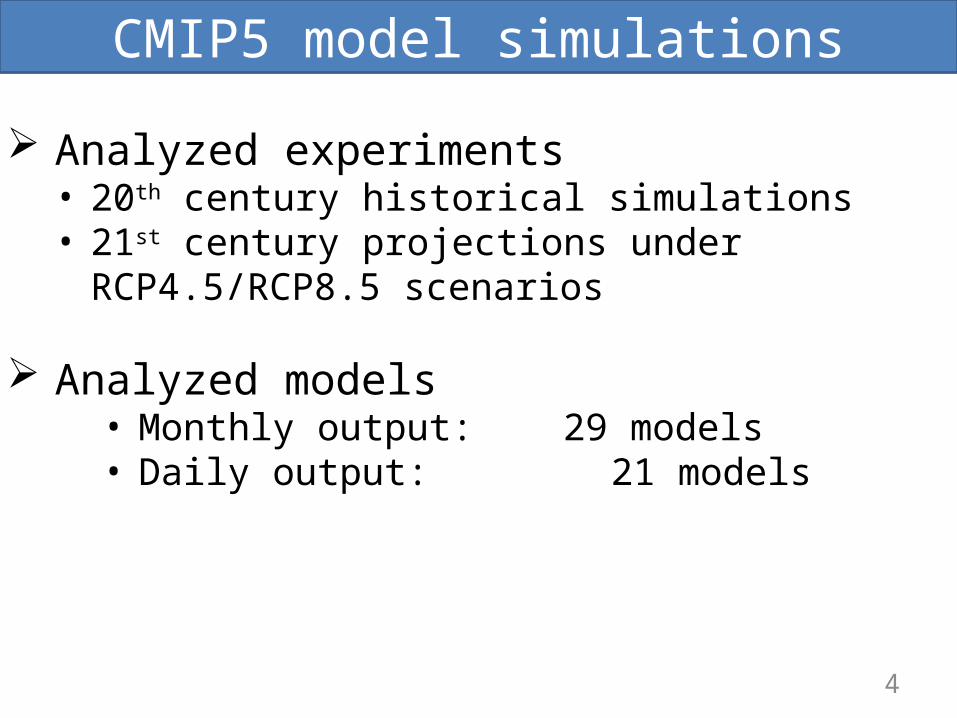
CMIP5 model simulations
Analyzed experiments• 20th century historical simulations • 21st century projections under RCP4.5/RCP8.5 scenarios
Analyzed models• Monthly output: 29 models• Daily output: 21 models
4
5
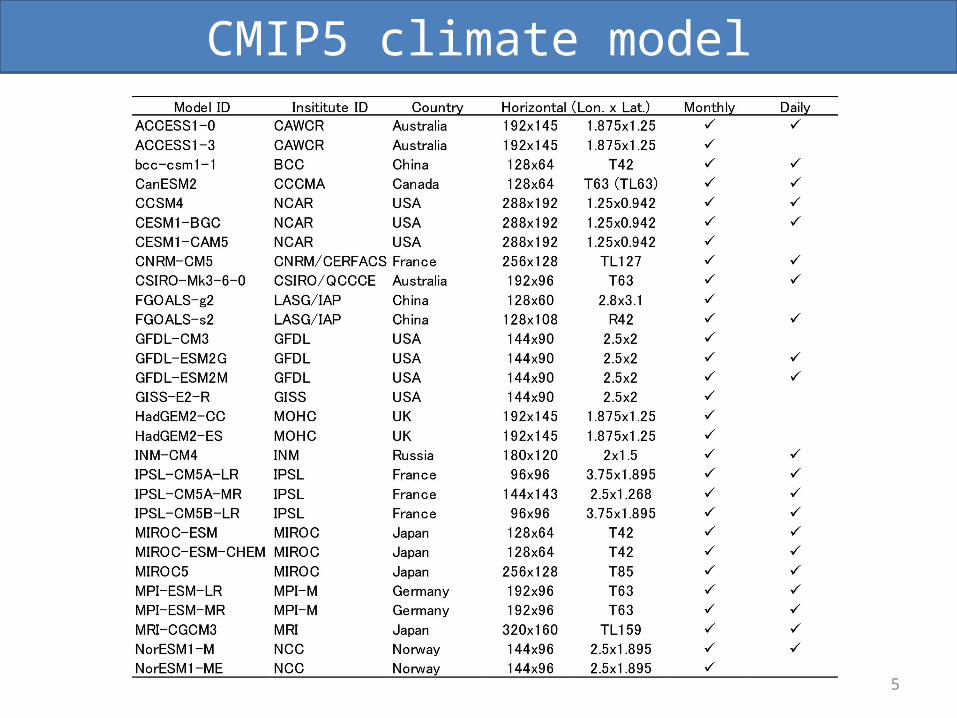
CMIP5 climate model
Global monsoon
Present-day: 1986-2005Future: 2080-2099
6
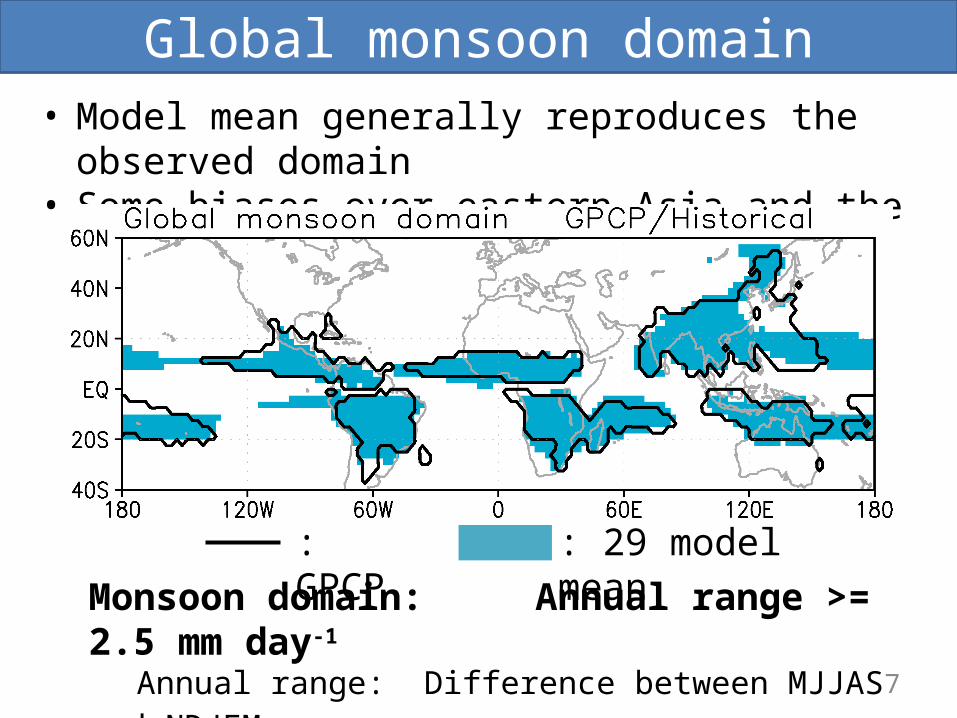
Global monsoon domain• Model mean generally reproduces the observed domain• Some biases over eastern Asia and the tropical Pacific
: GPCPMonsoon domain: Annual range >= 2.5 mm day-1
Annual range: Difference between MJJAS and NDJFM (Wang et al., 2011) 7
: 29 model mean
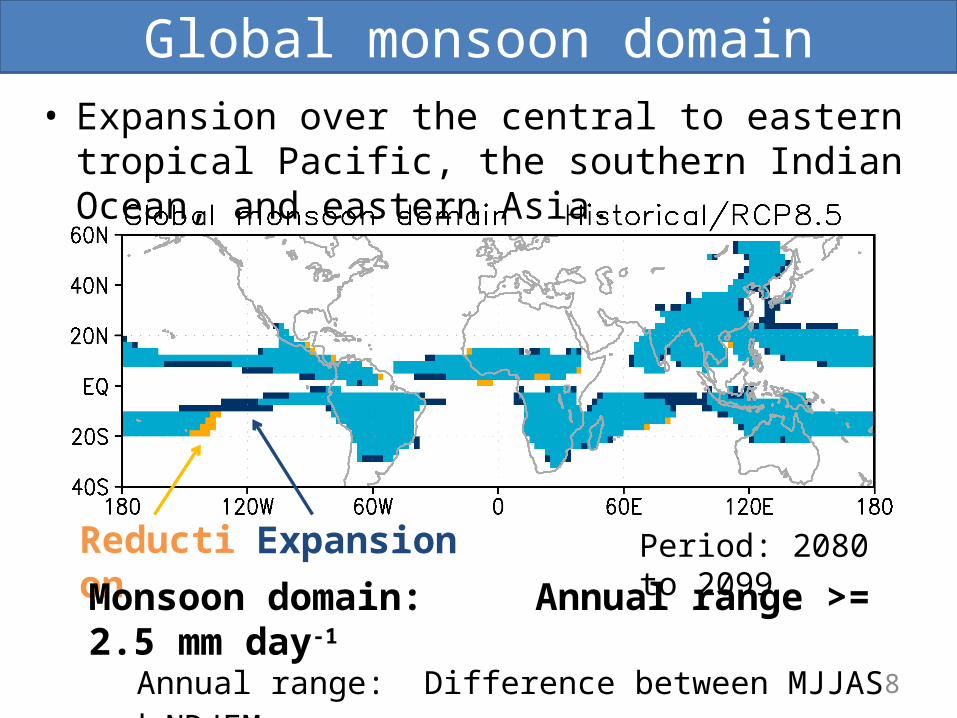
Period: 2080 to 2099Reduction ExpansionMonsoon domain: Annual range >= 2.5 mm day-1
Annual range: Difference between MJJAS and NDJFM (Wang et al., 2011)
Global monsoon domain
8
• Expansion over the central to eastern tropical Pacific, the southern Indian Ocean, and eastern Asia.
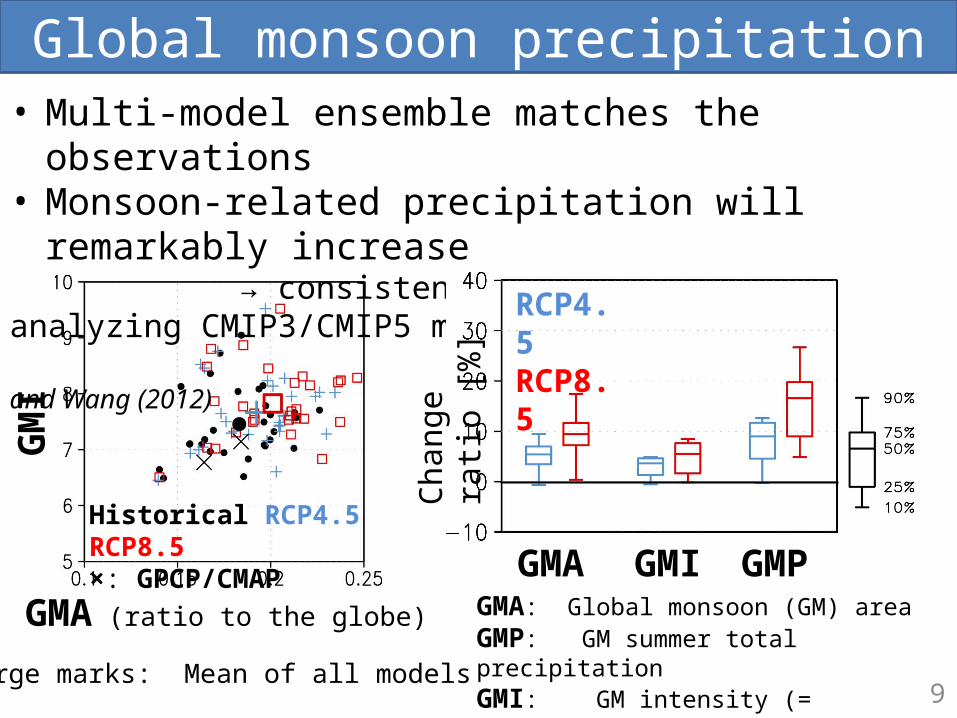
Global monsoon precipitation
GMA (ratio to the globe)
GMI
• Multi-model ensemble matches the observations• Monsoon-related precipitation will remarkably increase → consistent with other studies analyzing CMIP3/CMIP5 models
by Hsu et al. (2012, 2013); Lee and Wang (2012)
Chan
ge ra
tio [%
] RCP4.5 RCP8.5
GMA GMI GMPHistorical RCP4.5 RCP8.5×: GPCP/CMAP
GMA: Global monsoon (GM) areaGMP: GM summer total precipitationGMI: GM intensity (= GMP/GMA)Large marks: Mean of all models
9
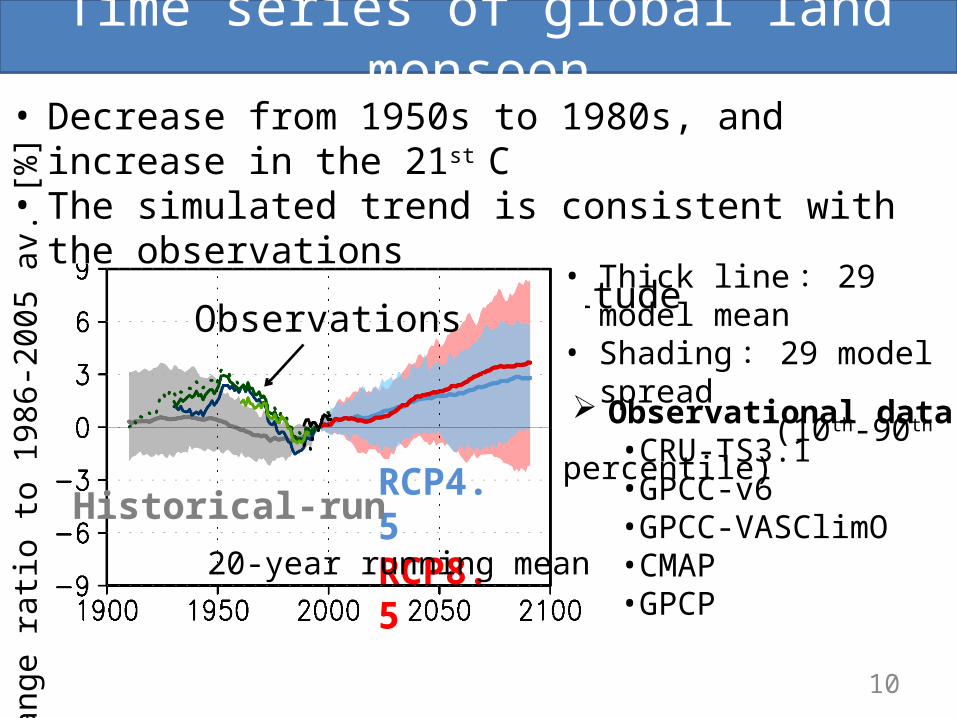
Time series of global land monsoon• Decrease from 1950s to 1980s, and increase in the 21st C• The simulated trend is consistent with the observations but with less amplitude
RCP4.5RCP8.5
• Thick line : 29 model mean
• Shading : 29 model spread
(10th-90th percentile)
Historical-run
Observations
Observational data• CRU-TS3.1• GPCC-v6• GPCC-VASClimO• CMAP• GPCP
Chan
ge ra
tio to
198
6-20
05 a
v. [%
]
20-year running mean
10
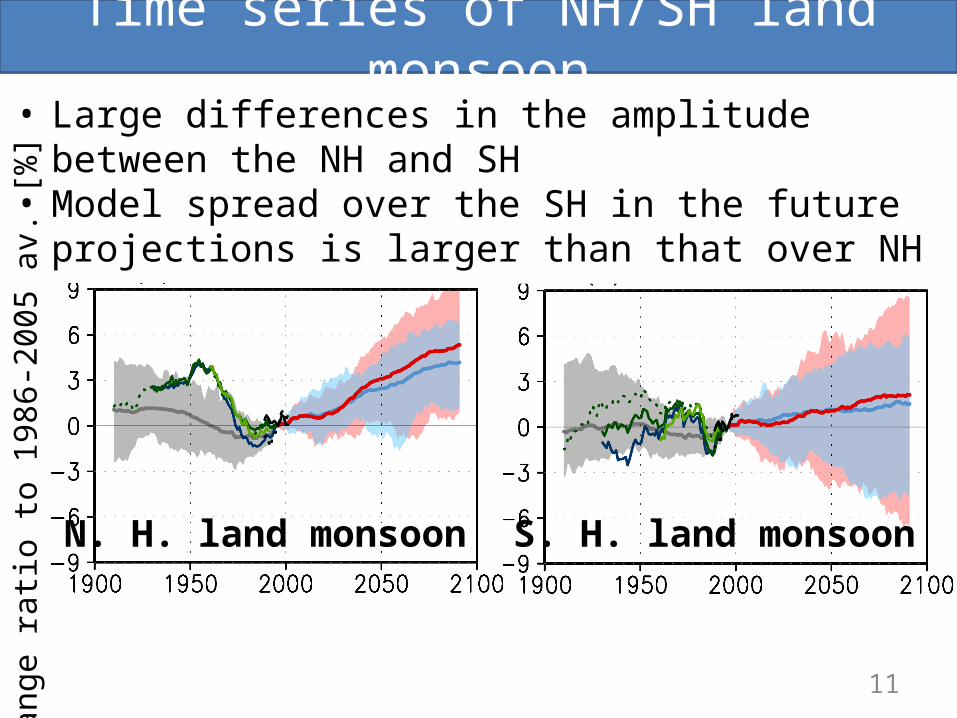
• Large differences in the amplitude between the NH and SH• Model spread over the SH in the future projections is
larger than that over NH
Time series of NH/SH land monsoon
11
Chan
ge ra
tio to
198
6-20
05 a
v. [%
]
N. H. land monsoon S. H. land monsoon
• Thick line: 14 model mean• Shading: Inter-model spread (S.D.)
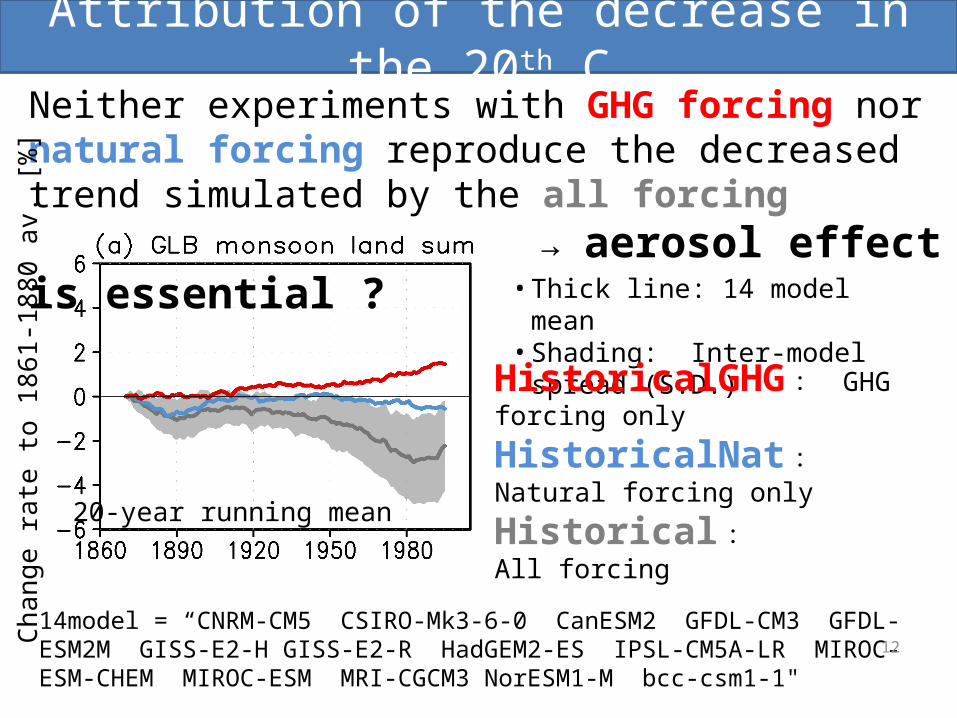
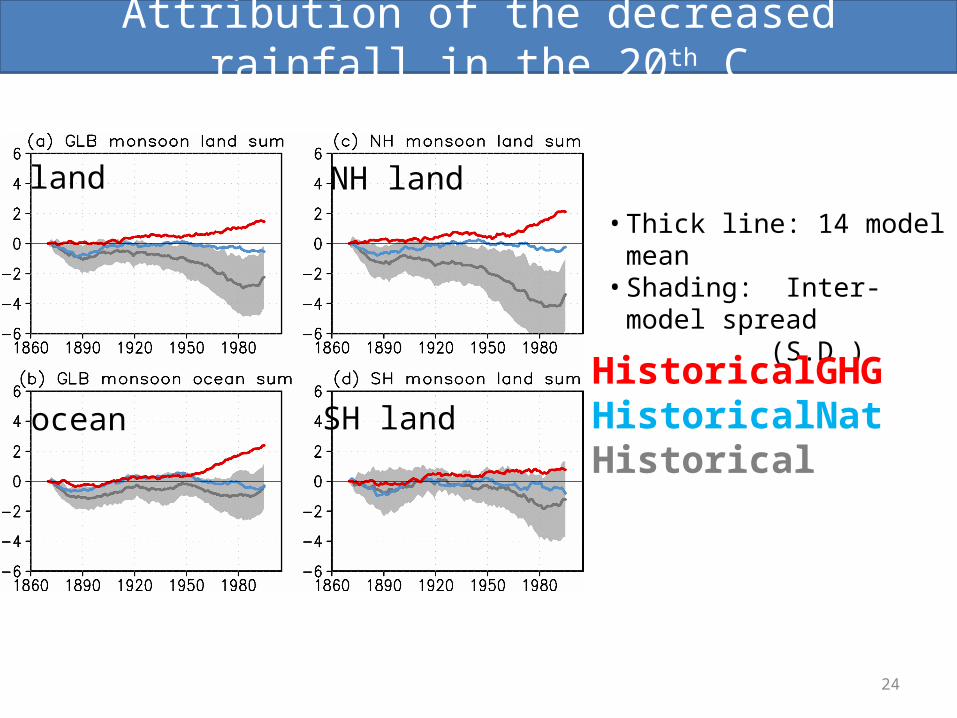
Attribution of the decrease in the 20th CNeither experiments with GHG forcing nor natural forcing reproduce the decreased trend simulated by the all forcing
→ aerosol effect is essential ?
HistoricalGHG : GHG forcing only
HistoricalNat : Natural forcing only
Historical : All forcing
14model = “CNRM-CM5 CSIRO-Mk3-6-0 CanESM2 GFDL-CM3 GFDL-ESM2M GISS-E2-H GISS-E2-R HadGEM2-ES IPSL-CM5A-LR MIROC-ESM-CHEM MIROC-ESM MRI-CGCM3 NorESM1-M bcc-csm1-1"
Chan
ge ra
te to
186
1-18
80 a
v. [%
]
20-year running mean
12
13
Attribution of the decrease in the 20th CCh
ange
rate
to 1
861-
1880
av.
[%]
N. H. land monsoon
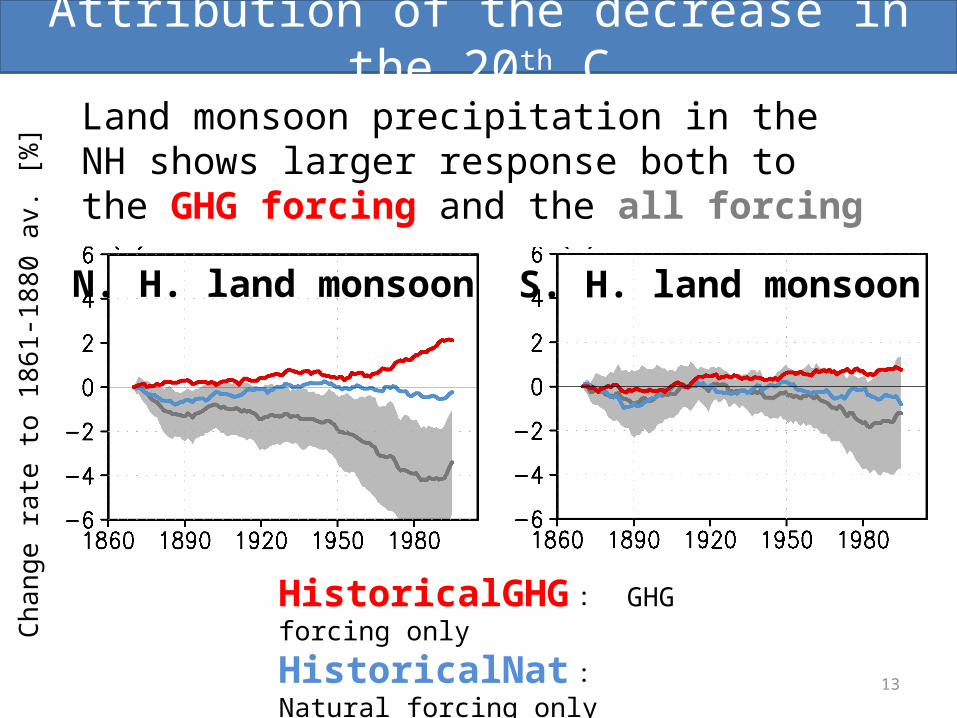
Land monsoon precipitation in the NH shows larger response both to the GHG forcing and the all forcing
HistoricalGHG : GHG forcing only
HistoricalNat : Natural forcing only
Historical : All forcing
S. H. land monsoon
Regional monsoon
Present-day: 1986-2005Future: 2080-2099
14
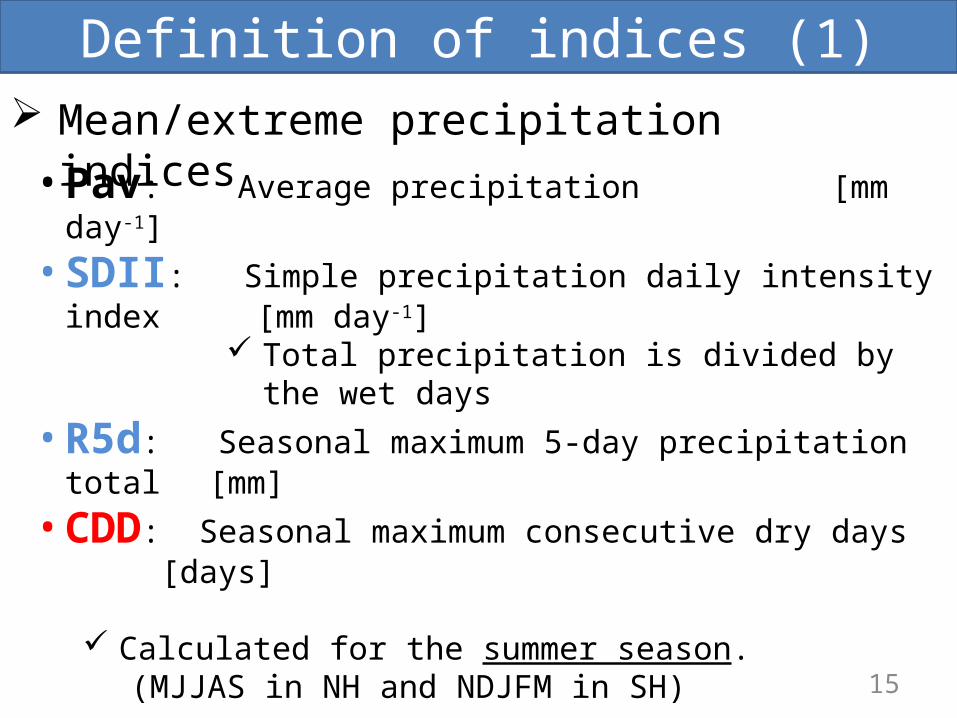
Mean/extreme precipitation indices• Pav: Average precipitation [mm day-1]• SDII: Simple precipitation daily intensity index [mm
day-1] Total precipitation is divided by the wet days
• R5d: Seasonal maximum 5-day precipitation total [mm]• CDD: Seasonal maximum consecutive dry days [days]
Calculated for the summer season. (MJJAS in NH and NDJFM in SH)
Calculated over the monsoon domain at the present-day by each model.
Definition of indices (1)
15
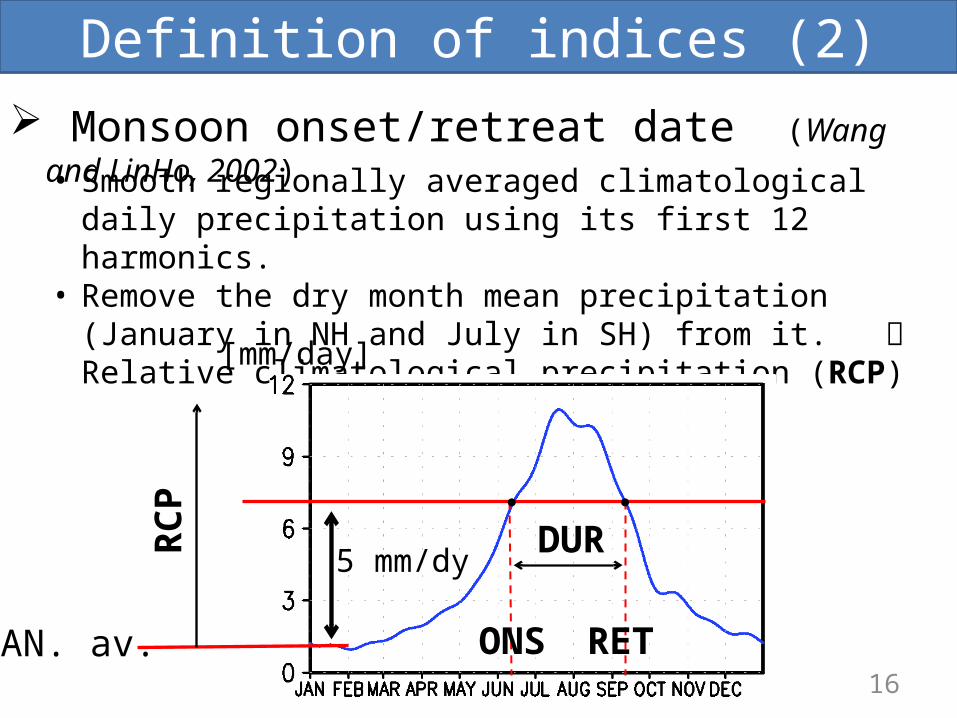
Monsoon onset/retreat date (Wang and LinHo, 2002)• Smooth regionally averaged climatological daily precipitation
using its first 12 harmonics.• Remove the dry month mean precipitation (January in NH and
July in SH) from it. Relative climatological precipitation (RCP)
Definition of indices (2)
JAN. av.
5 mm/dy
ONS RET
DURRCP ● ●
[mm/day]
16
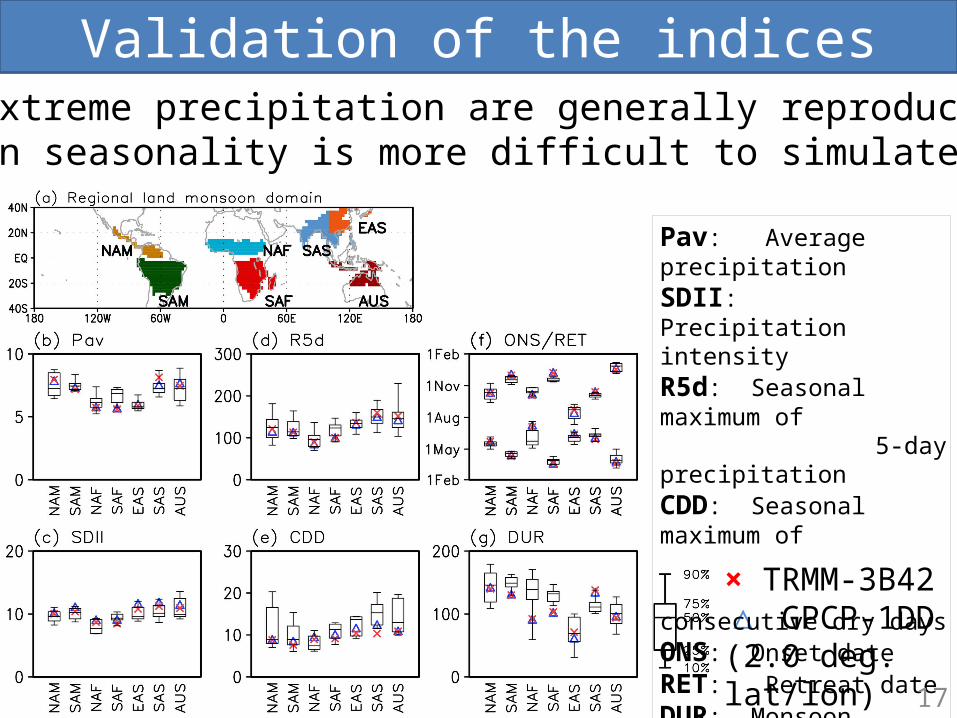
Validation of the indices• Mean/extreme precipitation are generally reproduced well• Monsoon seasonality is more difficult to simulate
× TRMM-3B42△ GPCP-1DD(2.0 deg. lat/lon)
Pav: Average precipitationSDII: Precipitation intensity R5d: Seasonal maximum of 5-day precipitationCDD: Seasonal maximum of consecutive dry daysONS: Onset dateRET: Retreat dateDUR: Monsoon duration
17
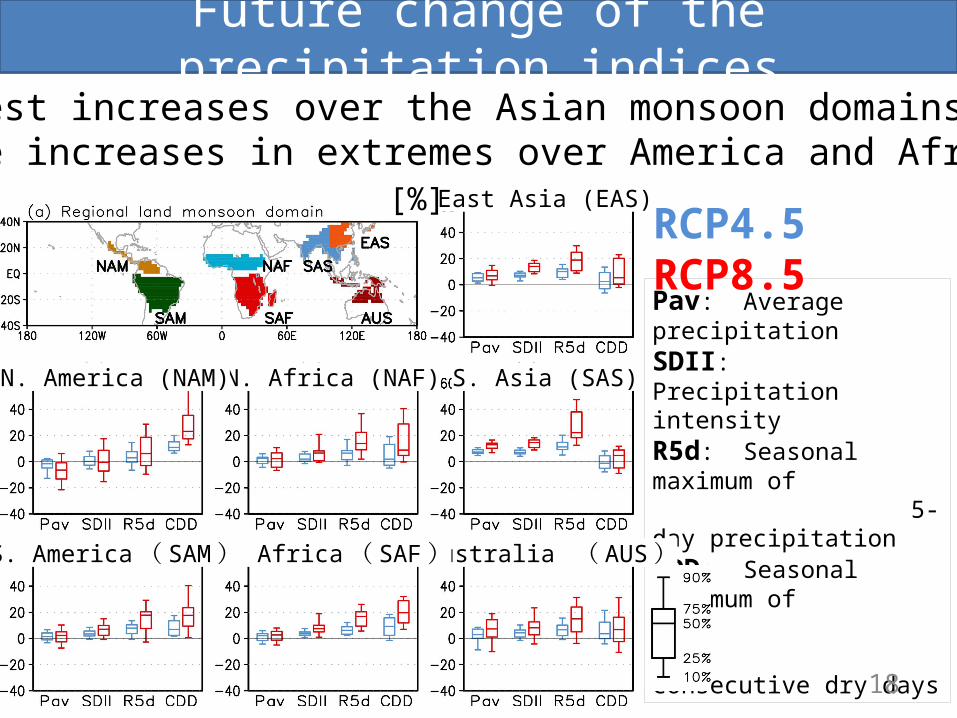
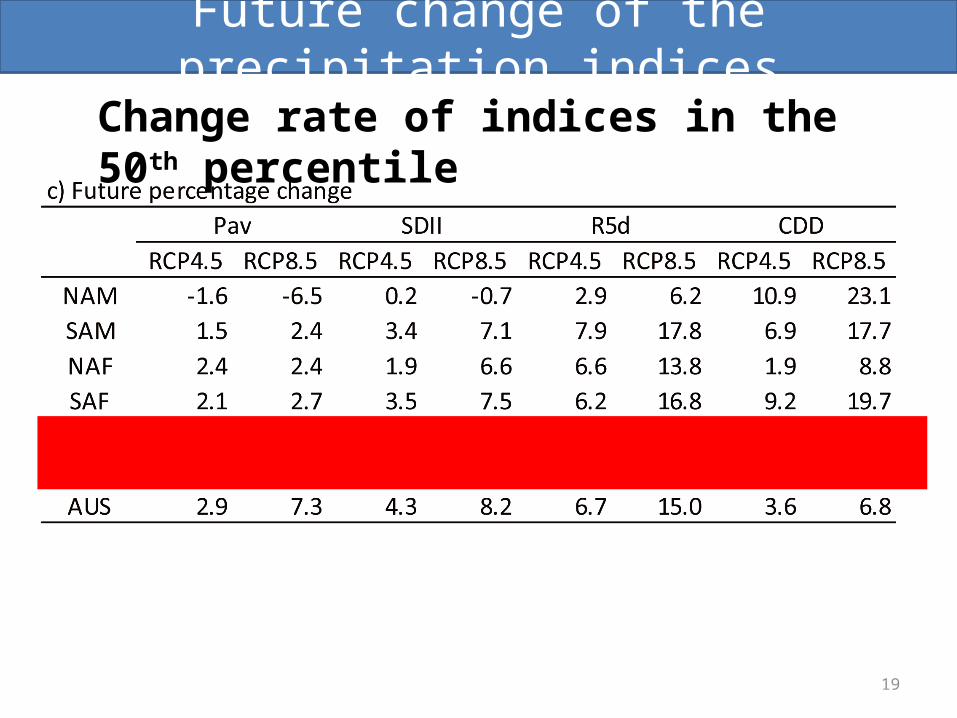
Future change of the precipitation indices• Largest increases over the Asian monsoon domains• Large increases in extremes over America and Africa
Pav: Average precipitationSDII: Precipitation intensity R5d: Seasonal maximum of 5-day precipitationCDD: Seasonal maximum of consecutive dry days
RCP4.5 RCP8.5
East Asia (EAS)
18
[%]
S. Asia (SAS)
Australia ( AUS )S. Africa ( SAF )
N. Africa (NAF)
S. America ( SAM )
N. America (NAM)
19
Change rate of indices in the 50th percentile
Future change of the precipitation indices
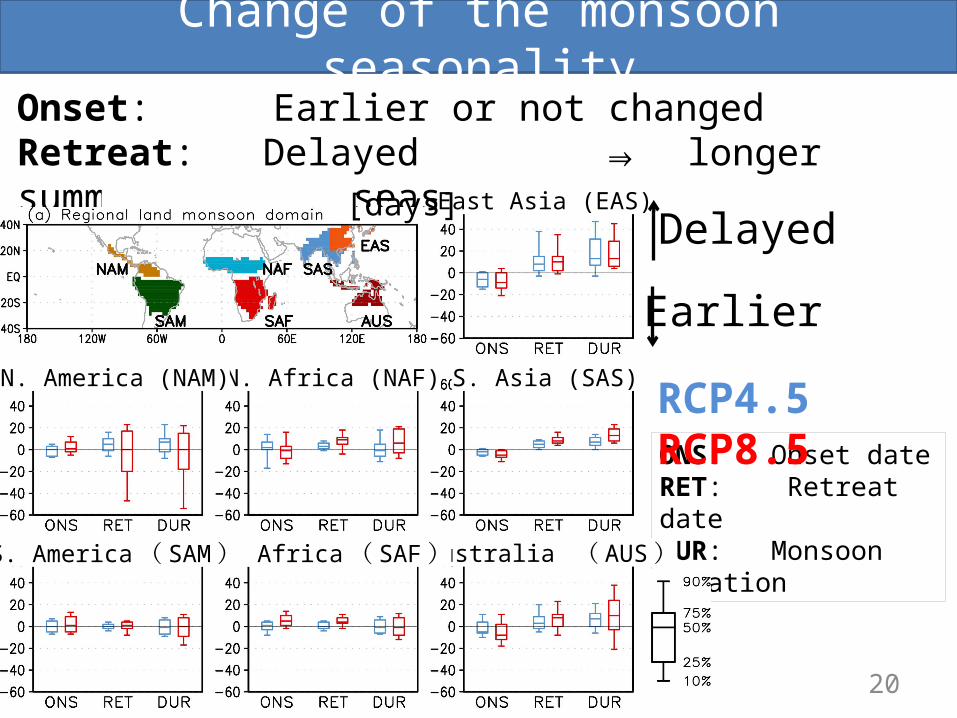
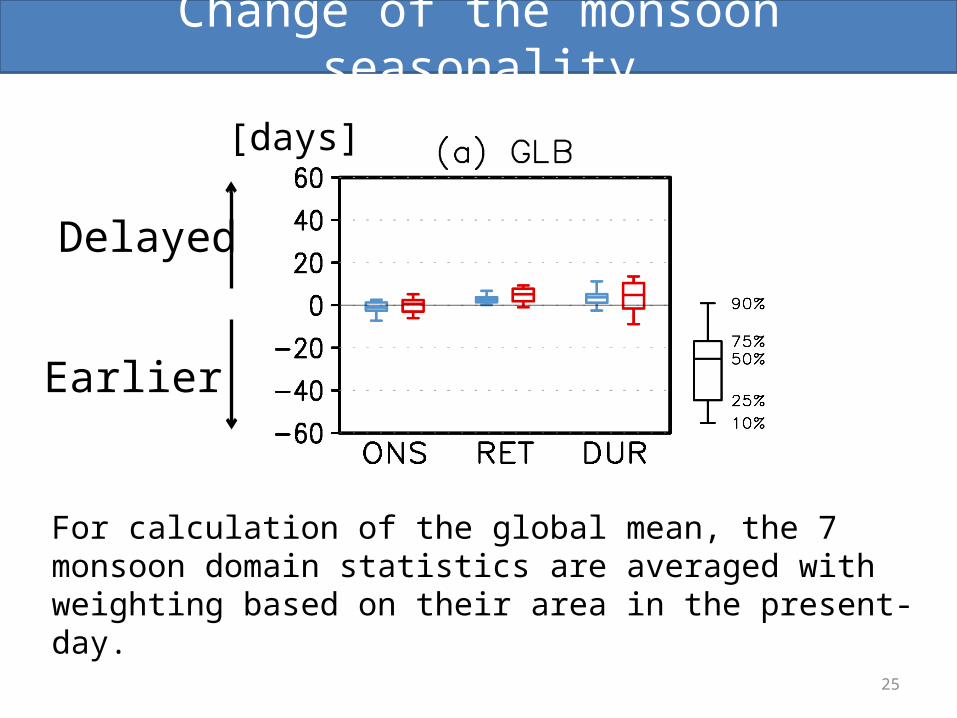
Change of the monsoon seasonalityOnset: Earlier or not changedRetreat: Delayed longer summer monsoon season⇒
ONS: Onset dateRET: Retreat dateDUR: Monsoon duration
East Asia (EAS)
S. Asia (SAS)
Australia ( AUS )S. Africa ( SAF )
N. Africa (NAF)
S. America ( SAM )
N. America (NAM) RCP4.5 RCP8.5
20
[days]Delayed
Earlier
21
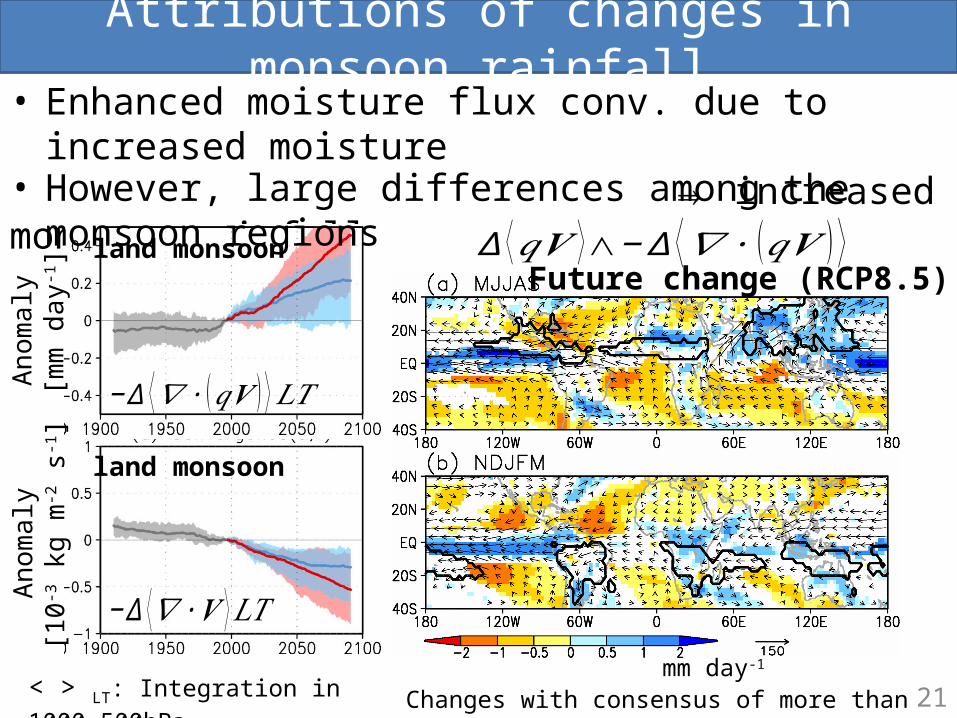
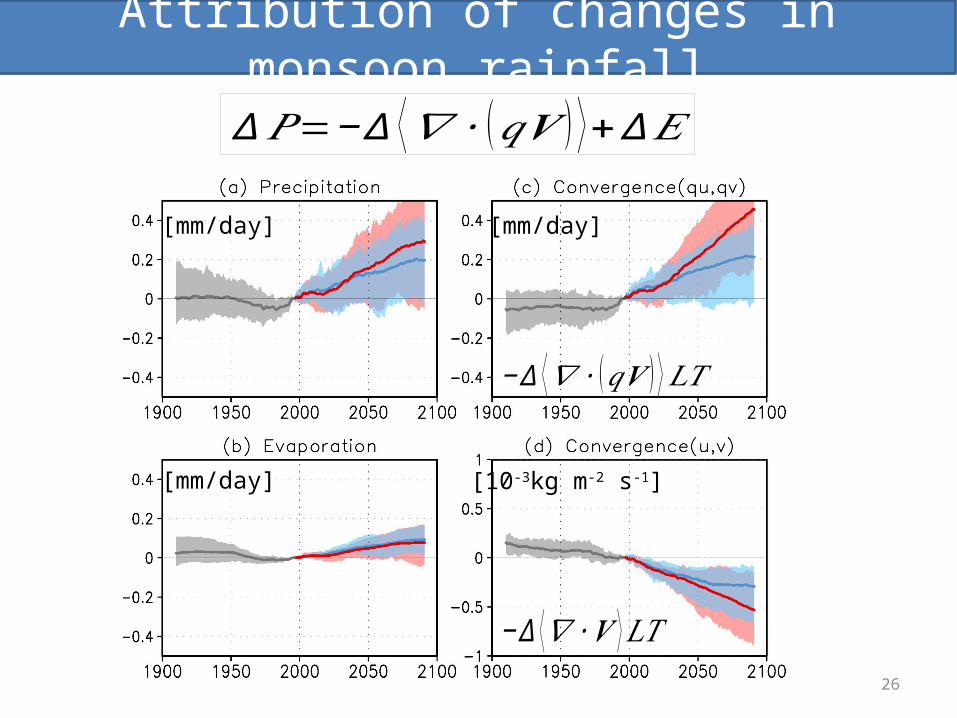
Attributions of changes in monsoon rainfall• Enhanced moisture flux conv. due to increased moisture ⇒ increased monsoon rainfall
Anom
aly
[mm
day
-1]
−∆ ⟨𝛻 ∙ (𝑞𝑽 ) ⟩𝐿𝑇
−∆ ⟨𝛻 ∙𝑽 ⟩ 𝐿𝑇
< > LT: Integration in 1000-500hPa
• However, large differences among the monsoon regions
Changes with consensus of more than 75% of models
Future change (RCP8.5)
mm day-1
∆ ⟨𝑞𝑽 ⟩∧−∆ ⟨𝛻 ∙ (𝑞𝑽 ) ⟩
Anom
aly
[10-3
kg
m-2
s-1]
land monsoon
land monsoon
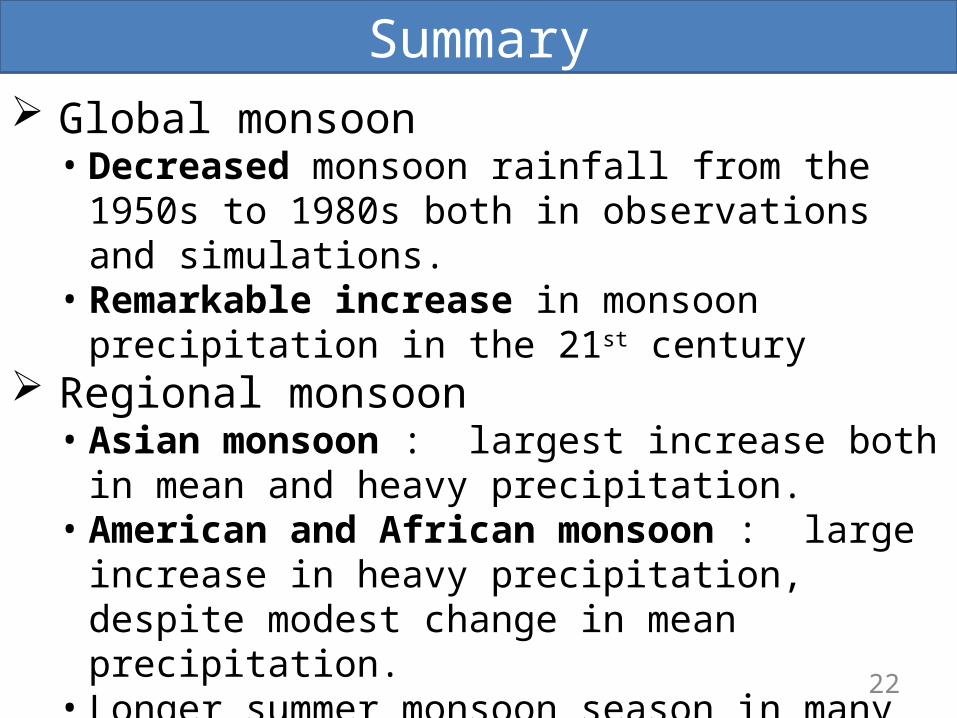
Global monsoon• Decreased monsoon rainfall from the 1950s to 1980s
both in observations and simulations.• Remarkable increase in monsoon precipitation in the
21st century Regional monsoon
• Asian monsoon : largest increase both in mean and heavy precipitation.
• American and African monsoon : large increase in heavy precipitation, despite modest change in mean precipitation.
• Longer summer monsoon season in many regions.
Summary
22
Thank you !
23
“Harerun”mascot of JMA
Reference: Kitoh, A., H. Endo, K. K. Kumar, I. F. A. Cavalcanti, P. Goswami, and T. Zhou, 2013, Monsoons in a changing world: a regional perspective in a global context. J. Geophys. Res., doi: 10.1002/jgrd.50258.
24
NH land
ocean
land• Thick line: 14 model mean• Shading: Inter-model spread
(S.D.)
HistoricalGHGHistoricalNatHistorical
SH land
Attribution of the decreased rainfall in the 20th C
25
Change of the monsoon seasonality
For calculation of the global mean, the 7 monsoon domain statistics are averaged with weighting based on their area in the present-day.
[days]
Delayed
Earlier
26
[mm/day]
[mm/day]
[mm/day]
[10-3kg m-2 s-1]
Attribution of changes in monsoon rainfall
−∆ ⟨𝛻 ∙ (𝑞𝑽 ) ⟩𝐿𝑇
−∆ ⟨𝛻 ∙𝑽 ⟩ 𝐿𝑇
∆ 𝑃=−∆ ⟨𝛻 ∙ (𝑞𝑽 ) ⟩+∆𝐸
27
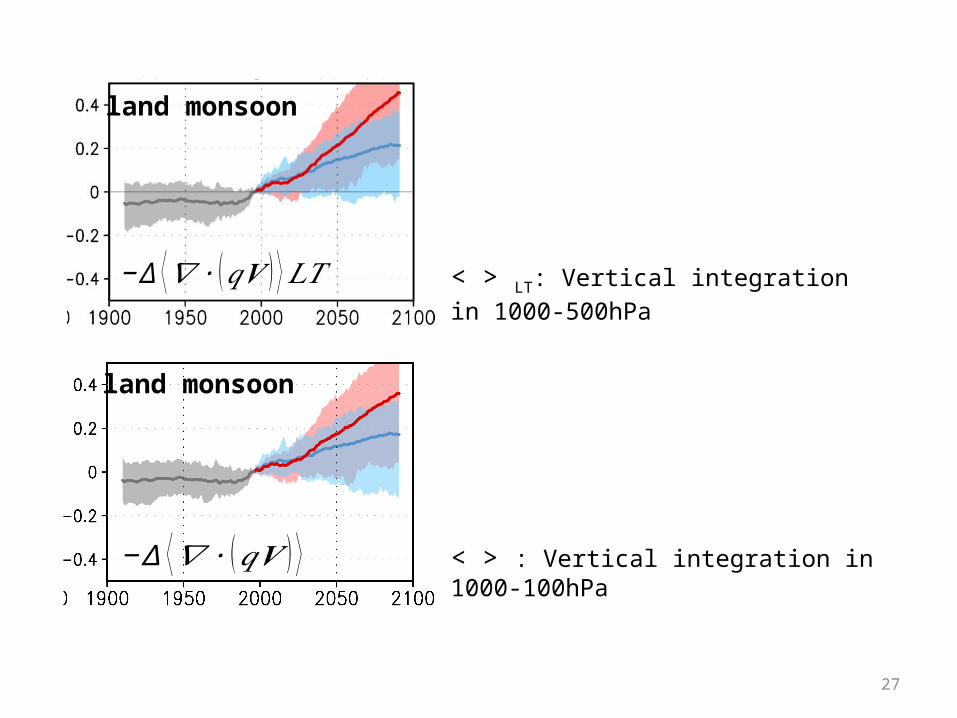
−∆ ⟨𝛻 ∙ (𝑞𝑽 ) ⟩𝐿𝑇 < > LT: Vertical integration in 1000-500hPa
−∆ ⟨𝛻 ∙ (𝑞𝑽 ) ⟩ < > : Vertical integration in 1000-100hPa
land monsoon
land monsoon
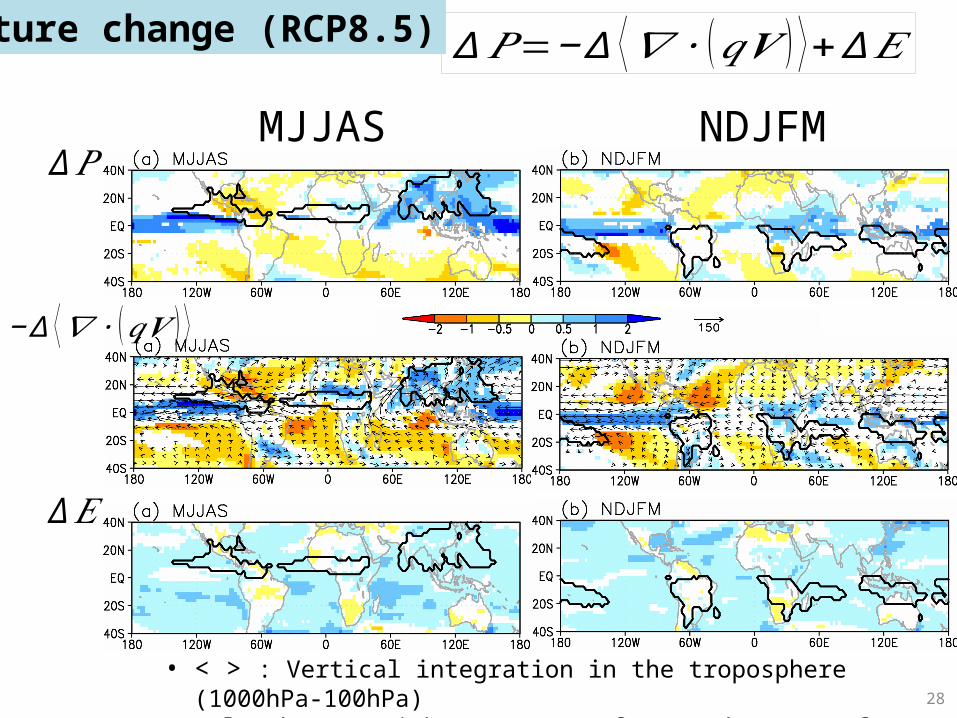
28
NDJFMMJJAS
∆ 𝑃=−∆ ⟨𝛻 ∙ (𝑞𝑽 ) ⟩+∆𝐸
∆ 𝑃
−∆ ⟨𝛻 ∙ (𝑞𝑽 ) ⟩
∆𝐸
• < > : Vertical integration in the troposphere (1000hPa-100hPa)• Only changes with consensus of more than 75% of models are shown
Future change (RCP8.5)
29
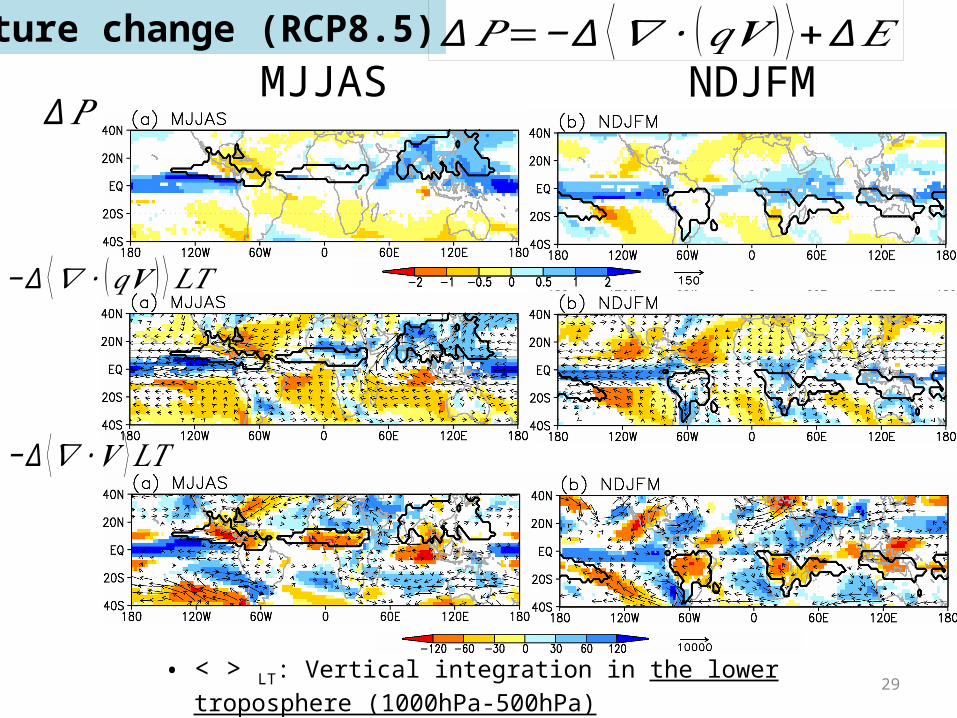
NDJFMMJJAS
• < > LT: Vertical integration in the lower troposphere (1000hPa-500hPa)• Only changes with consensus of more than 75% of models are shown
∆ 𝑃
−∆ ⟨𝛻 ∙ (𝑞𝑽 ) ⟩𝐿𝑇
−∆ ⟨𝛻 ∙𝑽 ⟩ 𝐿𝑇
Future change (RCP8.5) ∆ 𝑃=−∆ ⟨𝛻 ∙ (𝑞𝑽 ) ⟩+∆𝐸
30
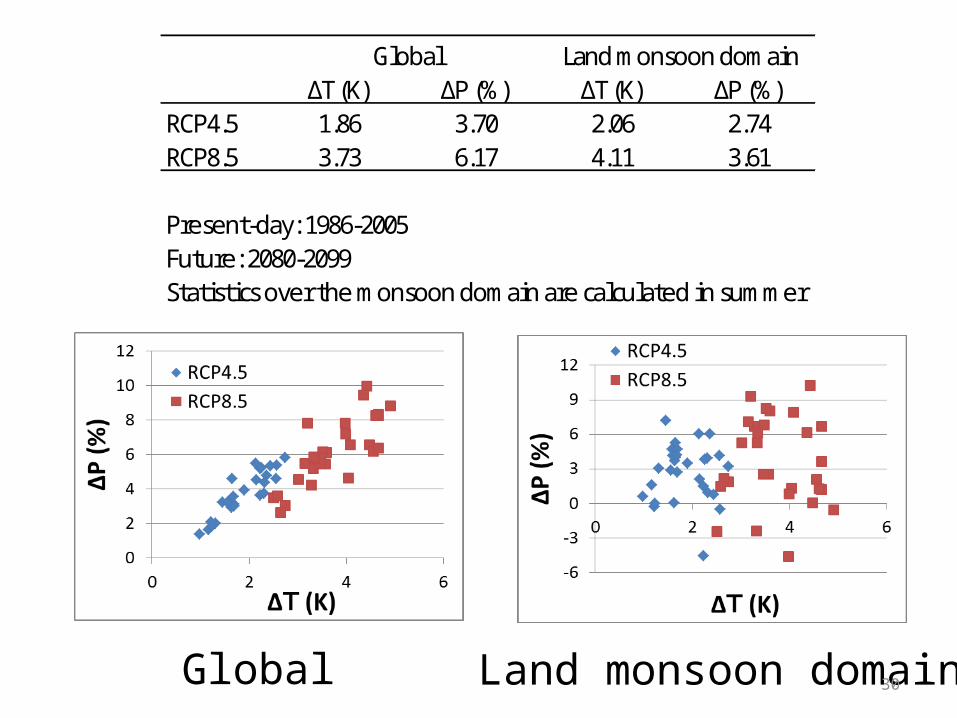
ΔT (K) ΔP (%) ΔT (K) ΔP (%)RCP4.5 1.86 3.70 2.06 2.74RCP8.5 3.73 6.17 4.11 3.61
Present-day: 1986-2005Future: 2080-2099Statistics over the monsoon domain are calculated in summer
Land monsoon domainGlobal
Global Land monsoon domain