Embed Size (px)
Citation preview
35
Chapter 2 Demographic Characteristics of the District and Metro Area ________________________________________________________________________ Page Washington DC Metropolitan Region .............................................................................................................................................................................................. 36 Washington’s People ........................................................................................................................................................................................................................ 38 Demographic Characteristics of the District ...................................................................................................................................................................................... 39
Population Change 1800-2010 ................................................................................................................................................................................................... 39 Age and Sex Composition 2010 ................................................................................................................................................................................................. 43 Dependency Ratios .................................................................................................................................................................................................................... 49
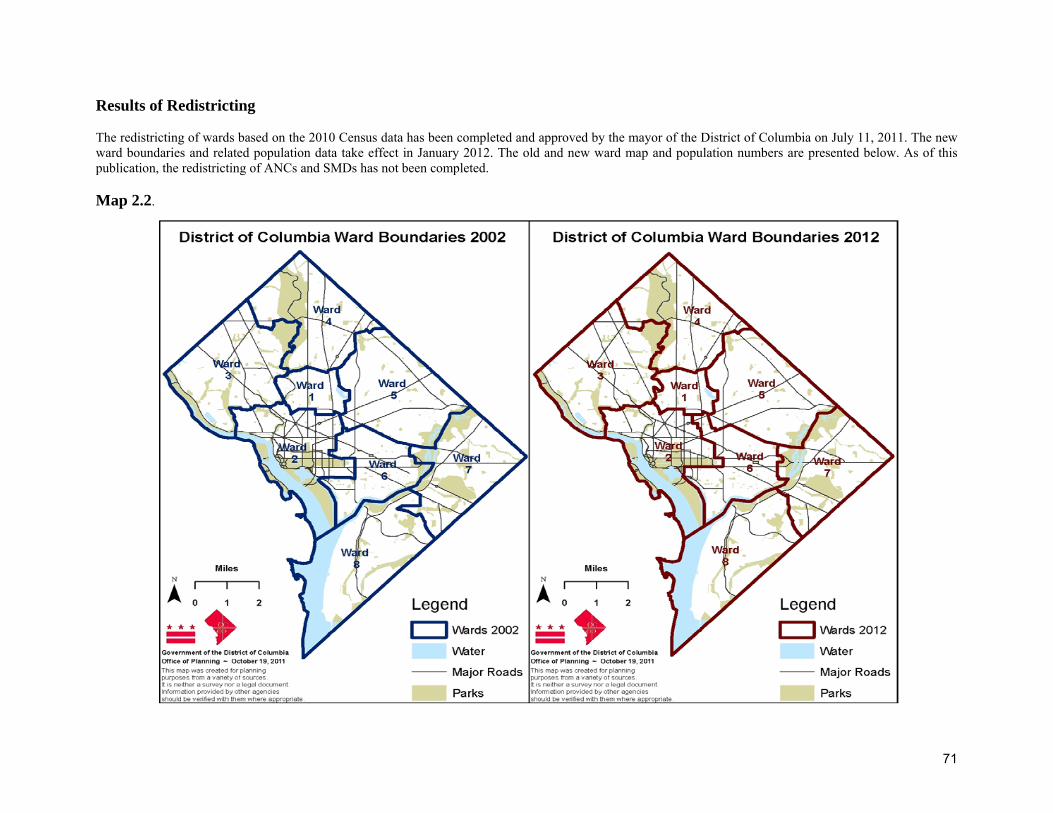
Selected Census 2010 Demographic Data ........................................................................................................................................................................................ 51 Selected 2010 American Community Survey (ACS) 1-Year Estimates ........................................................................................................................................... 64 Redistricting ...................................................................................................................................................................................................................................... 70
What is Redistricting .................................................................................................................................................................................................................. 70 Results of Redistricting 2011 ..................................................................................................................................................................................................... 71
36
Demographic Characteristics of the District and Metro Area Map 2.1. Washington DC Metro Area
The State Data Center (SDC), a division of the District of Columbia Office of Planning, is an official source of population data for the District of Columbia. The U.S. Census Bureau established the State Data Center (SDC) program in 1978 to create an effective vehicle for the dissemination of data produced by the U.S. Census Bureau to state and local governments. Under the memorandum of agreement between the U.S. Census Bureau and the District of Columbia, the District’s SDC becomes an official source of U.S. Census Bureau data. This allows the SDC access to data on an embargo basis, that is, prior to the Census Bureau’s release of data to the general public. In addition, the SDC receives U.S. Census Bureau data products, specialized training, and technical support at no cost. In return, the SDC is required to disseminate data and provide its clientele with technical assistance in locating, understanding, and operating on data from the U.S. Census Bureau and other sources.
This chapter provides a snapshot of the demographic characteristics of the District of Columbia using data provided by the U.S. Census Bureau. It also gives a brief summary of the population distribution of areas in the Washington DC Metropolitan Region.
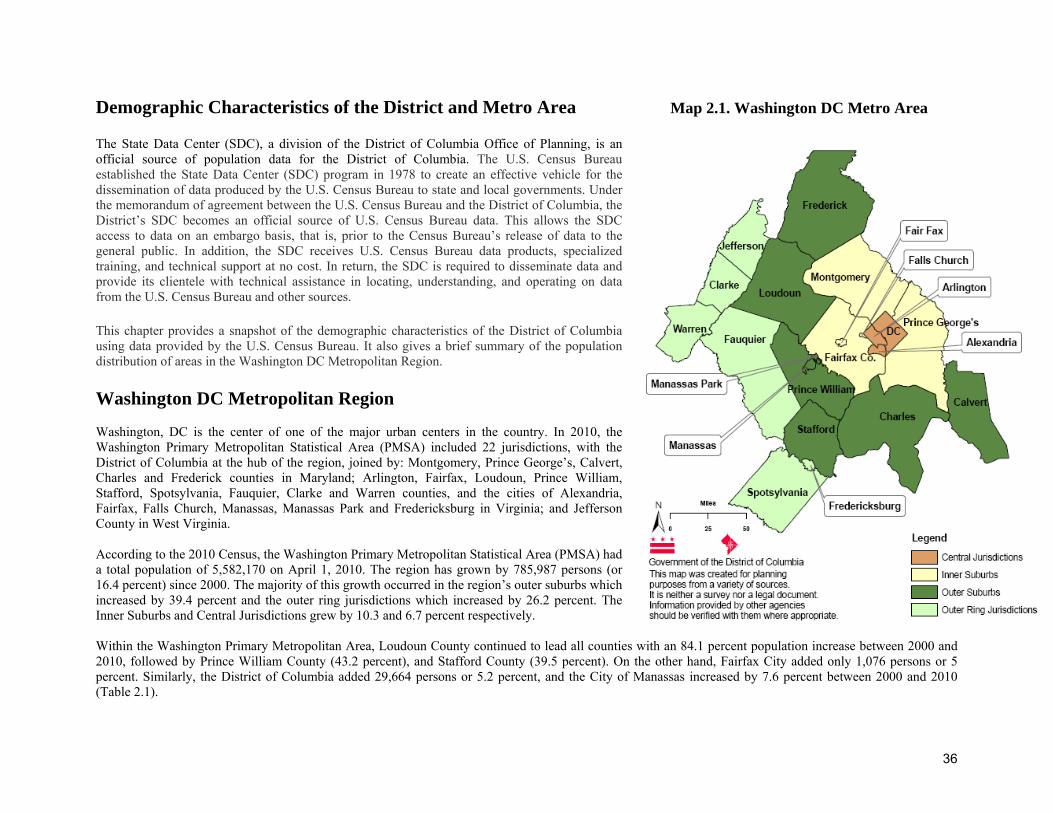
Washington DC Metropolitan Region Washington, DC is the center of one of the major urban centers in the country. In 2010, the Washington Primary Metropolitan Statistical Area (PMSA) included 22 jurisdictions, with the District of Columbia at the hub of the region, joined by: Montgomery, Prince George’s, Calvert, Charles and Frederick counties in Maryland; Arlington, Fairfax, Loudoun, Prince William, Stafford, Spotsylvania, Fauquier, Clarke and Warren counties, and the cities of Alexandria, Fairfax, Falls Church, Manassas, Manassas Park and Fredericksburg in Virginia; and Jefferson County in West Virginia. According to the 2010 Census, the Washington Primary Metropolitan Statistical Area (PMSA) had a total population of 5,582,170 on April 1, 2010. The region has grown by 785,987 persons (or 16.4 percent) since 2000. The majority of this growth occurred in the region’s outer suburbs which increased by 39.4 percent and the outer ring jurisdictions which increased by 26.2 percent. The Inner Suburbs and Central Jurisdictions grew by 10.3 and 6.7 percent respectively. Within the Washington Primary Metropolitan Area, Loudoun County continued to lead all counties with an 84.1 percent population increase between 2000 and 2010, followed by Prince William County (43.2 percent), and Stafford County (39.5 percent). On the other hand, Fairfax City added only 1,076 persons or 5 percent. Similarly, the District of Columbia added 29,664 persons or 5.2 percent, and the City of Manassas increased by 7.6 percent between 2000 and 2010 (Table 2.1).
37
Table 2.1. Population for Washington Primary Metropolitan Statistical Area (PMSA): 2000 and 2010
Jurisdictions 2010 2000 Change, 2000 to 2010
Number Number Number Percent .District of Columbia 601,723 572,059 29,664 5.2 .Arlington County 207,627 189,453 18,174 9.6 .Alexandria City 139,966 128,283 11,683 9.1 Central Jurisdictions 949,316 889,795 59,521 6.7 .Montgomery County 971,777 873,341 98,436 11.3 .Prince George's County 863,420 801,515 61,905 7.7 .Fairfax County 1,081,726 969,749 111,977 11.5 .Fairfax City 22,565 21,498 1,067 5.0 .Falls Church City 12,332 10,377 1,955 18.8 Inner Suburbs 2,951,820 2,676,480 275,340 10.3 .Loudoun County 312,311 169,599 142,712 84.1 .Prince William County 402,002 280,813 121,189 43.2 .Manassas City 37,821 35,135 2,686 7.6 .Manassas Park City 14,273 10,290 3,983 38.7 .Stafford County 128,961 92,446 36,515 39.5 .Frederick County 233,385 195,277 38,108 19.5 .Charles County 146,551 120,546 26,005 21.6 .Calvert County 88,737 74,563 14,174 19.0 Outer Suburbs 1,364,041 978,669 385,372 39.4 .Fredericksburg City 24,286 19,279 5,007 26.0 .Spotsylvania County 122,397 90,395 32,002 35.4 .Fauquier County 65,203 55,139 10,064 18.3 .Clarke County 14,034 12,652 1,382 10.9 .Warren County 37,575 31,584 5,991 19.0 .Jefferson County 53,498 42,190 11,308 26.8 Outer Ring Jurisdictions 316,993 251,239 65,754 26.2
Total 5,582,170 4,796,183 785,987 16.4 Source: U.S Census Bureau, Census 2000 and Census 2010
38
Washington’s People In 2010, the U.S. Census Bureau counted 601,723 residents in the District of Columbia. According to the 2010 Census, the population distribution of Washington, DC is 50.7 percent Black or African American, 38.5 percent white, 3.5 percent Asian, 0.3 percent American Indian and Alaska Native, 0.1 percent Native Hawaiian and Pacific Islander, 4.1 percent some other race, and 2.9 percent individuals from two or more races. Hispanics or Latinos made up 9.1 percent of the District’s population in 2010. Blacks or African Americans. African Americans are the largest racial group in the District and represent a majority in four of the District’s eight Wards (Ward 4, Ward 5, Ward 7, and Ward 8). In 2010, they comprised 50.7 percent of the total population, down from 60 percent reported in 2000. For Black residents in the District, both the highest number and percentage of people were recorded in the 1970 Census when the Black population peaked at 537,712, accounting for 71.1 percent of the District’s population. After the 1970 Census, the Black population in the District showed continuous decline. Whites. Whites are the second largest racial group in the District and represent a majority in four of the District’s eight Wards (Ward 1, Ward 2, Ward 3, and Ward 6). In 2010, they accounted for 38.5 percent of the District’s total population, an increase from 30.8 percent reported in 2000. Whites were the majority population in 1950, peaking at 517,865 people or 64.5 percent of the total population, but declined since then. Asians and Pacific Islanders. In 2000, there were 15,189 Asians and 348 Native Hawaiians and Other Pacific Islanders residing in the District. In 2010, Asians accounted for 21,056 people or 3.5 percent of the District’s population, and Native Hawaiian and Other Pacific Islanders comprised 302 people or 0.1 percent of the District’s total population. The Office of Asian and Pacific Islander Affairs (OAPIA) was re-established in January 1992 to assist this group of residents, which is comprised of 12 major ethnic groups who speak over 40 different languages. Hispanics or Latinos. Hispanics or Latinos can be of any race. The District’s Hispanic or Latino population grew by 37.4 percent between 1990 and 2000. In 2000, Ward 1 had the largest number of Hispanic or Latino residents (18,109), while Ward 7 had the lowest (658). In 2010, Hispanics or Latinos comprised 54,749 people or 9.1 percent of the total population of the District, an increase from 44,953 or 7.9 percent reported in 2000. In 2010, most Hispanics continued to reside in Ward 1 (15,827 or 20.8 percent), followed closely by Ward 2 (14,179 or 18.7 percent). Ward 8 had the least number of Hispanics among all Wards in 2010 (1,307 or 1.8 percent). The District Government established the Office of Latino Affairs in 1976 in response to a growing Latino population. Children: In 2010, there were 100,815 children under 18 years of age in the District of Columbia. This represented a significant decrease in the number and percent of children under 18 years, from 114,992 or 20 percent in 2000 to 100,815 or 16.8 percent in 2010. The largest decrease by five-year age grouping was the 5-9 year olds which decreased by 9,238 or 26 percent between 2000 and 2010. Women. In 2010, 52.8 percent (317,501) of the total 601,723 residents of the District were women. In 2009, about 63.3 percent of the District’s women were in civilian labor forces. Labor force participation rates measure the number of citizens employed or looking for employment as a percent of the civilian non-institutional population of 16 years and older. Women workers hold a wide variety of occupations and a significant proportion are employed in executive, managerial and technical positions. Elderly. In 2010, about 11.4 percent (68,809) of the District’s population were people 65 years old and over. The District government provides a variety of comprehensive programs and services for senior citizens; many of these are funded through the DC Office on Aging (OoA). In 2010, more than 35,107 clients were served by OoA and its grantee agencies. The most requested services by seniors were counseling, congregate and home delivered meals, transportation, wellness service, and case management.
39
8,14
4
15,471
23,336
30,261
33,745
51,687
75,080
131,70
0
177,62
4
230,39
2
278,71
8
331,06
9
437,57
1
486,86
9 663,09
1 802,17
8
763,95
6
756,51
0
638,33
3
606,90
0
572,05
9
601,72
3
0
100,000
200,000
300,000
400,000
500,000
600,000
700,000
800,000
900,000
Popu
latio
n
Year
Figure 2.1. District Population 1800-2010
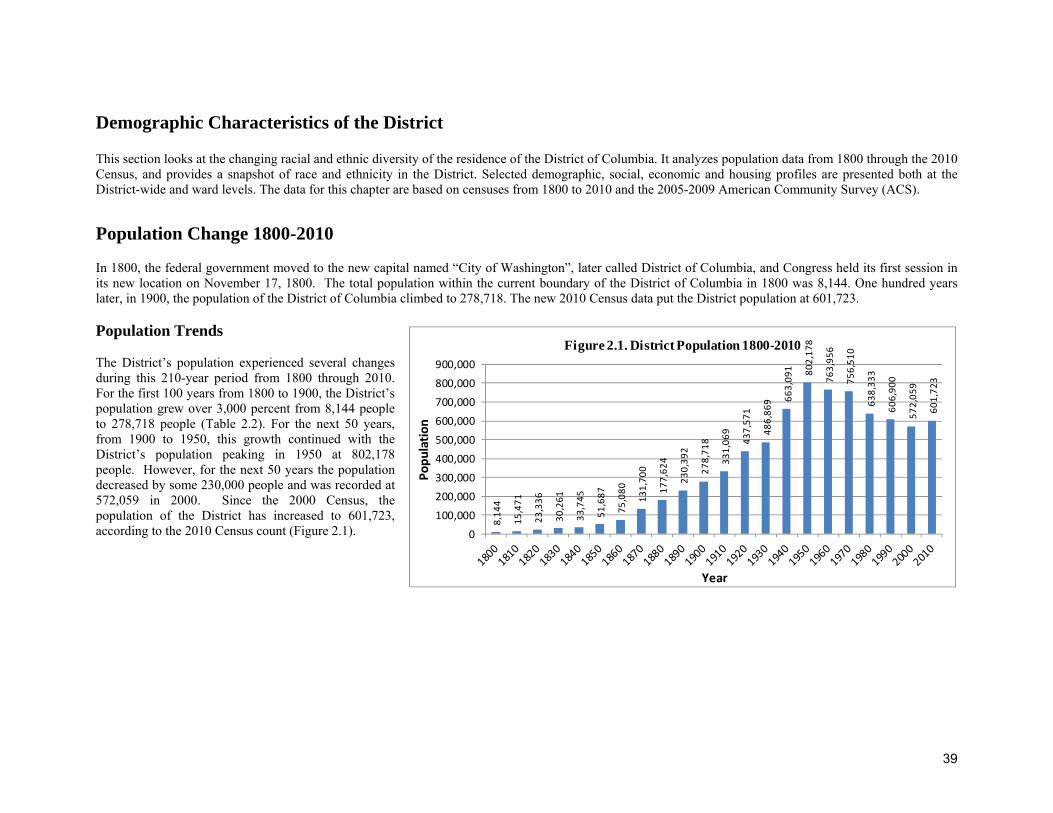
Demographic Characteristics of the District This section looks at the changing racial and ethnic diversity of the residence of the District of Columbia. It analyzes population data from 1800 through the 2010 Census, and provides a snapshot of race and ethnicity in the District. Selected demographic, social, economic and housing profiles are presented both at the District-wide and ward levels. The data for this chapter are based on censuses from 1800 to 2010 and the 2005-2009 American Community Survey (ACS).
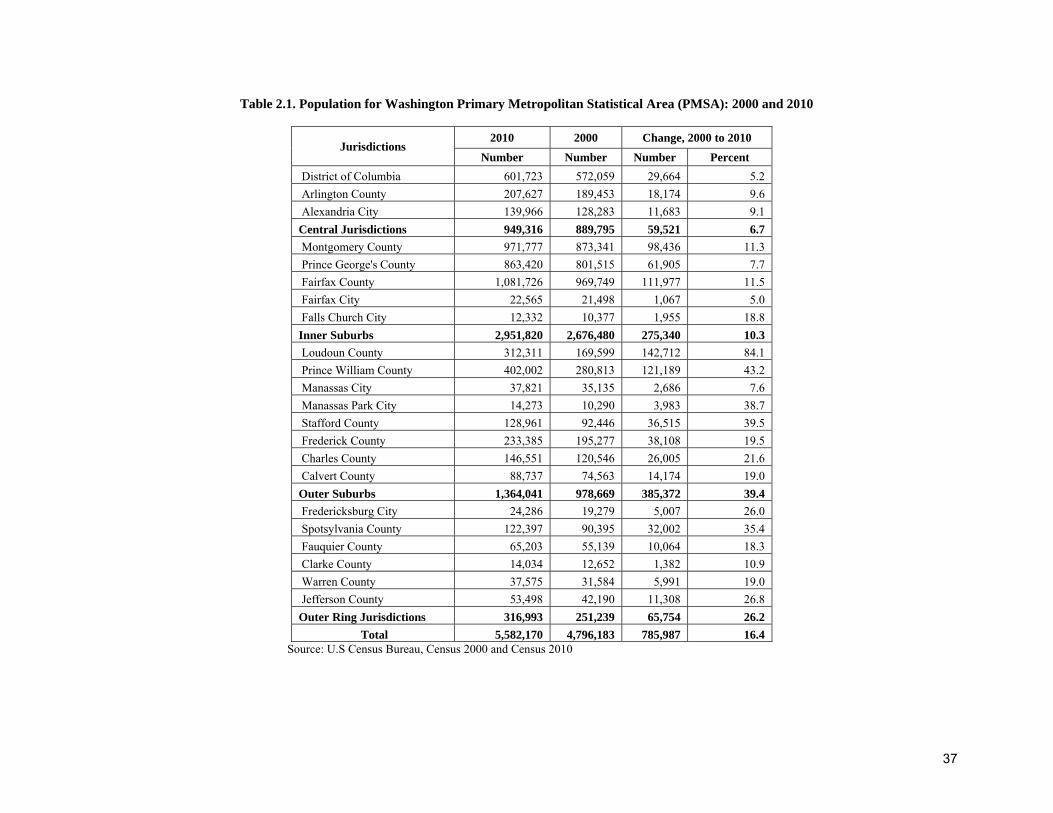
Population Change 1800-2010 In 1800, the federal government moved to the new capital named “City of Washington”, later called District of Columbia, and Congress held its first session in its new location on November 17, 1800. The total population within the current boundary of the District of Columbia in 1800 was 8,144. One hundred years later, in 1900, the population of the District of Columbia climbed to 278,718. The new 2010 Census data put the District population at 601,723. Population Trends The District’s population experienced several changes during this 210-year period from 1800 through 2010. For the first 100 years from 1800 to 1900, the District’s population grew over 3,000 percent from 8,144 people to 278,718 people (Table 2.2). For the next 50 years, from 1900 to 1950, this growth continued with the District’s population peaking in 1950 at 802,178 people. However, for the next 50 years the population decreased by some 230,000 people and was recorded at 572,059 in 2000. Since the 2000 Census, the population of the District has increased to 601,723, according to the 2010 Census count (Figure 2.1).
40
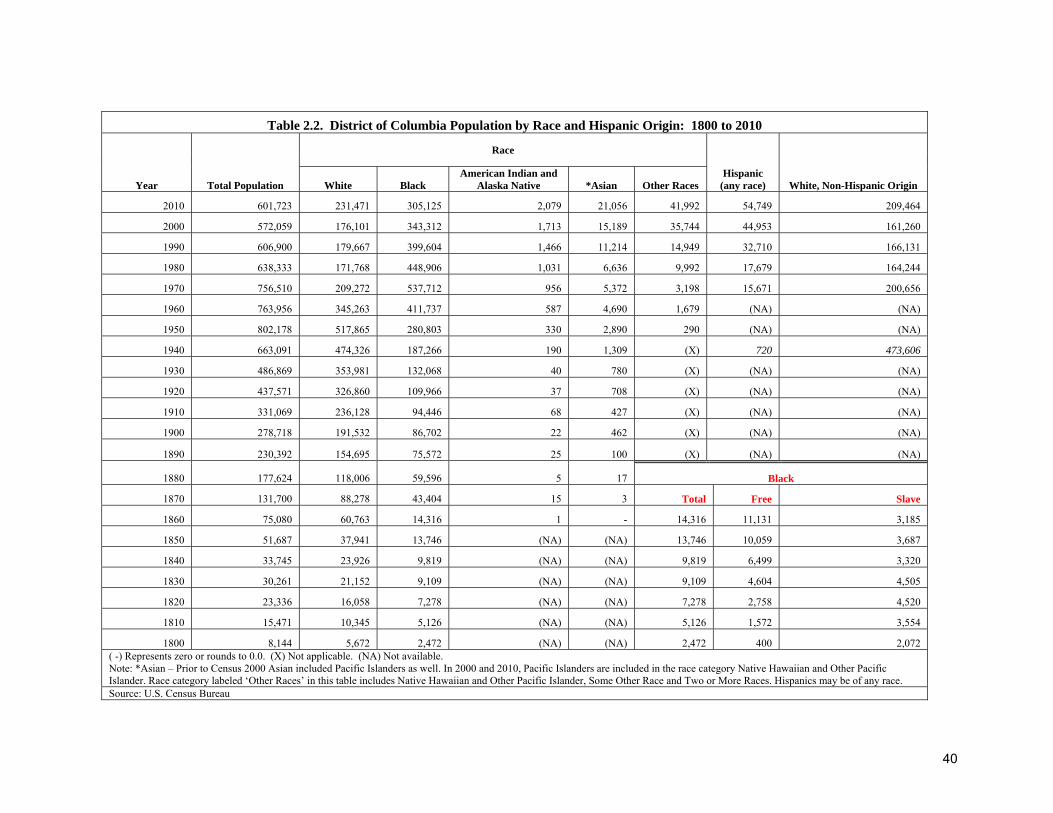
Table 2.2. District of Columbia Population by Race and Hispanic Origin: 1800 to 2010
Year Total Population
Race
Hispanic (any race) White, Non-Hispanic Origin White Black
American Indian and Alaska Native *Asian Other Races
2010 601,723 231,471 305,125 2,079 21,056 41,992 54,749 209,464
2000 572,059 176,101 343,312 1,713 15,189 35,744 44,953 161,260
1990 606,900 179,667 399,604 1,466 11,214 14,949 32,710 166,131
1980 638,333 171,768 448,906 1,031 6,636 9,992 17,679 164,244
1970 756,510 209,272 537,712 956 5,372 3,198 15,671 200,656
1960 763,956 345,263 411,737 587 4,690 1,679 (NA) (NA)
1950 802,178 517,865 280,803 330 2,890 290 (NA) (NA)
1940 663,091 474,326 187,266 190 1,309 (X) 720 473,606
1930 486,869 353,981 132,068 40 780 (X) (NA) (NA)
1920 437,571 326,860 109,966 37 708 (X) (NA) (NA)
1910 331,069 236,128 94,446 68 427 (X) (NA) (NA)
1900 278,718 191,532 86,702 22 462 (X) (NA) (NA)
1890 230,392 154,695 75,572 25 100 (X) (NA) (NA)
1880 177,624 118,006 59,596 5 17 Black
1870 131,700 88,278 43,404 15 3 Total Free Slave
1860 75,080 60,763 14,316 1 - 14,316 11,131 3,185
1850 51,687 37,941 13,746 (NA) (NA) 13,746 10,059 3,687
1840 33,745 23,926 9,819 (NA) (NA) 9,819 6,499 3,320
1830 30,261 21,152 9,109 (NA) (NA) 9,109 4,604 4,505
1820 23,336 16,058 7,278 (NA) (NA) 7,278 2,758 4,520
1810 15,471 10,345 5,126 (NA) (NA) 5,126 1,572 3,554
1800 8,144 5,672 2,472 (NA) (NA) 2,472 400 2,072 ( -) Represents zero or rounds to 0.0. (X) Not applicable. (NA) Not available. Note: *Asian – Prior to Census 2000 Asian included Pacific Islanders as well. In 2000 and 2010, Pacific Islanders are included in the race category Native Hawaiian and Other Pacific Islander. Race category labeled ‘Other Races’ in this table includes Native Hawaiian and Other Pacific Islander, Some Other Race and Two or More Races. Hispanics may be of any race. Source: U.S. Census Bureau
41
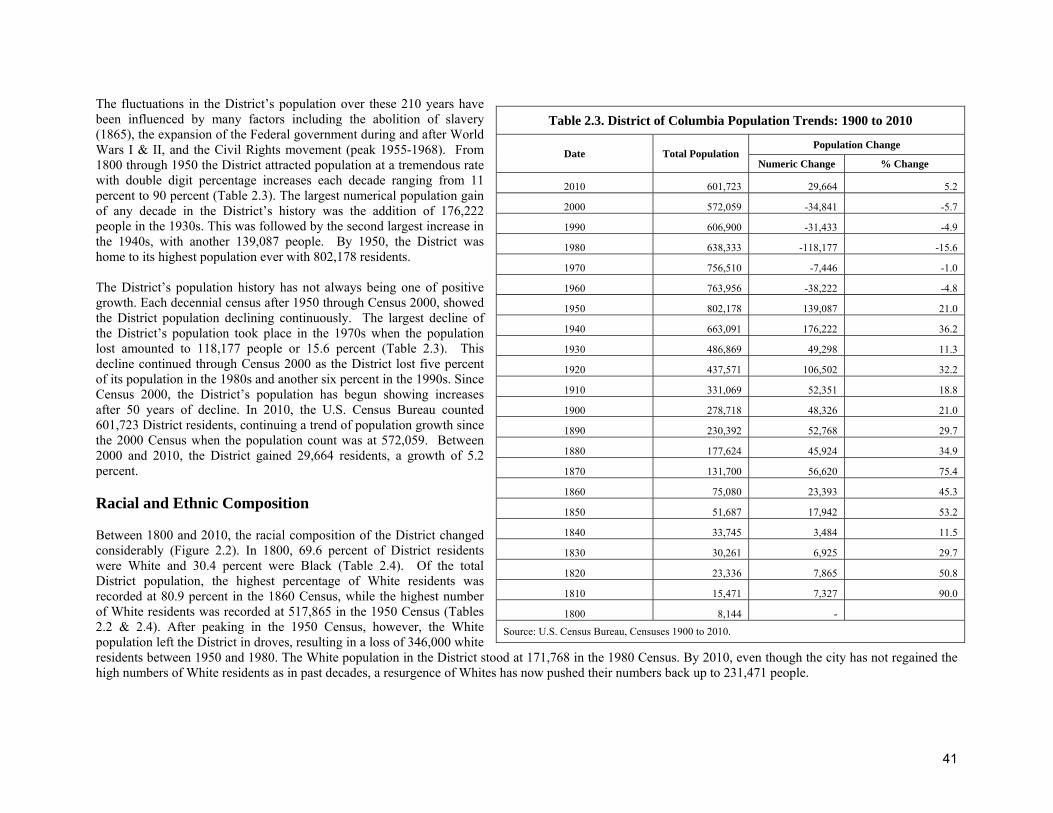
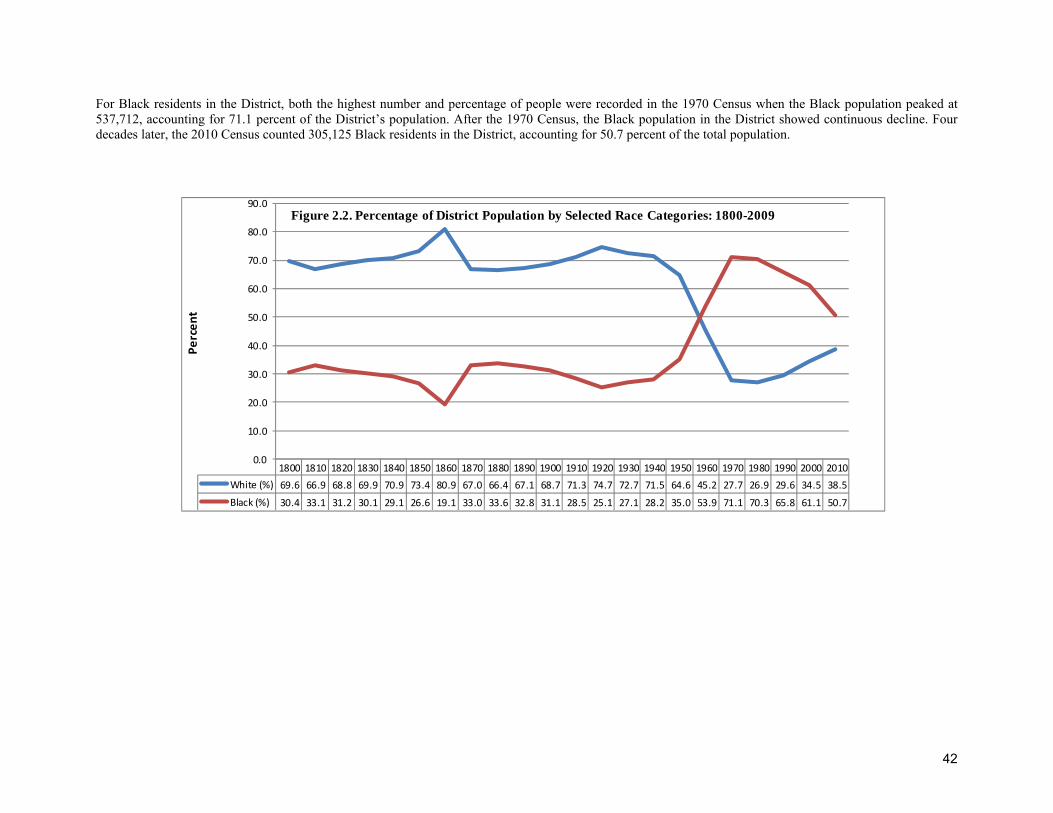
The fluctuations in the District’s population over these 210 years have been influenced by many factors including the abolition of slavery (1865), the expansion of the Federal government during and after World Wars I & II, and the Civil Rights movement (peak 1955-1968). From 1800 through 1950 the District attracted population at a tremendous rate with double digit percentage increases each decade ranging from 11 percent to 90 percent (Table 2.3). The largest numerical population gain of any decade in the District’s history was the addition of 176,222 people in the 1930s. This was followed by the second largest increase in the 1940s, with another 139,087 people. By 1950, the District was home to its highest population ever with 802,178 residents. The District’s population history has not always being one of positive growth. Each decennial census after 1950 through Census 2000, showed the District population declining continuously. The largest decline of the District’s population took place in the 1970s when the population lost amounted to 118,177 people or 15.6 percent (Table 2.3). This decline continued through Census 2000 as the District lost five percent of its population in the 1980s and another six percent in the 1990s. Since Census 2000, the District’s population has begun showing increases after 50 years of decline. In 2010, the U.S. Census Bureau counted 601,723 District residents, continuing a trend of population growth since the 2000 Census when the population count was at 572,059. Between 2000 and 2010, the District gained 29,664 residents, a growth of 5.2 percent. Racial and Ethnic Composition Between 1800 and 2010, the racial composition of the District changed considerably (Figure 2.2). In 1800, 69.6 percent of District residents were White and 30.4 percent were Black (Table 2.4). Of the total District population, the highest percentage of White residents was recorded at 80.9 percent in the 1860 Census, while the highest number of White residents was recorded at 517,865 in the 1950 Census (Tables 2.2 & 2.4). After peaking in the 1950 Census, however, the White population left the District in droves, resulting in a loss of 346,000 white residents between 1950 and 1980. The White population in the District stood at 171,768 in the 1980 Census. By 2010, even though the city has not regained the high numbers of White residents as in past decades, a resurgence of Whites has now pushed their numbers back up to 231,471 people.
Table 2.3. District of Columbia Population Trends: 1900 to 2010
Date Total Population Population Change
Numeric Change % Change
2010 601,723 29,664 5.2
2000 572,059 -34,841 -5.7
1990 606,900 -31,433 -4.9
1980 638,333 -118,177 -15.6
1970 756,510 -7,446 -1.0
1960 763,956 -38,222 -4.8
1950 802,178 139,087 21.0
1940 663,091 176,222 36.2
1930 486,869 49,298 11.3
1920 437,571 106,502 32.2
1910 331,069 52,351 18.8
1900 278,718 48,326 21.0
1890 230,392 52,768 29.7
1880 177,624 45,924 34.9
1870 131,700 56,620 75.4
1860 75,080 23,393 45.3
1850 51,687 17,942 53.2
1840 33,745 3,484 11.5
1830 30,261 6,925 29.7
1820 23,336 7,865 50.8
1810 15,471 7,327 90.0
1800 8,144 -
Source: U.S. Census Bureau, Censuses 1900 to 2010.
42
1800 1810 1820 1830 1840 1850 1860 1870 1880 1890 1900 1910 1920 1930 1940 1950 1960 1970 1980 1990 2000 2010White (%) 69.6 66.9 68.8 69.9 70.9 73.4 80.9 67.0 66.4 67.1 68.7 71.3 74.7 72.7 71.5 64.6 45.2 27.7 26.9 29.6 34.5 38.5
Black (%) 30.4 33.1 31.2 30.1 29.1 26.6 19.1 33.0 33.6 32.8 31.1 28.5 25.1 27.1 28.2 35.0 53.9 71.1 70.3 65.8 61.1 50.7
0.0
10.0
20.0
30.0
40.0
50.0
60.0
70.0
80.0
90.0Pe
rcen
t
Figure 2.2. Percentage of District Population by Selected Race Categories: 1800-2009
For Black residents in the District, both the highest number and percentage of people were recorded in the 1970 Census when the Black population peaked at 537,712, accounting for 71.1 percent of the District’s population. After the 1970 Census, the Black population in the District showed continuous decline. Four decades later, the 2010 Census counted 305,125 Black residents in the District, accounting for 50.7 percent of the total population.
43
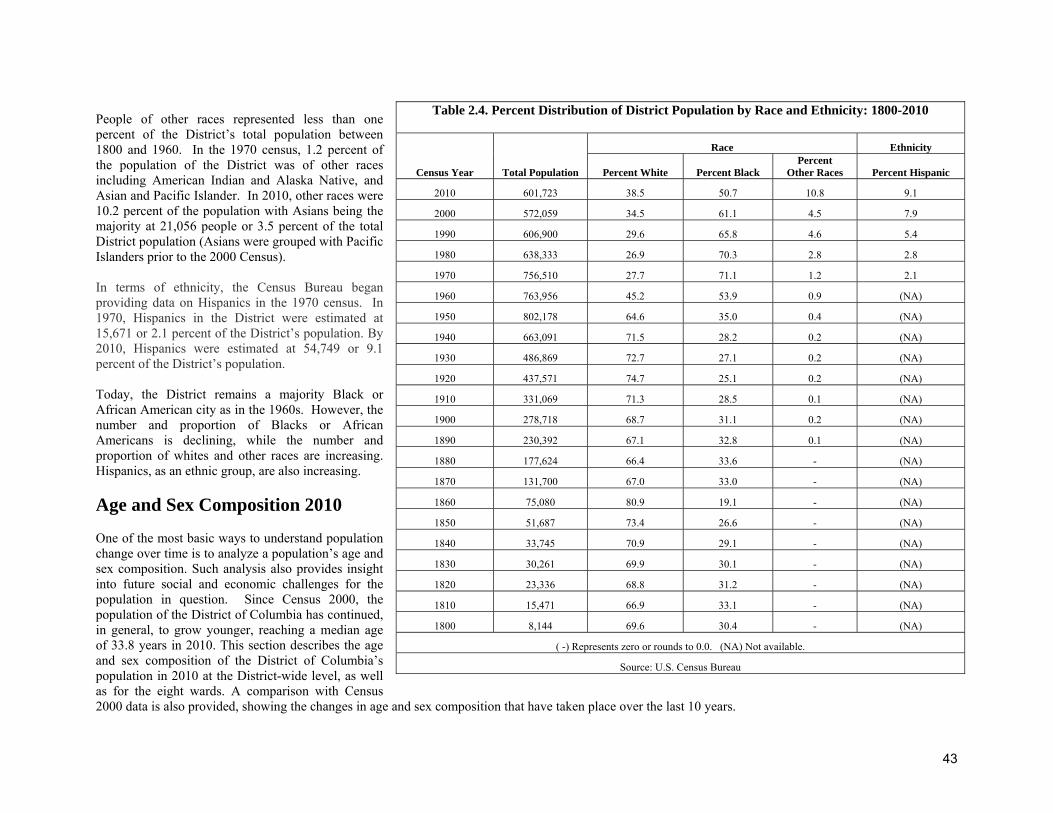
People of other races represented less than one percent of the District’s total population between 1800 and 1960. In the 1970 census, 1.2 percent of the population of the District was of other races including American Indian and Alaska Native, and Asian and Pacific Islander. In 2010, other races were 10.2 percent of the population with Asians being the majority at 21,056 people or 3.5 percent of the total District population (Asians were grouped with Pacific Islanders prior to the 2000 Census). In terms of ethnicity, the Census Bureau began providing data on Hispanics in the 1970 census. In 1970, Hispanics in the District were estimated at 15,671 or 2.1 percent of the District’s population. By 2010, Hispanics were estimated at 54,749 or 9.1 percent of the District’s population. Today, the District remains a majority Black or African American city as in the 1960s. However, the number and proportion of Blacks or African Americans is declining, while the number and proportion of whites and other races are increasing. Hispanics, as an ethnic group, are also increasing. Age and Sex Composition 2010 One of the most basic ways to understand population change over time is to analyze a population’s age and sex composition. Such analysis also provides insight into future social and economic challenges for the population in question. Since Census 2000, the population of the District of Columbia has continued, in general, to grow younger, reaching a median age of 33.8 years in 2010. This section describes the age and sex composition of the District of Columbia’s population in 2010 at the District-wide level, as well as for the eight wards. A comparison with Census 2000 data is also provided, showing the changes in age and sex composition that have taken place over the last 10 years.
Table 2.4. Percent Distribution of District Population by Race and Ethnicity: 1800-2010
Census Year Total Population
Race Ethnicity
Percent White Percent Black Percent
Other Races Percent Hispanic
2010 601,723 38.5 50.7 10.8 9.1
2000 572,059 34.5 61.1 4.5 7.9
1990 606,900 29.6 65.8 4.6 5.4
1980 638,333 26.9 70.3 2.8 2.8
1970 756,510 27.7 71.1 1.2 2.1
1960 763,956 45.2 53.9 0.9 (NA)
1950 802,178 64.6 35.0 0.4 (NA)
1940 663,091 71.5 28.2 0.2 (NA)
1930 486,869 72.7 27.1 0.2 (NA)
1920 437,571 74.7 25.1 0.2 (NA)
1910 331,069 71.3 28.5 0.1 (NA)
1900 278,718 68.7 31.1 0.2 (NA)
1890 230,392 67.1 32.8 0.1 (NA)
1880 177,624 66.4 33.6 - (NA)
1870 131,700 67.0 33.0 - (NA)
1860 75,080 80.9 19.1 - (NA)
1850 51,687 73.4 26.6 - (NA)
1840 33,745 70.9 29.1 - (NA)
1830 30,261 69.9 30.1 - (NA)
1820 23,336 68.8 31.2 - (NA)
1810 15,471 66.9 33.1 - (NA)
1800 8,144 69.6 30.4 - (NA)
( -) Represents zero or rounds to 0.0. (NA) Not available.
Source: U.S. Census Bureau
44
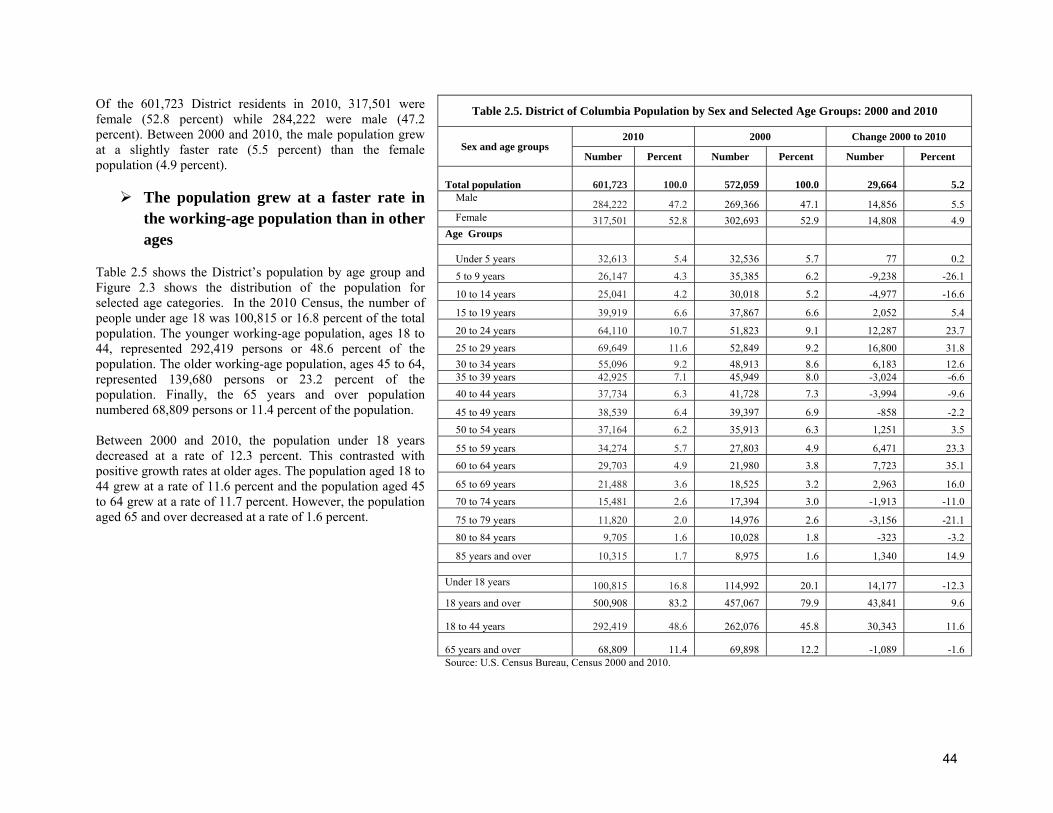
Of the 601,723 District residents in 2010, 317,501 were female (52.8 percent) while 284,222 were male (47.2 percent). Between 2000 and 2010, the male population grew at a slightly faster rate (5.5 percent) than the female population (4.9 percent). The population grew at a faster rate in
the working-age population than in other ages
Table 2.5 shows the District’s population by age group and Figure 2.3 shows the distribution of the population for selected age categories. In the 2010 Census, the number of people under age 18 was 100,815 or 16.8 percent of the total population. The younger working-age population, ages 18 to 44, represented 292,419 persons or 48.6 percent of the population. The older working-age population, ages 45 to 64, represented 139,680 persons or 23.2 percent of the population. Finally, the 65 years and over population numbered 68,809 persons or 11.4 percent of the population. Between 2000 and 2010, the population under 18 years decreased at a rate of 12.3 percent. This contrasted with positive growth rates at older ages. The population aged 18 to 44 grew at a rate of 11.6 percent and the population aged 45 to 64 grew at a rate of 11.7 percent. However, the population aged 65 and over decreased at a rate of 1.6 percent.
Table 2.5. District of Columbia Population by Sex and Selected Age Groups: 2000 and 2010
Sex and age groups 2010 2000 Change 2000 to 2010
Number Percent Number Percent Number Percent
Total population 601,723 100.0 572,059 100.0 29,664 5.2 Male
284,222 47.2 269,366 47.1 14,856 5.5 Female 317,501 52.8 302,693 52.9 14,808 4.9 Age Groups
Under 5 years 32,613 5.4 32,536 5.7 77 0.2 5 to 9 years 26,147 4.3 35,385 6.2 -9,238 -26.1
10 to 14 years 25,041 4.2 30,018 5.2 -4,977 -16.6
15 to 19 years 39,919 6.6 37,867 6.6 2,052 5.4
20 to 24 years 64,110 10.7 51,823 9.1 12,287 23.7 25 to 29 years 69,649 11.6 52,849 9.2 16,800 31.8 30 to 34 years 55,096 9.2 48,913 8.6 6,183 12.6 35 to 39 years 42,925 7.1 45,949 8.0 -3,024 -6.6 40 to 44 years 37,734 6.3 41,728 7.3 -3,994 -9.6
45 to 49 years 38,539 6.4 39,397 6.9 -858 -2.2 50 to 54 years 37,164 6.2 35,913 6.3 1,251 3.5
55 to 59 years 34,274 5.7 27,803 4.9 6,471 23.3 60 to 64 years 29,703 4.9 21,980 3.8 7,723 35.1
65 to 69 years 21,488 3.6 18,525 3.2 2,963 16.0 70 to 74 years 15,481 2.6 17,394 3.0 -1,913 -11.0
75 to 79 years 11,820 2.0 14,976 2.6 -3,156 -21.1 80 to 84 years 9,705 1.6 10,028 1.8 -323 -3.2
85 years and over 10,315 1.7 8,975 1.6 1,340 14.9 Under 18 years 100,815 16.8 114,992 20.1 14,177 -12.3 18 years and over 500,908 83.2 457,067 79.9 43,841 9.6
18 to 44 years 292,419 48.6 262,076 45.8 30,343 11.6
65 years and over 68,809 11.4 69,898 12.2 -1,089 -1.6 Source: U.S. Census Bureau, Census 2000 and 2010.
45
20.0
16.8
45.8
48.6
22.0
23.2
12.2
11.4
0.0 20.0 40.0 60.0 80.0 100.0 120.0
2000
2010
Percent
0‐17 18‐44 45‐64 65+
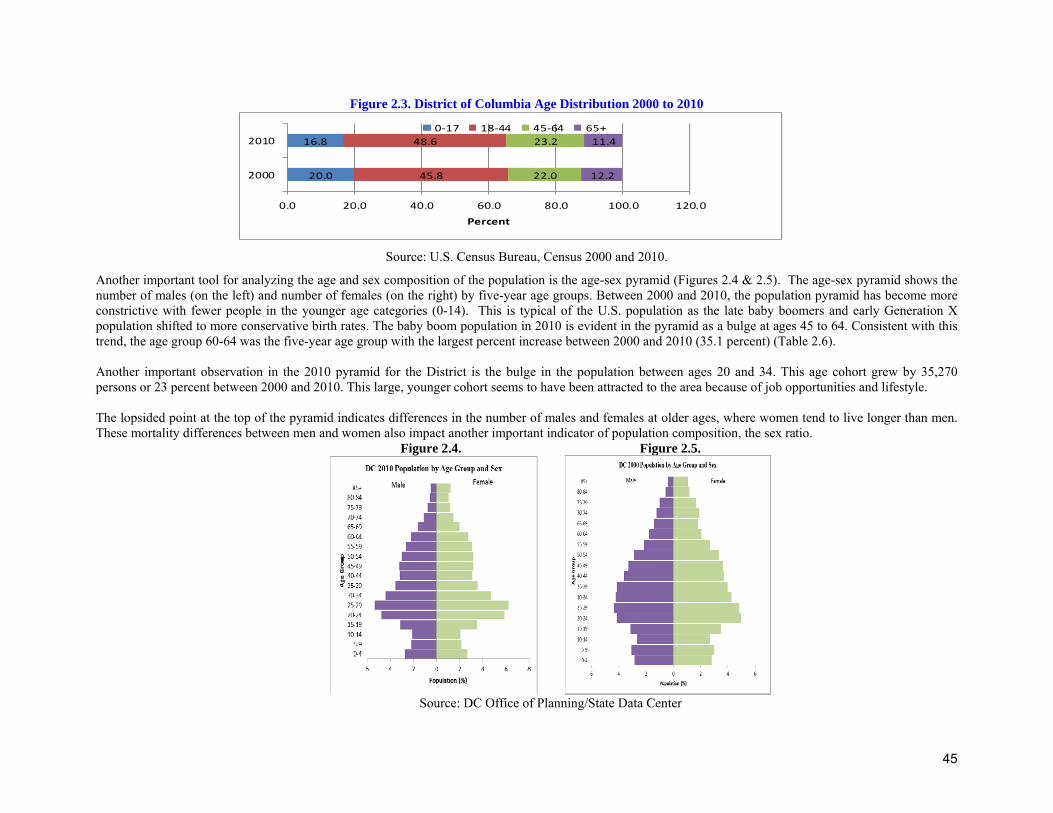
Figure 2.3. District of Columbia Age Distribution 2000 to 2010
Source: U.S. Census Bureau, Census 2000 and 2010.
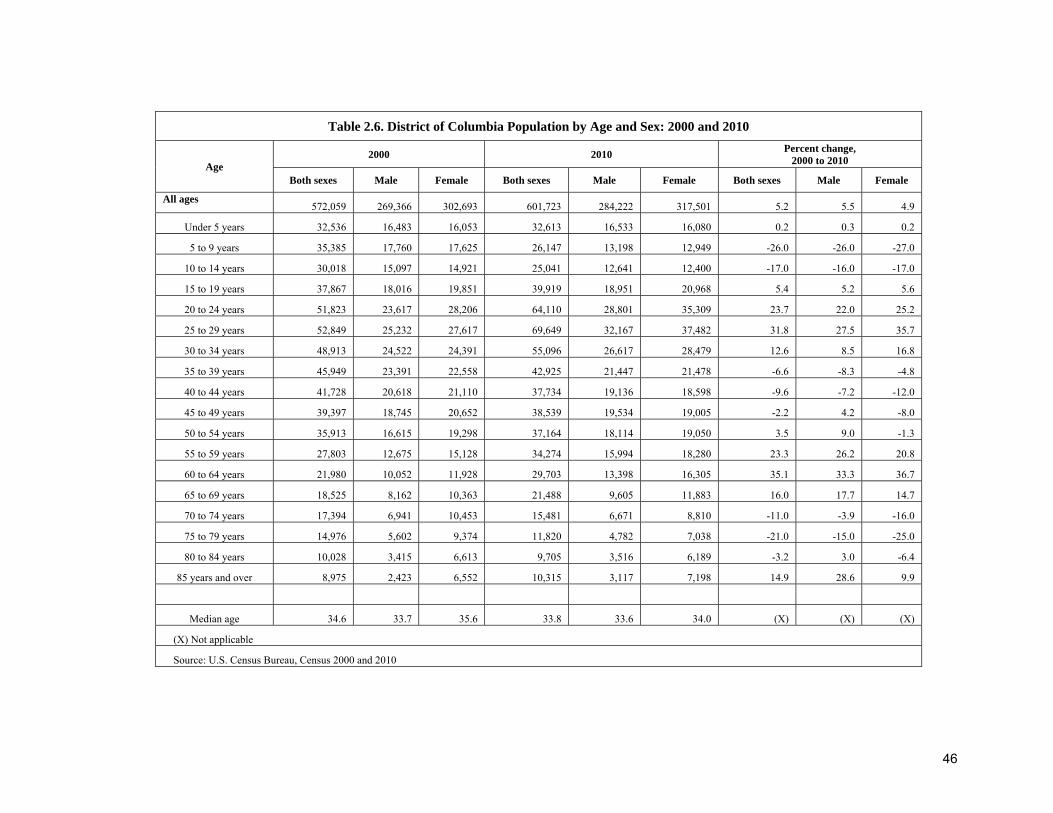
Another important tool for analyzing the age and sex composition of the population is the age-sex pyramid (Figures 2.4 & 2.5). The age-sex pyramid shows the number of males (on the left) and number of females (on the right) by five-year age groups. Between 2000 and 2010, the population pyramid has become more constrictive with fewer people in the younger age categories (0-14). This is typical of the U.S. population as the late baby boomers and early Generation X population shifted to more conservative birth rates. The baby boom population in 2010 is evident in the pyramid as a bulge at ages 45 to 64. Consistent with this trend, the age group 60-64 was the five-year age group with the largest percent increase between 2000 and 2010 (35.1 percent) (Table 2.6). Another important observation in the 2010 pyramid for the District is the bulge in the population between ages 20 and 34. This age cohort grew by 35,270 persons or 23 percent between 2000 and 2010. This large, younger cohort seems to have been attracted to the area because of job opportunities and lifestyle. The lopsided point at the top of the pyramid indicates differences in the number of males and females at older ages, where women tend to live longer than men. These mortality differences between men and women also impact another important indicator of population composition, the sex ratio.
Figure 2.4. Figure 2.5.
Source: DC Office of Planning/State Data Center
46
Table 2.6. District of Columbia Population by Age and Sex: 2000 and 2010
Age 2000 2010 Percent change,
2000 to 2010
Both sexes Male Female Both sexes Male Female Both sexes Male Female
All ages 572,059 269,366 302,693 601,723 284,222 317,501 5.2 5.5 4.9
Under 5 years 32,536 16,483 16,053 32,613 16,533 16,080 0.2 0.3 0.2
5 to 9 years 35,385 17,760 17,625 26,147 13,198 12,949 -26.0 -26.0 -27.0
10 to 14 years 30,018 15,097 14,921 25,041 12,641 12,400 -17.0 -16.0 -17.0
15 to 19 years 37,867 18,016 19,851 39,919 18,951 20,968 5.4 5.2 5.6
20 to 24 years 51,823 23,617 28,206 64,110 28,801 35,309 23.7 22.0 25.2
25 to 29 years 52,849 25,232 27,617 69,649 32,167 37,482 31.8 27.5 35.7
30 to 34 years 48,913 24,522 24,391 55,096 26,617 28,479 12.6 8.5 16.8
35 to 39 years 45,949 23,391 22,558 42,925 21,447 21,478 -6.6 -8.3 -4.8
40 to 44 years 41,728 20,618 21,110 37,734 19,136 18,598 -9.6 -7.2 -12.0
45 to 49 years 39,397 18,745 20,652 38,539 19,534 19,005 -2.2 4.2 -8.0
50 to 54 years 35,913 16,615 19,298 37,164 18,114 19,050 3.5 9.0 -1.3
55 to 59 years 27,803 12,675 15,128 34,274 15,994 18,280 23.3 26.2 20.8
60 to 64 years 21,980 10,052 11,928 29,703 13,398 16,305 35.1 33.3 36.7
65 to 69 years 18,525 8,162 10,363 21,488 9,605 11,883 16.0 17.7 14.7
70 to 74 years 17,394 6,941 10,453 15,481 6,671 8,810 -11.0 -3.9 -16.0
75 to 79 years 14,976 5,602 9,374 11,820 4,782 7,038 -21.0 -15.0 -25.0
80 to 84 years 10,028 3,415 6,613 9,705 3,516 6,189 -3.2 3.0 -6.4
85 years and over 8,975 2,423 6,552 10,315 3,117 7,198 14.9 28.6 9.9
Median age 34.6 33.7 35.6 33.8 33.6 34.0 (X) (X) (X)
(X) Not applicable
Source: U.S. Census Bureau, Census 2000 and 2010
47
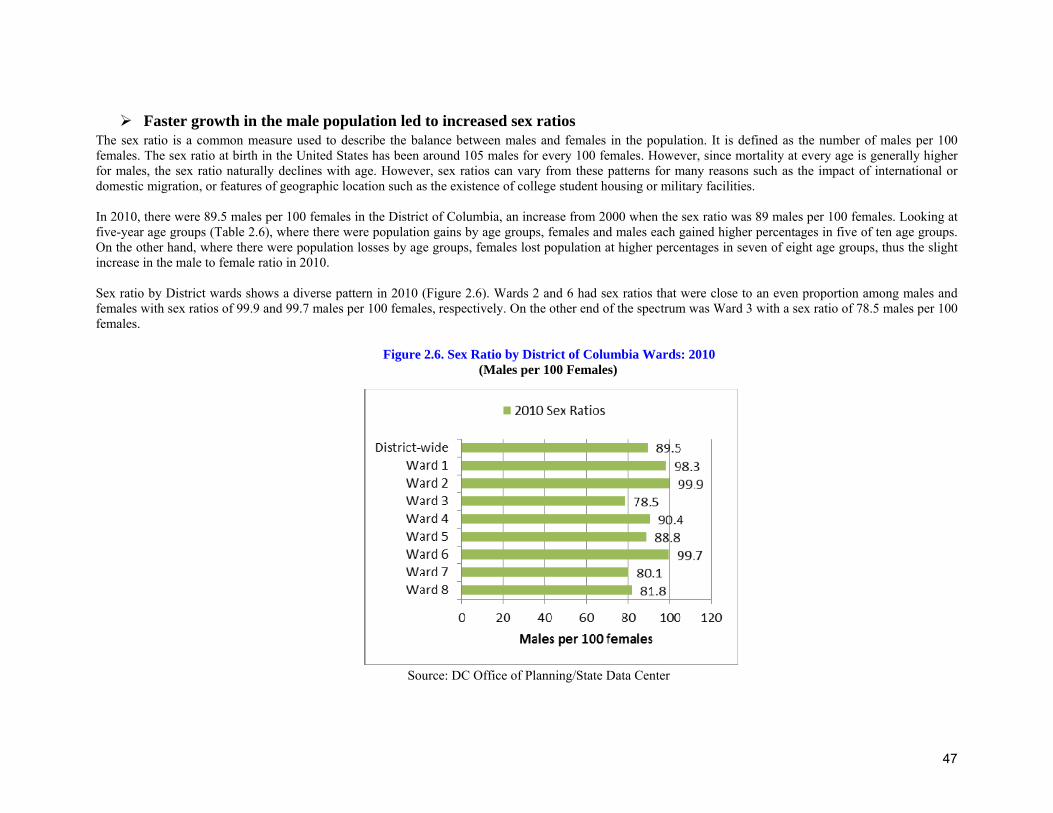
Faster growth in the male population led to increased sex ratios
The sex ratio is a common measure used to describe the balance between males and females in the population. It is defined as the number of males per 100 females. The sex ratio at birth in the United States has been around 105 males for every 100 females. However, since mortality at every age is generally higher for males, the sex ratio naturally declines with age. However, sex ratios can vary from these patterns for many reasons such as the impact of international or domestic migration, or features of geographic location such as the existence of college student housing or military facilities. In 2010, there were 89.5 males per 100 females in the District of Columbia, an increase from 2000 when the sex ratio was 89 males per 100 females. Looking at five-year age groups (Table 2.6), where there were population gains by age groups, females and males each gained higher percentages in five of ten age groups. On the other hand, where there were population losses by age groups, females lost population at higher percentages in seven of eight age groups, thus the slight increase in the male to female ratio in 2010. Sex ratio by District wards shows a diverse pattern in 2010 (Figure 2.6). Wards 2 and 6 had sex ratios that were close to an even proportion among males and females with sex ratios of 99.9 and 99.7 males per 100 females, respectively. On the other end of the spectrum was Ward 3 with a sex ratio of 78.5 males per 100 females.
Figure 2.6. Sex Ratio by District of Columbia Wards: 2010 (Males per 100 Females)
Source: DC Office of Planning/State Data Center
48
0510152025303540
Ward1
Ward2
Ward3
Ward4
Ward5
Ward6
Ward7
Ward8
31.2 29.9
36.440 38.2
34.237.2
29.6
Med
ian Ag
eMedian Age 2010
2010
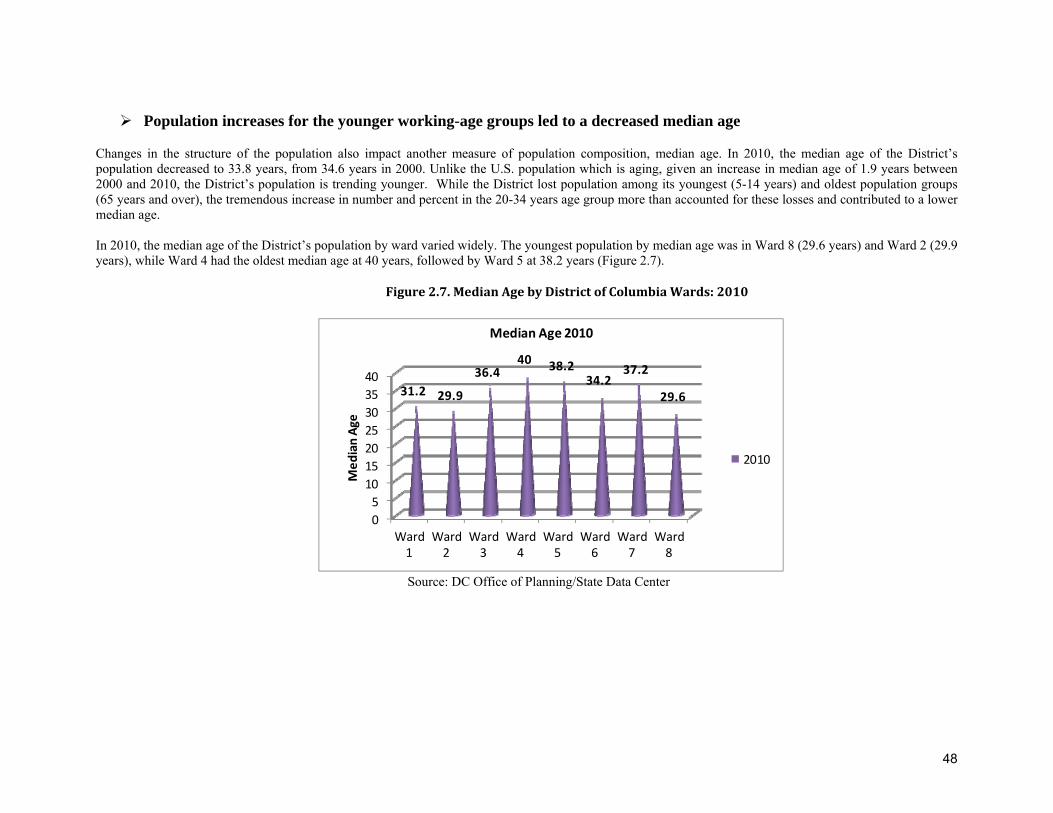
Population increases for the younger working-age groups led to a decreased median age
Changes in the structure of the population also impact another measure of population composition, median age. In 2010, the median age of the District’s population decreased to 33.8 years, from 34.6 years in 2000. Unlike the U.S. population which is aging, given an increase in median age of 1.9 years between 2000 and 2010, the District’s population is trending younger. While the District lost population among its youngest (5-14 years) and oldest population groups (65 years and over), the tremendous increase in number and percent in the 20-34 years age group more than accounted for these losses and contributed to a lower median age. In 2010, the median age of the District’s population by ward varied widely. The youngest population by median age was in Ward 8 (29.6 years) and Ward 2 (29.9 years), while Ward 4 had the oldest median age at 40 years, followed by Ward 5 at 38.2 years (Figure 2.7).
Source: DC Office of Planning/State Data Center
Figure2.7.MedianAgebyDistrictofColumbiaWards:2010
49
0
10
20
30
40
50
Child Old‐age Total
29.7
18.1
47.8
23.315.9
39.3
Dependency ratios
2000
2010
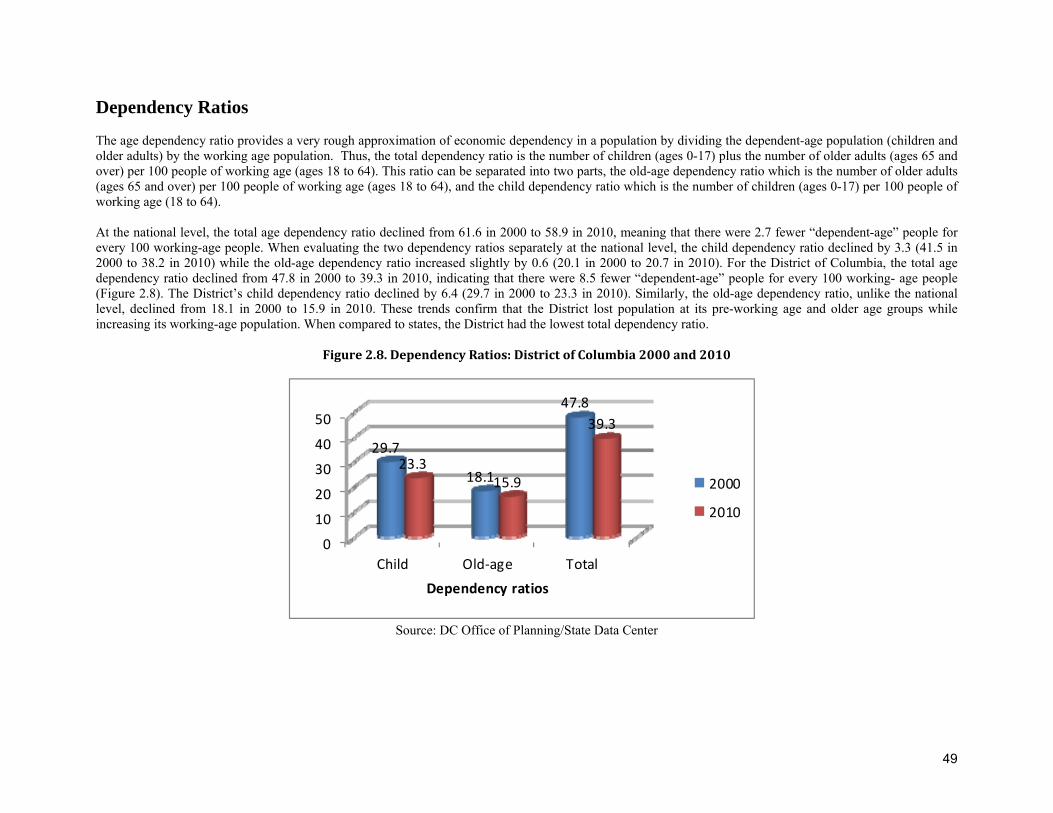
Dependency Ratios The age dependency ratio provides a very rough approximation of economic dependency in a population by dividing the dependent-age population (children and older adults) by the working age population. Thus, the total dependency ratio is the number of children (ages 0-17) plus the number of older adults (ages 65 and over) per 100 people of working age (ages 18 to 64). This ratio can be separated into two parts, the old-age dependency ratio which is the number of older adults (ages 65 and over) per 100 people of working age (ages 18 to 64), and the child dependency ratio which is the number of children (ages 0-17) per 100 people of working age (18 to 64). At the national level, the total age dependency ratio declined from 61.6 in 2000 to 58.9 in 2010, meaning that there were 2.7 fewer “dependent-age” people for every 100 working-age people. When evaluating the two dependency ratios separately at the national level, the child dependency ratio declined by 3.3 (41.5 in 2000 to 38.2 in 2010) while the old-age dependency ratio increased slightly by 0.6 (20.1 in 2000 to 20.7 in 2010). For the District of Columbia, the total age dependency ratio declined from 47.8 in 2000 to 39.3 in 2010, indicating that there were 8.5 fewer “dependent-age” people for every 100 working- age people (Figure 2.8). The District’s child dependency ratio declined by 6.4 (29.7 in 2000 to 23.3 in 2010). Similarly, the old-age dependency ratio, unlike the national level, declined from 18.1 in 2000 to 15.9 in 2010. These trends confirm that the District lost population at its pre-working age and older age groups while increasing its working-age population. When compared to states, the District had the lowest total dependency ratio.
Figure2.8.DependencyRatios:DistrictofColumbia2000and2010
Source: DC Office of Planning/State Data Center
50
48.9
40.7
16.7
25.3
31
18.1
6.8
14.6
12.8
21.5
12.5
22.6
23.6
20.2
9.9
8.7
0 10 20 30 40 50 60
Ward 8
Ward 7
Ward 6
Ward 5
Ward 4
Ward 3
Ward 2
Ward 1
Dependency ratios
Old‐age Child
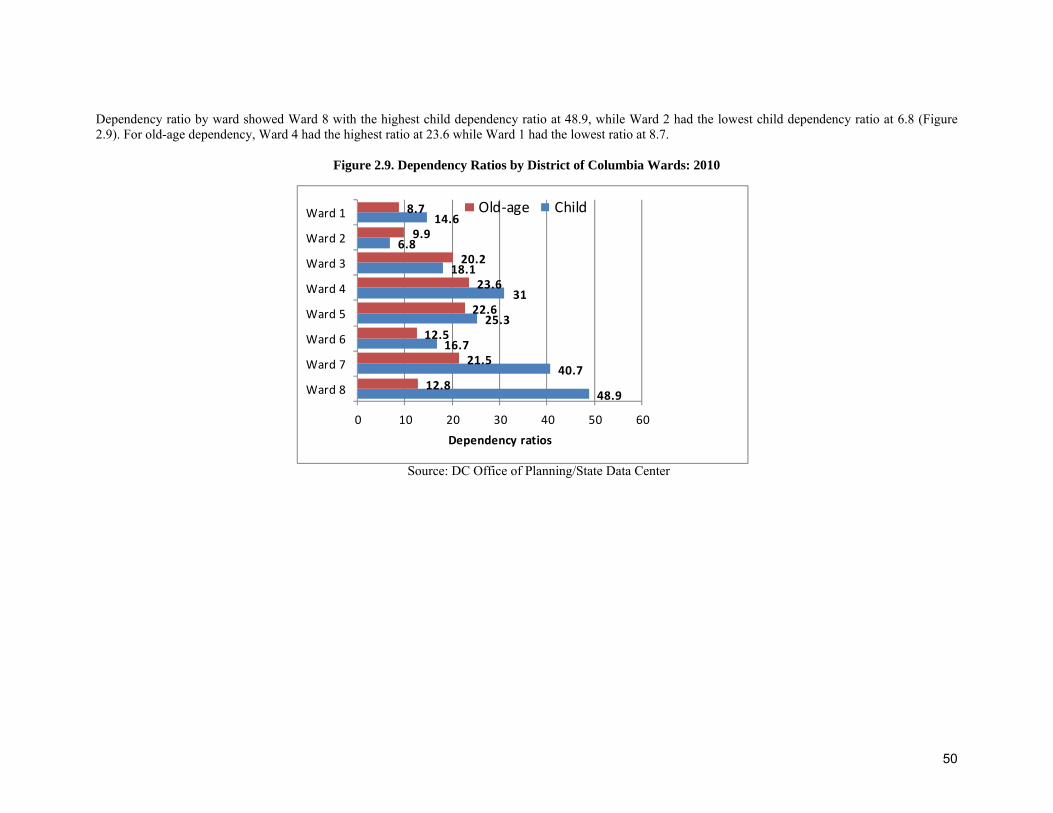
Dependency ratio by ward showed Ward 8 with the highest child dependency ratio at 48.9, while Ward 2 had the lowest child dependency ratio at 6.8 (Figure 2.9). For old-age dependency, Ward 4 had the highest ratio at 23.6 while Ward 1 had the lowest ratio at 8.7.
Figure 2.9. Dependency Ratios by District of Columbia Wards: 2010
Source: DC Office of Planning/State Data Center
51
Selected Census 2010 Demographic Data Definition of Race Categories Used in the 2010 Census “White” refers to a person having origins in any of the original peoples of Europe, the Middle East, or North Africa. It includes people who indicated their race(s) as “White” or reported entries such as Irish, German, Italian, Lebanese, Arab, Moroccan, or Caucasian.
“Black or African American” refers to a person having origins in any of the Black racial groups of Africa. It includes people who indicated their race(s) as “Black, African Am., or Negro” or reported entries such as African American, Kenyan, Nigerian, or Haitian.
“American Indian or Alaska Native” refers to a person having origins in any of the original peoples of North and South America (including Central America) and who maintains tribal affiliation or community attachment. This category includes people who indicated their race(s) as “American Indian or Alaska Native” or reported their enrolled or principal tribe, such as Navajo, Blackfeet, Inupiat, Yup’ik, or Central American Indian groups or South American Indian groups.
“Asian” refers to a person having origins in any of the original peoples of the Far East, Southeast Asia, or the Indian subcontinent, including, for example, Cambodia, China, India, Japan, Korea, Malaysia, Pakistan, the Philippine Islands, Thailand, and Vietnam. It includes people who indicated their race(s) as “Asian” or reported entries such as “Asian Indian,” “Chinese,” “Filipino,” “Korean,” “Japanese,” “Vietnamese,” and “Other Asian” or provided other detailed Asian responses.
“Native Hawaiian or Other Pacific Islander” refers to a person having origins in any of the original peoples of Hawaii, Guam, Samoa, or other Pacific Islands. It includes people who indicated their race(s) as “Pacific Islander” or reported entries such as “Native Hawaiian,” “Guamanian or Chamorro,” “Samoan,” and “Other Pacific Islander” or provided other detailed Pacific Islander responses.
“Some Other Race” includes all other responses not included in the White, Black or African American, American Indian or Alaska Native, Asian, and Native Hawaiian or Other Pacific Islander race categories described above. Respondents reporting entries such as multiracial, mixed, interracial, or a Hispanic or Latino group (for example, Mexican, Puerto Rican, Cuban, or Spanish) in response to the race question are included in this category.
Definition of Hispanic or Latino Origin Used in the 2010 Census
“Hispanic or Latino” refers to a person of Cuban, Mexican, Puerto Rican, South or Central American, or other Spanish culture or origin regardless of race.
52
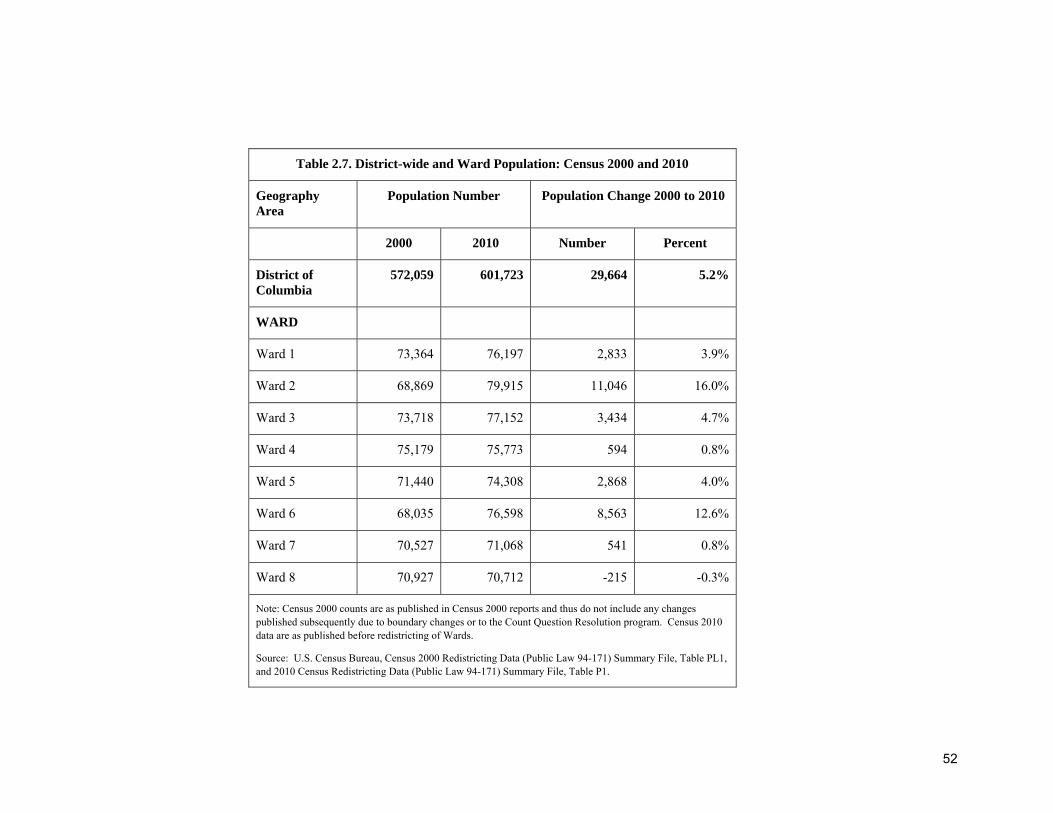
Table 2.7. District-wide and Ward Population: Census 2000 and 2010
Geography Area
Population Number Population Change 2000 to 2010
2000 2010 Number Percent
District of Columbia
572,059 601,723 29,664 5.2%
WARD
Ward 1 73,364 76,197 2,833 3.9%
Ward 2 68,869 79,915 11,046 16.0%
Ward 3 73,718 77,152 3,434 4.7%
Ward 4 75,179 75,773 594 0.8%
Ward 5 71,440 74,308 2,868 4.0%
Ward 6 68,035 76,598 8,563 12.6%
Ward 7 70,527 71,068 541 0.8%
Ward 8 70,927 70,712 -215 -0.3%
Note: Census 2000 counts are as published in Census 2000 reports and thus do not include any changes published subsequently due to boundary changes or to the Count Question Resolution program. Census 2010 data are as published before redistricting of Wards.
Source: U.S. Census Bureau, Census 2000 Redistricting Data (Public Law 94-171) Summary File, Table PL1, and 2010 Census Redistricting Data (Public Law 94-171) Summary File, Table P1.
53
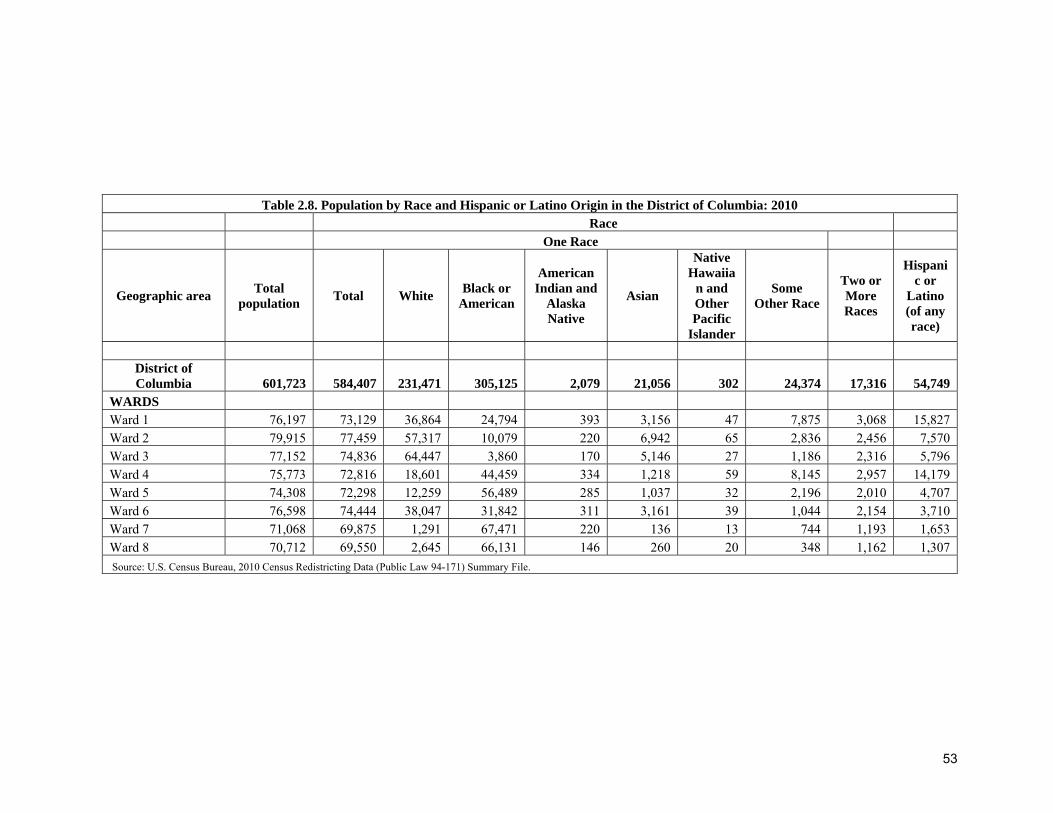
Table 2.8. Population by Race and Hispanic or Latino Origin in the District of Columbia: 2010 Race One Race
Geographic area Total population Total White Black or
American
American Indian and
Alaska Native
Asian
Native Hawaiia
n and Other Pacific
Islander
Some Other Race
Two or More Races
Hispanic or
Latino (of any race)
District of Columbia 601,723 584,407 231,471 305,125 2,079 21,056 302 24,374 17,316 54,749
WARDS Ward 1 76,197 73,129 36,864 24,794 393 3,156 47 7,875 3,068 15,827 Ward 2 79,915 77,459 57,317 10,079 220 6,942 65 2,836 2,456 7,570 Ward 3 77,152 74,836 64,447 3,860 170 5,146 27 1,186 2,316 5,796 Ward 4 75,773 72,816 18,601 44,459 334 1,218 59 8,145 2,957 14,179 Ward 5 74,308 72,298 12,259 56,489 285 1,037 32 2,196 2,010 4,707 Ward 6 76,598 74,444 38,047 31,842 311 3,161 39 1,044 2,154 3,710 Ward 7 71,068 69,875 1,291 67,471 220 136 13 744 1,193 1,653 Ward 8 70,712 69,550 2,645 66,131 146 260 20 348 1,162 1,307 Source: U.S. Census Bureau, 2010 Census Redistricting Data (Public Law 94-171) Summary File.
54
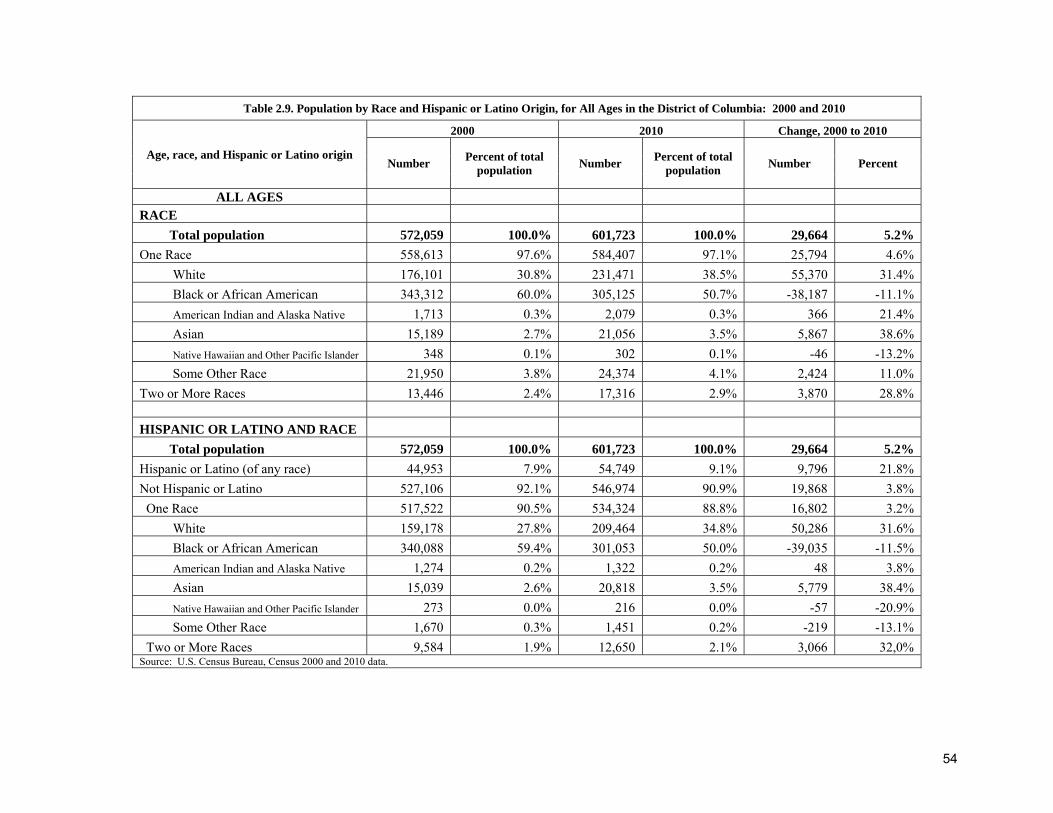
Table 2.9. Population by Race and Hispanic or Latino Origin, for All Ages in the District of Columbia: 2000 and 2010
Age, race, and Hispanic or Latino origin
2000 2010 Change, 2000 to 2010
Number Percent of total population Number Percent of total
population Number Percent
ALL AGES RACE Total population 572,059 100.0% 601,723 100.0% 29,664 5.2% One Race 558,613 97.6% 584,407 97.1% 25,794 4.6% White 176,101 30.8% 231,471 38.5% 55,370 31.4% Black or African American 343,312 60.0% 305,125 50.7% -38,187 -11.1% American Indian and Alaska Native 1,713 0.3% 2,079 0.3% 366 21.4% Asian 15,189 2.7% 21,056 3.5% 5,867 38.6% Native Hawaiian and Other Pacific Islander 348 0.1% 302 0.1% -46 -13.2% Some Other Race 21,950 3.8% 24,374 4.1% 2,424 11.0% Two or More Races 13,446 2.4% 17,316 2.9% 3,870 28.8% HISPANIC OR LATINO AND RACE Total population 572,059 100.0% 601,723 100.0% 29,664 5.2% Hispanic or Latino (of any race) 44,953 7.9% 54,749 9.1% 9,796 21.8% Not Hispanic or Latino 527,106 92.1% 546,974 90.9% 19,868 3.8% One Race 517,522 90.5% 534,324 88.8% 16,802 3.2% White 159,178 27.8% 209,464 34.8% 50,286 31.6% Black or African American 340,088 59.4% 301,053 50.0% -39,035 -11.5% American Indian and Alaska Native 1,274 0.2% 1,322 0.2% 48 3.8% Asian 15,039 2.6% 20,818 3.5% 5,779 38.4% Native Hawaiian and Other Pacific Islander 273 0.0% 216 0.0% -57 -20.9% Some Other Race 1,670 0.3% 1,451 0.2% -219 -13.1% Two or More Races 9,584 1.9% 12,650 2.1% 3,066 32,0% Source: U.S. Census Bureau, Census 2000 and 2010 data.
55
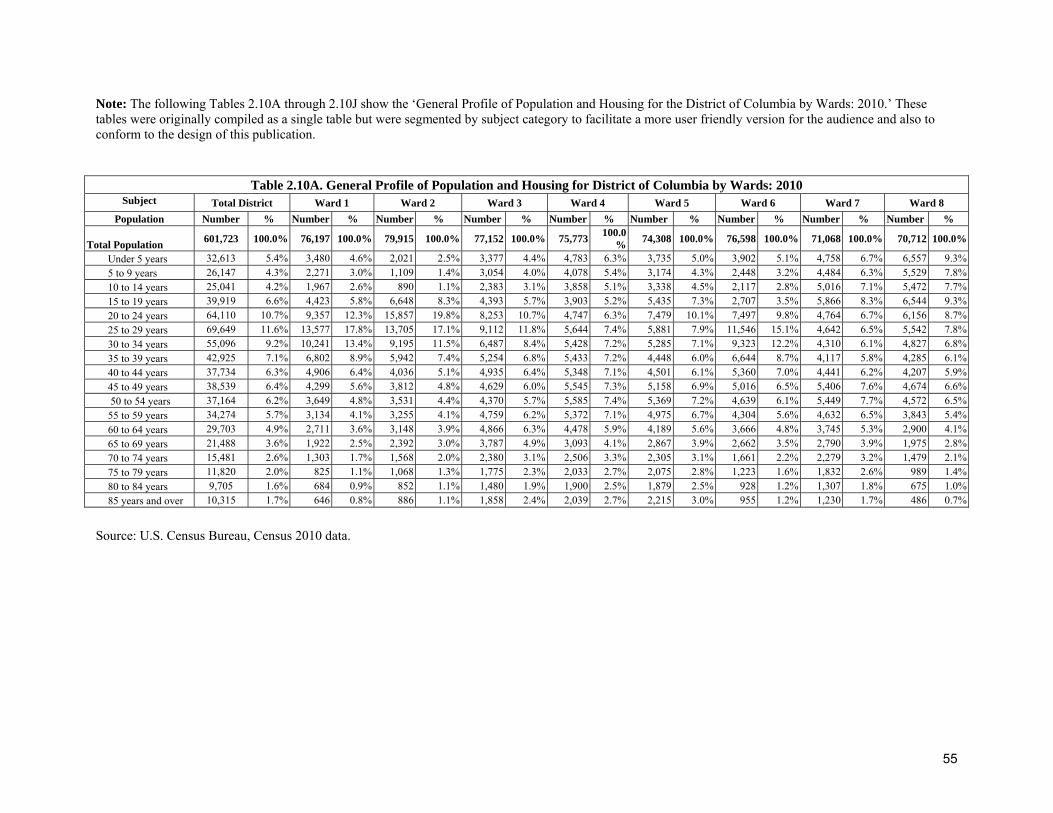
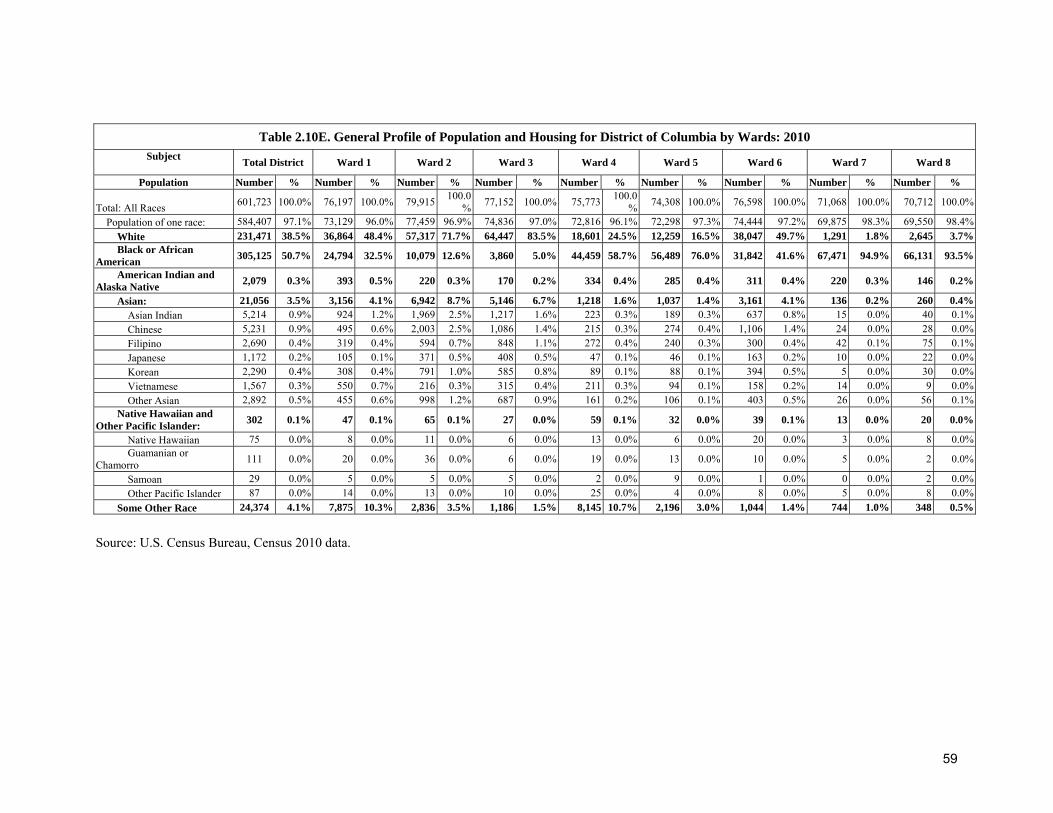
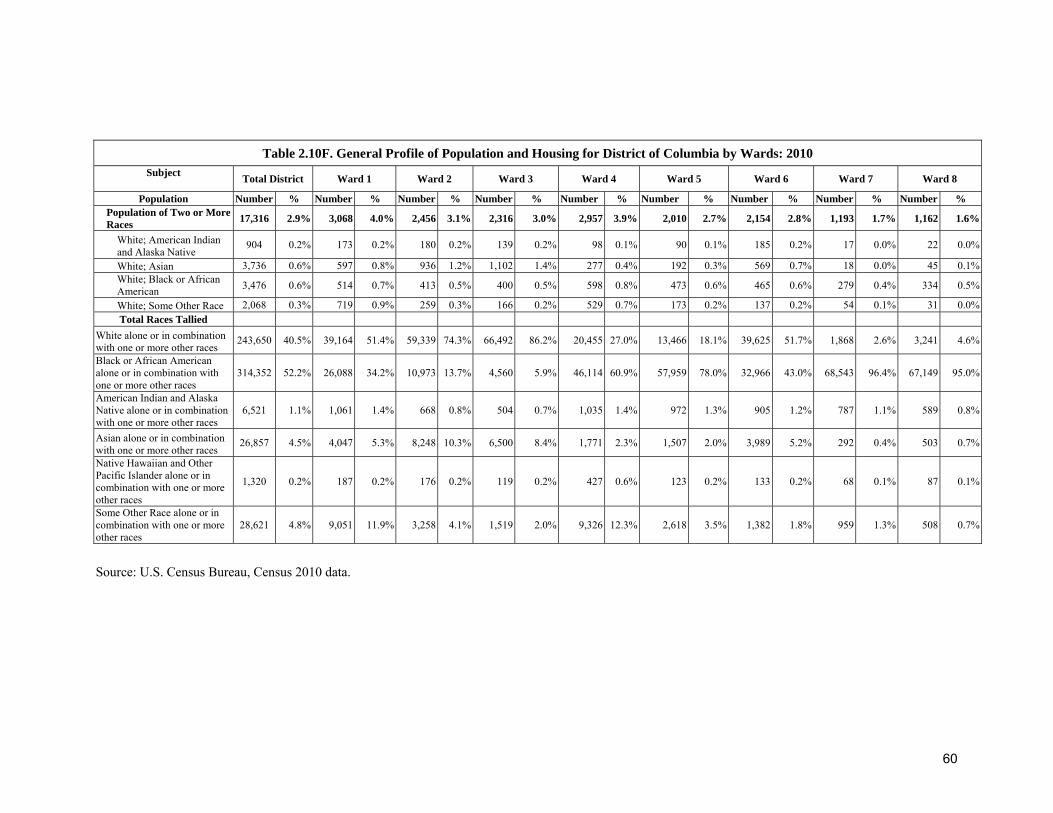
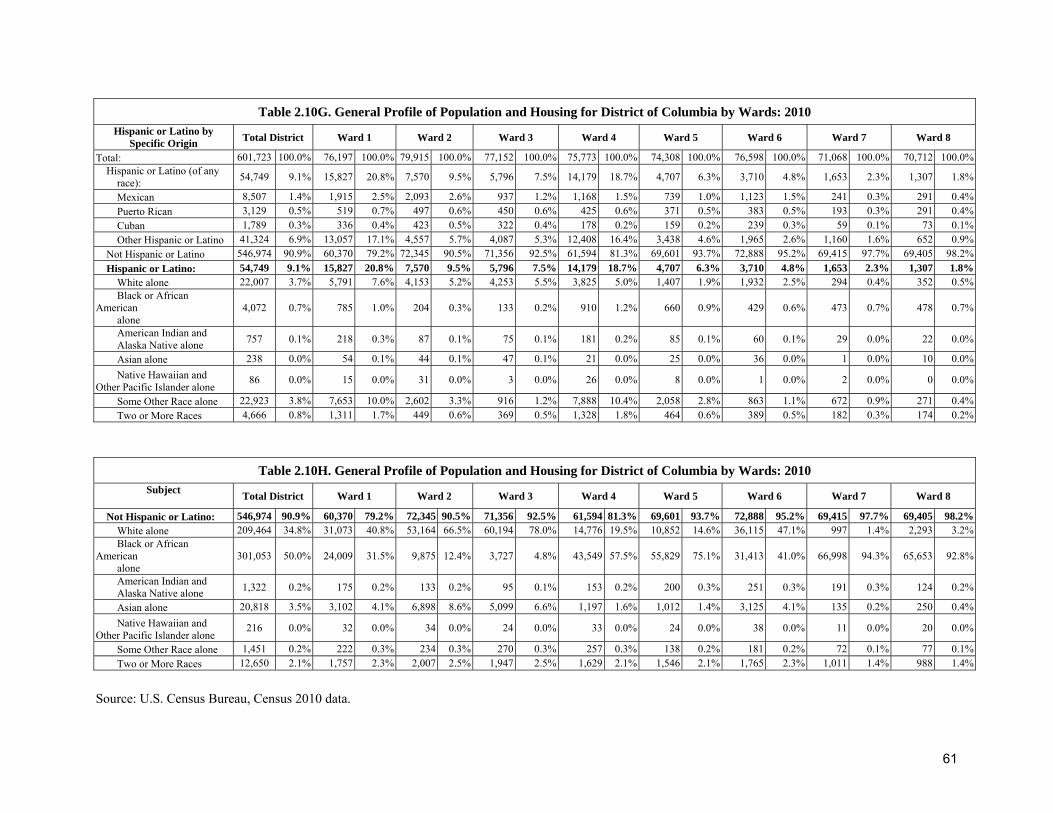
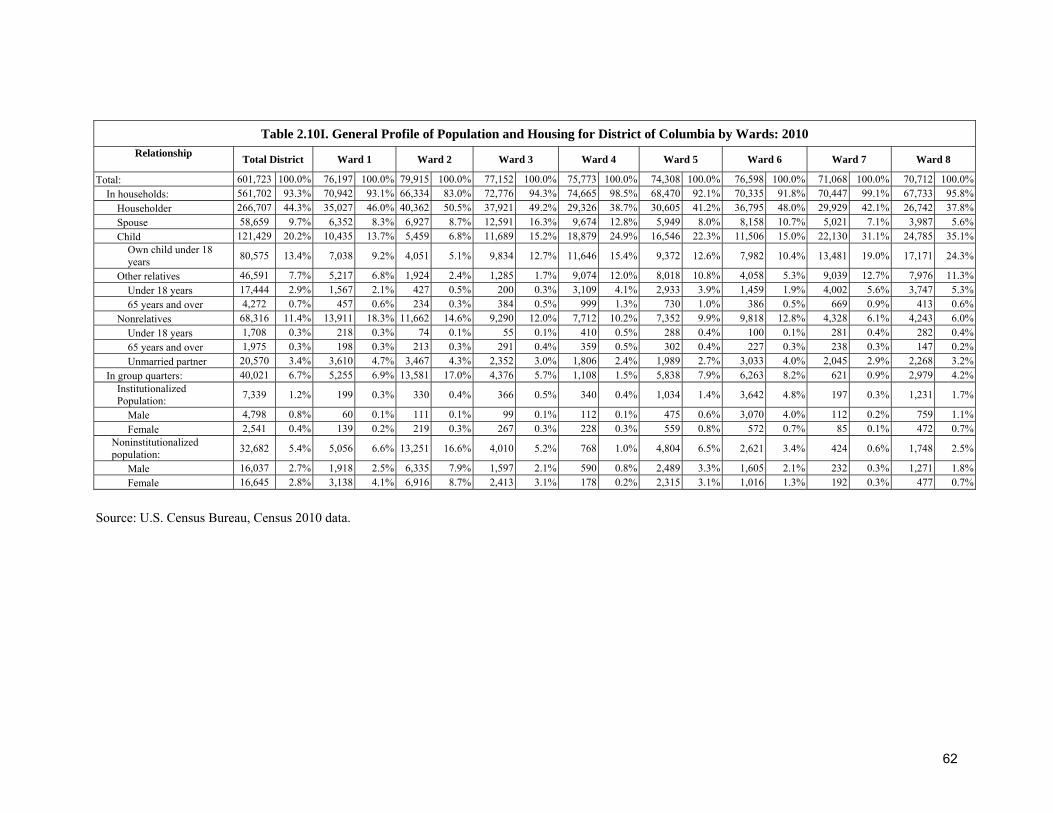
Note: The following Tables 2.10A through 2.10J show the ‘General Profile of Population and Housing for the District of Columbia by Wards: 2010.’ These tables were originally compiled as a single table but were segmented by subject category to facilitate a more user friendly version for the audience and also to conform to the design of this publication.
Source: U.S. Census Bureau, Census 2010 data.
Table 2.10A. General Profile of Population and Housing for District of Columbia by Wards: 2010 Subject Total District Ward 1 Ward 2 Ward 3 Ward 4 Ward 5 Ward 6 Ward 7 Ward 8
Population Number % Number % Number % Number % Number % Number % Number % Number % Number %
Total Population 601,723 100.0% 76,197 100.0% 79,915 100.0% 77,152 100.0% 75,773 100.0% 74,308 100.0% 76,598 100.0% 71,068 100.0% 70,712 100.0%
Under 5 years 32,613 5.4% 3,480 4.6% 2,021 2.5% 3,377 4.4% 4,783 6.3% 3,735 5.0% 3,902 5.1% 4,758 6.7% 6,557 9.3%5 to 9 years 26,147 4.3% 2,271 3.0% 1,109 1.4% 3,054 4.0% 4,078 5.4% 3,174 4.3% 2,448 3.2% 4,484 6.3% 5,529 7.8%10 to 14 years 25,041 4.2% 1,967 2.6% 890 1.1% 2,383 3.1% 3,858 5.1% 3,338 4.5% 2,117 2.8% 5,016 7.1% 5,472 7.7%15 to 19 years 39,919 6.6% 4,423 5.8% 6,648 8.3% 4,393 5.7% 3,903 5.2% 5,435 7.3% 2,707 3.5% 5,866 8.3% 6,544 9.3%20 to 24 years 64,110 10.7% 9,357 12.3% 15,857 19.8% 8,253 10.7% 4,747 6.3% 7,479 10.1% 7,497 9.8% 4,764 6.7% 6,156 8.7%25 to 29 years 69,649 11.6% 13,577 17.8% 13,705 17.1% 9,112 11.8% 5,644 7.4% 5,881 7.9% 11,546 15.1% 4,642 6.5% 5,542 7.8%30 to 34 years 55,096 9.2% 10,241 13.4% 9,195 11.5% 6,487 8.4% 5,428 7.2% 5,285 7.1% 9,323 12.2% 4,310 6.1% 4,827 6.8%35 to 39 years 42,925 7.1% 6,802 8.9% 5,942 7.4% 5,254 6.8% 5,433 7.2% 4,448 6.0% 6,644 8.7% 4,117 5.8% 4,285 6.1%40 to 44 years 37,734 6.3% 4,906 6.4% 4,036 5.1% 4,935 6.4% 5,348 7.1% 4,501 6.1% 5,360 7.0% 4,441 6.2% 4,207 5.9%45 to 49 years 38,539 6.4% 4,299 5.6% 3,812 4.8% 4,629 6.0% 5,545 7.3% 5,158 6.9% 5,016 6.5% 5,406 7.6% 4,674 6.6%
50 to 54 years 37,164 6.2% 3,649 4.8% 3,531 4.4% 4,370 5.7% 5,585 7.4% 5,369 7.2% 4,639 6.1% 5,449 7.7% 4,572 6.5%55 to 59 years 34,274 5.7% 3,134 4.1% 3,255 4.1% 4,759 6.2% 5,372 7.1% 4,975 6.7% 4,304 5.6% 4,632 6.5% 3,843 5.4%60 to 64 years 29,703 4.9% 2,711 3.6% 3,148 3.9% 4,866 6.3% 4,478 5.9% 4,189 5.6% 3,666 4.8% 3,745 5.3% 2,900 4.1%65 to 69 years 21,488 3.6% 1,922 2.5% 2,392 3.0% 3,787 4.9% 3,093 4.1% 2,867 3.9% 2,662 3.5% 2,790 3.9% 1,975 2.8%70 to 74 years 15,481 2.6% 1,303 1.7% 1,568 2.0% 2,380 3.1% 2,506 3.3% 2,305 3.1% 1,661 2.2% 2,279 3.2% 1,479 2.1%75 to 79 years 11,820 2.0% 825 1.1% 1,068 1.3% 1,775 2.3% 2,033 2.7% 2,075 2.8% 1,223 1.6% 1,832 2.6% 989 1.4%80 to 84 years 9,705 1.6% 684 0.9% 852 1.1% 1,480 1.9% 1,900 2.5% 1,879 2.5% 928 1.2% 1,307 1.8% 675 1.0%85 years and over 10,315 1.7% 646 0.8% 886 1.1% 1,858 2.4% 2,039 2.7% 2,215 3.0% 955 1.2% 1,230 1.7% 486 0.7%
56
Source: U.S. Census Bureau, Census 2010 data.
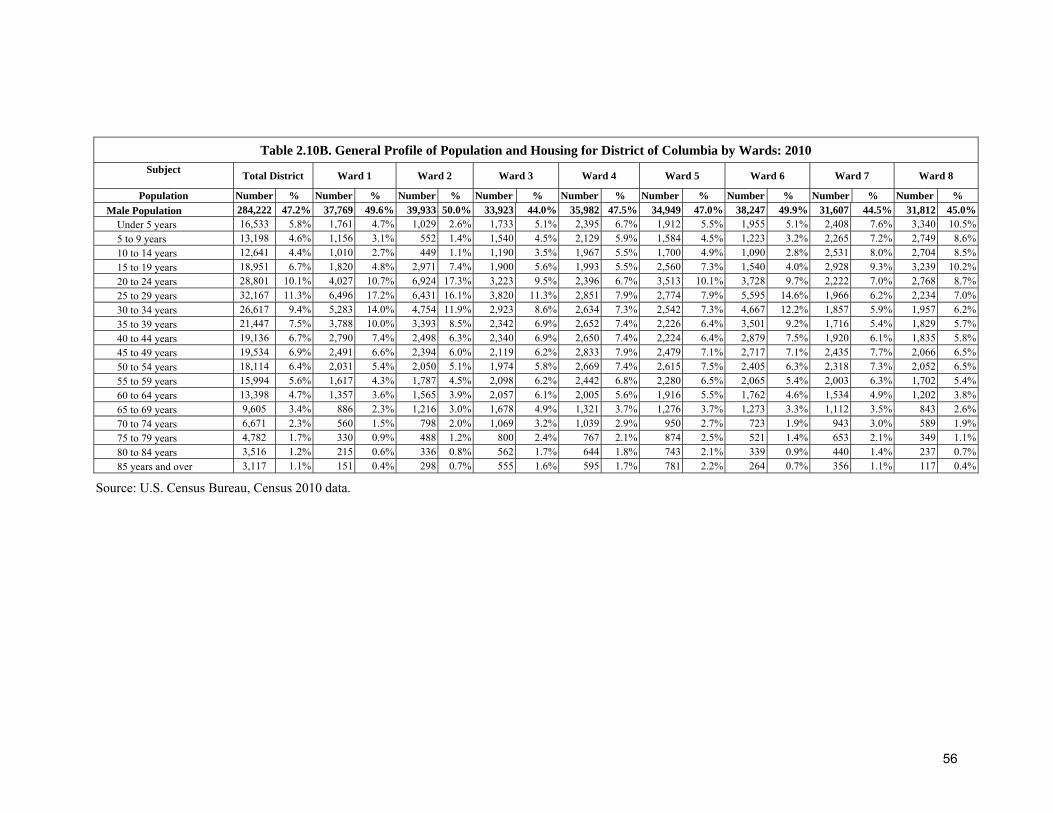
Table 2.10B. General Profile of Population and Housing for District of Columbia by Wards: 2010 Subject Total District Ward 1 Ward 2 Ward 3 Ward 4 Ward 5 Ward 6 Ward 7 Ward 8
Population Number % Number % Number % Number % Number % Number % Number % Number % Number % Male Population 284,222 47.2% 37,769 49.6% 39,933 50.0% 33,923 44.0% 35,982 47.5% 34,949 47.0% 38,247 49.9% 31,607 44.5% 31,812 45.0%
Under 5 years 16,533 5.8% 1,761 4.7% 1,029 2.6% 1,733 5.1% 2,395 6.7% 1,912 5.5% 1,955 5.1% 2,408 7.6% 3,340 10.5%5 to 9 years 13,198 4.6% 1,156 3.1% 552 1.4% 1,540 4.5% 2,129 5.9% 1,584 4.5% 1,223 3.2% 2,265 7.2% 2,749 8.6%10 to 14 years 12,641 4.4% 1,010 2.7% 449 1.1% 1,190 3.5% 1,967 5.5% 1,700 4.9% 1,090 2.8% 2,531 8.0% 2,704 8.5%15 to 19 years 18,951 6.7% 1,820 4.8% 2,971 7.4% 1,900 5.6% 1,993 5.5% 2,560 7.3% 1,540 4.0% 2,928 9.3% 3,239 10.2%20 to 24 years 28,801 10.1% 4,027 10.7% 6,924 17.3% 3,223 9.5% 2,396 6.7% 3,513 10.1% 3,728 9.7% 2,222 7.0% 2,768 8.7%25 to 29 years 32,167 11.3% 6,496 17.2% 6,431 16.1% 3,820 11.3% 2,851 7.9% 2,774 7.9% 5,595 14.6% 1,966 6.2% 2,234 7.0%30 to 34 years 26,617 9.4% 5,283 14.0% 4,754 11.9% 2,923 8.6% 2,634 7.3% 2,542 7.3% 4,667 12.2% 1,857 5.9% 1,957 6.2%35 to 39 years 21,447 7.5% 3,788 10.0% 3,393 8.5% 2,342 6.9% 2,652 7.4% 2,226 6.4% 3,501 9.2% 1,716 5.4% 1,829 5.7%40 to 44 years 19,136 6.7% 2,790 7.4% 2,498 6.3% 2,340 6.9% 2,650 7.4% 2,224 6.4% 2,879 7.5% 1,920 6.1% 1,835 5.8%45 to 49 years 19,534 6.9% 2,491 6.6% 2,394 6.0% 2,119 6.2% 2,833 7.9% 2,479 7.1% 2,717 7.1% 2,435 7.7% 2,066 6.5%50 to 54 years 18,114 6.4% 2,031 5.4% 2,050 5.1% 1,974 5.8% 2,669 7.4% 2,615 7.5% 2,405 6.3% 2,318 7.3% 2,052 6.5%55 to 59 years 15,994 5.6% 1,617 4.3% 1,787 4.5% 2,098 6.2% 2,442 6.8% 2,280 6.5% 2,065 5.4% 2,003 6.3% 1,702 5.4%60 to 64 years 13,398 4.7% 1,357 3.6% 1,565 3.9% 2,057 6.1% 2,005 5.6% 1,916 5.5% 1,762 4.6% 1,534 4.9% 1,202 3.8%65 to 69 years 9,605 3.4% 886 2.3% 1,216 3.0% 1,678 4.9% 1,321 3.7% 1,276 3.7% 1,273 3.3% 1,112 3.5% 843 2.6%70 to 74 years 6,671 2.3% 560 1.5% 798 2.0% 1,069 3.2% 1,039 2.9% 950 2.7% 723 1.9% 943 3.0% 589 1.9%75 to 79 years 4,782 1.7% 330 0.9% 488 1.2% 800 2.4% 767 2.1% 874 2.5% 521 1.4% 653 2.1% 349 1.1%80 to 84 years 3,516 1.2% 215 0.6% 336 0.8% 562 1.7% 644 1.8% 743 2.1% 339 0.9% 440 1.4% 237 0.7%85 years and over 3,117 1.1% 151 0.4% 298 0.7% 555 1.6% 595 1.7% 781 2.2% 264 0.7% 356 1.1% 117 0.4%
57
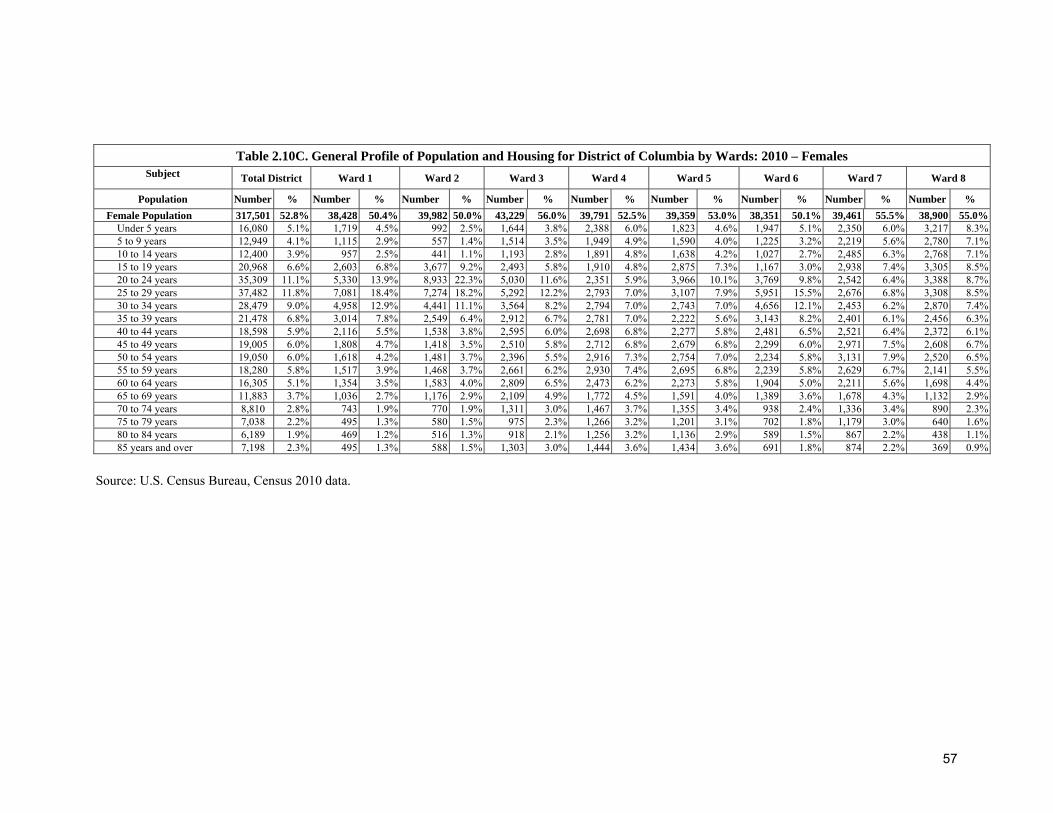
Table 2.10C. General Profile of Population and Housing for District of Columbia by Wards: 2010 – Females Subject Total District Ward 1 Ward 2 Ward 3 Ward 4 Ward 5 Ward 6 Ward 7 Ward 8
Population Number % Number % Number % Number % Number % Number % Number % Number % Number % Female Population 317,501 52.8% 38,428 50.4% 39,982 50.0% 43,229 56.0% 39,791 52.5% 39,359 53.0% 38,351 50.1% 39,461 55.5% 38,900 55.0%
Under 5 years 16,080 5.1% 1,719 4.5% 992 2.5% 1,644 3.8% 2,388 6.0% 1,823 4.6% 1,947 5.1% 2,350 6.0% 3,217 8.3% 5 to 9 years 12,949 4.1% 1,115 2.9% 557 1.4% 1,514 3.5% 1,949 4.9% 1,590 4.0% 1,225 3.2% 2,219 5.6% 2,780 7.1% 10 to 14 years 12,400 3.9% 957 2.5% 441 1.1% 1,193 2.8% 1,891 4.8% 1,638 4.2% 1,027 2.7% 2,485 6.3% 2,768 7.1% 15 to 19 years 20,968 6.6% 2,603 6.8% 3,677 9.2% 2,493 5.8% 1,910 4.8% 2,875 7.3% 1,167 3.0% 2,938 7.4% 3,305 8.5% 20 to 24 years 35,309 11.1% 5,330 13.9% 8,933 22.3% 5,030 11.6% 2,351 5.9% 3,966 10.1% 3,769 9.8% 2,542 6.4% 3,388 8.7% 25 to 29 years 37,482 11.8% 7,081 18.4% 7,274 18.2% 5,292 12.2% 2,793 7.0% 3,107 7.9% 5,951 15.5% 2,676 6.8% 3,308 8.5% 30 to 34 years 28,479 9.0% 4,958 12.9% 4,441 11.1% 3,564 8.2% 2,794 7.0% 2,743 7.0% 4,656 12.1% 2,453 6.2% 2,870 7.4% 35 to 39 years 21,478 6.8% 3,014 7.8% 2,549 6.4% 2,912 6.7% 2,781 7.0% 2,222 5.6% 3,143 8.2% 2,401 6.1% 2,456 6.3% 40 to 44 years 18,598 5.9% 2,116 5.5% 1,538 3.8% 2,595 6.0% 2,698 6.8% 2,277 5.8% 2,481 6.5% 2,521 6.4% 2,372 6.1% 45 to 49 years 19,005 6.0% 1,808 4.7% 1,418 3.5% 2,510 5.8% 2,712 6.8% 2,679 6.8% 2,299 6.0% 2,971 7.5% 2,608 6.7% 50 to 54 years 19,050 6.0% 1,618 4.2% 1,481 3.7% 2,396 5.5% 2,916 7.3% 2,754 7.0% 2,234 5.8% 3,131 7.9% 2,520 6.5% 55 to 59 years 18,280 5.8% 1,517 3.9% 1,468 3.7% 2,661 6.2% 2,930 7.4% 2,695 6.8% 2,239 5.8% 2,629 6.7% 2,141 5.5% 60 to 64 years 16,305 5.1% 1,354 3.5% 1,583 4.0% 2,809 6.5% 2,473 6.2% 2,273 5.8% 1,904 5.0% 2,211 5.6% 1,698 4.4% 65 to 69 years 11,883 3.7% 1,036 2.7% 1,176 2.9% 2,109 4.9% 1,772 4.5% 1,591 4.0% 1,389 3.6% 1,678 4.3% 1,132 2.9% 70 to 74 years 8,810 2.8% 743 1.9% 770 1.9% 1,311 3.0% 1,467 3.7% 1,355 3.4% 938 2.4% 1,336 3.4% 890 2.3% 75 to 79 years 7,038 2.2% 495 1.3% 580 1.5% 975 2.3% 1,266 3.2% 1,201 3.1% 702 1.8% 1,179 3.0% 640 1.6% 80 to 84 years 6,189 1.9% 469 1.2% 516 1.3% 918 2.1% 1,256 3.2% 1,136 2.9% 589 1.5% 867 2.2% 438 1.1% 85 years and over 7,198 2.3% 495 1.3% 588 1.5% 1,303 3.0% 1,444 3.6% 1,434 3.6% 691 1.8% 874 2.2% 369 0.9%
Source: U.S. Census Bureau, Census 2010 data.
58
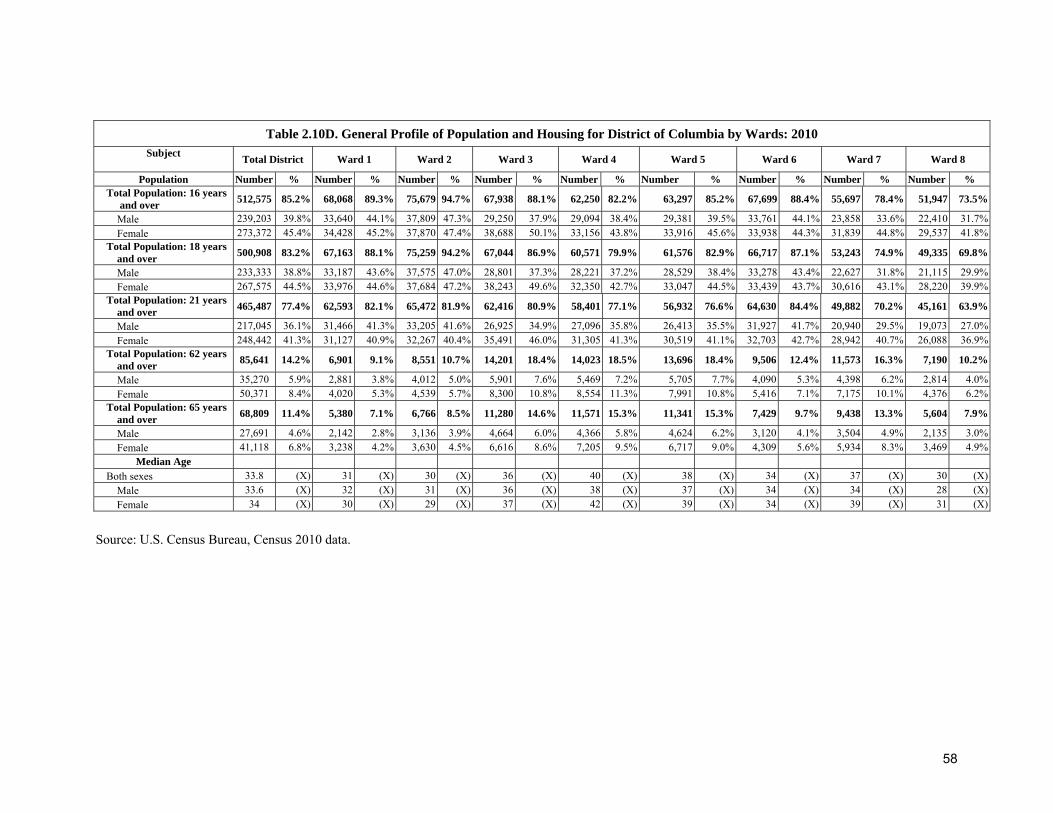
Table 2.10D. General Profile of Population and Housing for District of Columbia by Wards: 2010 Subject Total District Ward 1 Ward 2 Ward 3 Ward 4 Ward 5 Ward 6 Ward 7 Ward 8
Population Number % Number % Number % Number % Number % Number % Number % Number % Number % Total Population: 16 years and over 512,575 85.2% 68,068 89.3% 75,679 94.7% 67,938 88.1% 62,250 82.2% 63,297 85.2% 67,699 88.4% 55,697 78.4% 51,947 73.5%
Male 239,203 39.8% 33,640 44.1% 37,809 47.3% 29,250 37.9% 29,094 38.4% 29,381 39.5% 33,761 44.1% 23,858 33.6% 22,410 31.7% Female 273,372 45.4% 34,428 45.2% 37,870 47.4% 38,688 50.1% 33,156 43.8% 33,916 45.6% 33,938 44.3% 31,839 44.8% 29,537 41.8%
Total Population: 18 years and over 500,908 83.2% 67,163 88.1% 75,259 94.2% 67,044 86.9% 60,571 79.9% 61,576 82.9% 66,717 87.1% 53,243 74.9% 49,335 69.8%
Male 233,333 38.8% 33,187 43.6% 37,575 47.0% 28,801 37.3% 28,221 37.2% 28,529 38.4% 33,278 43.4% 22,627 31.8% 21,115 29.9% Female 267,575 44.5% 33,976 44.6% 37,684 47.2% 38,243 49.6% 32,350 42.7% 33,047 44.5% 33,439 43.7% 30,616 43.1% 28,220 39.9%
Total Population: 21 years and over 465,487 77.4% 62,593 82.1% 65,472 81.9% 62,416 80.9% 58,401 77.1% 56,932 76.6% 64,630 84.4% 49,882 70.2% 45,161 63.9%
Male 217,045 36.1% 31,466 41.3% 33,205 41.6% 26,925 34.9% 27,096 35.8% 26,413 35.5% 31,927 41.7% 20,940 29.5% 19,073 27.0% Female 248,442 41.3% 31,127 40.9% 32,267 40.4% 35,491 46.0% 31,305 41.3% 30,519 41.1% 32,703 42.7% 28,942 40.7% 26,088 36.9%
Total Population: 62 years and over 85,641 14.2% 6,901 9.1% 8,551 10.7% 14,201 18.4% 14,023 18.5% 13,696 18.4% 9,506 12.4% 11,573 16.3% 7,190 10.2%
Male 35,270 5.9% 2,881 3.8% 4,012 5.0% 5,901 7.6% 5,469 7.2% 5,705 7.7% 4,090 5.3% 4,398 6.2% 2,814 4.0% Female 50,371 8.4% 4,020 5.3% 4,539 5.7% 8,300 10.8% 8,554 11.3% 7,991 10.8% 5,416 7.1% 7,175 10.1% 4,376 6.2%
Total Population: 65 years and over 68,809 11.4% 5,380 7.1% 6,766 8.5% 11,280 14.6% 11,571 15.3% 11,341 15.3% 7,429 9.7% 9,438 13.3% 5,604 7.9%
Male 27,691 4.6% 2,142 2.8% 3,136 3.9% 4,664 6.0% 4,366 5.8% 4,624 6.2% 3,120 4.1% 3,504 4.9% 2,135 3.0% Female 41,118 6.8% 3,238 4.2% 3,630 4.5% 6,616 8.6% 7,205 9.5% 6,717 9.0% 4,309 5.6% 5,934 8.3% 3,469 4.9%
Median Age Both sexes 33.8 (X) 31 (X) 30 (X) 36 (X) 40 (X) 38 (X) 34 (X) 37 (X) 30 (X) Male 33.6 (X) 32 (X) 31 (X) 36 (X) 38 (X) 37 (X) 34 (X) 34 (X) 28 (X) Female 34 (X) 30 (X) 29 (X) 37 (X) 42 (X) 39 (X) 34 (X) 39 (X) 31 (X)
Source: U.S. Census Bureau, Census 2010 data.
59
Table 2.10E. General Profile of Population and Housing for District of Columbia by Wards: 2010 Subject Total District Ward 1 Ward 2 Ward 3 Ward 4 Ward 5 Ward 6 Ward 7 Ward 8
Population Number % Number % Number % Number % Number % Number % Number % Number % Number %
Total: All Races 601,723 100.0% 76,197 100.0% 79,915 100.0% 77,152 100.0% 75,773 100.0
% 74,308 100.0% 76,598 100.0% 71,068 100.0% 70,712 100.0%
Population of one race: 584,407 97.1% 73,129 96.0% 77,459 96.9% 74,836 97.0% 72,816 96.1% 72,298 97.3% 74,444 97.2% 69,875 98.3% 69,550 98.4%White 231,471 38.5% 36,864 48.4% 57,317 71.7% 64,447 83.5% 18,601 24.5% 12,259 16.5% 38,047 49.7% 1,291 1.8% 2,645 3.7%Black or African
American 305,125 50.7% 24,794 32.5% 10,079 12.6% 3,860 5.0% 44,459 58.7% 56,489 76.0% 31,842 41.6% 67,471 94.9% 66,131 93.5%
American Indian and Alaska Native 2,079 0.3% 393 0.5% 220 0.3% 170 0.2% 334 0.4% 285 0.4% 311 0.4% 220 0.3% 146 0.2%
Asian: 21,056 3.5% 3,156 4.1% 6,942 8.7% 5,146 6.7% 1,218 1.6% 1,037 1.4% 3,161 4.1% 136 0.2% 260 0.4%Asian Indian 5,214 0.9% 924 1.2% 1,969 2.5% 1,217 1.6% 223 0.3% 189 0.3% 637 0.8% 15 0.0% 40 0.1%Chinese 5,231 0.9% 495 0.6% 2,003 2.5% 1,086 1.4% 215 0.3% 274 0.4% 1,106 1.4% 24 0.0% 28 0.0%Filipino 2,690 0.4% 319 0.4% 594 0.7% 848 1.1% 272 0.4% 240 0.3% 300 0.4% 42 0.1% 75 0.1%Japanese 1,172 0.2% 105 0.1% 371 0.5% 408 0.5% 47 0.1% 46 0.1% 163 0.2% 10 0.0% 22 0.0%Korean 2,290 0.4% 308 0.4% 791 1.0% 585 0.8% 89 0.1% 88 0.1% 394 0.5% 5 0.0% 30 0.0%Vietnamese 1,567 0.3% 550 0.7% 216 0.3% 315 0.4% 211 0.3% 94 0.1% 158 0.2% 14 0.0% 9 0.0%Other Asian 2,892 0.5% 455 0.6% 998 1.2% 687 0.9% 161 0.2% 106 0.1% 403 0.5% 26 0.0% 56 0.1%
Native Hawaiian and Other Pacific Islander: 302 0.1% 47 0.1% 65 0.1% 27 0.0% 59 0.1% 32 0.0% 39 0.1% 13 0.0% 20 0.0%
Native Hawaiian 75 0.0% 8 0.0% 11 0.0% 6 0.0% 13 0.0% 6 0.0% 20 0.0% 3 0.0% 8 0.0%Guamanian or
Chamorro 111 0.0% 20 0.0% 36 0.0% 6 0.0% 19 0.0% 13 0.0% 10 0.0% 5 0.0% 2 0.0%
Samoan 29 0.0% 5 0.0% 5 0.0% 5 0.0% 2 0.0% 9 0.0% 1 0.0% 0 0.0% 2 0.0%Other Pacific Islander 87 0.0% 14 0.0% 13 0.0% 10 0.0% 25 0.0% 4 0.0% 8 0.0% 5 0.0% 8 0.0%
Some Other Race 24,374 4.1% 7,875 10.3% 2,836 3.5% 1,186 1.5% 8,145 10.7% 2,196 3.0% 1,044 1.4% 744 1.0% 348 0.5%
Source: U.S. Census Bureau, Census 2010 data.
60
Source: U.S. Census Bureau, Census 2010 data.
Table 2.10F. General Profile of Population and Housing for District of Columbia by Wards: 2010 Subject Total District Ward 1 Ward 2 Ward 3 Ward 4 Ward 5 Ward 6 Ward 7 Ward 8
Population Number % Number % Number % Number % Number % Number % Number % Number % Number % Population of Two or More Races 17,316 2.9% 3,068 4.0% 2,456 3.1% 2,316 3.0% 2,957 3.9% 2,010 2.7% 2,154 2.8% 1,193 1.7% 1,162 1.6%
White; American Indian and Alaska Native
904 0.2% 173 0.2% 180 0.2% 139 0.2% 98 0.1% 90 0.1% 185 0.2% 17 0.0% 22 0.0%
White; Asian 3,736 0.6% 597 0.8% 936 1.2% 1,102 1.4% 277 0.4% 192 0.3% 569 0.7% 18 0.0% 45 0.1%White; Black or African American 3,476 0.6% 514 0.7% 413 0.5% 400 0.5% 598 0.8% 473 0.6% 465 0.6% 279 0.4% 334 0.5%
White; Some Other Race 2,068 0.3% 719 0.9% 259 0.3% 166 0.2% 529 0.7% 173 0.2% 137 0.2% 54 0.1% 31 0.0%Total Races Tallied
White alone or in combination with one or more other races
243,650 40.5% 39,164 51.4% 59,339 74.3% 66,492 86.2% 20,455 27.0% 13,466 18.1% 39,625 51.7% 1,868 2.6% 3,241 4.6%
Black or African American alone or in combination with one or more other races
314,352 52.2% 26,088 34.2% 10,973 13.7% 4,560 5.9% 46,114 60.9% 57,959 78.0% 32,966 43.0% 68,543 96.4% 67,149 95.0%
American Indian and Alaska Native alone or in combination with one or more other races
6,521 1.1% 1,061 1.4% 668 0.8% 504 0.7% 1,035 1.4% 972 1.3% 905 1.2% 787 1.1% 589 0.8%
Asian alone or in combination with one or more other races
26,857 4.5% 4,047 5.3% 8,248 10.3% 6,500 8.4% 1,771 2.3% 1,507 2.0% 3,989 5.2% 292 0.4% 503 0.7%
Native Hawaiian and Other Pacific Islander alone or in combination with one or more other races
1,320 0.2% 187 0.2% 176 0.2% 119 0.2% 427 0.6% 123 0.2% 133 0.2% 68 0.1% 87 0.1%
Some Other Race alone or in combination with one or more other races
28,621 4.8% 9,051 11.9% 3,258 4.1% 1,519 2.0% 9,326 12.3% 2,618 3.5% 1,382 1.8% 959 1.3% 508 0.7%
61
Source: U.S. Census Bureau, Census 2010 data.
Table 2.10G. General Profile of Population and Housing for District of Columbia by Wards: 2010 Hispanic or Latino by
Specific Origin Total District Ward 1 Ward 2 Ward 3 Ward 4 Ward 5 Ward 6 Ward 7 Ward 8
Total: 601,723 100.0% 76,197 100.0% 79,915 100.0% 77,152 100.0% 75,773 100.0% 74,308 100.0% 76,598 100.0% 71,068 100.0% 70,712 100.0%Hispanic or Latino (of any race): 54,749 9.1% 15,827 20.8% 7,570 9.5% 5,796 7.5% 14,179 18.7% 4,707 6.3% 3,710 4.8% 1,653 2.3% 1,307 1.8%
Mexican 8,507 1.4% 1,915 2.5% 2,093 2.6% 937 1.2% 1,168 1.5% 739 1.0% 1,123 1.5% 241 0.3% 291 0.4%Puerto Rican 3,129 0.5% 519 0.7% 497 0.6% 450 0.6% 425 0.6% 371 0.5% 383 0.5% 193 0.3% 291 0.4%Cuban 1,789 0.3% 336 0.4% 423 0.5% 322 0.4% 178 0.2% 159 0.2% 239 0.3% 59 0.1% 73 0.1%Other Hispanic or Latino 41,324 6.9% 13,057 17.1% 4,557 5.7% 4,087 5.3% 12,408 16.4% 3,438 4.6% 1,965 2.6% 1,160 1.6% 652 0.9%
Not Hispanic or Latino 546,974 90.9% 60,370 79.2% 72,345 90.5% 71,356 92.5% 61,594 81.3% 69,601 93.7% 72,888 95.2% 69,415 97.7% 69,405 98.2%Hispanic or Latino: 54,749 9.1% 15,827 20.8% 7,570 9.5% 5,796 7.5% 14,179 18.7% 4,707 6.3% 3,710 4.8% 1,653 2.3% 1,307 1.8%
White alone 22,007 3.7% 5,791 7.6% 4,153 5.2% 4,253 5.5% 3,825 5.0% 1,407 1.9% 1,932 2.5% 294 0.4% 352 0.5%Black or African
American alone
4,072 0.7% 785 1.0% 204 0.3% 133 0.2% 910 1.2% 660 0.9% 429 0.6% 473 0.7% 478 0.7%
American Indian and Alaska Native alone 757 0.1% 218 0.3% 87 0.1% 75 0.1% 181 0.2% 85 0.1% 60 0.1% 29 0.0% 22 0.0%
Asian alone 238 0.0% 54 0.1% 44 0.1% 47 0.1% 21 0.0% 25 0.0% 36 0.0% 1 0.0% 10 0.0%Native Hawaiian and
Other Pacific Islander alone 86 0.0% 15 0.0% 31 0.0% 3 0.0% 26 0.0% 8 0.0% 1 0.0% 2 0.0% 0 0.0%
Some Other Race alone 22,923 3.8% 7,653 10.0% 2,602 3.3% 916 1.2% 7,888 10.4% 2,058 2.8% 863 1.1% 672 0.9% 271 0.4%Two or More Races 4,666 0.8% 1,311 1.7% 449 0.6% 369 0.5% 1,328 1.8% 464 0.6% 389 0.5% 182 0.3% 174 0.2%
Table 2.10H. General Profile of Population and Housing for District of Columbia by Wards: 2010 Subject Total District Ward 1 Ward 2 Ward 3 Ward 4 Ward 5 Ward 6 Ward 7 Ward 8
Not Hispanic or Latino: 546,974 90.9% 60,370 79.2% 72,345 90.5% 71,356 92.5% 61,594 81.3% 69,601 93.7% 72,888 95.2% 69,415 97.7% 69,405 98.2%White alone 209,464 34.8% 31,073 40.8% 53,164 66.5% 60,194 78.0% 14,776 19.5% 10,852 14.6% 36,115 47.1% 997 1.4% 2,293 3.2%Black or African
American alone
301,053 50.0% 24,009 31.5% 9,875 12.4% 3,727 4.8% 43,549 57.5% 55,829 75.1% 31,413 41.0% 66,998 94.3% 65,653 92.8%
American Indian and Alaska Native alone 1,322 0.2% 175 0.2% 133 0.2% 95 0.1% 153 0.2% 200 0.3% 251 0.3% 191 0.3% 124 0.2%
Asian alone 20,818 3.5% 3,102 4.1% 6,898 8.6% 5,099 6.6% 1,197 1.6% 1,012 1.4% 3,125 4.1% 135 0.2% 250 0.4%Native Hawaiian and
Other Pacific Islander alone 216 0.0% 32 0.0% 34 0.0% 24 0.0% 33 0.0% 24 0.0% 38 0.0% 11 0.0% 20 0.0%
Some Other Race alone 1,451 0.2% 222 0.3% 234 0.3% 270 0.3% 257 0.3% 138 0.2% 181 0.2% 72 0.1% 77 0.1%Two or More Races 12,650 2.1% 1,757 2.3% 2,007 2.5% 1,947 2.5% 1,629 2.1% 1,546 2.1% 1,765 2.3% 1,011 1.4% 988 1.4%
62
Table 2.10I. General Profile of Population and Housing for District of Columbia by Wards: 2010 Relationship Total District Ward 1 Ward 2 Ward 3 Ward 4 Ward 5 Ward 6 Ward 7 Ward 8
Total: 601,723 100.0% 76,197 100.0% 79,915 100.0% 77,152 100.0% 75,773 100.0% 74,308 100.0% 76,598 100.0% 71,068 100.0% 70,712 100.0%In households: 561,702 93.3% 70,942 93.1% 66,334 83.0% 72,776 94.3% 74,665 98.5% 68,470 92.1% 70,335 91.8% 70,447 99.1% 67,733 95.8%
Householder 266,707 44.3% 35,027 46.0% 40,362 50.5% 37,921 49.2% 29,326 38.7% 30,605 41.2% 36,795 48.0% 29,929 42.1% 26,742 37.8%Spouse 58,659 9.7% 6,352 8.3% 6,927 8.7% 12,591 16.3% 9,674 12.8% 5,949 8.0% 8,158 10.7% 5,021 7.1% 3,987 5.6%Child 121,429 20.2% 10,435 13.7% 5,459 6.8% 11,689 15.2% 18,879 24.9% 16,546 22.3% 11,506 15.0% 22,130 31.1% 24,785 35.1%
Own child under 18 years 80,575 13.4% 7,038 9.2% 4,051 5.1% 9,834 12.7% 11,646 15.4% 9,372 12.6% 7,982 10.4% 13,481 19.0% 17,171 24.3%
Other relatives 46,591 7.7% 5,217 6.8% 1,924 2.4% 1,285 1.7% 9,074 12.0% 8,018 10.8% 4,058 5.3% 9,039 12.7% 7,976 11.3%Under 18 years 17,444 2.9% 1,567 2.1% 427 0.5% 200 0.3% 3,109 4.1% 2,933 3.9% 1,459 1.9% 4,002 5.6% 3,747 5.3%65 years and over 4,272 0.7% 457 0.6% 234 0.3% 384 0.5% 999 1.3% 730 1.0% 386 0.5% 669 0.9% 413 0.6%
Nonrelatives 68,316 11.4% 13,911 18.3% 11,662 14.6% 9,290 12.0% 7,712 10.2% 7,352 9.9% 9,818 12.8% 4,328 6.1% 4,243 6.0%Under 18 years 1,708 0.3% 218 0.3% 74 0.1% 55 0.1% 410 0.5% 288 0.4% 100 0.1% 281 0.4% 282 0.4%65 years and over 1,975 0.3% 198 0.3% 213 0.3% 291 0.4% 359 0.5% 302 0.4% 227 0.3% 238 0.3% 147 0.2%Unmarried partner 20,570 3.4% 3,610 4.7% 3,467 4.3% 2,352 3.0% 1,806 2.4% 1,989 2.7% 3,033 4.0% 2,045 2.9% 2,268 3.2%
In group quarters: 40,021 6.7% 5,255 6.9% 13,581 17.0% 4,376 5.7% 1,108 1.5% 5,838 7.9% 6,263 8.2% 621 0.9% 2,979 4.2%Institutionalized Population: 7,339 1.2% 199 0.3% 330 0.4% 366 0.5% 340 0.4% 1,034 1.4% 3,642 4.8% 197 0.3% 1,231 1.7%
Male 4,798 0.8% 60 0.1% 111 0.1% 99 0.1% 112 0.1% 475 0.6% 3,070 4.0% 112 0.2% 759 1.1%Female 2,541 0.4% 139 0.2% 219 0.3% 267 0.3% 228 0.3% 559 0.8% 572 0.7% 85 0.1% 472 0.7%
Noninstitutionalized population: 32,682 5.4% 5,056 6.6% 13,251 16.6% 4,010 5.2% 768 1.0% 4,804 6.5% 2,621 3.4% 424 0.6% 1,748 2.5%
Male 16,037 2.7% 1,918 2.5% 6,335 7.9% 1,597 2.1% 590 0.8% 2,489 3.3% 1,605 2.1% 232 0.3% 1,271 1.8%Female 16,645 2.8% 3,138 4.1% 6,916 8.7% 2,413 3.1% 178 0.2% 2,315 3.1% 1,016 1.3% 192 0.3% 477 0.7%
Source: U.S. Census Bureau, Census 2010 data.
63
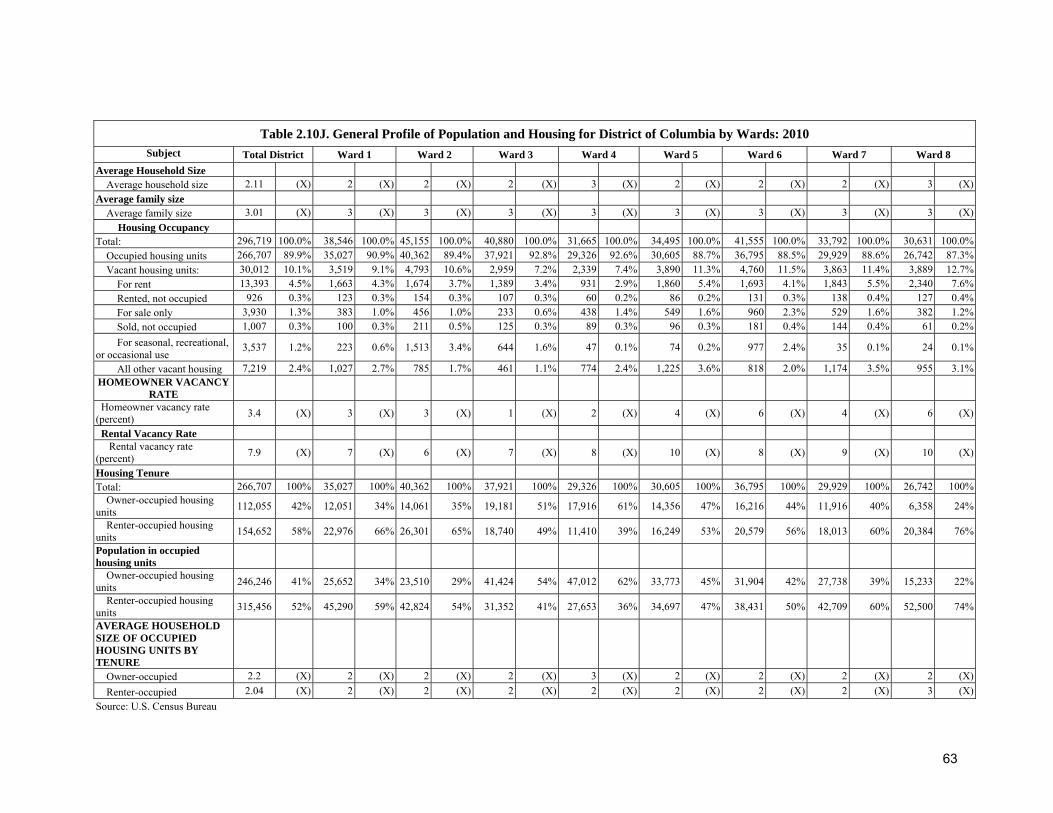
Table 2.10J. General Profile of Population and Housing for District of Columbia by Wards: 2010 Subject Total District Ward 1 Ward 2 Ward 3 Ward 4 Ward 5 Ward 6 Ward 7 Ward 8
Average Household Size Average household size 2.11 (X) 2 (X) 2 (X) 2 (X) 3 (X) 2 (X) 2 (X) 2 (X) 3 (X)Average family size Average family size 3.01 (X) 3 (X) 3 (X) 3 (X) 3 (X) 3 (X) 3 (X) 3 (X) 3 (X)
Housing Occupancy Total: 296,719 100.0% 38,546 100.0% 45,155 100.0% 40,880 100.0% 31,665 100.0% 34,495 100.0% 41,555 100.0% 33,792 100.0% 30,631 100.0%
Occupied housing units 266,707 89.9% 35,027 90.9% 40,362 89.4% 37,921 92.8% 29,326 92.6% 30,605 88.7% 36,795 88.5% 29,929 88.6% 26,742 87.3%Vacant housing units: 30,012 10.1% 3,519 9.1% 4,793 10.6% 2,959 7.2% 2,339 7.4% 3,890 11.3% 4,760 11.5% 3,863 11.4% 3,889 12.7%
For rent 13,393 4.5% 1,663 4.3% 1,674 3.7% 1,389 3.4% 931 2.9% 1,860 5.4% 1,693 4.1% 1,843 5.5% 2,340 7.6%Rented, not occupied 926 0.3% 123 0.3% 154 0.3% 107 0.3% 60 0.2% 86 0.2% 131 0.3% 138 0.4% 127 0.4%For sale only 3,930 1.3% 383 1.0% 456 1.0% 233 0.6% 438 1.4% 549 1.6% 960 2.3% 529 1.6% 382 1.2%Sold, not occupied 1,007 0.3% 100 0.3% 211 0.5% 125 0.3% 89 0.3% 96 0.3% 181 0.4% 144 0.4% 61 0.2%For seasonal, recreational,
or occasional use 3,537 1.2% 223 0.6% 1,513 3.4% 644 1.6% 47 0.1% 74 0.2% 977 2.4% 35 0.1% 24 0.1%
All other vacant housing 7,219 2.4% 1,027 2.7% 785 1.7% 461 1.1% 774 2.4% 1,225 3.6% 818 2.0% 1,174 3.5% 955 3.1%HOMEOWNER VACANCY
RATE
Homeowner vacancy rate (percent) 3.4 (X) 3 (X) 3 (X) 1 (X) 2 (X) 4 (X) 6 (X) 4 (X) 6 (X)
Rental Vacancy Rate Rental vacancy rate (percent) 7.9 (X) 7 (X) 6 (X) 7 (X) 8 (X) 10 (X) 8 (X) 9 (X) 10 (X)
Housing Tenure Total: 266,707 100% 35,027 100% 40,362 100% 37,921 100% 29,326 100% 30,605 100% 36,795 100% 29,929 100% 26,742 100%
Owner-occupied housing units 112,055 42% 12,051 34% 14,061 35% 19,181 51% 17,916 61% 14,356 47% 16,216 44% 11,916 40% 6,358 24%
Renter-occupied housing units 154,652 58% 22,976 66% 26,301 65% 18,740 49% 11,410 39% 16,249 53% 20,579 56% 18,013 60% 20,384 76%
Population in occupied housing units
Owner-occupied housing units 246,246 41% 25,652 34% 23,510 29% 41,424 54% 47,012 62% 33,773 45% 31,904 42% 27,738 39% 15,233 22%
Renter-occupied housing units 315,456 52% 45,290 59% 42,824 54% 31,352 41% 27,653 36% 34,697 47% 38,431 50% 42,709 60% 52,500 74%
AVERAGE HOUSEHOLD SIZE OF OCCUPIED HOUSING UNITS BY TENURE
Owner-occupied 2.2 (X) 2 (X) 2 (X) 2 (X) 3 (X) 2 (X) 2 (X) 2 (X) 2 (X)Renter-occupied 2.04 (X) 2 (X) 2 (X) 2 (X) 2 (X) 2 (X) 2 (X) 2 (X) 3 (X)
Source: U.S. Census Bureau
64
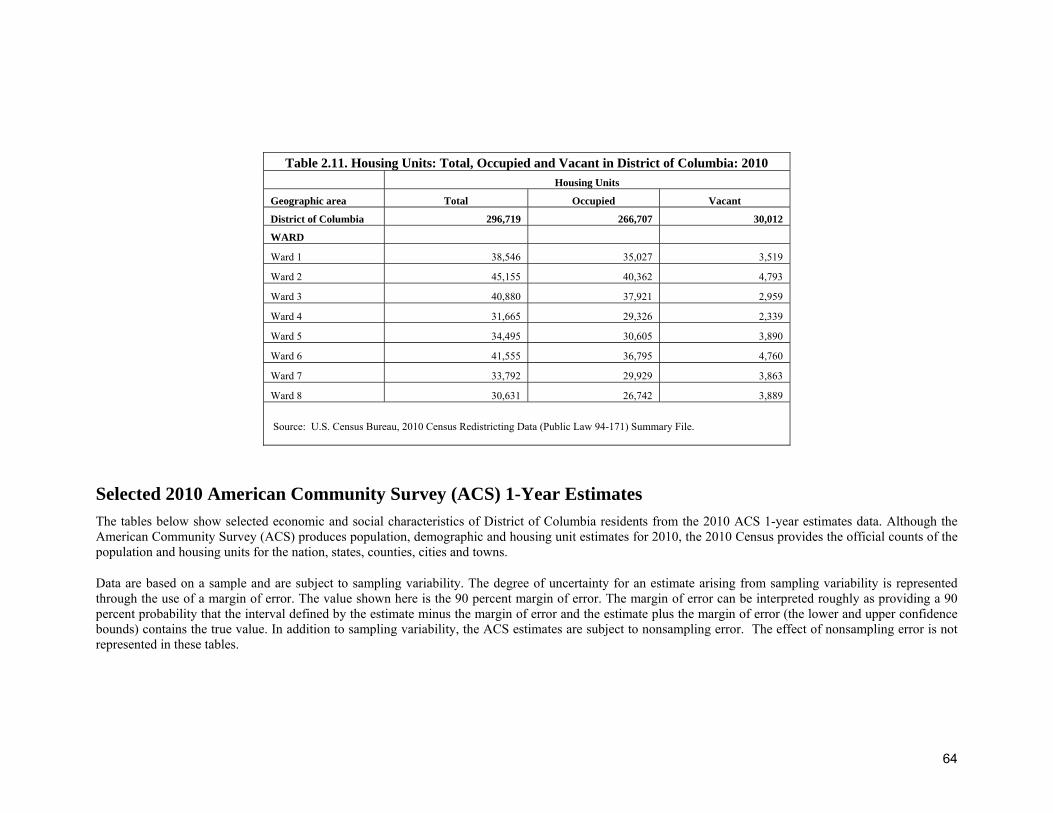
Selected 2010 American Community Survey (ACS) 1-Year Estimates The tables below show selected economic and social characteristics of District of Columbia residents from the 2010 ACS 1-year estimates data. Although the American Community Survey (ACS) produces population, demographic and housing unit estimates for 2010, the 2010 Census provides the official counts of the population and housing units for the nation, states, counties, cities and towns.
Data are based on a sample and are subject to sampling variability. The degree of uncertainty for an estimate arising from sampling variability is represented through the use of a margin of error. The value shown here is the 90 percent margin of error. The margin of error can be interpreted roughly as providing a 90 percent probability that the interval defined by the estimate minus the margin of error and the estimate plus the margin of error (the lower and upper confidence bounds) contains the true value. In addition to sampling variability, the ACS estimates are subject to nonsampling error. The effect of nonsampling error is not represented in these tables.
Table 2.11. Housing Units: Total, Occupied and Vacant in District of Columbia: 2010 Housing Units
Geographic area Total Occupied Vacant
District of Columbia 296,719 266,707 30,012
WARD
Ward 1 38,546 35,027 3,519
Ward 2 45,155 40,362 4,793
Ward 3 40,880 37,921 2,959
Ward 4 31,665 29,326 2,339
Ward 5 34,495 30,605 3,890
Ward 6 41,555 36,795 4,760
Ward 7 33,792 29,929 3,863
Ward 8 30,631 26,742 3,889
Source: U.S. Census Bureau, 2010 Census Redistricting Data (Public Law 94-171) Summary File.
65
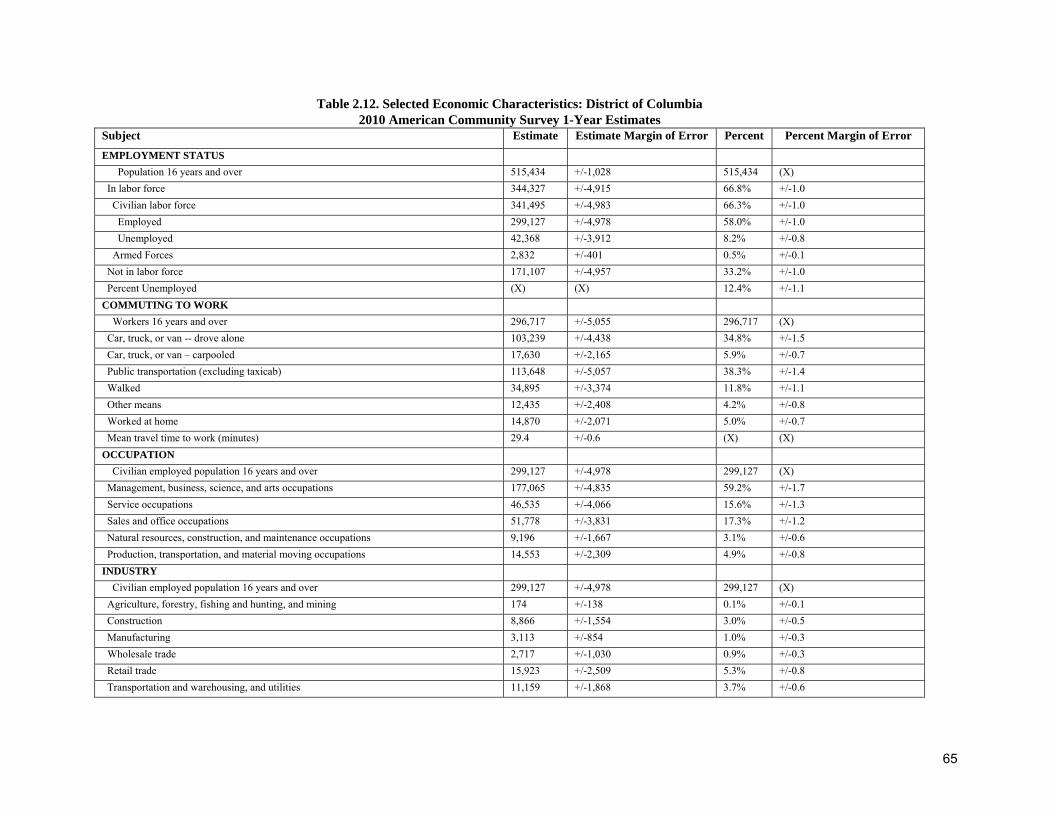
Table 2.12. Selected Economic Characteristics: District of Columbia 2010 American Community Survey 1-Year Estimates
Subject Estimate Estimate Margin of Error Percent Percent Margin of Error EMPLOYMENT STATUS Population 16 years and over 515,434 +/-1,028 515,434 (X) In labor force 344,327 +/-4,915 66.8% +/-1.0 Civilian labor force 341,495 +/-4,983 66.3% +/-1.0 Employed 299,127 +/-4,978 58.0% +/-1.0 Unemployed 42,368 +/-3,912 8.2% +/-0.8 Armed Forces 2,832 +/-401 0.5% +/-0.1 Not in labor force 171,107 +/-4,957 33.2% +/-1.0 Percent Unemployed (X) (X) 12.4% +/-1.1 COMMUTING TO WORK Workers 16 years and over 296,717 +/-5,055 296,717 (X) Car, truck, or van -- drove alone 103,239 +/-4,438 34.8% +/-1.5 Car, truck, or van – carpooled 17,630 +/-2,165 5.9% +/-0.7 Public transportation (excluding taxicab) 113,648 +/-5,057 38.3% +/-1.4 Walked 34,895 +/-3,374 11.8% +/-1.1 Other means 12,435 +/-2,408 4.2% +/-0.8 Worked at home 14,870 +/-2,071 5.0% +/-0.7 Mean travel time to work (minutes) 29.4 +/-0.6 (X) (X) OCCUPATION Civilian employed population 16 years and over 299,127 +/-4,978 299,127 (X) Management, business, science, and arts occupations 177,065 +/-4,835 59.2% +/-1.7 Service occupations 46,535 +/-4,066 15.6% +/-1.3 Sales and office occupations 51,778 +/-3,831 17.3% +/-1.2 Natural resources, construction, and maintenance occupations 9,196 +/-1,667 3.1% +/-0.6 Production, transportation, and material moving occupations 14,553 +/-2,309 4.9% +/-0.8 INDUSTRY Civilian employed population 16 years and over 299,127 +/-4,978 299,127 (X) Agriculture, forestry, fishing and hunting, and mining 174 +/-138 0.1% +/-0.1 Construction 8,866 +/-1,554 3.0% +/-0.5 Manufacturing 3,113 +/-854 1.0% +/-0.3 Wholesale trade 2,717 +/-1,030 0.9% +/-0.3 Retail trade 15,923 +/-2,509 5.3% +/-0.8 Transportation and warehousing, and utilities 11,159 +/-1,868 3.7% +/-0.6
66
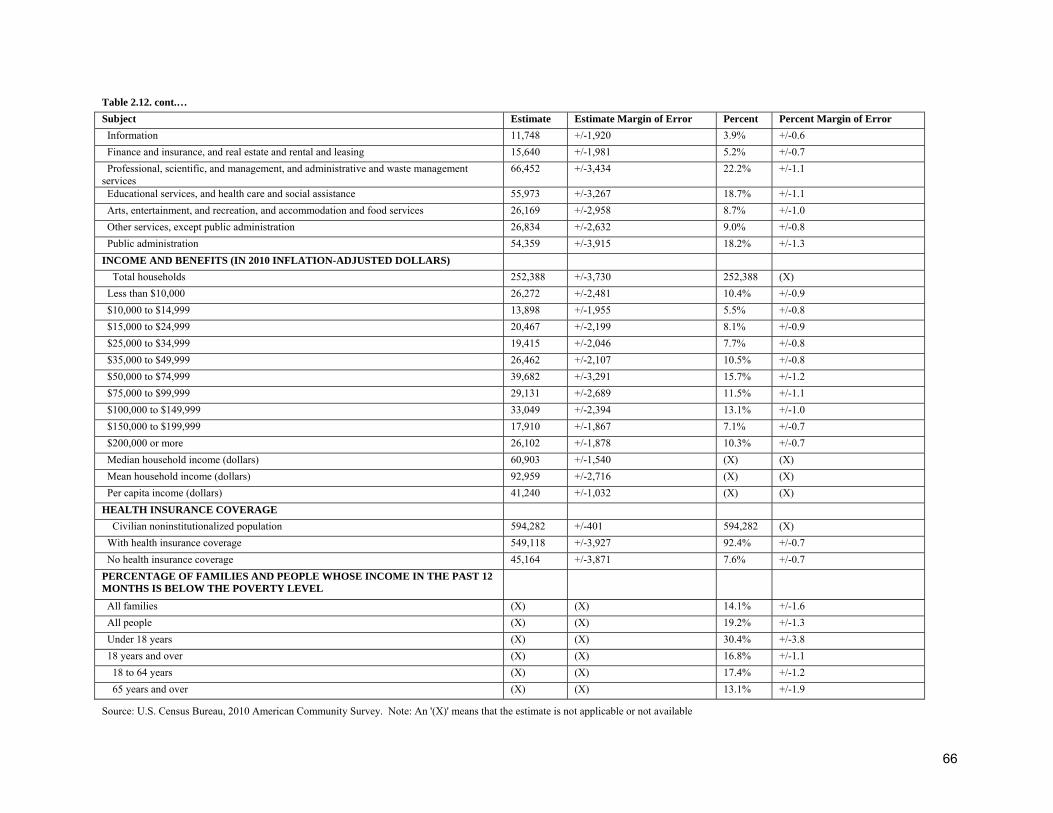
Table 2.12. cont.… Subject Estimate Estimate Margin of Error Percent Percent Margin of Error Information 11,748 +/-1,920 3.9% +/-0.6 Finance and insurance, and real estate and rental and leasing 15,640 +/-1,981 5.2% +/-0.7 Professional, scientific, and management, and administrative and waste management services
66,452 +/-3,434 22.2% +/-1.1
Educational services, and health care and social assistance 55,973 +/-3,267 18.7% +/-1.1 Arts, entertainment, and recreation, and accommodation and food services 26,169 +/-2,958 8.7% +/-1.0 Other services, except public administration 26,834 +/-2,632 9.0% +/-0.8 Public administration 54,359 +/-3,915 18.2% +/-1.3 INCOME AND BENEFITS (IN 2010 INFLATION-ADJUSTED DOLLARS) Total households 252,388 +/-3,730 252,388 (X) Less than $10,000 26,272 +/-2,481 10.4% +/-0.9 $10,000 to $14,999 13,898 +/-1,955 5.5% +/-0.8 $15,000 to $24,999 20,467 +/-2,199 8.1% +/-0.9 $25,000 to $34,999 19,415 +/-2,046 7.7% +/-0.8 $35,000 to $49,999 26,462 +/-2,107 10.5% +/-0.8 $50,000 to $74,999 39,682 +/-3,291 15.7% +/-1.2 $75,000 to $99,999 29,131 +/-2,689 11.5% +/-1.1 $100,000 to $149,999 33,049 +/-2,394 13.1% +/-1.0 $150,000 to $199,999 17,910 +/-1,867 7.1% +/-0.7 $200,000 or more 26,102 +/-1,878 10.3% +/-0.7 Median household income (dollars) 60,903 +/-1,540 (X) (X) Mean household income (dollars) 92,959 +/-2,716 (X) (X) Per capita income (dollars) 41,240 +/-1,032 (X) (X) HEALTH INSURANCE COVERAGE Civilian noninstitutionalized population 594,282 +/-401 594,282 (X) With health insurance coverage 549,118 +/-3,927 92.4% +/-0.7 No health insurance coverage 45,164 +/-3,871 7.6% +/-0.7 PERCENTAGE OF FAMILIES AND PEOPLE WHOSE INCOME IN THE PAST 12 MONTHS IS BELOW THE POVERTY LEVEL
All families (X) (X) 14.1% +/-1.6 All people (X) (X) 19.2% +/-1.3 Under 18 years (X) (X) 30.4% +/-3.8 18 years and over (X) (X) 16.8% +/-1.1 18 to 64 years (X) (X) 17.4% +/-1.2 65 years and over (X) (X) 13.1% +/-1.9
Source: U.S. Census Bureau, 2010 American Community Survey. Note: An '(X)' means that the estimate is not applicable or not available
67
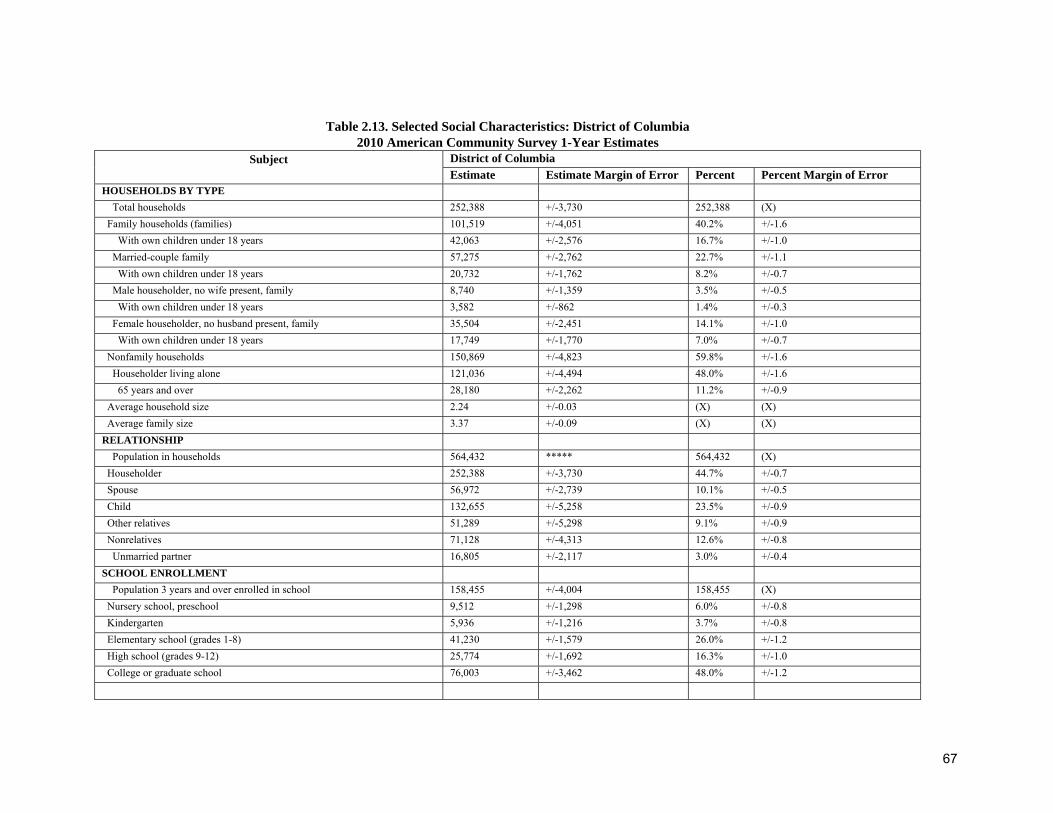
Table 2.13. Selected Social Characteristics: District of Columbia 2010 American Community Survey 1-Year Estimates
Subject District of Columbia Estimate Estimate Margin of Error Percent Percent Margin of Error HOUSEHOLDS BY TYPE Total households 252,388 +/-3,730 252,388 (X) Family households (families) 101,519 +/-4,051 40.2% +/-1.6 With own children under 18 years 42,063 +/-2,576 16.7% +/-1.0 Married-couple family 57,275 +/-2,762 22.7% +/-1.1 With own children under 18 years 20,732 +/-1,762 8.2% +/-0.7 Male householder, no wife present, family 8,740 +/-1,359 3.5% +/-0.5 With own children under 18 years 3,582 +/-862 1.4% +/-0.3 Female householder, no husband present, family 35,504 +/-2,451 14.1% +/-1.0 With own children under 18 years 17,749 +/-1,770 7.0% +/-0.7 Nonfamily households 150,869 +/-4,823 59.8% +/-1.6 Householder living alone 121,036 +/-4,494 48.0% +/-1.6 65 years and over 28,180 +/-2,262 11.2% +/-0.9 Average household size 2.24 +/-0.03 (X) (X) Average family size 3.37 +/-0.09 (X) (X) RELATIONSHIP Population in households 564,432 ***** 564,432 (X) Householder 252,388 +/-3,730 44.7% +/-0.7 Spouse 56,972 +/-2,739 10.1% +/-0.5 Child 132,655 +/-5,258 23.5% +/-0.9 Other relatives 51,289 +/-5,298 9.1% +/-0.9 Nonrelatives 71,128 +/-4,313 12.6% +/-0.8 Unmarried partner 16,805 +/-2,117 3.0% +/-0.4 SCHOOL ENROLLMENT Population 3 years and over enrolled in school 158,455 +/-4,004 158,455 (X) Nursery school, preschool 9,512 +/-1,298 6.0% +/-0.8 Kindergarten 5,936 +/-1,216 3.7% +/-0.8 Elementary school (grades 1-8) 41,230 +/-1,579 26.0% +/-1.2 High school (grades 9-12) 25,774 +/-1,692 16.3% +/-1.0 College or graduate school 76,003 +/-3,462 48.0% +/-1.2
68
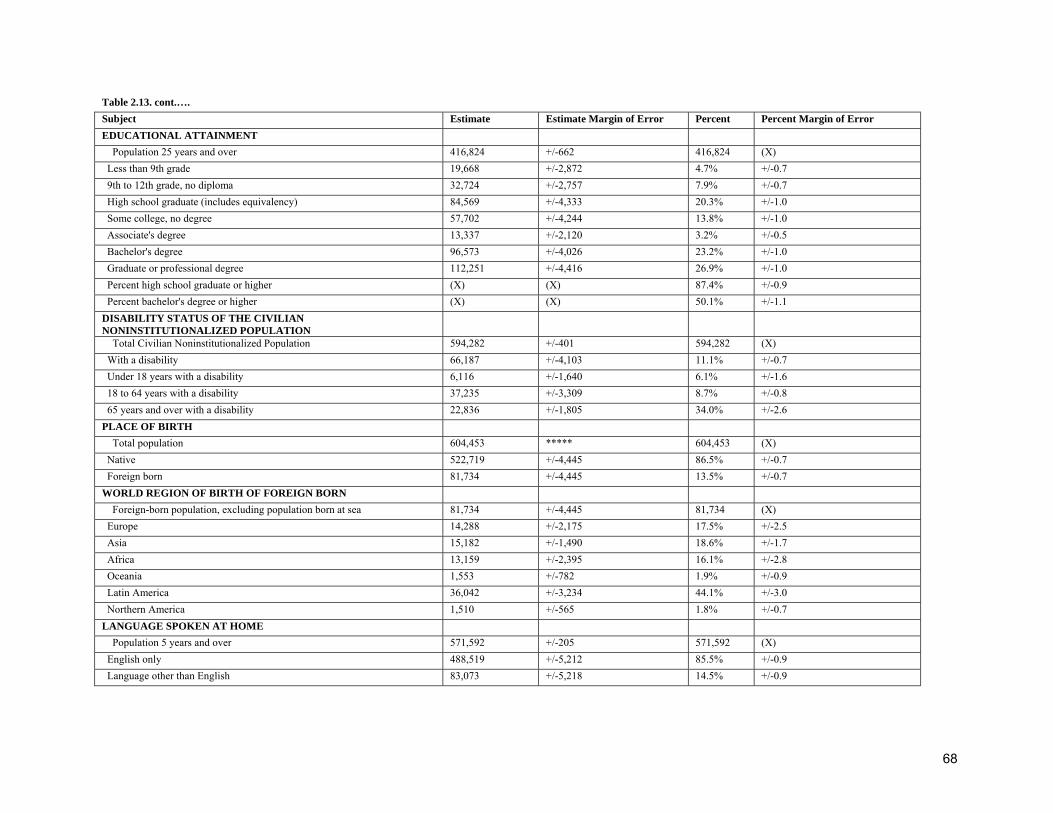
Table 2.13. cont.…. Subject Estimate Estimate Margin of Error Percent Percent Margin of Error EDUCATIONAL ATTAINMENT Population 25 years and over 416,824 +/-662 416,824 (X) Less than 9th grade 19,668 +/-2,872 4.7% +/-0.7 9th to 12th grade, no diploma 32,724 +/-2,757 7.9% +/-0.7 High school graduate (includes equivalency) 84,569 +/-4,333 20.3% +/-1.0 Some college, no degree 57,702 +/-4,244 13.8% +/-1.0 Associate's degree 13,337 +/-2,120 3.2% +/-0.5 Bachelor's degree 96,573 +/-4,026 23.2% +/-1.0 Graduate or professional degree 112,251 +/-4,416 26.9% +/-1.0 Percent high school graduate or higher (X) (X) 87.4% +/-0.9 Percent bachelor's degree or higher (X) (X) 50.1% +/-1.1 DISABILITY STATUS OF THE CIVILIAN NONINSTITUTIONALIZED POPULATION
Total Civilian Noninstitutionalized Population 594,282 +/-401 594,282 (X) With a disability 66,187 +/-4,103 11.1% +/-0.7 Under 18 years with a disability 6,116 +/-1,640 6.1% +/-1.6 18 to 64 years with a disability 37,235 +/-3,309 8.7% +/-0.8 65 years and over with a disability 22,836 +/-1,805 34.0% +/-2.6 PLACE OF BIRTH Total population 604,453 ***** 604,453 (X) Native 522,719 +/-4,445 86.5% +/-0.7 Foreign born 81,734 +/-4,445 13.5% +/-0.7 WORLD REGION OF BIRTH OF FOREIGN BORN Foreign-born population, excluding population born at sea 81,734 +/-4,445 81,734 (X) Europe 14,288 +/-2,175 17.5% +/-2.5 Asia 15,182 +/-1,490 18.6% +/-1.7 Africa 13,159 +/-2,395 16.1% +/-2.8 Oceania 1,553 +/-782 1.9% +/-0.9 Latin America 36,042 +/-3,234 44.1% +/-3.0 Northern America 1,510 +/-565 1.8% +/-0.7 LANGUAGE SPOKEN AT HOME Population 5 years and over 571,592 +/-205 571,592 (X) English only 488,519 +/-5,212 85.5% +/-0.9 Language other than English 83,073 +/-5,218 14.5% +/-0.9
69
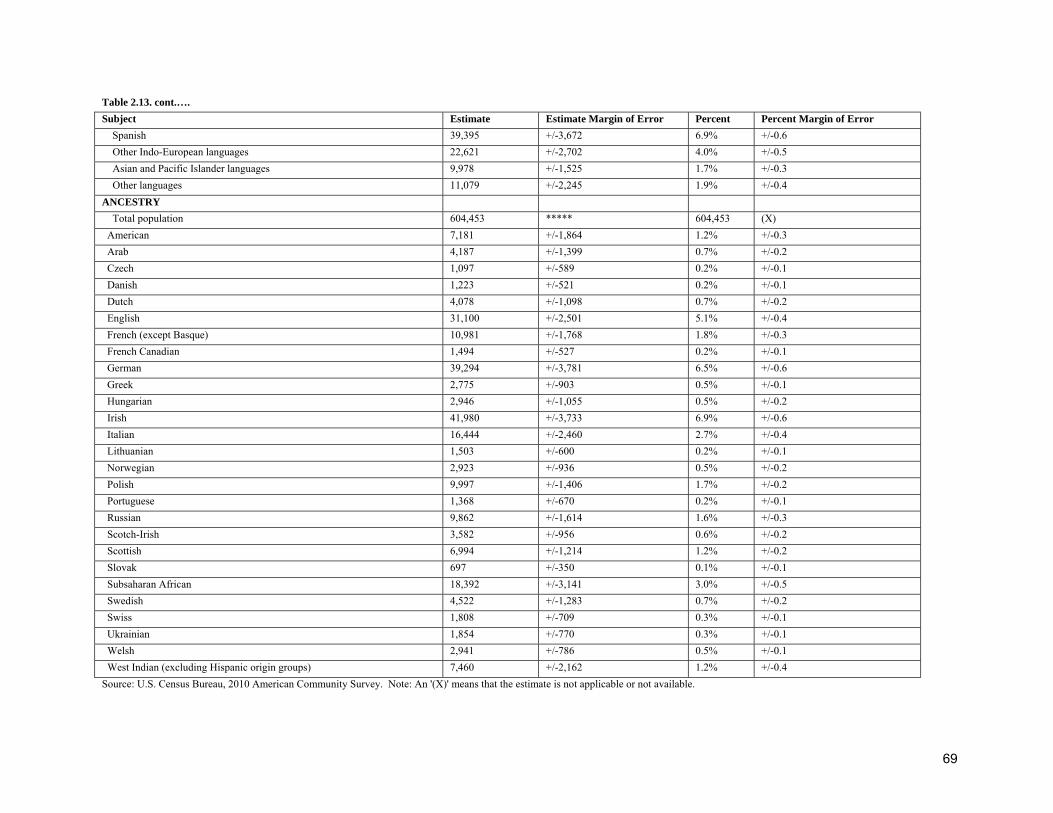
Table 2.13. cont.…. Subject Estimate Estimate Margin of Error Percent Percent Margin of Error Spanish 39,395 +/-3,672 6.9% +/-0.6 Other Indo-European languages 22,621 +/-2,702 4.0% +/-0.5 Asian and Pacific Islander languages 9,978 +/-1,525 1.7% +/-0.3 Other languages 11,079 +/-2,245 1.9% +/-0.4 ANCESTRY Total population 604,453 ***** 604,453 (X) American 7,181 +/-1,864 1.2% +/-0.3 Arab 4,187 +/-1,399 0.7% +/-0.2 Czech 1,097 +/-589 0.2% +/-0.1 Danish 1,223 +/-521 0.2% +/-0.1 Dutch 4,078 +/-1,098 0.7% +/-0.2 English 31,100 +/-2,501 5.1% +/-0.4 French (except Basque) 10,981 +/-1,768 1.8% +/-0.3 French Canadian 1,494 +/-527 0.2% +/-0.1 German 39,294 +/-3,781 6.5% +/-0.6 Greek 2,775 +/-903 0.5% +/-0.1 Hungarian 2,946 +/-1,055 0.5% +/-0.2 Irish 41,980 +/-3,733 6.9% +/-0.6 Italian 16,444 +/-2,460 2.7% +/-0.4 Lithuanian 1,503 +/-600 0.2% +/-0.1 Norwegian 2,923 +/-936 0.5% +/-0.2 Polish 9,997 +/-1,406 1.7% +/-0.2 Portuguese 1,368 +/-670 0.2% +/-0.1 Russian 9,862 +/-1,614 1.6% +/-0.3 Scotch-Irish 3,582 +/-956 0.6% +/-0.2 Scottish 6,994 +/-1,214 1.2% +/-0.2 Slovak 697 +/-350 0.1% +/-0.1 Subsaharan African 18,392 +/-3,141 3.0% +/-0.5 Swedish 4,522 +/-1,283 0.7% +/-0.2 Swiss 1,808 +/-709 0.3% +/-0.1 Ukrainian 1,854 +/-770 0.3% +/-0.1 Welsh 2,941 +/-786 0.5% +/-0.1 West Indian (excluding Hispanic origin groups) 7,460 +/-2,162 1.2% +/-0.4 Source: U.S. Census Bureau, 2010 American Community Survey. Note: An '(X)' means that the estimate is not applicable or not available.
70
Redistricting What is Redistricting? Redistricting refers to the process by which census data are used to redraw the boundaries of electoral districts within a state or jurisdiction with the aim of giving residents a fair and equal share in the way they are governed. After each decennial census, district boundaries for the state legislatures and the U.S. House of representative are changed to reflect population changes within the state and geographic areas. For the District of Columbia this process unfolds as it affects the legislative district boundaries of the eight wards, Advisory Neighborhood Commissions (ANCs), Single-Member Districts (SMDs) and Voting Precincts. The District of Columbia Official Code 1-1011.01 gives the Council responsibility for redistricting legislative districts. This code states that the mayor and the District of Columbia Board of Elections and Ethics shall provide the Council with technical and analytical services necessary for decennial redistricting. Redistricting of Wards - The District of Columbia Official Code 1-1-11.01 requires that the Council divide the District into 8 compact and contiguous election wards, each of which shall be approximately equal in population size. Adjustments to ward boundaries are necessary when the Census indicates that changes in population have taken the eight wards outside the permitted range of deviation from the average. DC Code requires that the Wards fall within a range of plus-or-minus five percent of the average Ward population size, unless the deviation results from the limitations of census geography or from the promotion of a rational public policy, including but not limited to respect for the political geography of the District, the natural geography of the District, neighborhood cohesiveness, or the development of compact and contiguous districts. According to the 2010 Census data, the population of the District of Columbia is 601,723. The ideal size for the District’s eight wards would therefore be 75,215 (601,723/8). Pursuant to the DC Code, a +/- 5% deviation is allowable and results in a maximum ward population size of 78,976 and a minimum size of 71,455. Further, the boundaries of each of the 8 election wards shall conform to the greatest extent possible with the boundaries of the census tracts that are established by the United States Bureau of the Census. Redistricting of ANCs and SMDs - Each single-member district (SMD) shall have a population of approximately 2,000 people, and shall be as nearly equal as possible. The boundaries of the single-member districts shall conform to the greatest extent possible with the boundaries of the census blocks which are established by the United States Bureau of the Census. Each Advisory Neighborhood Commission (ANC) area shall be located to the greatest extent possible within the boundaries of one election ward. An ANC area may be located within two election wards if the location results from the limitations of census geography or if the location promotes a rational public policy, including, but not limited to, respect for the natural geography of the District, neighborhood cohesiveness, or the development of compact and contiguous areas. Other Criteria - No redistricting plan or proposed amendment to a redistricting plan shall be considered if the plan or amendment has the purpose and effect of diluting the voting strength of minority citizens. The total District population and the population of the District's defined sub-units, as determined by the census report, or any official adjustment of the census report, shall be the exclusive permissible population data for apportionment of election wards. The respective Redistricting Committee as assigned by the Council is expected to adopt these criteria and additional factors for consideration in the redistricting efforts.
71
Results of Redistricting The redistricting of wards based on the 2010 Census data has been completed and approved by the mayor of the District of Columbia on July 11, 2011. The new ward boundaries and related population data take effect in January 2012. The old and new ward map and population numbers are presented below. As of this publication, the redistricting of ANCs and SMDs has not been completed. Map 2.2.
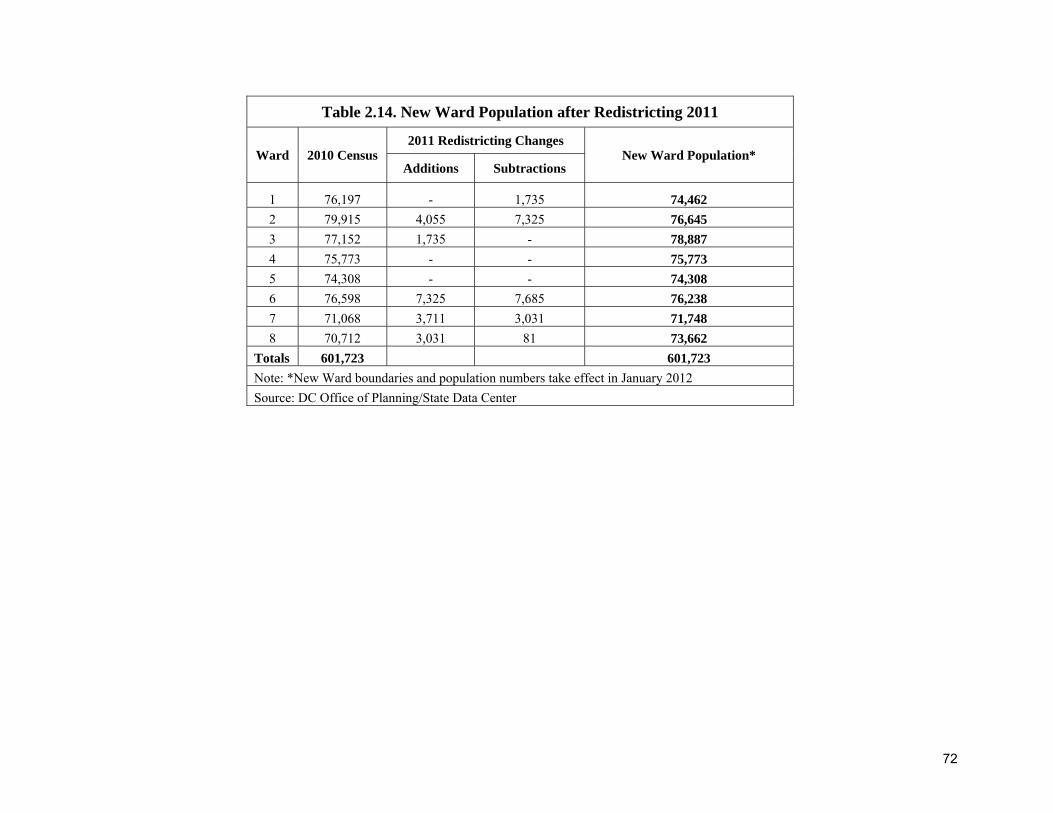
72
Table 2.14. New Ward Population after Redistricting 2011
Ward 2010 Census 2011 Redistricting Changes
New Ward Population* Additions Subtractions
1 76,197 - 1,735 74,462 2 79,915 4,055 7,325 76,645 3 77,152 1,735 - 78,887 4 75,773 - - 75,773 5 74,308 - - 74,308 6 76,598 7,325 7,685 76,238 7 71,068 3,711 3,031 71,748 8 70,712 3,031 81 73,662
Totals 601,723 601,723 Note: *New Ward boundaries and population numbers take effect in January 2012 Source: DC Office of Planning/State Data Center