Embed Size (px)
Citation preview

Chapter 2Chapter 2
Problem Solving Tools for Methods Engineering

Our Text Book Website:Our Text Book Website:
http://highered.mcgraw-hill.com/sites/0072468246/

Outline for todayOutline for today
A short history of Human Factors and Ergonomics,
Methods Engineering/Work DesignExample of Methods EngineeringDiscussion of in-class exercise,Approaches for both physical and
“thinking” tasks,

A Short History A Short History of Human Factors and Ergonomicsof Human Factors and Ergonomics
Year Event
1760 Perronet makes time studies
1820 Charles W. Babbage makes time studies
1832 Charles W. Babbage publishes On the Economy of Machinery and Manufactures
1881 Frederick W. Taylor begins his time study work
1901 Gantt develops the task and bonus wage system
1910 Gilbreth publishes Motion Study
1933First Ph.D. granted in the United State in the field of industrial engineering from
Cornell University
1949The Ergonomics Research Society (The Ergonomics Society) founded United
Kingdom
1957 The Human Factors and Ergonomics Society is founded United States
1970 Congress passes the OSHAct, Occupational Safety and Health Administration
1981 NIOSH lifting guidelines are first introduced
1990 Americans with Disabiities Act (ADA) is passed by Congress
1995 ANSI Z-365 Standard for Control of Work-Related Cumulative Trauma Disorders
2006 50th Anniversary of the Human Factors and Ergonomics Society

Methods EngineeringMethods Engineering Technique for:
– Increasing production per unit of time. Example: increasing the number of customers
that can be handled per cashier by installing bar code readers.
– Decreasing cost per unit output.
Example: decreasing total cost of each cell phone by reducing the number of parts and thus the labor hours required for assembly.
It is critical to look at impact on whole system.
Methods EngineeringMethods Engineering Focuses Primarily on Focuses Primarily on improving productivity though (re)design of:improving productivity though (re)design of:
Tools(Products)
Work Process
Work environment
Organizationalstructure
Motivation:Incentives/rewards
Work operations

Methods EngineeringMethods Engineering
Often used synonymously with:– Corporate re-engineering– Work design – Operation analysis
The difference between these terms in the level of detail.
Detail level
Big picture level

Methods EngineeringMethods Engineering Select project I.D. product or service
experiencing difficulties. Get and present data Study situation, take
measurements to determine where difficulties really lie,
Analyze the data:Figure out which of many problems are most critical
Develop ideal method(s) Identify alternative
approaches which may address most critical problems.
Present and install method at the work site Develop a job analysis To insure operators are
adequately selected, trained, rewarded, etc.
Establish time standards Establish fair and equitable
standards for work performance.
Follow up the method Take measurements to
determine if changes really did improve situation as predicted.

Example: Example: Mission Planning and control for the Mission Planning and control for the
Mars Exploration RoverMars Exploration Rover Researchers introduced
automated planning tool, MAPGEN
Tool had to fit with users’ existing way of thinking about plans,
Introduction of new tools caused the planning process to change,
Product and processes were evolved together, over time.

ManyMany methods can be used in methods can be used in manymany stages of the design processstages of the design process
RequirementsGathering
Final Performance Evaluation orComparison
A typical spiral design process
Design Specification
Design Review
PrototypeTesting

Problem Solving Tools for Problem Solving Tools for Methods Engineering: Methods Engineering:
help to identify what the most important help to identify what the most important problem problem isis
Observational tools:– Site walk-thrus– Observation and interviews of workers and
managers– Ethnographic studies

Problem Solving Tools for Problem Solving Tools for Methods Engineering (Ch. 2.1)Methods Engineering (Ch. 2.1)
Exploratory tools– Pareto Analysis (Vilfredo Pareto)– Fish Diagrams (from Japan, 60’s)– Gantt and PERT charts (40’s wartime).

Pareto AnalysisPareto Analysis
Items of interest are identified (e.g. types of product flaws that result in scrapped parts, time spent on each activity required to manufacture a product or perform a service.
Items are measured on a common scale (such as frequency total cost, total time, etc.)
Items are ordered in descending order

Example of a Pareto ChartExample of a Pareto ChartReasons for Delay in Graduation,
All Colleges and Departments, University of Minnesota, 2005
2.312.11
1.75 1.72 1.66 1.55 1.47 1.47 1.41 1.32 1.25 1.18
0.00
0.50
1.00
1.50
2.00
2.50
3.00
3.50
4.00C
hang
edm
ajor
s af
ter
Had
to w
ork
mor
e hr
s to
Wan
ted
to ta
kea
light
er
Cou
ldn'
t get
cour
ses
I
Wan
ted
tow
ork
addi
tiona
l
Try
ing
topr
epar
e fo
r
Enj
oyed
colle
ge a
nd
Com
plet
ed a
doub
le m
ajor
Try
ing
to g
etin
to a
maj
or
Wan
ted
to ta
kea
light
er
Ext
ende
dco
llege
Had
hom
e or
fam
ily
Reasons
Imp
ort
ance
of
Rea
son
(1
- 4)

Example 2 Pareto chart: worker time studyExample 2 Pareto chart: worker time studyPlymouth Cashier 2-2-06
Back to kitchen7.9%
Watch door13.1%
Equipment maintenance
13.3%
Cleaning6.1%
Interaction with staff4.1%
Barista operations (milk)3.1%
Cutomer interaction
3.0% Personal1.4%
Cashier functions48.1%
Cashier functions
Equipment maintenance
Watch door
Back to kitchen
Cleaning
Interaction with staff
Barista operations (milk)
Cutomer interaction
Personal

Example of a Fish DiagramExample of a Fish Diagram

Fish DiagramsFish Diagrams
Cause and effect diagrams Effect is a problem = “fish head” Causes = “fish bones” Typical causes:
– Environment– Methods– Materials – Administrative– Machine– Human

Gantt ChartsGantt Charts Activities shown as bars with:
– Anticipated start times– Anticipated completion times– Actual start and completion times
Use a vertical line to show current time May use color codes to show various things:
– Completed activities (grey)– On going activities, on schedule (green)– Overdue activities (red)– Almost over due activities (yellow)

Example of a GANTT chartExample of a GANTT chart

PERT Charts:PERT Charts:Program Review and Evaluation TechniqueProgram Review and Evaluation Technique
Project networks Like Gannt charts, PERT charts show activities,
start and end times Also show variation in activity durations:
optimistic, average, pessimistic, Show dependencies between activities, Can identify a critical path (longest path) that
constrains minimum completion time of whole project,
Analyze how “crashing” activities can shorten duration of whole project.


Example of a PERT chartExample of a PERT chart

Problem Solving Tools (cont.)Problem Solving Tools (cont.)
Recording and Analysis tools:– Operation Process Chart– Flow process chart– Flow diagram– Worker and Machine Process Charts– Gang Process charts– Synchronous servicing

Operation Process ChartsOperation Process Charts
Chronological sequence of operations Show operations as a flow chart though the
worksite. Show the types of operations:
– Operation– Transport– Inspection– Delay– Storage– Decision

Operation Operation Process Process Chart: Chart:
Manufacture of Manufacture of a telephone a telephone
standstand

Flow Process ChartFlow Process Chart
More detail than Operation Process Chart:Not usually used for entire assemblies,Used for just one component (or operator)Add in information on:
– Operation duration (time to complete)– Distance traveled (for transport operations)
Good for showing savings of a new method.

Flow Flow Process Process
ChartChart
Preparation of Preparation of direct mail direct mail advertizingadvertizing

Flow DiagramFlow Diagram
Show layout of work areaShow the flow of work through that areaShow congestion areas, crossing worker
paths, total travel.Identify how layout can be redesigned to
reduce travel, motion, collisions, etc.Store materials near where they are used.Increase efficiency and safety.

Flow diagramFlow diagram

A revised and more efficient flow A revised and more efficient flow diagramdiagram

Worker and Machine Process ChartWorker and Machine Process Chart
Show one worker, many processesIdentify idle time for each,Reorganize operations to reduce idle time.Identify how many machines worker can
manage


Gang Process ChartsGang Process Charts
Show one machine, many workers,Identify idle time for each,Re-arrange tasks between workers to reduce
idle time.


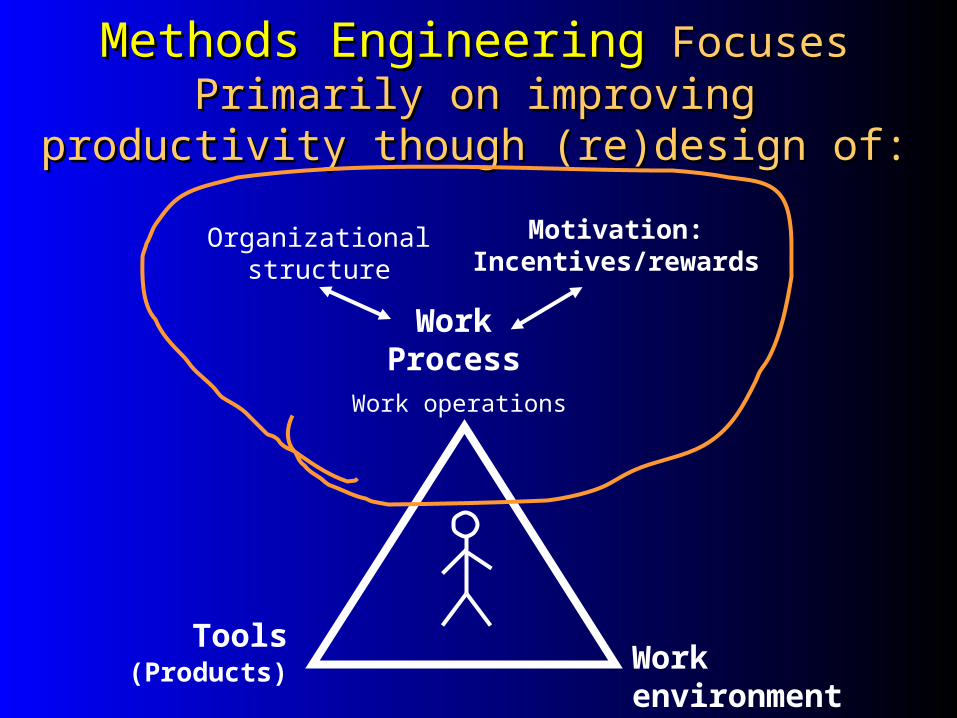
Synchronous and Random Synchronous and Random ServicingServicing
Synchronous servicing: operations (usually done by machine) take a predictable amount of time, so the operator(s) “servicing” actions can be synchronized with the machines’ cycle times.
Random servicing (Asynchronous): operation occurrences happen with some unpredictability: e.g. machine breakages, field service calls, etc.

Synchronous ServicingSynchronous Servicing
The number of
Machines an operator
Can be assigned:
Where:
n = number of machines operator handles
l = total operator loading and unloading time
m = total machine running time
w = worker time between machines.
n ≤ l + m
l + w

ExampleExample
Should n be 3 or 4?Figure out how much it costs per unit of
production if:– 3 machines are assigned to each worker– 4 machines are assigned to each worker
Choose the assignment that is least expensive.

Random ServicingRandom Servicing
This method applies when you have one person handling several machines (or things) that:– Do not run for a set length of time, – Need servicing at irregular intervals
Examples: – Machine repair: machines break at random times.– Call center, calls come in at random times.

Random Servicing: ApproachRandom Servicing: Approach
The proportion of time, p, that a machine is up or down can be estimated through a time study (Chapter
9) or a work sampling study (Chapter 14)
q = 1 - p
P = the probability that m out of n total machines are down is:
P (m of n) = n! x pm qn-m
m! (n – m)!

Random Servicing: ExampleRandom Servicing: Example
Suppose at a call service center you have one phone operator to answer:– n = 4 phone lines– p = 0.10 = probability that a phone line is in use is. – q = 1 – p = 0.9 = the probability that a given phone line is unused,
e.g. no one on the line. “In use” means that a caller may be either:
– waiting on the line, or – speaking with the phone operator.
If calls come into the center at random, what is the probability that there will be exactly three phone lines in use? (e.g. One caller speaking with the operator, two callers waiting).

Random Servicing: ExampleRandom Servicing: Example
No callers 4! x (.10 ) (.94) = .66 0! (4 – 0)!
One caller 4! x (.11 ) (.93 ) = .29 1! (4 – 1)!
Two callers 4! x (.12 ) (.92) = .05 2! (4 – 2)!
Three callers 4! x (.13 ) (.91) = .0036 3! (4 – 3)!
Four callers 4! x (.14 ) (.90) = .0001 4! (4 – 4)!

Random Servicing: ExampleRandom Servicing: Example
In other words, in this situation:
66 % of the time, the sales assistant has no calls;
29 % of the time, exactly one call;
5 % of the time, exactly two calls, e.g. the assistant helps one customer while one customer waits,
Less than a half a percent of the time (0.36 %), exactly three calls: one customer is being helped while two customers listen to Musak.
The probability that all 4 lines are in use at once is almost non-existent.
Probability of exactly n calls
0.6561
0.2916
0.04860.0036 0.0001
0
0.1
0.2
0.3
0.4
0.5
0.6
0.7
0.8
0.9
1
0 1 2 3 4
Number of calls
Pro
bab
ility

Coffee Shop StudyCoffee Shop StudyNo studies had been done previously at this
company to assess current efficiencyGoal: to identify any way possible of improving
productivity,Initial request: do a time study at 3 very
different stores, improve productivity of coffee making process.
Corporate goal: customer should be in and out within 3 minutes, “door-to-door”.

Observational toolsObservational tools
Site walk-thrus: look at layout, tools equipment, how they are used.
Interviews of workers and managers to identify what they view as problems,
Ethnographic studies: observe work in detail as a “fly on the wall” as it normally occurs in its normal setting, possibly over a long period of time. Good for observing interactions between workers.
Time and/or motion studies: to learn detail about what people do and how long it takes.

Job Worksite Analysis GuideJob Worksite Analysis Guide
Check list of items to think about/examine while touring jobsite:– How do parts/products flow in and out?– What kinds of motion are involved?– Are any tools being used?– Were there awkward motions?– Is worker fatigued? Stressed?– Is there decision making?

Time and Motion studiesTime and Motion studies
In a time study: Often applied to large or
small tasks,– Work is observed
Work is broken into “elements”
– Each element is timed,– The process is re-
engineered to be faster, safer, less error-prone, etc.
In a motion study:Often applied to fine-grained
continuous motions,– Motions are observed in
performing a task, Motions are be divided into “therbligs”
– The process is re-engineered by:
eliminating unnecessary motions,
re-sequencing motions.
The two are often combined.

Tools for Time and Motion Tools for Time and Motion StudiesStudies
Tools can be simple and low cost:– Stop watch, – Pen and paper, – Maybe a video camera. The task determines if it is
necessary.The technique is low-tech, but can still result
in major cost savings!

How did your group speed up How did your group speed up your assembly process?your assembly process?
Use multiple packers, Use two hands, Lay-out pieces in advance in order of assembly, Orient each object in correct position in advance, Sequence objects to be easier to pack, Fewer objects = less material handing = time
savings!

What about thinking tasks?What about thinking tasks?
Time and motion studies apply to physical aspects of the task and physical objects.
What about the psychological aspects of a task? How can one study “thought work” and apply factors to improve the work of people who do: driving, design, planning, management, and decision making?

Additional Approaches:Additional Approaches:Time and “thought” studiesTime and “thought” studies
Protocol Studies– Have the person talk out loud as they solve a problem
E.g. create a design or manufacturing plan, or solve an algebraic problem
– Record everything said and done on audio and video tape, or written notes Ethnographic Studies
– Observe in the workplace where people are doing tasks Nuclear power plant Cockpit of airplane NASA control center (for Mars Explorations)
– Record what is said and done (video or written notes)– Analyze

Example of a Protocol StudyExample of a Protocol Study
Protocol means “record” Need 2 volunteers
– Experimenter– Subject
Tools:– Normal tools used for task, often pencil and paper in an
office setting,– Experimenter needs pencil and paper (or other
recording equipment: tape recorder, video).

A thinking taskA thinking task

Common themes in Human Common themes in Human Factors approachesFactors approaches
Observation of human activities in performance of tasks,
Re-engineer many aspects of the task (tools, process, etc.) to improve effectiveness:
The tools and techniques are often simple but powerful!

In-Class ExerciseIn-Class ExerciseEach group will be given a set of objects to
assemble into a box.The items will be varied in:
– shape– size,– flexibility,

In-Class ExerciseIn-Class ExerciseFigure out how to fit all the objects in the box
– Decide what actions constitute “therbligs” or “elements”
– Develop and record a procedure (in terms of therbligs)
Figure out how to do it fast– Time your procedure (minutes, seconds)– Did your “therblig” descriptions change?– Did your procedure descriptions change?– Did other things change?

Rules of ExerciseRules of Exercise
Take all objects out and set them separately on desk.
Fit all objects in the box so that you can close the lid all the way.
No squashing or damaging objects. You may wish to assign different roles to the
people on your team: packer, time keeper, process recorder, observer, etc.
You will get several minutes to practice, then we will have a competition.

Exercise (continued)Exercise (continued)
Each group please report:– Your best time to complete the task– Your therbligs– Your procedure (sequence of therbligs)
– What you did to improve your time? (did you develop new therbligs? New sequence? Other?)

What Observational tools were What Observational tools were used in Coffee Shop Study?used in Coffee Shop Study?
Interviews with employees Site walk-thru Time studies of operations for three types of store
setups and three job roles (4 hours observation each):– Cashier– Superglue– Barista
Other measurements (had to design measurement methods appropriate for context): – At what rate do customers enter?– How long does it take an individual customer to go door
to pick-up?

Site walk-thru: Customer AreaSite walk-thru: Customer Area

Tightly constrained workspace: Tightly constrained workspace: Hard to find a safe place from which to observe!Hard to find a safe place from which to observe!


ProjectsProjects

Which Exploratory Tools did we Which Exploratory Tools did we Use in the Coffee Shop Study?Use in the Coffee Shop Study?
Other types of charts: rate of customer arrival: when are the busy times?
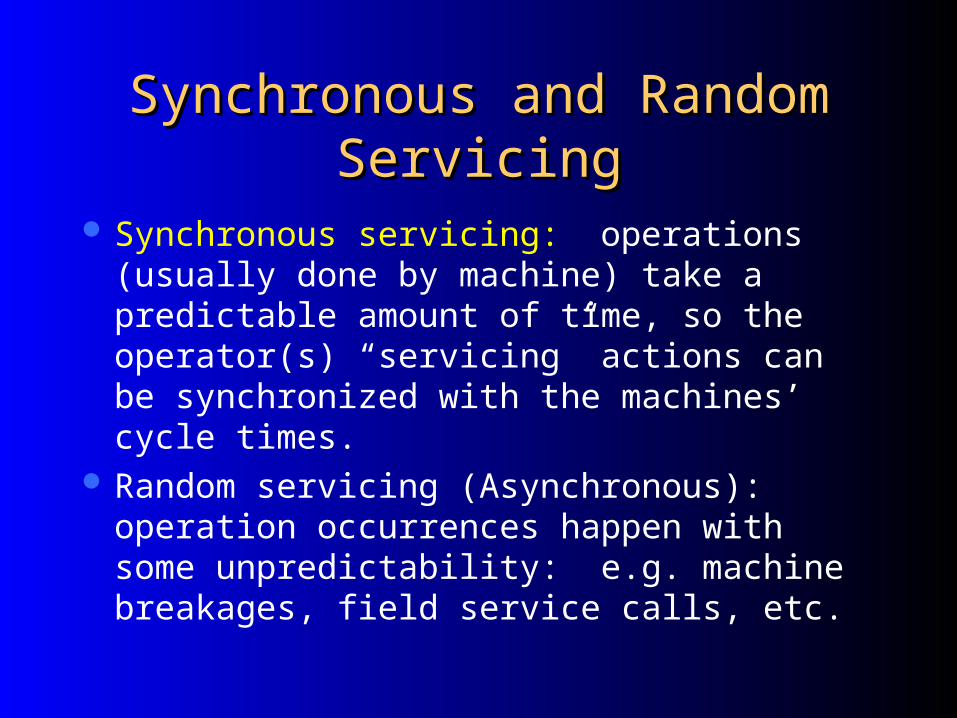
Comparison of total customer wait times at different stores,
Comparison of customer volume at different stores,

Plymouth: Customer Arrival Rates2-2-06, 6:30 AM - 10:30 AM
19
3742
29
44
37
23
16
0
10
20
30
40
50
Time Interval
Nu
mb
er
of
Cu
tso
me
rs
Average total customer wait timewith minimum and maximum wait times
All stores (each bar aggregated over 1 or more days)
0:02:590:03:44
0:02:39
0:000:010:020:030:040:050:060:070:080:090:100:110:120:130:140:150:160:170:180:190:200:21
Chanhassen 2/9/06 Plymouth (3 day ave.) Mounds View (2 day ave)
Store and days
To
tal w
ait tim
e (m
in)
Volume high high medium

Chanhassen (Super Automatic) Thu 2/9/06Total wait time frequency
sample size, 84
3
27
2022
8
4
0 0 0 0 0 0 0 0 00
5
10
15
20
25
30
35
40
45
50
Time (Minutes)
Fre
qu
en
cy
(n
o.
of
cu
sto
me
rs e
xp
eri
en
ce
ing
th
is w
ait
)

Difficult Part: Difficult Part:
How do you translate this exploratory data into ideas of what to do?
What does this say about where the problems might lie?
How do I know if the what the data shows is good or bad? Is the most costly item a “problem” or a necessary part of the process?