Embed Size (px)
Citation preview
Chapter 20Social Security
Reading
• Essential reading– Hindriks, J and G.D. Myles Intermediate Public Economics.
(Cambridge: MIT Press, 2005) Chapter 20.
• Further reading– Banks, J. and Emmerson, C. (2000) “Public and private pension
spending: principles, practice and the need for reform”, Fiscal Studies, 21, 1 - 63.
– Diamond, P.A. (1997) “Macroeconomic aspects of social security reform”, Brookings Papers on Economic Activity, 1 – 87.
– Mulligan, C.B., Gil, R. and Sala-i-Martin, X. (2004) “Do democracies have different public policies than nondemocracies?” Journal of Economic Perspectives, 18, 51 - 74.
– Samuelson, P.A. (1975) “Optimum social security in a life-cycle growth model”, International Economic Review, 16, 539 - 544.
Reading
• Challenging reading– Bernheim, B.D. and Bagwell, K. (1988) “Is everything neutral?”,
Journal of Political Economy, 96, 308 - 338.– Diamond, P.A. (2001) “Issues in Social Security Reform” in S.
Friedman and D. Jacobs (eds.), The Future of the Safety Net: Social Insurance and Employee Benefits (Ithaca: Cornell University Press).
– Galasso, V. and Profeta, P. (2004) “Lessons for an aging society: the political sustainability of social security systems”, Economic Policy, 38, 63 - 115.
– Miles, D. (1998) “The implications of switching from unfunded to funded pension systems”, National Institute Economic Review, 71 - 86.
– Mulligan, C.B., Gil, R. and Sala-i-Martin,X. (2002) “Social Security and Democracy”, NBER Working Paper no. 8958.
Introduction
• One part of social security is the provision of pensions to the retired
• Pensions raise questions about:– The transfer of resources between generations– The effect on incentives to save
• The policy relevance of pensions is emphasized by the “pension crisis”– The crisis may force major revision in pensions
provision
Types of System
• Pensions may be paid from:– An accumulated fund– From current tax contributions
• Pay-as-you-go: Taxes on workers pay the pensions of the retired– The systems in the US, UK, and many other countries
are (approximately) pay-as-you-go
• A pay-as-you-go systems satisfiesBenefits received by retired = Contributions of workers
Types of System
• Let be the pension, R the number of retired, the average social security contribution, and E the number of workers, then
R = E• With constant population growth at rate n
= [1 + n]
• The system effectively pays interest at rate n on taxes
• The return is determined by population growth
Types of System
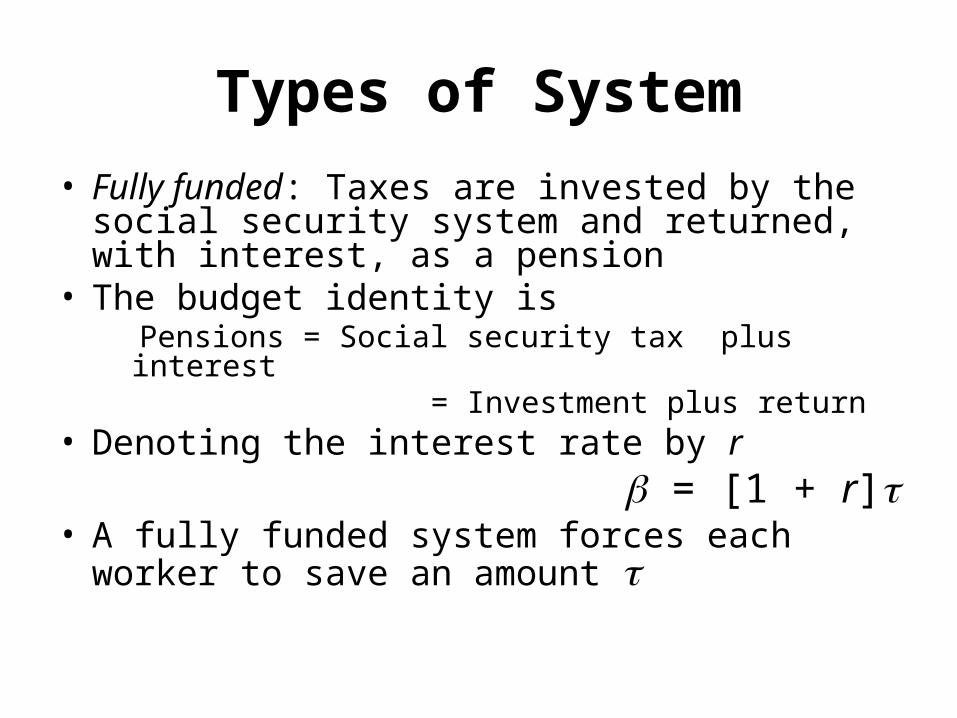
• Fully funded: Taxes are invested by the social security system and returned, with interest, as a pension
• The budget identity is Pensions = Social security tax plus interest = Investment plus return
• Denoting the interest rate by r = [1 + r]• A fully funded system forces each worker to
save an amount
Types of System
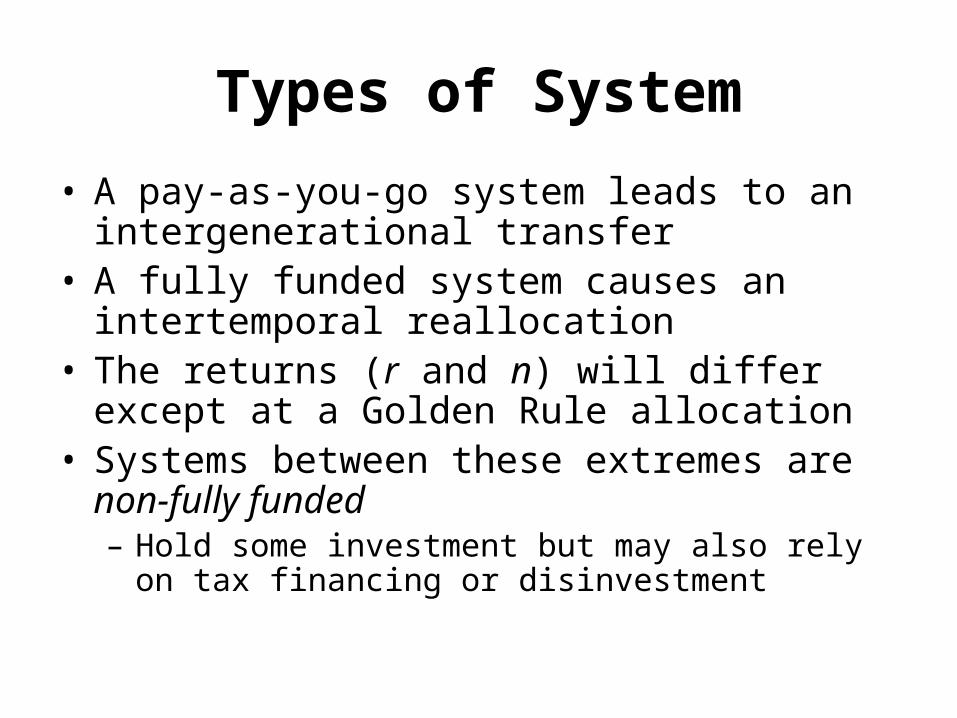
• A pay-as-you-go system leads to an intergenerational transfer
• A fully funded system causes an intertemporal reallocation
• The returns (r and n) will differ except at a Golden Rule allocation
• Systems between these extremes are non-fully funded– Hold some investment but may also rely on tax
financing or disinvestment
The Pensions Crisis
• There are three factors causing the pensions crisis– The fall in the birth rate– The increase in longevity– The fall in the retirement age
• These factors cause the proportion of retired in the population to grow
• The output of each worker must support an ever larger number of people
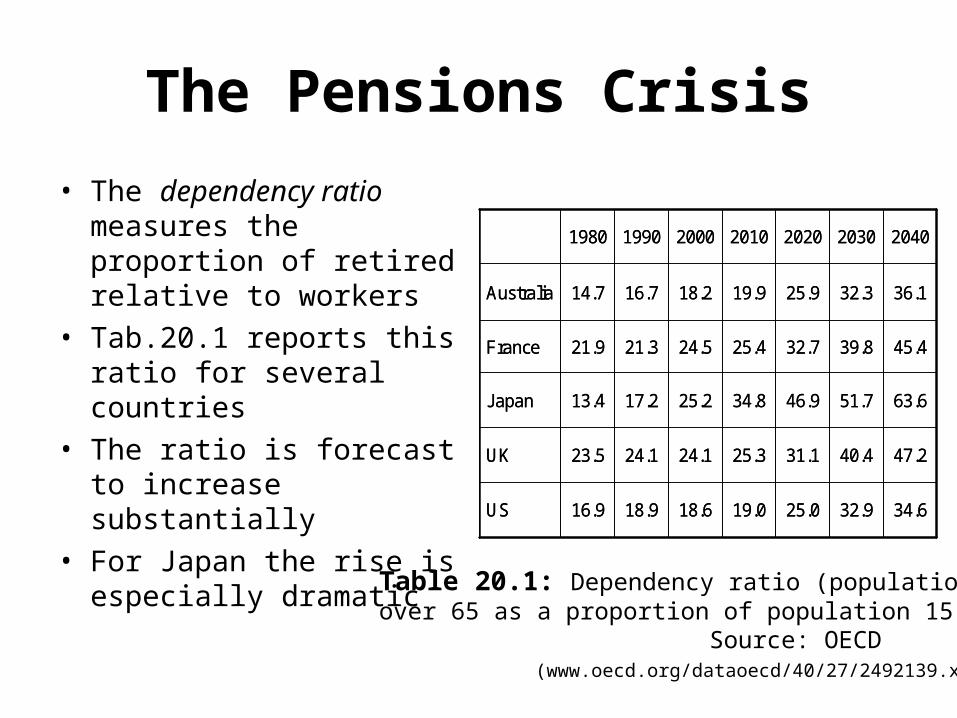
• The dependency ratio measures the proportion of retired relative to workers
• Tab.20.1 reports this ratio for several countries
• The ratio is forecast to increase substantially
• For Japan the rise is especially dramatic
34.632.925.019.018.618.916.9US
47.240.431.125.324.124.123.5UK
63.651.746.934.825.217.213.4Japan
45.439.832.725.424.521.321.9France
36.132.325.919.918.216.714.7Australia
2040203020202010200019901980
34.632.925.019.018.618.916.9US
47.240.431.125.324.124.123.5UK
63.651.746.934.825.217.213.4Japan
45.439.832.725.424.521.321.9France
36.132.325.919.918.216.714.7Australia
2040203020202010200019901980
Table 20.1: Dependency ratio (populationover 65 as a proportion of population 15 - 64) Source: OECD (www.oecd.org/dataoecd/40/27/2492139.xls)
The Pensions Crisis
The Pensions Crisis
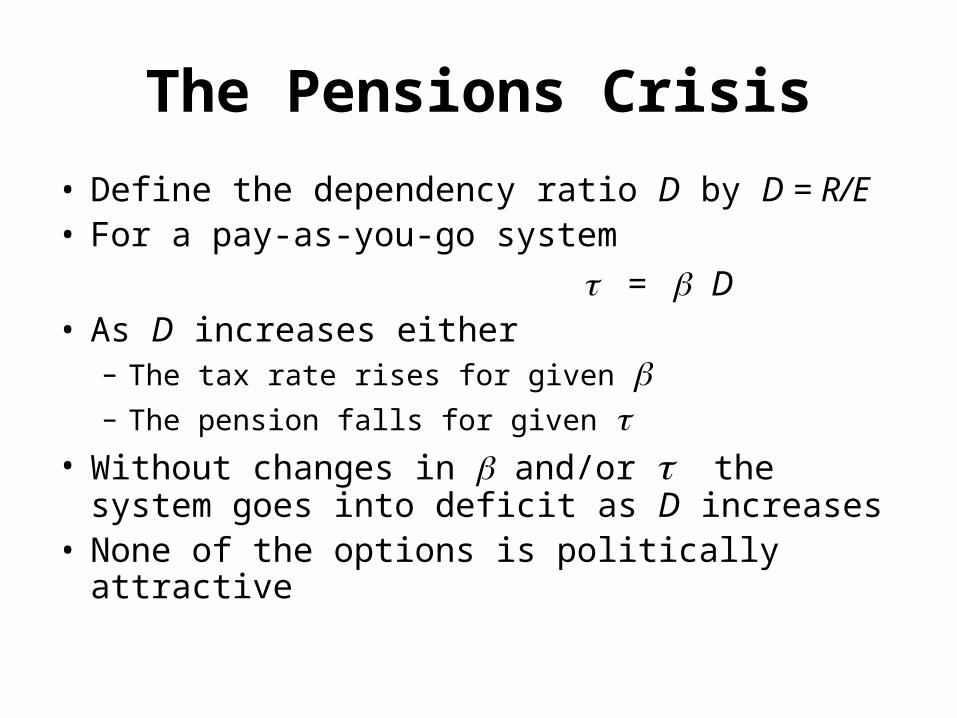
• Define the dependency ratio D by D = R/E• For a pay-as-you-go system
= D• As D increases either
– The tax rate rises for given
– The pension falls for given • Without changes in and/or the system goes
into deficit as D increases• None of the options is politically attractive
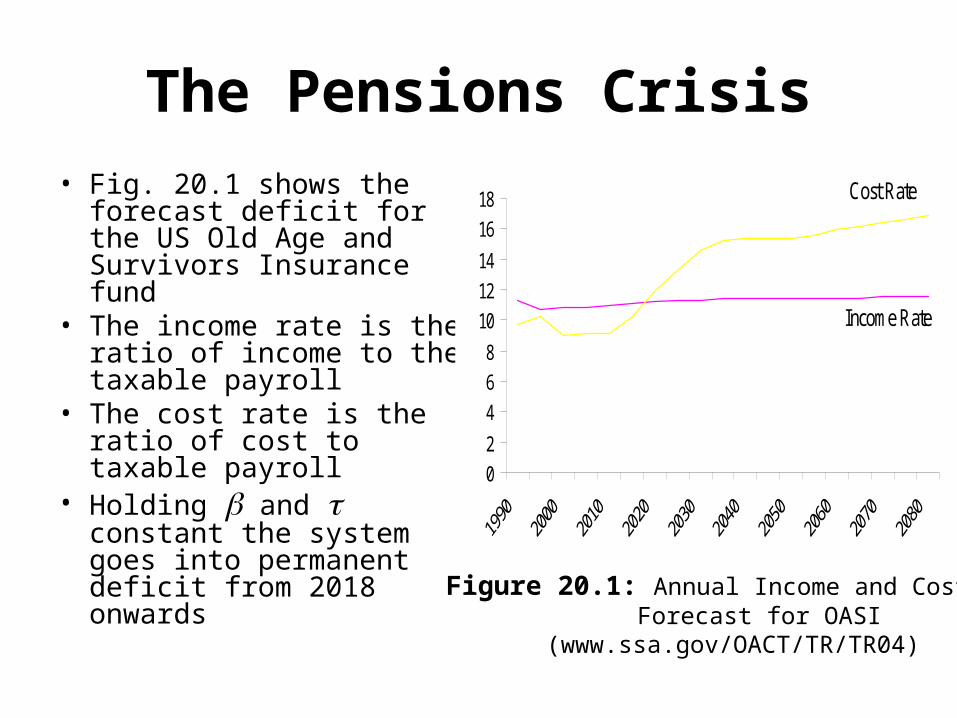
• Fig. 20.1 shows the forecast deficit for the US Old Age and Survivors Insurance fund
• The income rate is the ratio of income to the taxable payroll
• The cost rate is the ratio of cost to taxable payroll
• Holding and constant the system goes into permanent deficit from 2018 onwards
0
2
4
6
8
10
12
14
16
18
Income Rate
Cost Rate
Figure 20.1: Annual Income and Cost Forecast for OASI
(www.ssa.gov/OACT/TR/TR04)
The Pensions Crisis
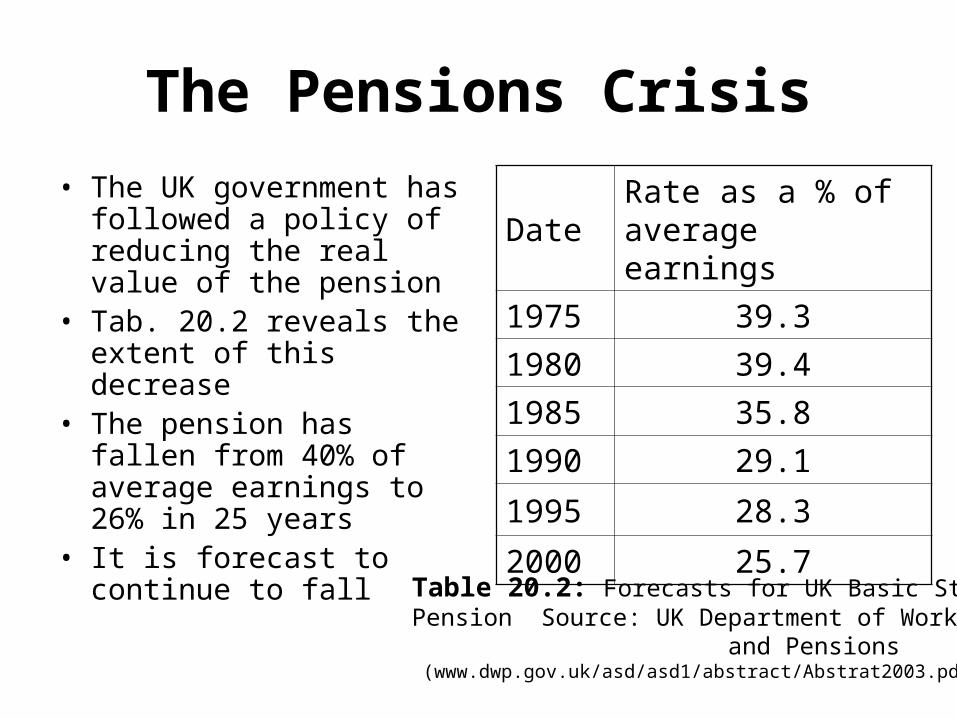
• The UK government has followed a policy of reducing the real value of the pension
• Tab. 20.2 reveals the extent of this decrease
• The pension has fallen from 40% of average earnings to 26% in 25 years
• It is forecast to continue to fall
DateRate as a % of average earnings
1975 39.3
1980 39.4
1985 35.8
1990 29.1
1995 28.3
2000 25.7
Table 20.2: Forecasts for UK Basic State Pension Source: UK Department of Work and Pensions (www.dwp.gov.uk/asd/asd1/abstract/Abstrat2003.pdf)
The Pensions Crisis
The Simplest Program
• Assume an overlapping generations economy:– With no production– With constant population– A good that cannot be saved
• Consumers have an endowment of 1 unit of consumption when young
• They have no endowment when old• Consumers would prefer to smooth consumption
over the lifecycle
The Simplest Program
• The only competitive equilibrium has no trade– Young and old wish to trade– The old have nothing to trade
• All consumption takes place when young• This autarkic equilibrium is not Pareto-efficient• A social security program can engineer a
Pareto-improvement by making intergenerational transfers
The Simplest Program
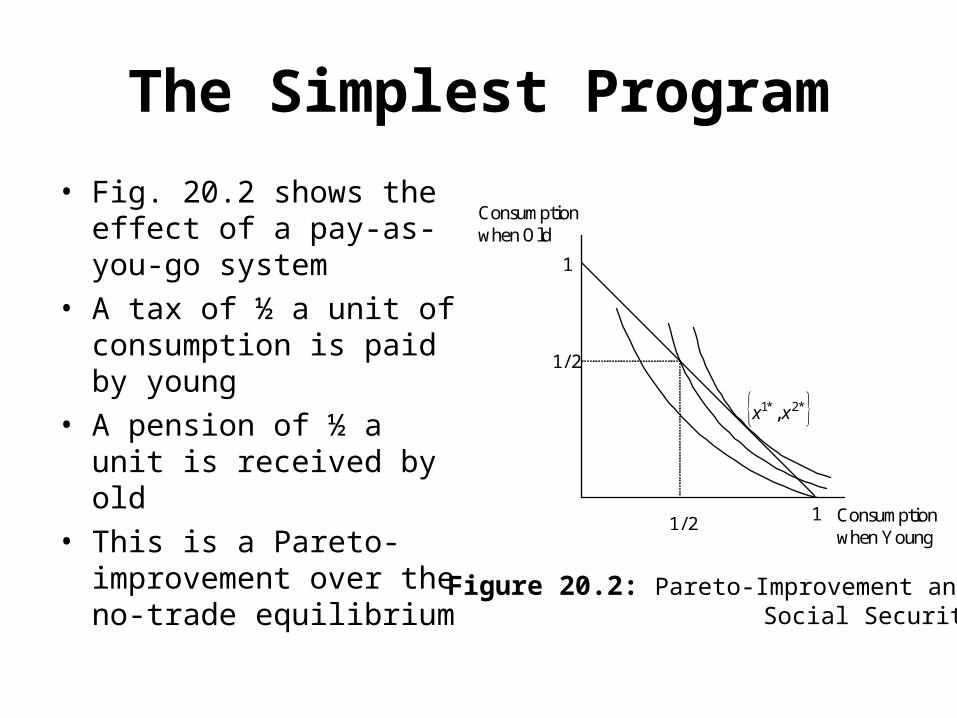
• Fig. 20.2 shows the effect of a pay-as-you-go system
• A tax of ½ a unit of consumption is paid by young
• A pension of ½ a unit is received by old
• This is a Pareto-improvement over the no-trade equilibrium
Consumption when Young
Consumption when Old
2/1
2/1
1
1
*2*1 , xx
Figure 20.2: Pareto-Improvement and Social Security
The Simplest Program
• A correctly designed system can achieve the Pareto-efficient allocation ( {x1*, x2*} in Fig. 20.2)
• This result shows the benefits of introducing intergenerational transfers
• The system has to be pay-as-you-go since a fully funded program requires a commodity that can be saved
• These conclusions generalize to economies with production
Social Security and Production
• Social security can affect saving and capital accumulation
• The consequence depends on the position of the economy relative to the Golden Rule
• Consider a program that taxes each worker and pays a pension
• The program owns units of capital at time t, or units of capital per unit of labor
• A program is optimal if , , and are feasible and the economy achieves the Golden Rule
stK
tst
st LKk /
stk
Social Security and Production
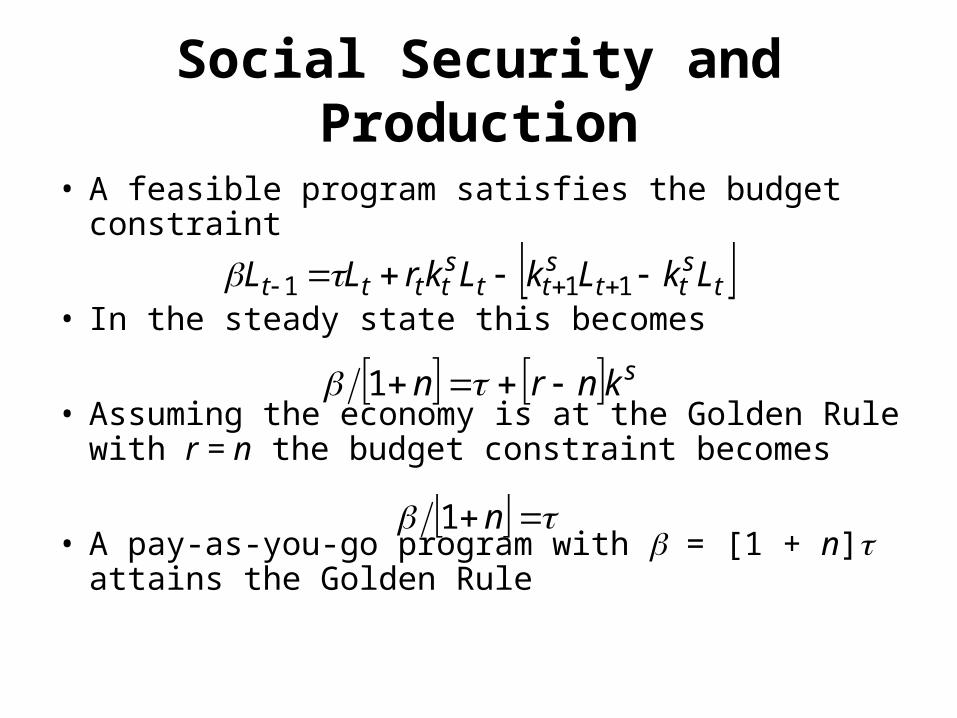
• A feasible program satisfies the budget constraint
• In the steady state this becomes
• Assuming the economy is at the Golden Rule with r = n the budget constraint becomes
• A pay-as-you-go program with = [1 + n] attains the Golden Rule
tstt
stt
stttt LkLkLkrLL 111
sknrn 1
n1
Social Security and Production
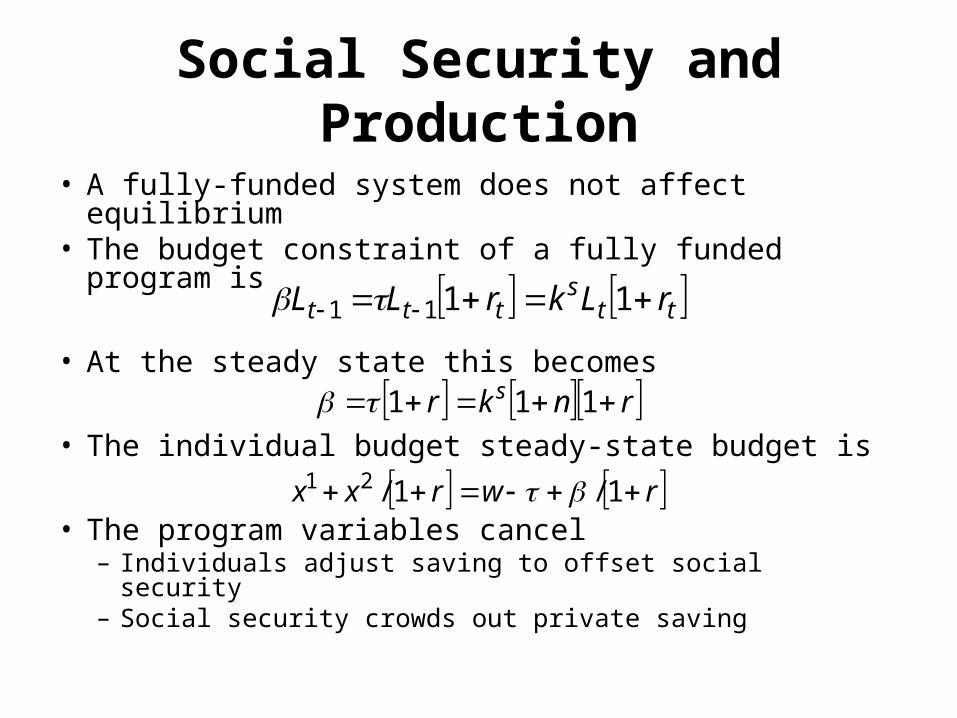
• A fully-funded system does not affect equilibrium• The budget constraint of a fully funded program
is
• At the steady state this becomes
• The individual budget steady-state budget is
• The program variables cancel– Individuals adjust saving to offset social security– Social security crowds out private saving
tts
ttt rLkrLL 1111
rnkr s 111
rwrxx 1/1/21
Population Growth
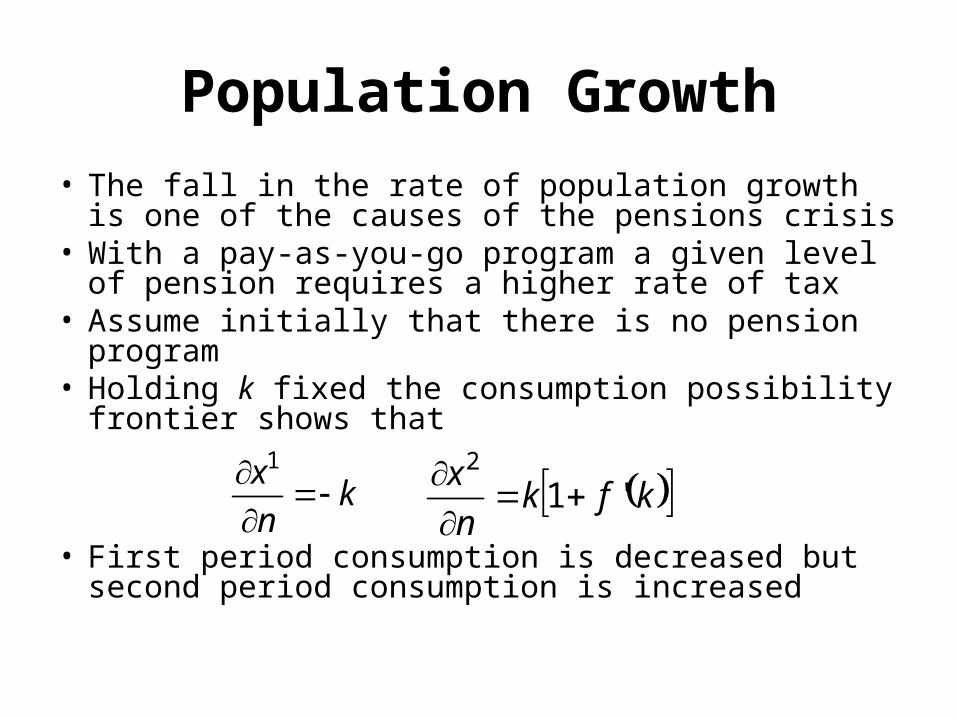
• The fall in the rate of population growth is one of the causes of the pensions crisis
• With a pay-as-you-go program a given level of pension requires a higher rate of tax
• Assume initially that there is no pension program• Holding k fixed the consumption possibility
frontier shows that
• First period consumption is decreased but second period consumption is increased
kn
x
1
kfkn
x'1
2
Population Growth
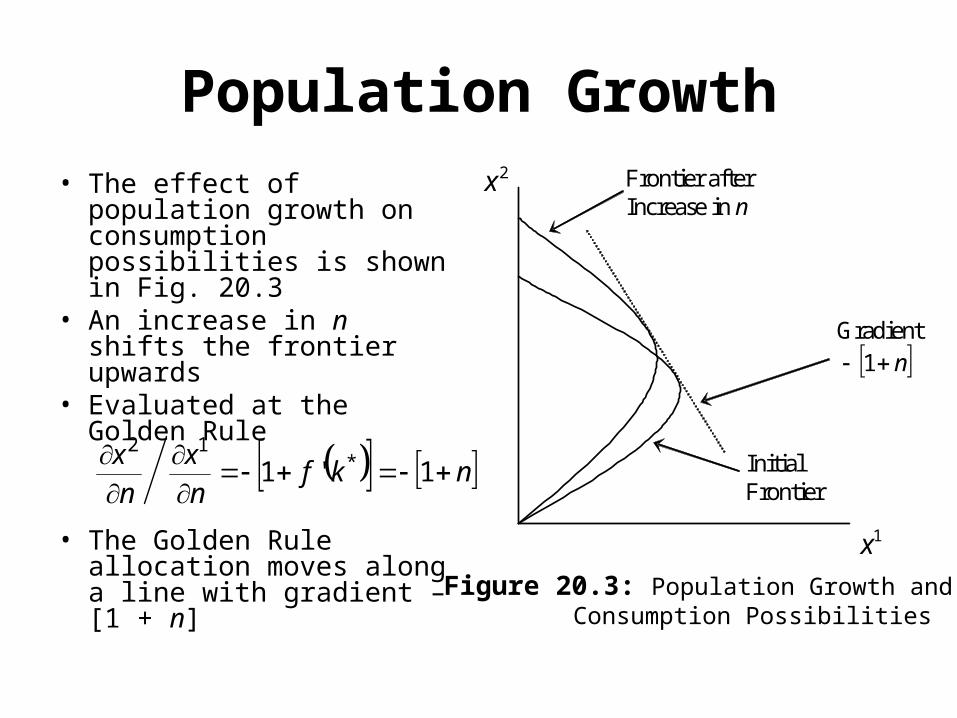
• The effect of population growth on consumption possibilities is shown in Fig. 20.3
• An increase in n shifts the frontier upwards
• Evaluated at the Golden Rule
• The Golden Rule
allocation moves along a line with gradient – [1 + n]
1x
2x
InitialFrontier
Frontier afterIncrease in n
Gradient n 1
Figure 20.3: Population Growth and Consumption Possibilities
nkfn
x
n
x
1'1 *12
Population Growth
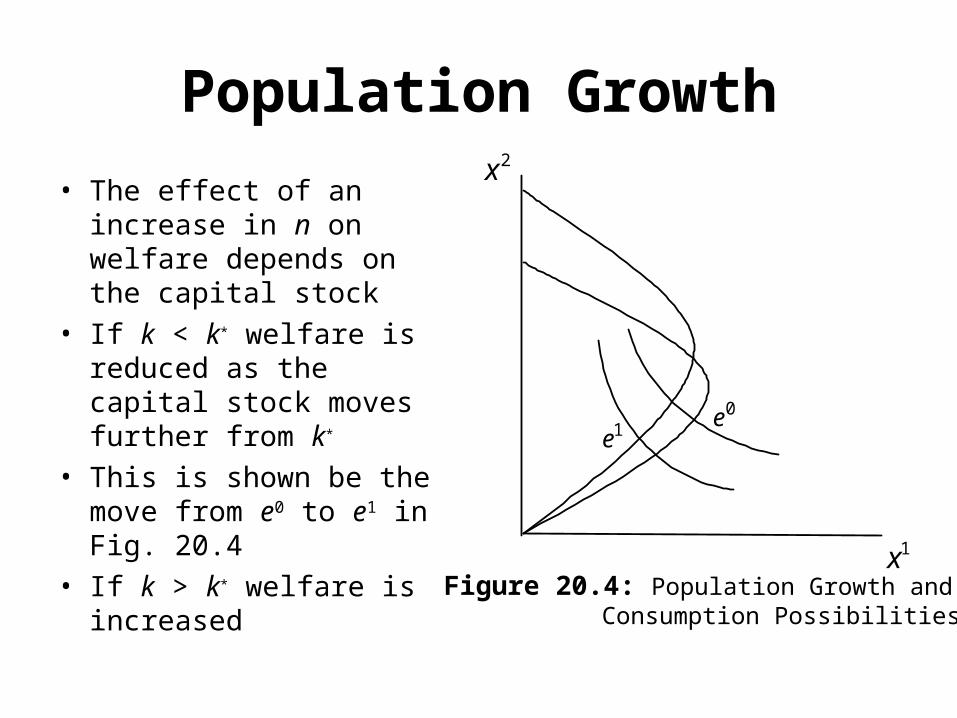
• The effect of an increase in n on welfare depends on the capital stock
• If k < k* welfare is reduced as the capital stock moves further from k*
• This is shown be the move from e0 to e1 in Fig. 20.4
• If k > k* welfare is increased
1x
2x
0e1e
Figure 20.4: Population Growth and Consumption Possibilities
Population Growth
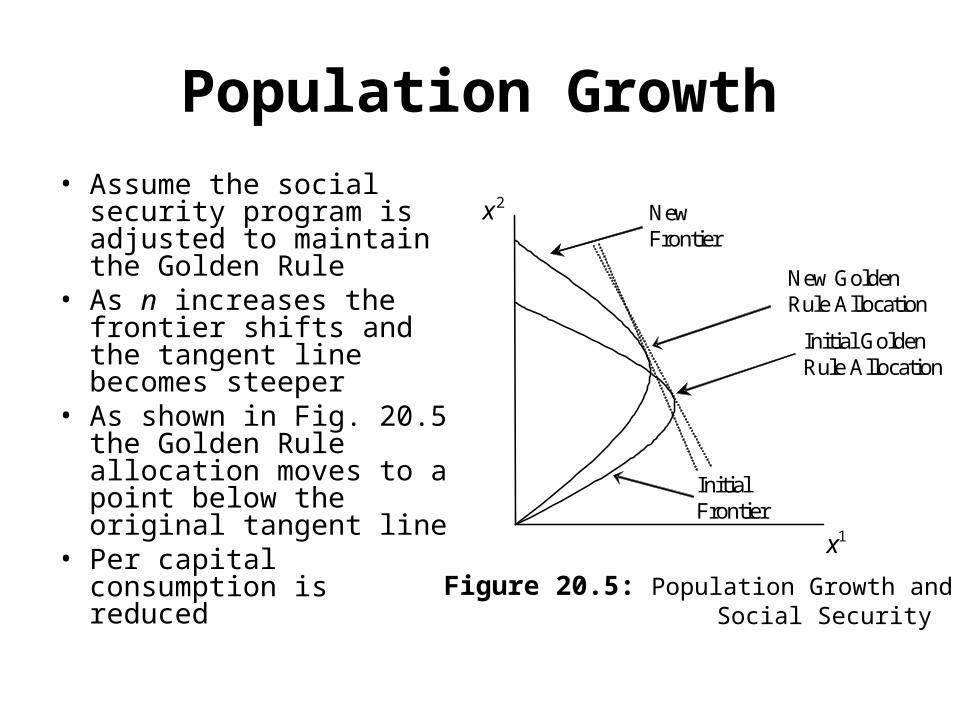
• Assume the social security program is adjusted to maintain the Golden Rule
• As n increases the frontier shifts and the tangent line becomes steeper
• As shown in Fig. 20.5 the Golden Rule allocation moves to a point below the original tangent line
• Per capital consumption is reduced
1x
2x
Initial Frontier
NewFrontier
Initial Golden Rule Allocation
New Golden Rule Allocation
Figure 20.5: Population Growth and Social Security
Sustaining a Program
• In the economy without production the introduction of social security is a Pareto improvement
• But it is not privately rational– The young in any generation can gain by not giving a
pension to the old provided they still expect to receive a pension
– Giving a transfer is not a Nash equilibrium strategy
• This raises the question of how the program can be sustained
Sustaining a Program
• One explanation is that the young are altruistic– They care about the consumption level or utility of the
old• Altruism alters the nature of preferences but is
not inconsistent with the aim of maximizing utility• Altruistic preferences can be written as
or • Both forms of utility provide a private incentive
for the young to transfer resources to the old
tt
tt
ttt xxxUU 1
1,,
11,,
ttt
ttt UxxUU
Sustaining a Program
• A second reason why a program can be sustained is the threat of removal of pension
• Not making a transfer to the old is a Nash equilibrium strategy
• This argument relies on believing a transfer will still be received
• The social security program is repeated over many periods so more complex strategies are possible
• Punishment strategies can be adopted
Sustaining a Program
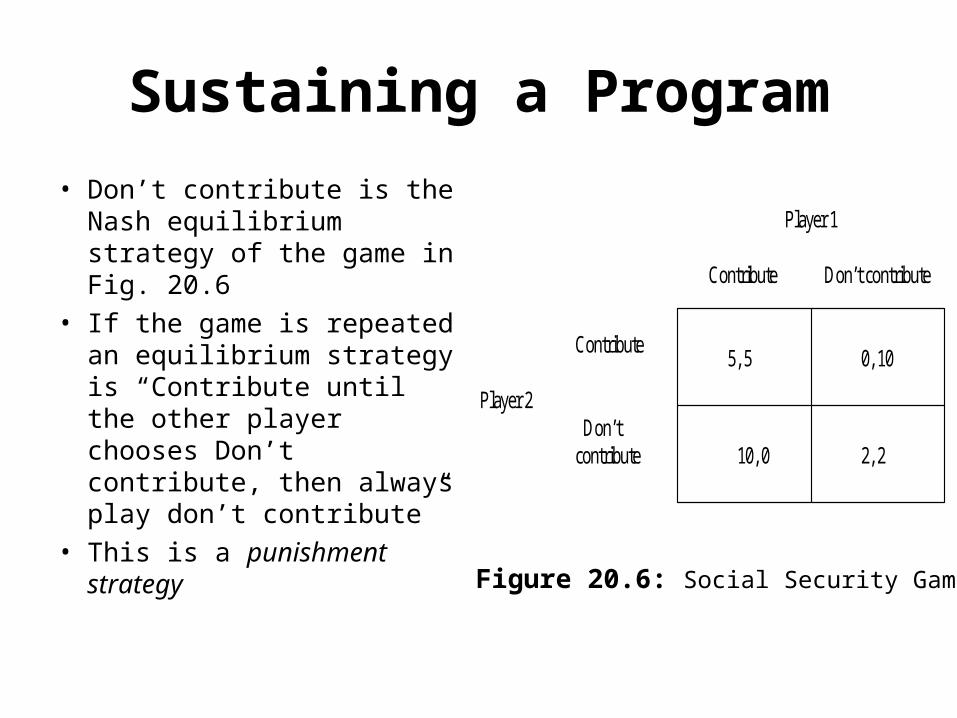
• Don’t contribute is the Nash equilibrium strategy of the game in Fig. 20.6
• If the game is repeated an equilibrium strategy is “Contribute until the other player chooses Don’t contribute, then always play don’t contribute”
• This is a punishment strategy
Contribute Don’t contribute
Contribute
Don’t contribute
5, 5
2, 2
0, 10
10, 0
Player 1
Player 2
Figure 20.6: Social Security Game
Sustaining a Program
• Assume the discount factor is • The payoff from always playing Contribute is 5 +
5 + 52 + … = 5[1/1 – ]• If Don’t contribute is played the payoff is 10 + 2
+22 + … = 10 + 2[/1 – ]• The payoff from Contribute is higher is > 5/8• The punishment strategy supports the efficient
equilibrium• The same mechanism can work for social
security
Ricardian Equivalence
• Ricardian equivalence applies when changes in government policy do not affect economic equilibrium
• This occurs when changes in individual behavior completely offset the policy change
• Changes in private saving ensure a fully-funded social security system does not affect the capital-labor ratio– This was an example of Ricardian equivalence
Ricardian Equivalence
• Ricardian equivalence can also apply to programs that are not fully funded
• A program that is not fully funded will affect a number of generations– The costs and benefits of the program are distributed
across time• If generations are linked through
intergenerational concern then a dynasty of consumers can offset a program
• This generates Ricardian equivalence for a broader range of policies
Ricardian Equivalence
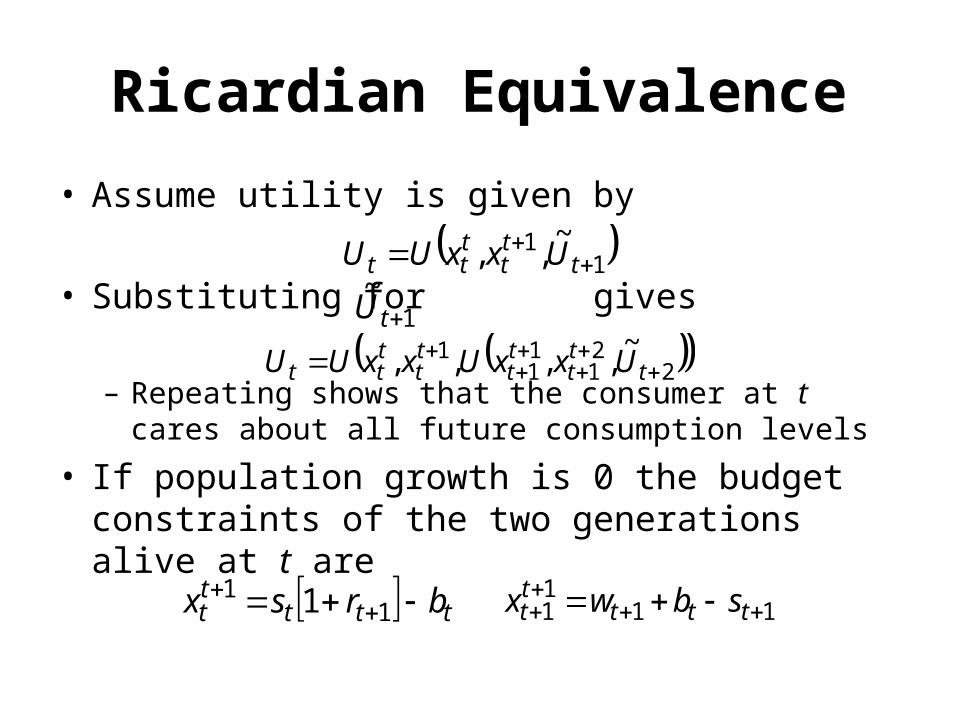
• Assume utility is given by
• Substituting for gives
– Repeating shows that the consumer at t cares about all future consumption levels
• If population growth is 0 the budget constraints of the two generations alive at t are
11 ~,,
ttt
ttt UxxUU
221
11
1 ~,,,,
ttt
tt
tt
ttt UxxUxxUU
ttttt brsx
11 1 11
11
ttt
tt sbwx
1~
tU
Ricardian Equivalence
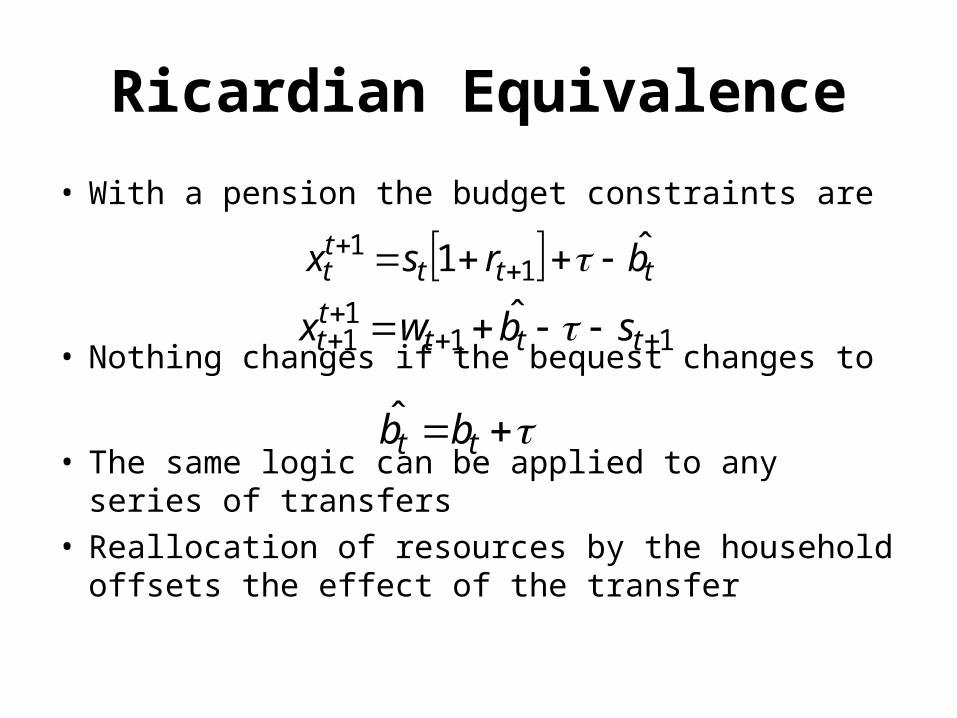
• With a pension the budget constraints are
• Nothing changes if the bequest changes to
• The same logic can be applied to any series of transfers
• Reallocation of resources by the household offsets the effect of the transfer
ttttt brsx ˆ1 1
1
1111
ˆ
ttt
tt sbwx
tt bb̂
Ricardian Equivalence
• The dynasty adjusts bequests to eliminate the effect of the policy
• This argument is limited by the need for there to be active intergenerational altruism
• The initial bequest must also be larger than the pension (unless transfers from children to parents are allowed)
• Ricardian equivalence can also be applied to government debt
Social Security Reform
• Increasing longevity and the decline in the birth rate are increasing the dependency ratio
• Many pension programs are unsustainable with significant tax increases
• This has lead to numerous reform proposals• The reform most often discussed is to move to a
fully funded system– A fully funded system can be government-run or
utilize private pensions
Social Security Reform
• The transition from pay-as-you-go to fully funded social security will take time
• Those currently in work will bear two costs– Financing the pensions of the retired– Purchase capital to finance their own pensions
• The welfare of those currently working will be reduced– The benefits will accrue to future generations
• This leads to political resistance to reforms
Social Security Reform
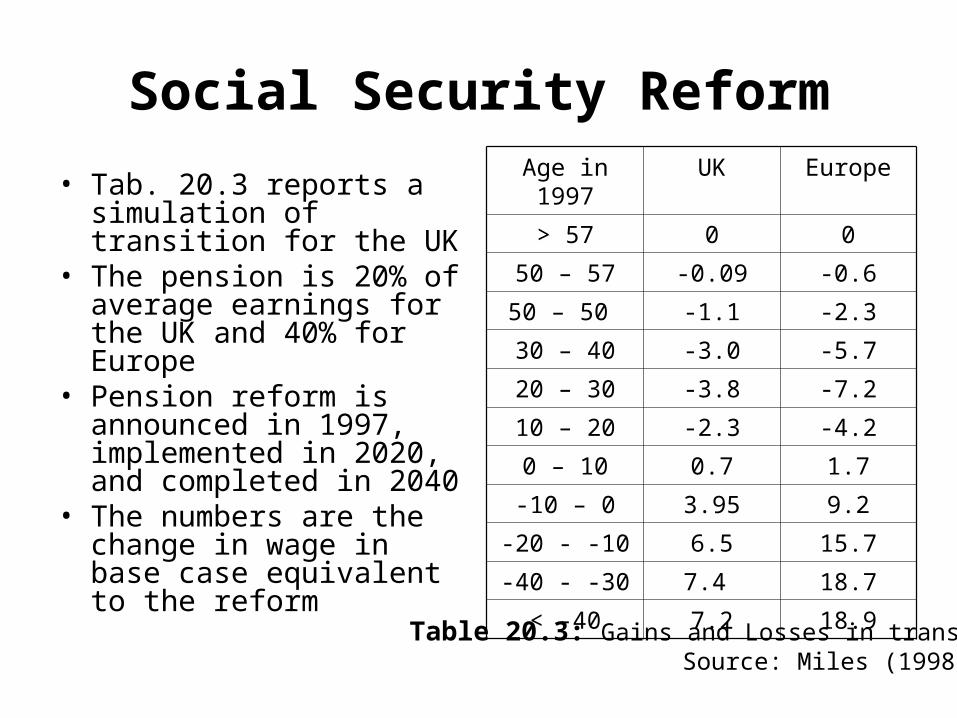
• Tab. 20.3 reports a simulation of transition for the UK
• The pension is 20% of average earnings for the UK and 40% for Europe
• Pension reform is announced in 1997, implemented in 2020, and completed in 2040
• The numbers are the change in wage in base case equivalent to the reform
Age in 1997 UK Europe
> 57 0 0
50 – 57 -0.09 -0.6
50 – 50 -1.1 -2.3
30 – 40 -3.0 -5.7
20 – 30 -3.8 -7.2
10 – 20 -2.3 -4.2
0 – 10 0.7 1.7
-10 – 0 3.95 9.2
-20 - -10 6.5 15.7
-40 - -30 7.4 18.7
< -40 7.2 18.9
Table 20.3: Gains and Losses in transition Source: Miles (1998)
Social Security Reform
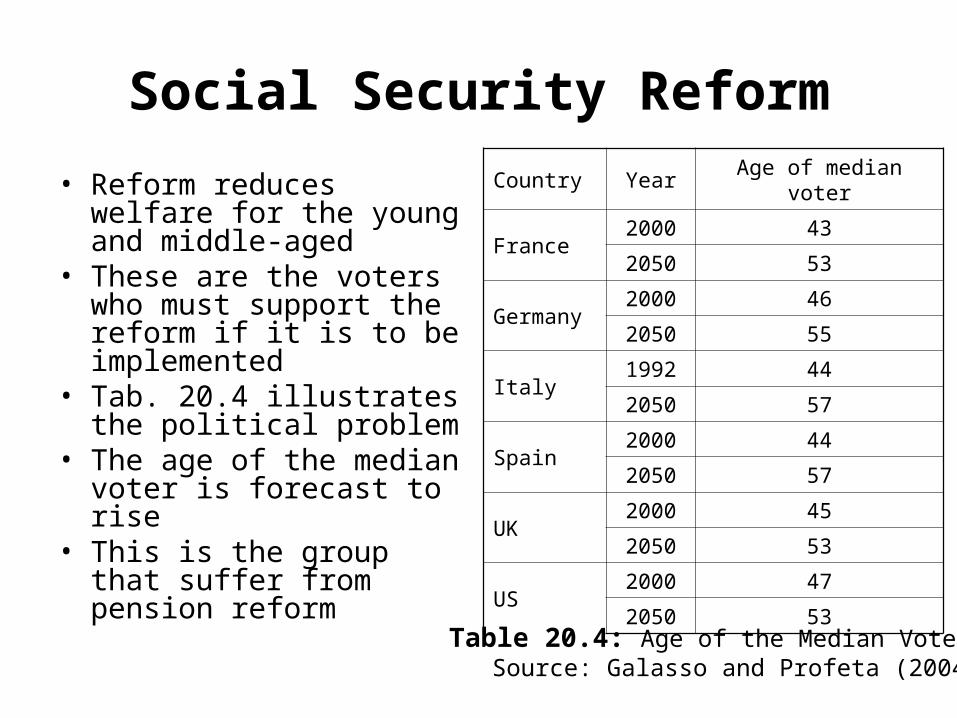
• Reform reduces welfare for the young and middle-aged
• These are the voters who must support the reform if it is to be implemented
• Tab. 20.4 illustrates the political problem
• The age of the median voter is forecast to rise
• This is the group that suffer from pension reform
Country Year Age of median voter
France2000 43
2050 53
Germany2000 46
2050 55
Italy1992 44
2050 57
Spain2000 44
2050 57
UK2000 45
2050 53
US2000 47
2050 53
Table 20.4: Age of the Median Voter Source: Galasso and Profeta (2004)
Social Security Reform
• A fully-funded government system is equivalent to private pensions– Provided both invest in the same assets
• In the US the state system invests only in long-term Treasury debt– This implies low risk and low return– Few private investors would select this portfolio
• Reform in the US could also allow investment in risky asset– But this raises questions about the acceptable degree
of risk
Social Security Reform
• A further issue is the choice between defined benefit and defined contribution systems
• A defined contribution system involves investments in a fund which are annuitized on retirement– The risk falls on the worker since the value of the fund
is uncertain• A defined benefit system involves contributions
which are a constant proportion of income and a known fraction of income is paid as a pension– The risk falls on the pension fund to meet
commitments


![Chapter 1 · Chapter 1 Shavua Reading Schedule (12th ... 7. w’lahem ‘eyn wa lad ki ‘Eliysheba` `aqarah u sh’neyhem ba’u ba ... [E OIIE D]DI IPTL DIDI L]](https://img.pdfslide.tips/doc/110x75/5ad366027f8b9a05208decc5/chapter-1-1-shavua-reading-schedule-12th-7-wlahem-eyn-wa-lad-ki-eliysheba.jpg)