Embed Size (px)
Citation preview
CHAPTER 3
PROBABILITY
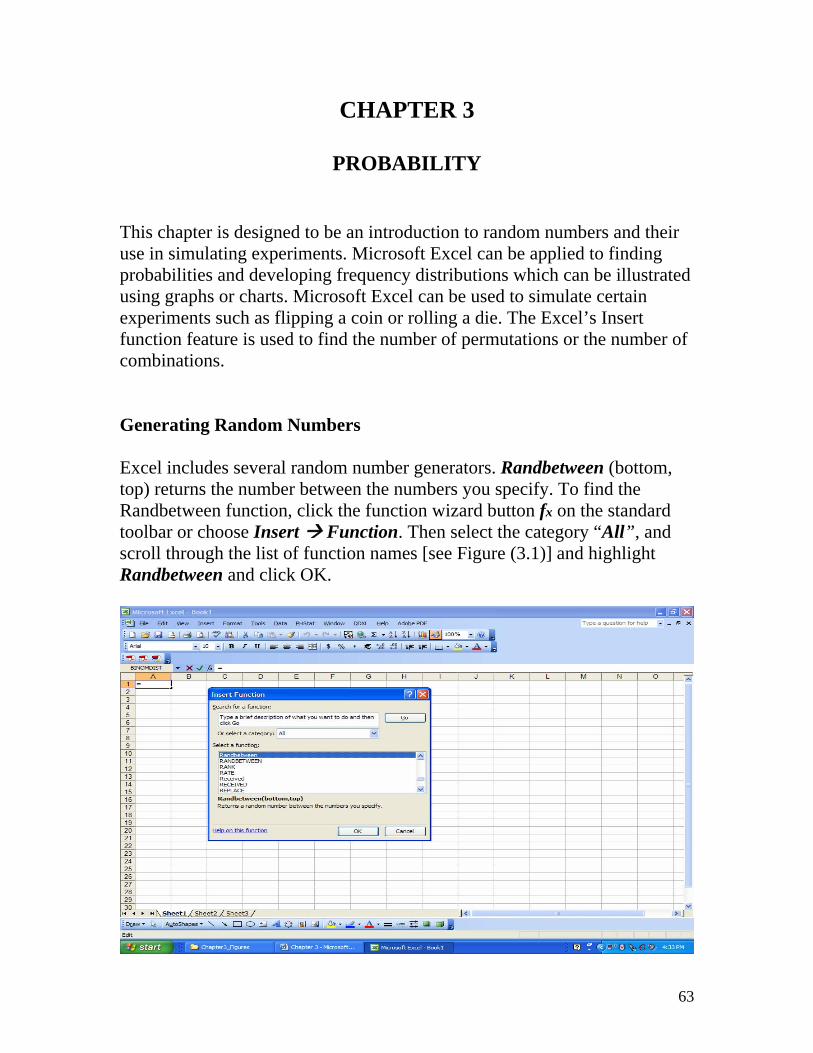
This chapter is designed to be an introduction to random numbers and their use in simulating experiments. Microsoft Excel can be applied to finding probabilities and developing frequency distributions which can be illustrated using graphs or charts. Microsoft Excel can be used to simulate certain experiments such as flipping a coin or rolling a die. The Excel’s Insert function feature is used to find the number of permutations or the number of combinations. Generating Random Numbers Excel includes several random number generators. Randbetween (bottom, top) returns the number between the numbers you specify. To find the Randbetween function, click the function wizard button fx on the standard toolbar or choose Insert Function. Then select the category “All”, and scroll through the list of function names [see Figure (3.1)] and highlight Randbetween and click OK.
63
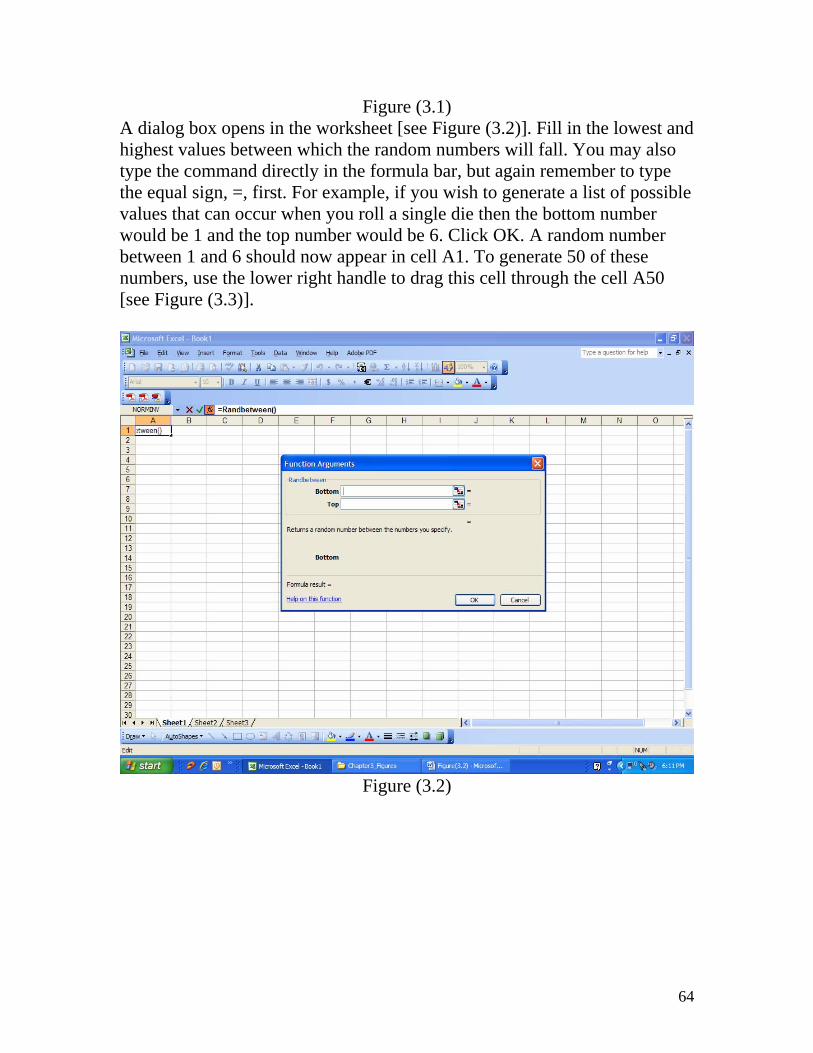
Figure (3.1) A dialog box opens in the worksheet [see Figure (3.2)]. Fill in the lowest and highest values between which the random numbers will fall. You may also type the command directly in the formula bar, but again remember to type the equal sign, =, first. For example, if you wish to generate a list of possible values that can occur when you roll a single die then the bottom number would be 1 and the top number would be 6. Click OK. A random number between 1 and 6 should now appear in cell A1. To generate 50 of these numbers, use the lower right handle to drag this cell through the cell A50 [see Figure (3.3)].
Figure (3.2)
64

Figure (3.3)
Simulation and Probabilities A simulation of a procedure is a process that behaves the same way as a procedure, so that similar results are generated. Simulating Simple Events Example 3.1: Use Excel to simulate the experiment of tossing a coin 10 times.
65
Solution:
- On a new worksheet, enter the data as shown below.
A
B
C D E F
1
0=Tail
1=Head
2
Toss 1
3
Toss 2
4
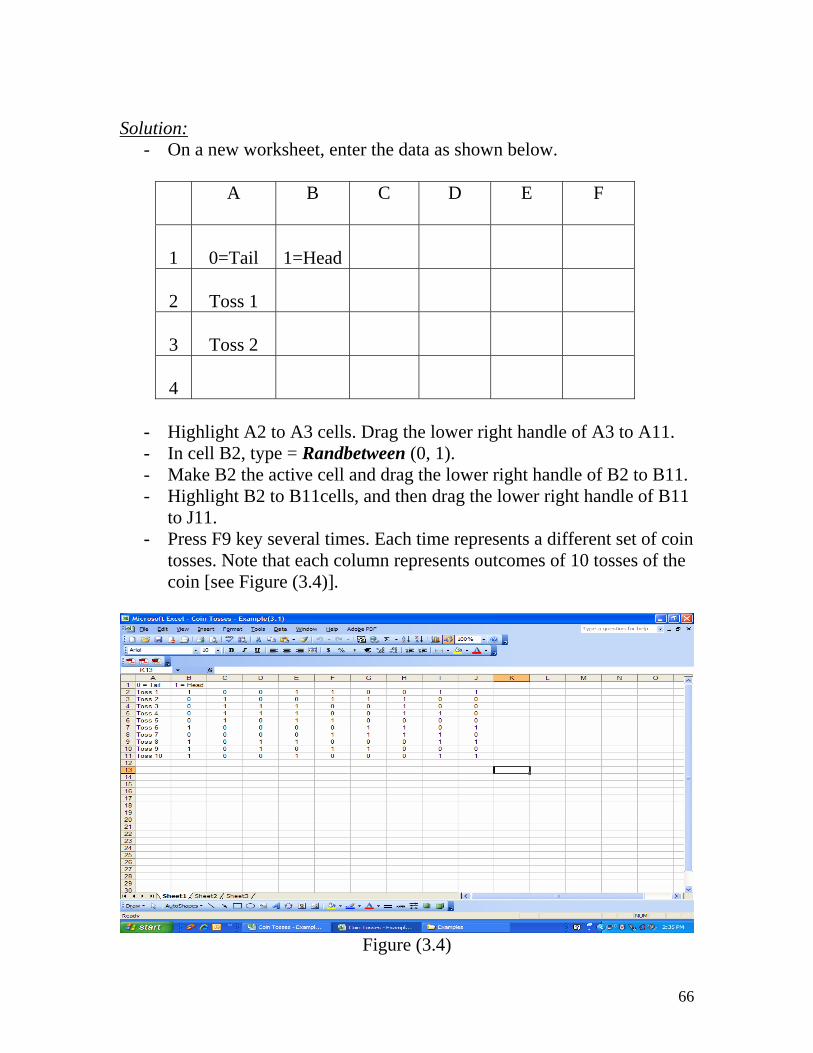
- Highlight A2 to A3 cells. Drag the lower right handle of A3 to A11. - In cell B2, type = Randbetween (0, 1). - Make B2 the active cell and drag the lower right handle of B2 to B11. - Highlight B2 to B11cells, and then drag the lower right handle of B11
to J11. - Press F9 key several times. Each time represents a different set of coin
tosses. Note that each column represents outcomes of 10 tosses of the coin [see Figure (3.4)].
Figure (3.4)
66

Example 3.2: Simulate the experiment of tossing a coin 300 times. Determine the probabilities of heads and tails by looking at the percent of heads and the percent of tails. Solution:
- Assign the outcomes heads to digit 1 and tails to 0. - Type coin toss in A1. - Type =Randbetween (0, 1) in A2. - Make A2 the active cell and drag the lower right handle of A2 to
A301. - Press F9 to apply the random integer generating command to each of
the selected items. - In the cells C1, D1, and E1, type Outcome, Frequency, and Relative
frequency (Probability), respectively. - Use COUNTIF (data range, criteria) to find the number of heads and
tails in column A. COUNTIF (A2: A301, 1) returns # of heads in column A and count if (A2:A301, 0) returns # of tails in the same column.
- In column E we calculated the relative frequency of the heads and tails [see Figure (3.5)].
Simulating Multiple Events We consider here a problem that requires more than one event to occur, such as the probability of a specific sum (say, sum=7) when two dice are rolled. In the following example, we are simulating the rolling of a pair of dice. Example 3.3: Simulate the rolling of a pair of dice 25 times. Use column A for first die, column B for the second die, and column C for the Sum.
67

Figure (3.5)
Solution:
- Type “First Die” in cell A1, type “Second Die” in cell B1, and type “sum” in cell C1.
- In cells A2 to A26, use Randbetween function to generate 25 random values between 1 and 6.
- In cells B2 to B26 use Randbetween function to generate 25 random values between 1 and 6.
- In cell C2 type = Sum (A2:B2) and press Enter. - Copy this formula down through to cell C26 by activating cell C2 and
dragging the lower right handle of C2 to C26. This should give the sums of the rolls of two dice. Once again you will notice that the entries in your first columns have changed. This is normal. By pressing F9, the values in the three columns will change which is again normal.
- To find the probability of getting a sum of 7, that is we find P (sum of 7) = 2/25=.08 [See Figure (3.6)].
68
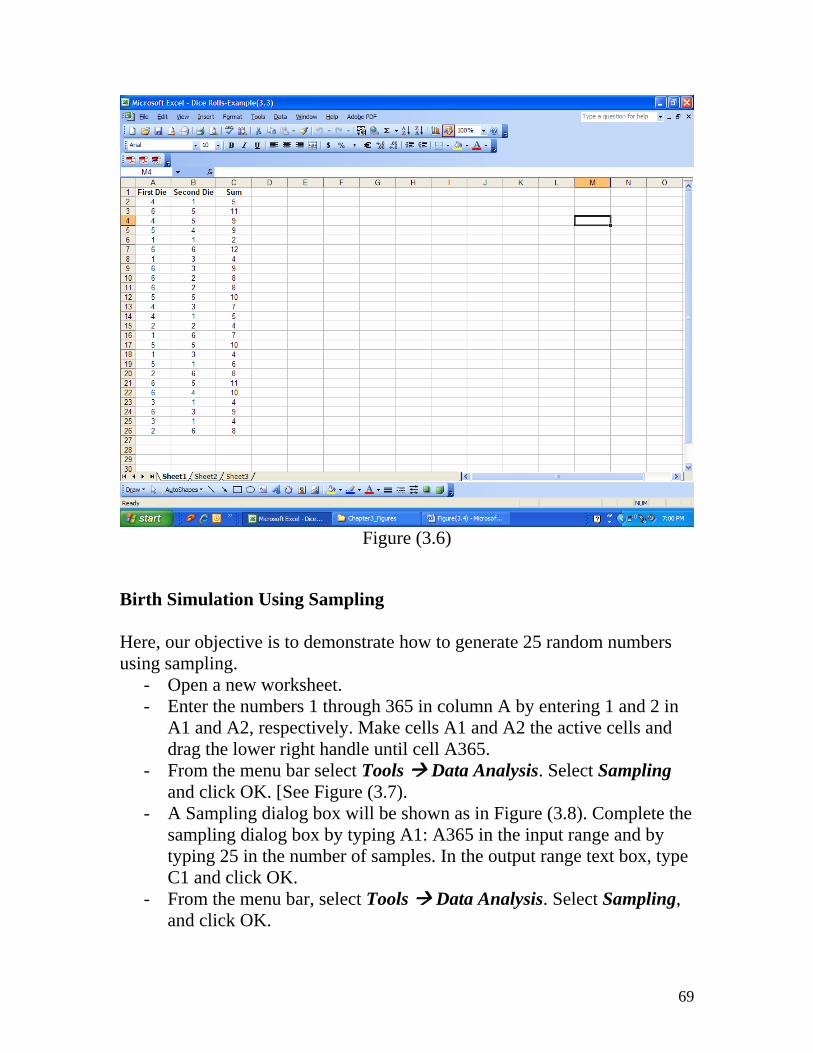
Figure (3.6)
Birth Simulation Using Sampling Here, our objective is to demonstrate how to generate 25 random numbers using sampling.
- Open a new worksheet. - Enter the numbers 1 through 365 in column A by entering 1 and 2 in
A1 and A2, respectively. Make cells A1 and A2 the active cells and drag the lower right handle until cell A365.
- From the menu bar select Tools Data Analysis. Select Sampling and click OK. [See Figure (3.7).
- A Sampling dialog box will be shown as in Figure (3.8). Complete the sampling dialog box by typing A1: A365 in the input range and by typing 25 in the number of samples. In the output range text box, type C1 and click OK.
- From the menu bar, select Tools Data Analysis. Select Sampling, and click OK.
69

Figure (3.7)
Figure (3.8)
70
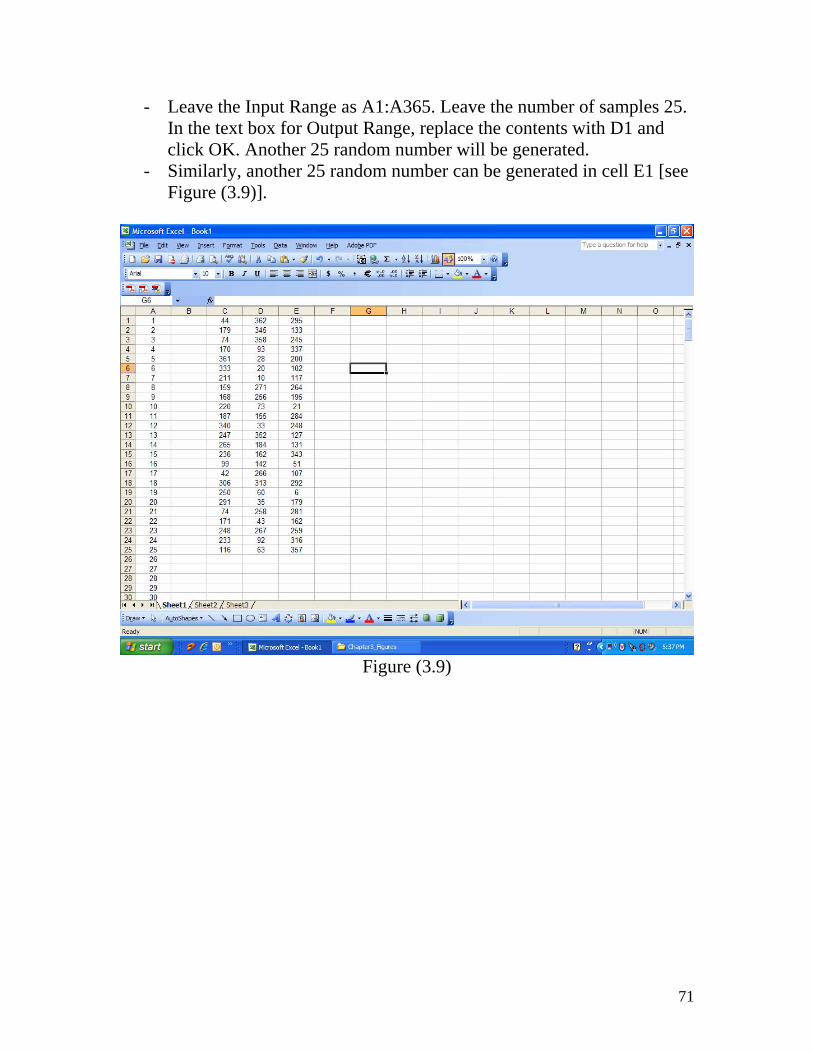
- Leave the Input Range as A1:A365. Leave the number of samples 25. In the text box for Output Range, replace the contents with D1 and click OK. Another 25 random number will be generated.
- Similarly, another 25 random number can be generated in cell E1 [see Figure (3.9)].
Figure (3.9)
71
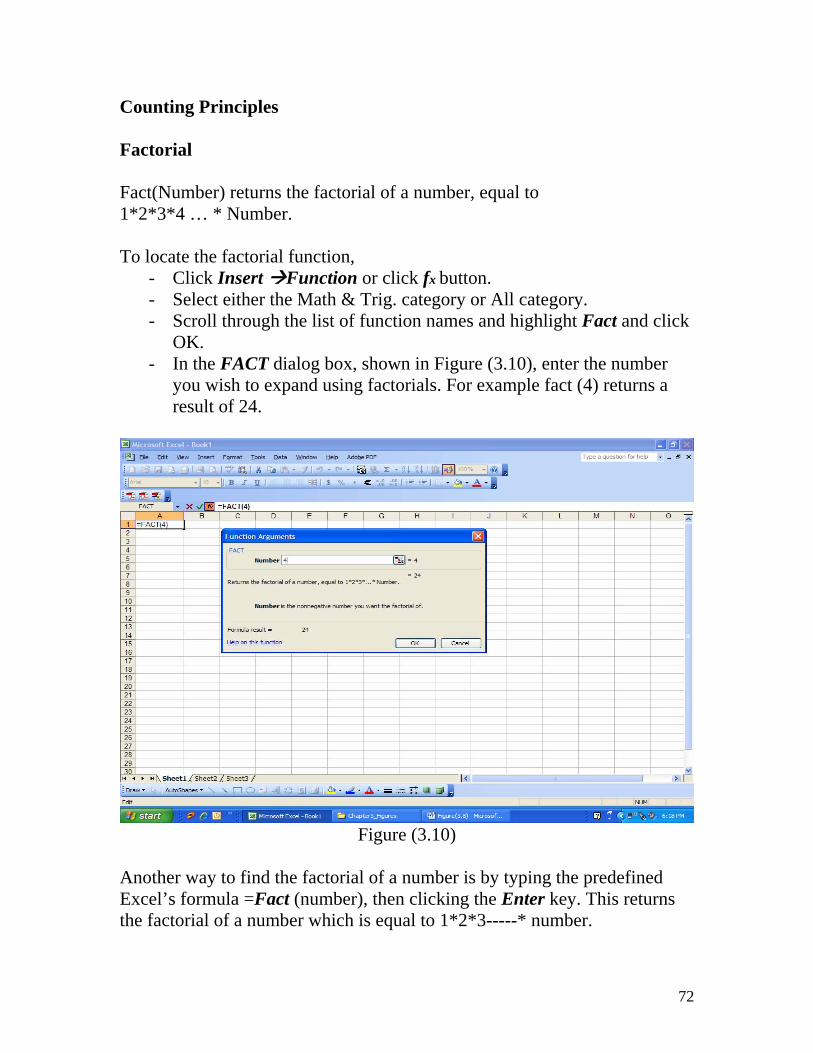
Counting Principles Factorial Fact(Number) returns the factorial of a number, equal to 1*2*3*4 … * Number. To locate the factorial function,
- Click Insert Function or click fx button. - Select either the Math & Trig. category or All category. - Scroll through the list of function names and highlight Fact and click
OK. - In the FACT dialog box, shown in Figure (3.10), enter the number
you wish to expand using factorials. For example fact (4) returns a result of 24.
Figure (3.10)
Another way to find the factorial of a number is by typing the predefined Excel’s formula =Fact (number), then clicking the Enter key. This returns the factorial of a number which is equal to 1*2*3-----* number.
72

Permutations The PERMUT (permutation) function can be found in the function dialog box in the statistical function category. PERMUT (number, number-chosen) returns the number of permutations for a given number of objects that can be selected from the total objects. In Microsoft Excel we can locate the Permutations functions as follows.
- Click Insert Function, or click the fx button. - Select Statistical category or All category. - Scroll through the list of function names and highlight the PERMUT
function and click OK. Another way to find the permutations is by typing the predefined Excel’s formula = PERMUT (number, number-chosen), then clicking the Enter key.
Combinations The COMBIN (Combinations) function can be found in the function Dialog box in the Math &Trig. function category. COMBIN (number, number-chosen) returns the number of combinations for a given number of items. In Microsoft Excel we can locate the Combination functions as follows.
- Click Insert Function, or click the fx button. - Select Math & Trig category or All category. - Scroll through the list of function names and highlight the COMBIN
function and click OK. Another way to find the combinations is by typing the predefined Excel’s formula = COMBIN (number, number-chosen), then clicking the Enter key. In the PERMUT dialog box, shown in Figure (3.11), enter the total number of objects in the number and the number of objects in each permutation in the number-chosen. For example, PERMUT (10, 3) returns a result of 720. In the COMBIN dialog box, shown in Figure (3.12), enter the total number of objects in the number and the number of objects in each Combination in the number-chosen. For example, COMBIN(10, 3) returns a result of 120.
73

Figure (3.11)
Figure (3.12)
74

Example 3.4:
1. How many ways 5 different books can be arranged on a shelf? 2. How many committees of 3 members (President, Vice President, and
Secretary) can be formed out of 8 people? 3. How many ways can a committee of 4 people be selected from a
group of 10 people? Solution:
1. By using factorial function, the answer is 5! = 120. 2. By using the permutation function, the answer is 8P3 = 336. 3. By using the combination function, the answer is 10C4 = 210 [see
Figure (3.13)]
Figure (3.13)
75
Microsoft Excel Lab Experiments Lab Experiment 3.1 Use Randbetween function to simulate 100 rolls of a fair die. Make a table showing the frequency and the relative frequency of each outcome. Compare the results with the actual (theoretical) expected percentages (16.7% for each outcome). Repeat the process for 800 rolls. Are these outcomes closer to the results predicted by theory? Lab Experiment 3.2: Use Randbetween command to simulate 100 tosses of a fair coin. Make a table showing the frequency of each outcome and the relative frequency. Compare the results with the actual (theoretical) expected percentages (50% for each outcome). Repeat the process for 900 tosses. Are these outcomes closer to the results predicted by theory? Lab Experiment 3.3: (Birth Simulation) Use Microsoft Excel to simulate 600 births, and where each birth results in a boy (1=boy) or a girl (0=girl). Sort the results, count the number of boys, and enter the value here: _____. Based on the results, estimate the probability of the baby being a boy. Enter the estimated probability here: _____. The estimated probability is likely to be different from 0.5. Does this suggest that the computer’s random generator is defective? Why or why not? Lab Experiment 3.4: (Rolling a pair of dice 1000 times) Simulate the rolling of a pair of dice 1000 times. Use column A for one die, use column B for the second die, and use column C for the sum of the two columns A and B. Sort the results in column C, then find the number of times that the total was exactly 9. Enter the value here: _____. Based on that result, estimate the probability of getting a sum of 9 when two dice are rolled. Enter the estimated probability here: _____. How does this estimated probability compare to the actual probability of 0.1111.
76

Lab Experiment 3.5:3
You roll a pair of dice and record the sum. a. List all of the possible sums and determine the probability of rolling
each sum. b. Use Microsoft Excel to simulate rolling a pair of dice and recording
the sum 200 times. Make a tally of the 200 sums and use these results to list the probability of rolling each sum.
c. Compare the probabilities in part (a) with the probabilities in part (b). Explain any similarities or differences.
Lab Experiment 3.6: In a test of a gender-selection method, 12 babies are born and 8 of them are boys.
a. Find the number of different possible sequences of genders that are possible when 12 babies are born.
b. How many of ways can 8 boys and 4 girls be arranged in a sequence? c. If 12 babies are randomly selected, what is the probability that they
consist of 8 boys and 4 girls? Lab Experiment 3.7: There are 14 members on the board of directors for Memorial Hospital.
a. If they must select a chairperson, vice chairperson, and secretary, how many different slates of candidates are possible?
b. If they must form a subcommittee of three members, how many different subcommittees are possible?
3 Larson and Farber, Elementary Statistics, Picturing the World, Pearson Prentice Hall, 2006.
77

Lab Experiment 3.8: (Law of Large Numbers) In this experiment, we test the law of Large Numbers, which states that “as an experiment is repeated over and over, the empirical probability of an event approaches the actual probability of the event”. We will consider a success to be the outcome of 5. Based on the classical definition of probability, we know that P (5) = 1/6 = 0.167 (approximately).
1. Simulate 10 trails by generating 10 integers between 1 and 6. Count the number of 5’s that occurred and divides that number by 10 to get the empirical probability. Based on 10 trials, P(5) is approximately _____.
2. Repeat part (1) for 40 trials. Based on 40 trials, P(5) is approximately _____.
3. Repeat part (1) for 100 trials. Based on 100 trials, P(5) is approximately _____.
4. Repeat part (1) for 600 trials. Based on 500 trials, P(5) is approximately _____.
5. Repeat part (1) for 15000 trials. Based on 1500 trials, P(5) is approximately _____.
6. In your own words, generalize these results in a restatement of the Law or large numbers.
78


![Chapter 04.leeck/IS/ch04.pdfChapter 04. 웹 보안 : 웹, ... [그림 4-1] UCLA의 최초의 네트워크 노드 ... 웹 서비스에 이용되는 스크립트에는 자바 스크립트(JavaScript)나](https://img.pdfslide.tips/doc/110x75/5e4eaf0ed01a333d2873f7e1/chapter-04-leeckisch04pdf-chapter-04-e-ee-4-1-ucla.jpg)