Embed Size (px)
Citation preview
CHAPTER-II
First stereoselective total synthesis of Pectinolide H
INTRODUCTION
Five membered ring lactone containing a substitution at the γ-
position is a significant structural subunit in various bio-active
compounds.1 Natural products, which containing a γ-lactone moiety
known to display a variety of biological properties,2 including anti-fungal,
anti-bacterial,3 anti tumor,4 cytotoxic,5 cyclooxygenase or phospholipase
A2 inihibition.6 Pectinolide H (8) is a structurally characteristic γ-lactone
that has been isolated from the chloroform extract of the aerial parts of a
Mexican terrestrial plant Hyptis pectinata,7 which is used in traditional
mexican medicines for a multipurpose therapies in the treatment of
fevers, skin infections, gastric disturbances,8 and lung congestion.9
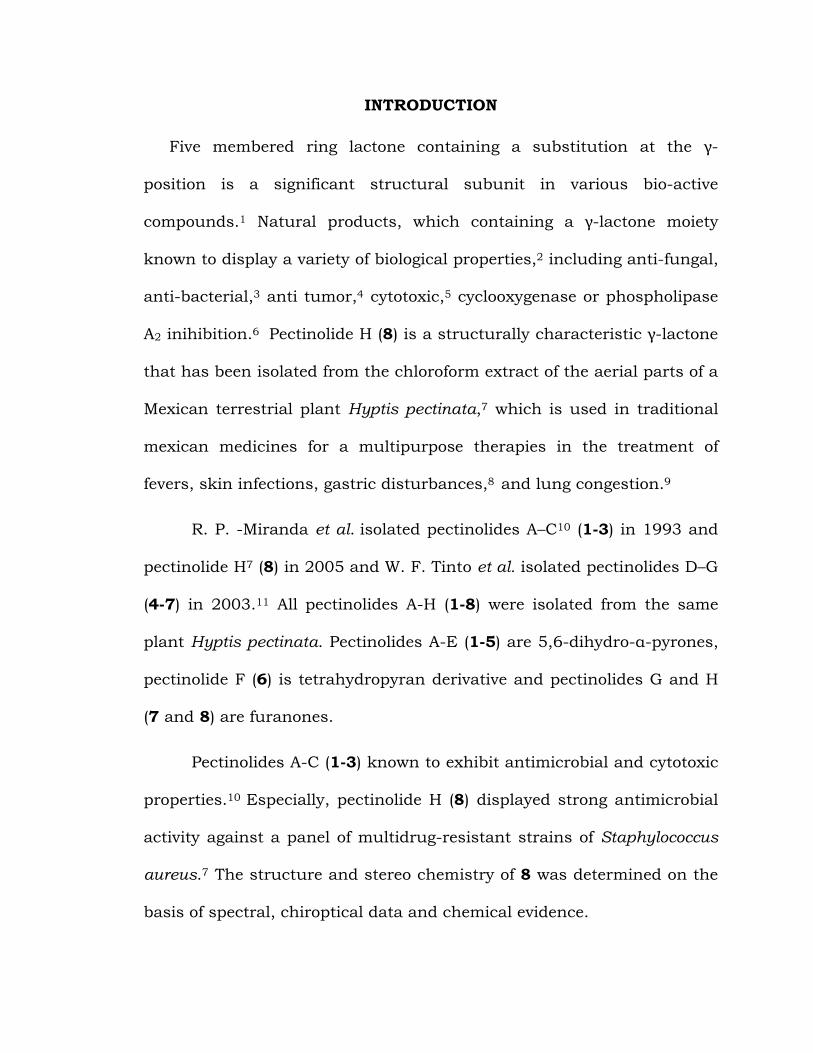
R. P. -Miranda et al. isolated pectinolides A–C10 (1-3) in 1993 and
pectinolide H7 (8) in 2005 and W. F. Tinto et al. isolated pectinolides D–G
(4-7) in 2003.11 All pectinolides A-H (1-8) were isolated from the same
plant Hyptis pectinata. Pectinolides A-E (1-5) are 5,6-dihydro-α-pyrones,
pectinolide F (6) is tetrahydropyran derivative and pectinolides G and H
(7 and 8) are furanones.
Pectinolides A-C (1-3) known to exhibit antimicrobial and cytotoxic
properties.10 Especially, pectinolide H (8) displayed strong antimicrobial
activity against a panel of multidrug-resistant strains of Staphylococcus
aureus.7 The structure and stereo chemistry of 8 was determined on the
basis of spectral, chiroptical data and chemical evidence.
OR2 O
OR1
O
Pectinolide A; R1 = R2 = Ac (1)
Pectinolide B; R1 = Ac, R2 = H (2)
Pectinolide C; R1 = H, R2 = Ac (3)
OAc O
R1
O
Pectinolide D; R1= OH, R2=H (4)
Pectinolide E; R1= OAc, R2= Ac (5)
OR2
OAc
OAc O
OAc
O
Pectinolide F (6)
OAc
OAc
OMe
OAc
Pectinolide G (7)
OAc
OAc
OO
Pectinolide H (8)
OAc OH
OO
54' 1' 1
PRESENT WORK
In continuation of our interest in the total synthesis of biologically
active natural products,12 accompanied by important biological activities
and significant structural features of pectinolide H (8) encouraged us to
explore the synthesis of this molecule. To the best of our knowledge,
there is no report on the synthesis of pectinolide H (8). Here in, we
explain an efficient and simple approach for the stereoselective total
synthesis of 8.
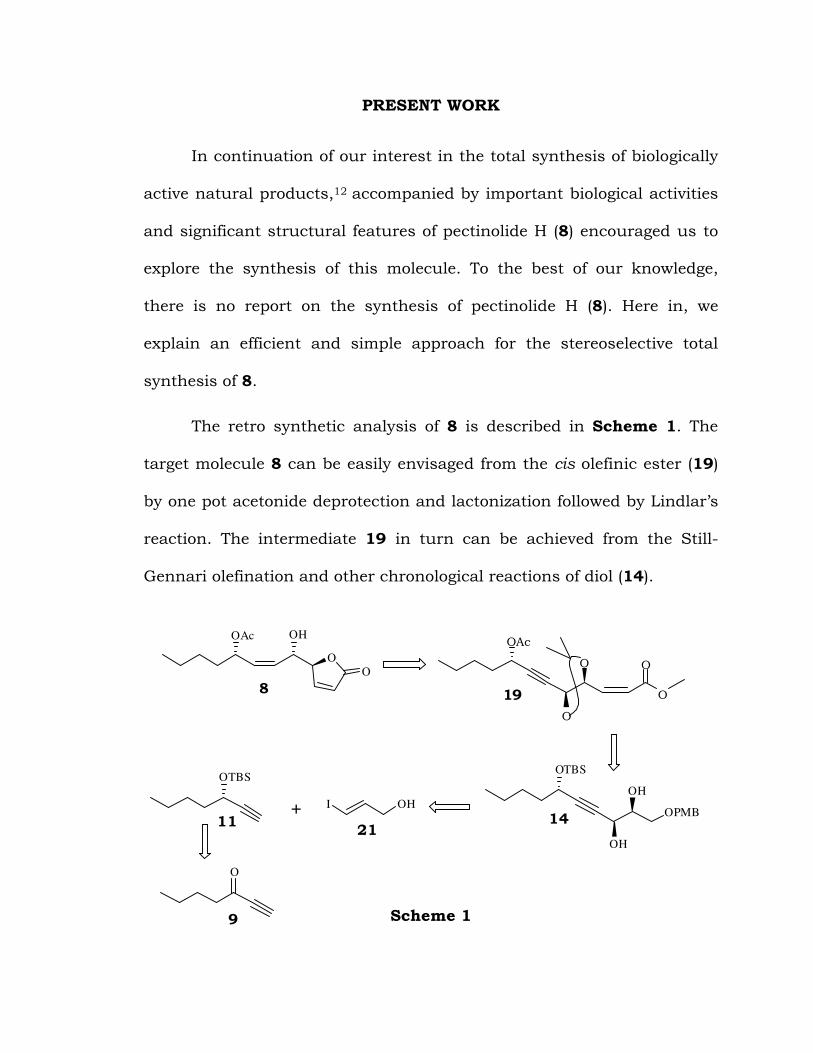
The retro synthetic analysis of 8 is described in Scheme 1. The
target molecule 8 can be easily envisaged from the cis olefinic ester (19)
by one pot acetonide deprotection and lactonization followed by Lindlar’s
reaction. The intermediate 19 in turn can be achieved from the Still-
Gennari olefination and other chronological reactions of diol (14).
Scheme 1
OAc OH
O
O
OTBS
OH
OH
OPMB
OTBS
+ I OH
8
O
1411
9
21
OAc
O
O
O
O
19
The intermediate 14 was prepared from the Sonogashira cross coupling
of alkyne (11) and iodoallylic alcohol (21). In addition, compound 11 was
prepared from the acetylenic ketone (9) by stereoselective asymmetric
reduction (Scheme 1).
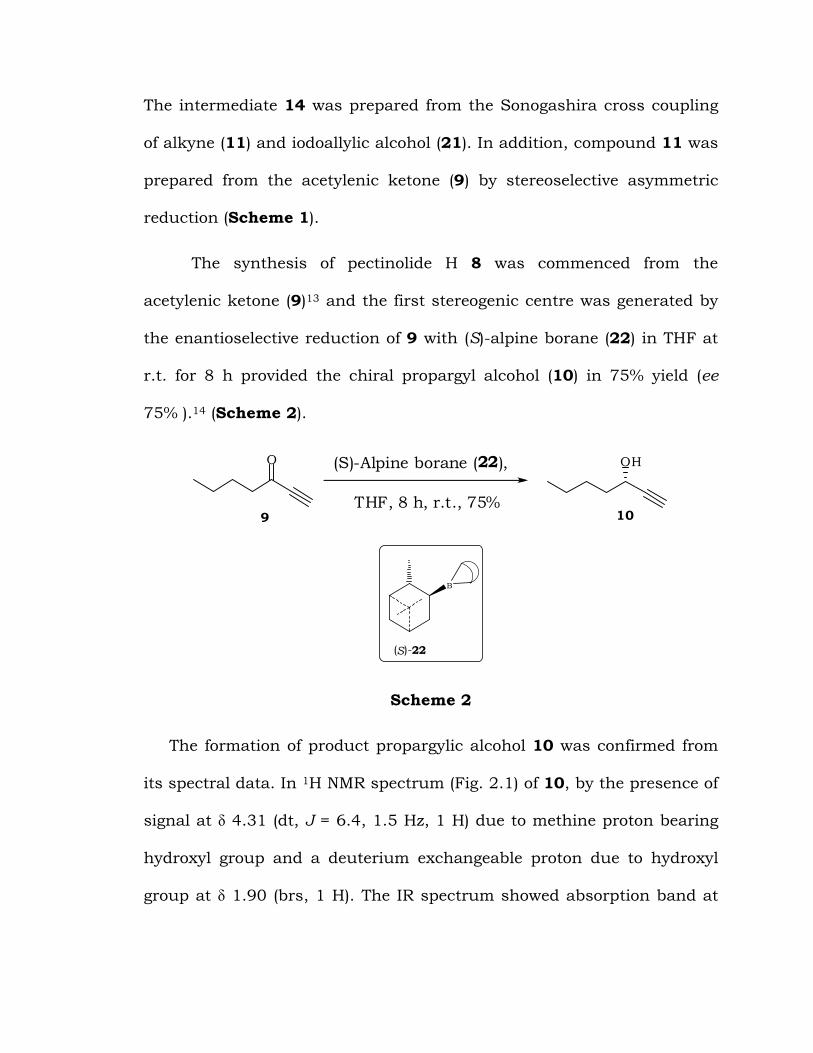
The synthesis of pectinolide H 8 was commenced from the
acetylenic ketone (9)13 and the first stereogenic centre was generated by
the enantioselective reduction of 9 with (S)-alpine borane (22) in THF at
r.t. for 8 h provided the chiral propargyl alcohol (10) in 75% yield (ee
75% ).14 (Scheme 2).
O OH
109
(S)-Alpine borane (22),
THF, 8 h, r.t., 75%
B
(S)-22
Scheme 2
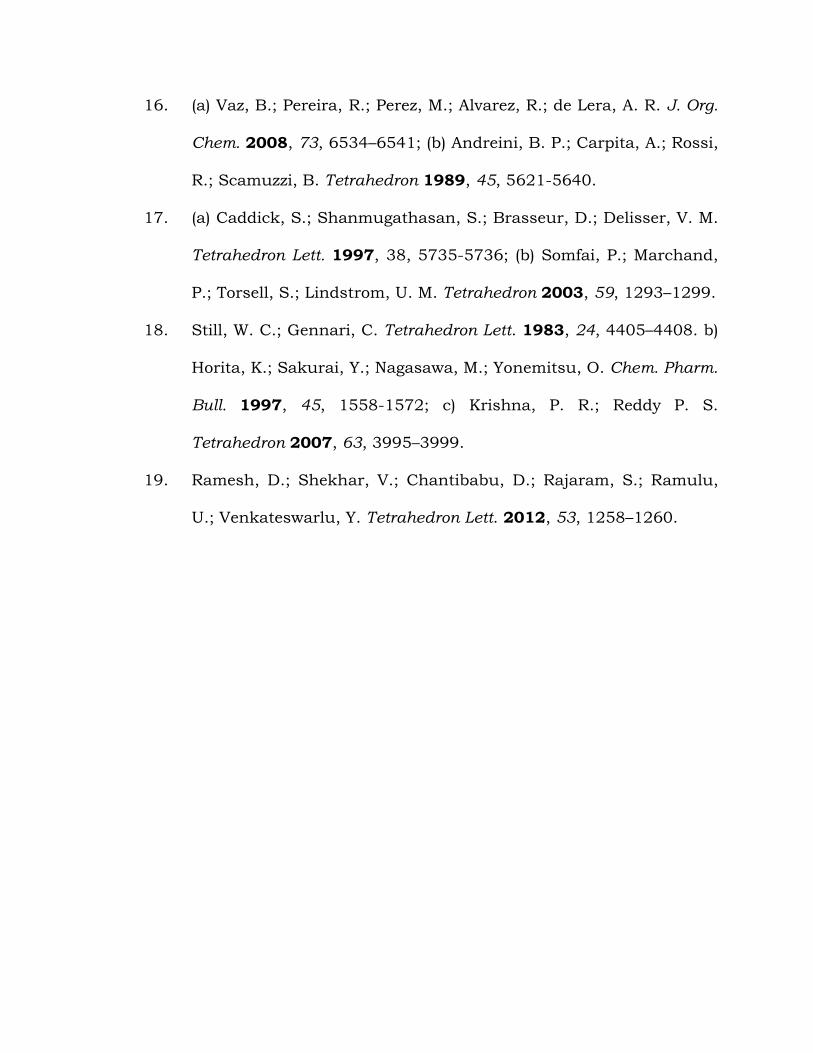
The formation of product propargylic alcohol 10 was confirmed from
its spectral data. In 1H NMR spectrum (Fig. 2.1) of 10, by the presence of
signal at \ 4.31 (dt, J = 6.4, 1.5 Hz, 1 H) due to methine proton bearing
hydroxyl group and a deuterium exchangeable proton due to hydroxyl
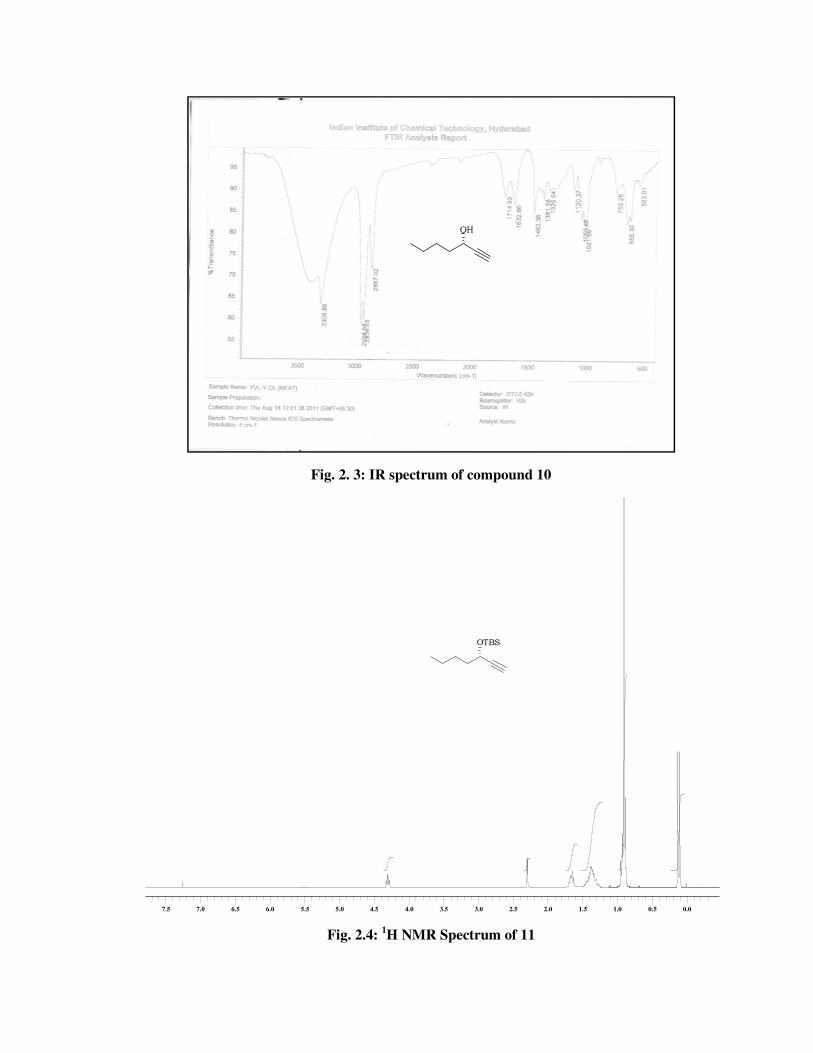
group at \ 1.90 (brs, 1 H). The IR spectrum showed absorption band at
3308 cm-1 for hydroxyl group. The 13C NMR spectrum (Fig. 2.2) of 10
showed a signal at \ 62.1 due to methine bearing hydroxy group in 10.
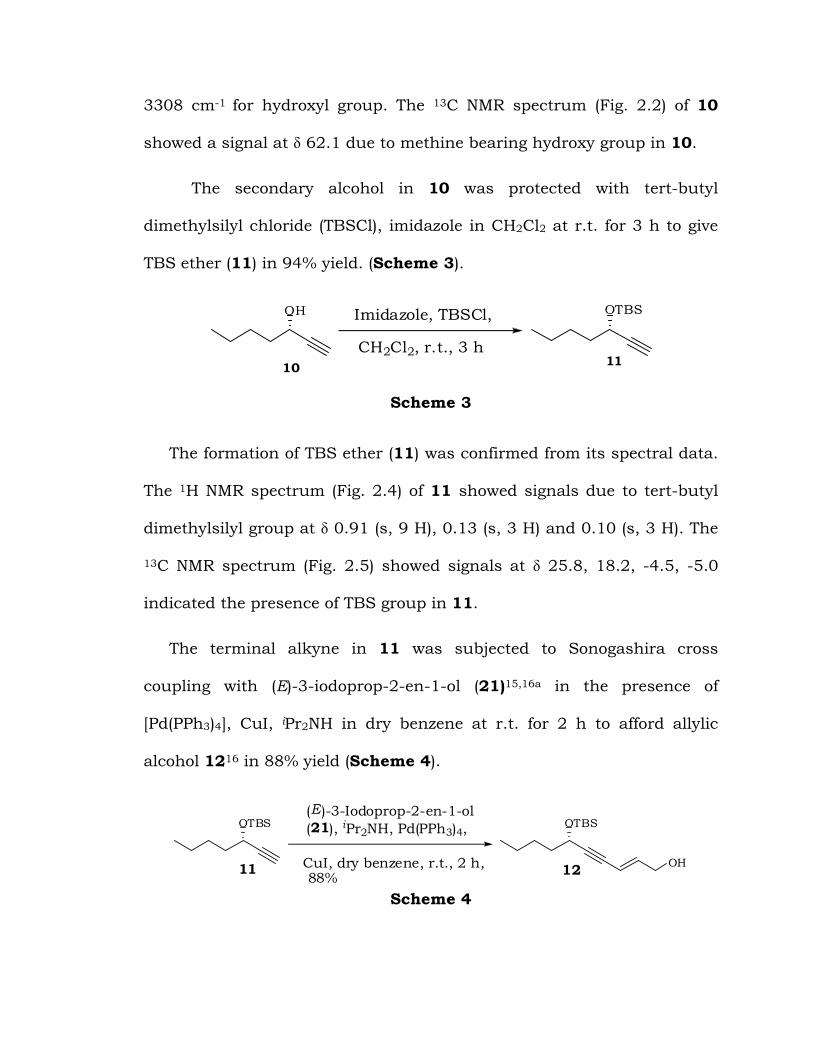
The secondary alcohol in 10 was protected with tert-butyl
dimethylsilyl chloride (TBSCl), imidazole in CH2Cl2 at r.t. for 3 h to give
TBS ether (11) in 94% yield. (Scheme 3).
OH OTBS
1011
Imidazole, TBSCl,
CH2Cl2, r.t., 3 h
Scheme 3
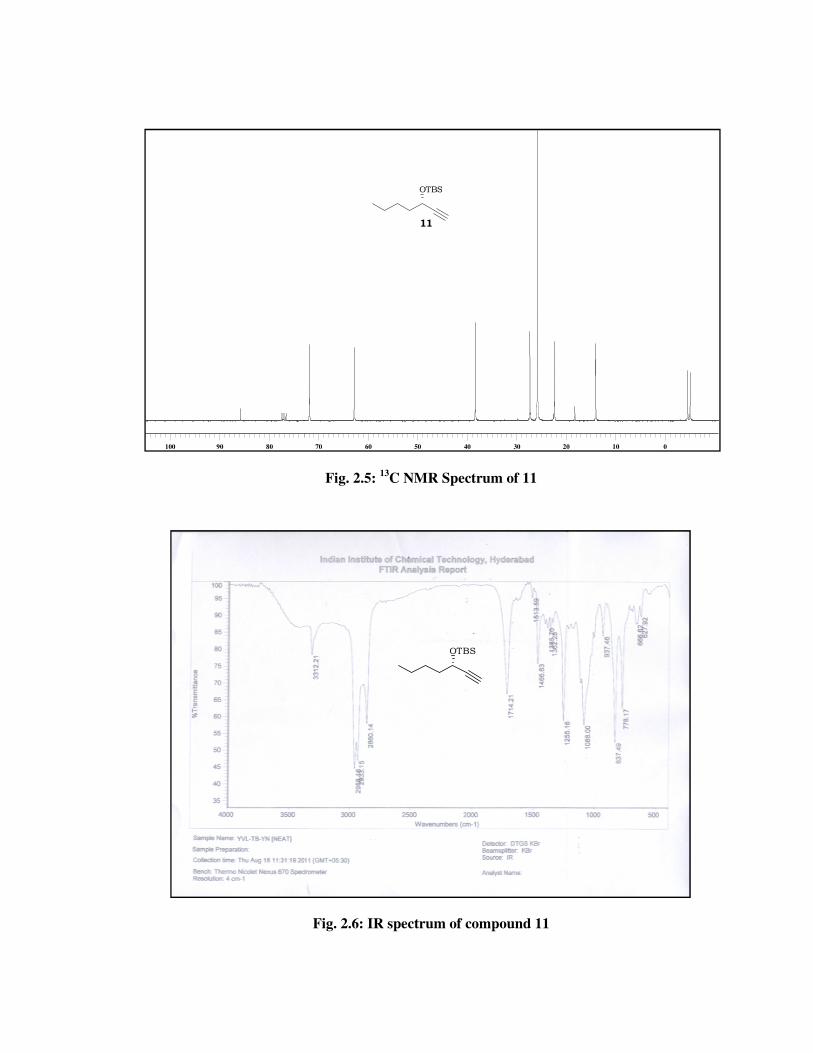
The formation of TBS ether (11) was confirmed from its spectral data.
The 1H NMR spectrum (Fig. 2.4) of 11 showed signals due to tert-butyl
dimethylsilyl group at \ 0.91 (s, 9 H), 0.13 (s, 3 H) and 0.10 (s, 3 H). The
13C NMR spectrum (Fig. 2.5) showed signals at \ 25.8, 18.2, -4.5, -5.0
indicated the presence of TBS group in 11.
The terminal alkyne in 11 was subjected to Sonogashira cross
coupling with (E)-3-iodoprop-2-en-1-ol (21)15,16a in the presence of
[Pd(PPh3)4], CuI, iPr2NH in dry benzene at r.t. for 2 h to afford allylic
alcohol 1216 in 88% yield (Scheme 4).
OTBS
1211
OTBS
OH
(E)-3-Iodoprop-2-en-1-ol
(21), iPr2NH, Pd(PPh3)4,
CuI, dry benzene, r.t., 2 h,88%
Scheme 4
The formation of product 12 was confirmed from its spectral data. Its
1H NMR spectrum (Fig. 2.7) showed signals at \ 6.21 (td, J = 15.8, 5.2
Hz, 1 H) and 5.80-5.72 (m, 1 H) indicated the presence of conjugated
double bond. In 13C NMR spectrum (Fig. 2.8) of 12, double bond carbons
resonated at \ 141.3 and 110.2. IR spectrum showed absorption band at
3387 cm-1 for hydroxyl group which confirmed the required product.
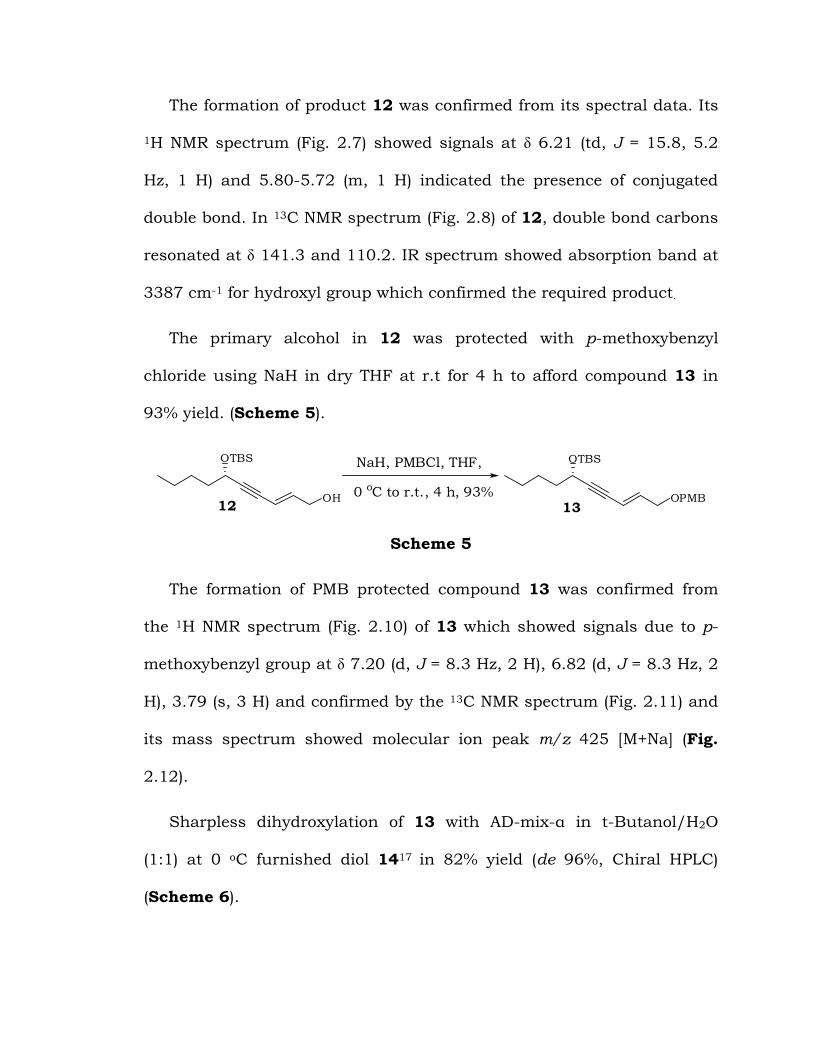
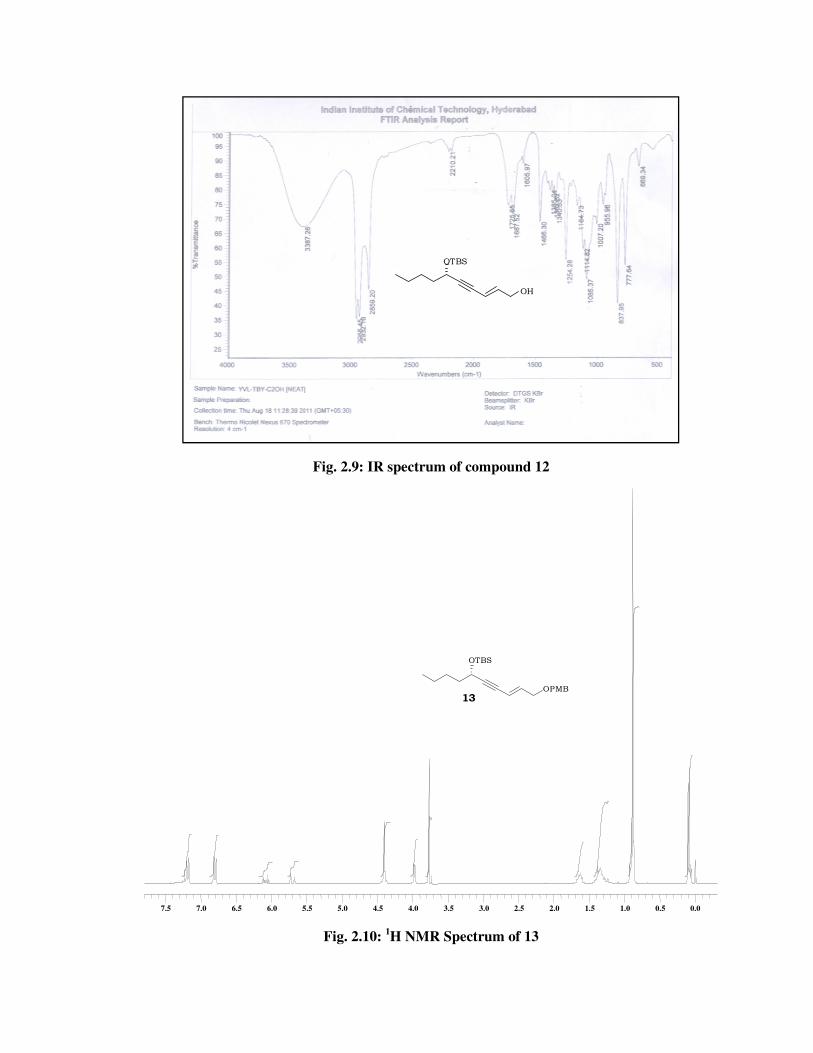
The primary alcohol in 12 was protected with p-methoxybenzyl
chloride using NaH in dry THF at r.t for 4 h to afford compound 13 in
93% yield. (Scheme 5).
12
OTBS
OH
OTBS
OPMB13
NaH, PMBCl, THF,
0 oC to r.t., 4 h, 93%
Scheme 5
The formation of PMB protected compound 13 was confirmed from
the 1H NMR spectrum (Fig. 2.10) of 13 which showed signals due to p-
methoxybenzyl group at \ 7.20 (d, J = 8.3 Hz, 2 H), 6.82 (d, J = 8.3 Hz, 2
H), 3.79 (s, 3 H) and confirmed by the 13C NMR spectrum (Fig. 2.11) and
its mass spectrum showed molecular ion peak m/z 425 [M+Na] (Fig.
2.12).
Sharpless dihydroxylation of 13 with AD-mix-α in t-Butanol/H2O
(1:1) at 0 oC furnished diol 1417 in 82% yield (de 96%, Chiral HPLC)
(Scheme 6).
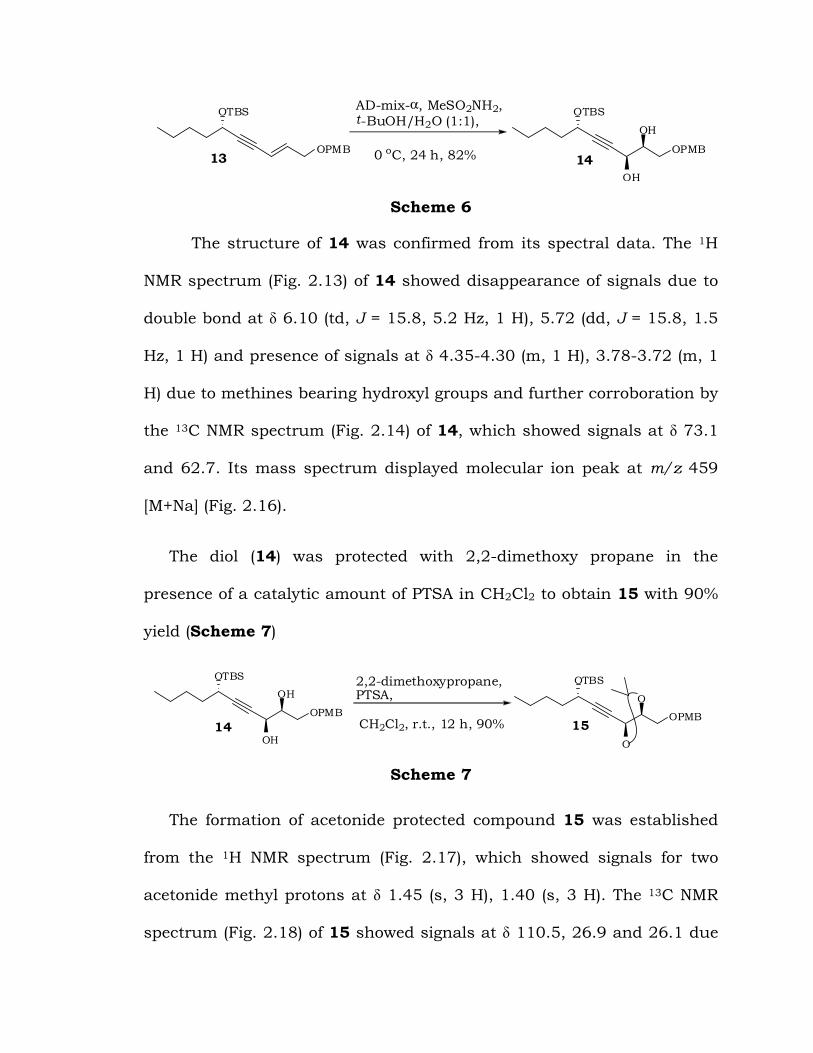
OTBS
OH
OH
OPMB
OTBS
OPMB13 14
AD-mix-α, MeSO2NH2,t-BuOH/H2O (1:1),
0 oC, 24 h, 82%
Scheme 6
The structure of 14 was confirmed from its spectral data. The 1H
NMR spectrum (Fig. 2.13) of 14 showed disappearance of signals due to
double bond at \ 6.10 (td, J = 15.8, 5.2 Hz, 1 H), 5.72 (dd, J = 15.8, 1.5
Hz, 1 H) and presence of signals at \ 4.35-4.30 (m, 1 H), 3.78-3.72 (m, 1
H) due to methines bearing hydroxyl groups and further corroboration by
the 13C NMR spectrum (Fig. 2.14) of 14, which showed signals at \ 73.1
and 62.7. Its mass spectrum displayed molecular ion peak at m/z 459
[M+Na] (Fig. 2.16).
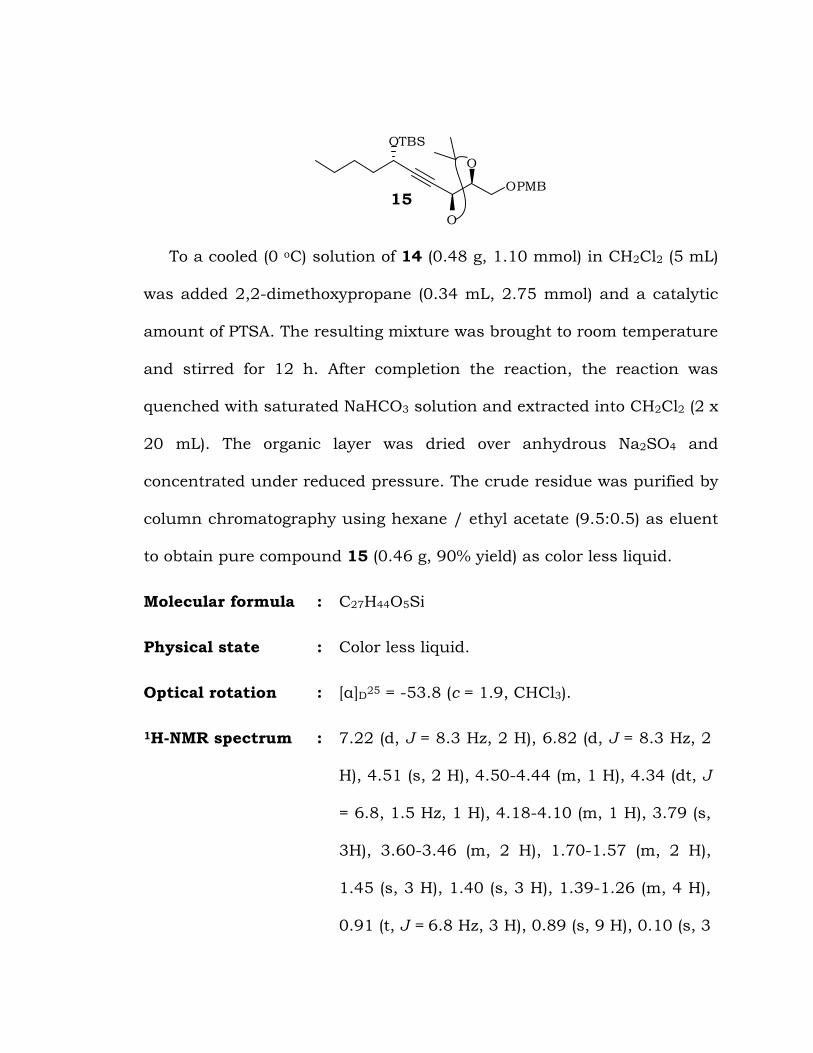
The diol (14) was protected with 2,2-dimethoxy propane in the
presence of a catalytic amount of PTSA in CH2Cl2 to obtain 15 with 90%
yield (Scheme 7)
OTBS
OH
OH
OPMB
14
2,2-dimethoxypropane,PTSA,
CH2Cl2, r.t., 12 h, 90%
OTBS
O
O
OPMB15
Scheme 7
The formation of acetonide protected compound 15 was established
from the 1H NMR spectrum (Fig. 2.17), which showed signals for two
acetonide methyl protons at \ 1.45 (s, 3 H), 1.40 (s, 3 H). The 13C NMR
spectrum (Fig. 2.18) of 15 showed signals at \ 110.5, 26.9 and 26.1 due
to acetonide group and molecular ion peak at m/z 499 [M++Na] in its
mass spectrum (Fig. 2.19), confirms the formation of acetonide protected
compound 15.
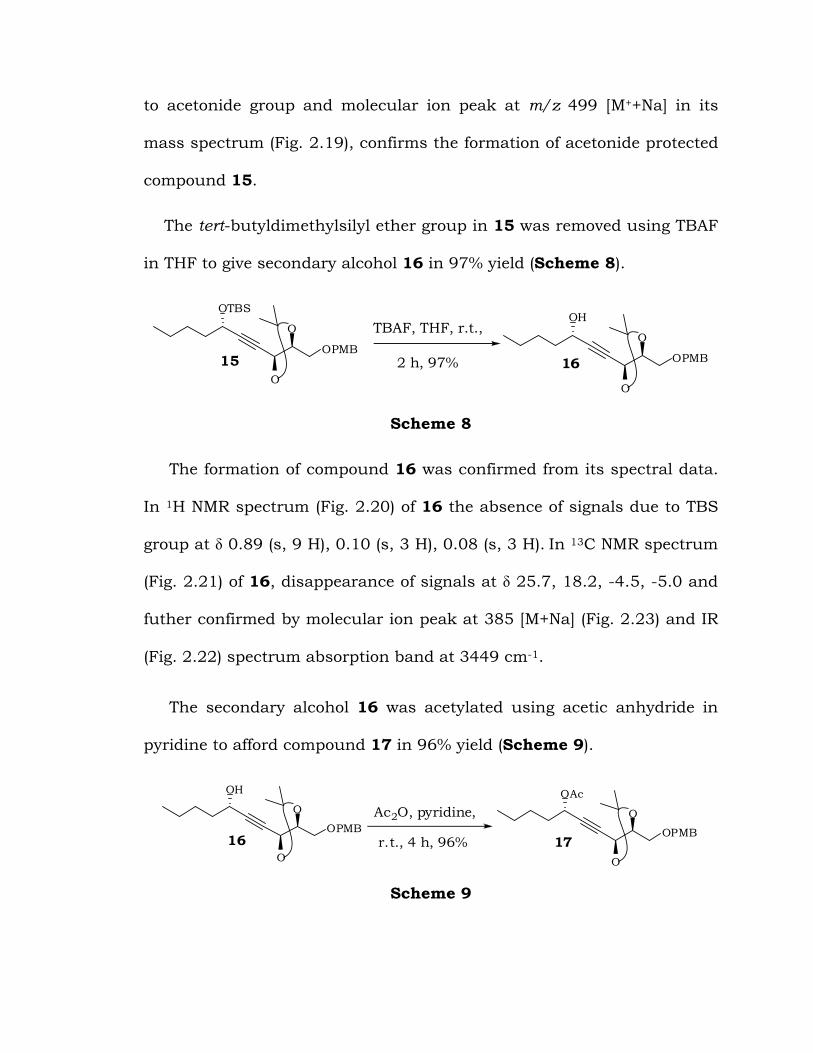
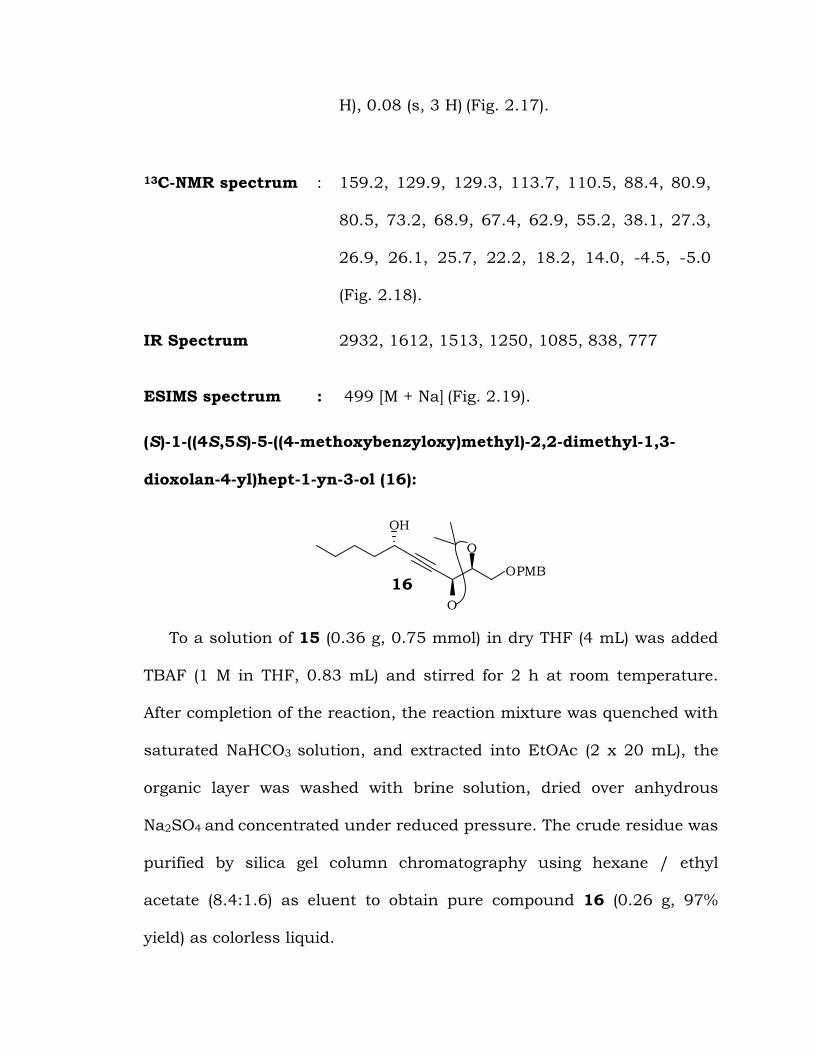
The tert-butyldimethylsilyl ether group in 15 was removed using TBAF
in THF to give secondary alcohol 16 in 97% yield (Scheme 8).
16
TBAF, THF, r.t.,
2 h, 97%
OTBS
O
O
OPMB15
OH
O
O
OPMB
Scheme 8
The formation of compound 16 was confirmed from its spectral data.
In 1H NMR spectrum (Fig. 2.20) of 16 the absence of signals due to TBS
group at \ 0.89 (s, 9 H), 0.10 (s, 3 H), 0.08 (s, 3 H). In 13C NMR spectrum
(Fig. 2.21) of 16, disappearance of signals at \ 25.7, 18.2, -4.5, -5.0 and
futher confirmed by molecular ion peak at 385 [M+Na] (Fig. 2.23) and IR
(Fig. 2.22) spectrum absorption band at 3449 cm-1.
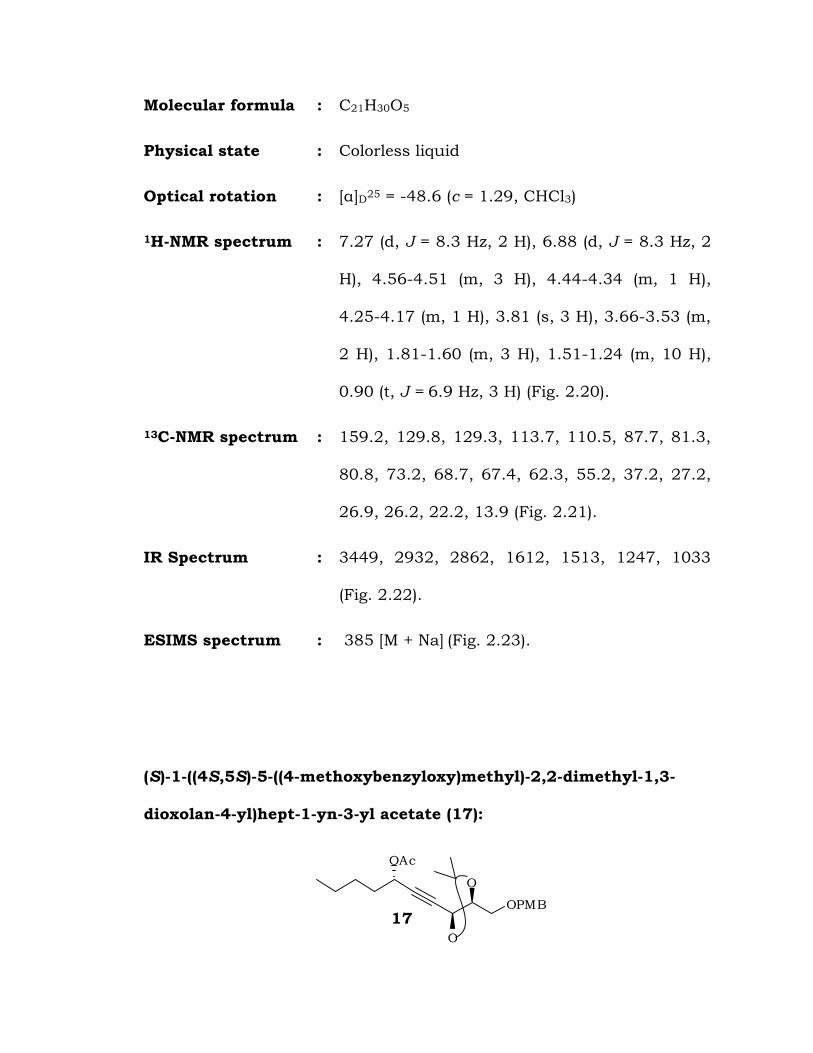
The secondary alcohol 16 was acetylated using acetic anhydride in
pyridine to afford compound 17 in 96% yield (Scheme 9).
Ac2O, pyridine,
r.t., 4 h, 96%
OH
O
O
OPMB16
OAc
O
O
OPMB17
Scheme 9
The formation of acetylated product 17 was confirmed from its
spectral data. The 1H NMR spectrum (Fig. 2.24) of 17 showed signal at \
2.06 (s, 3 H) due to acetyl group and 13C NMR spectrum (Fig. 2.25) of 17
showed signal at \ 169.7, 20.8 due to acetyl group and molecular ion
peak at m/z 422 [M+NH4] (Fig. 2.27) in its mass spectrum and a IR
absorption band at 1743 cm-1 (Fig. 2.26) indicated the presence of acetyl
group in 17.
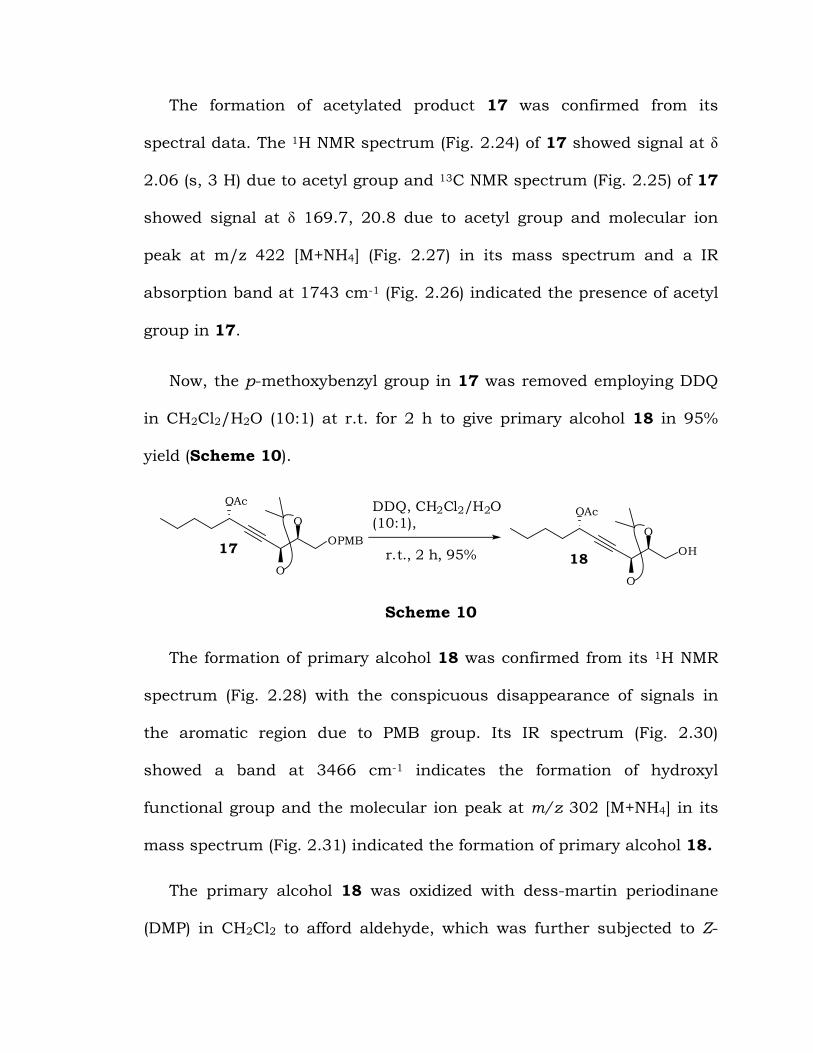
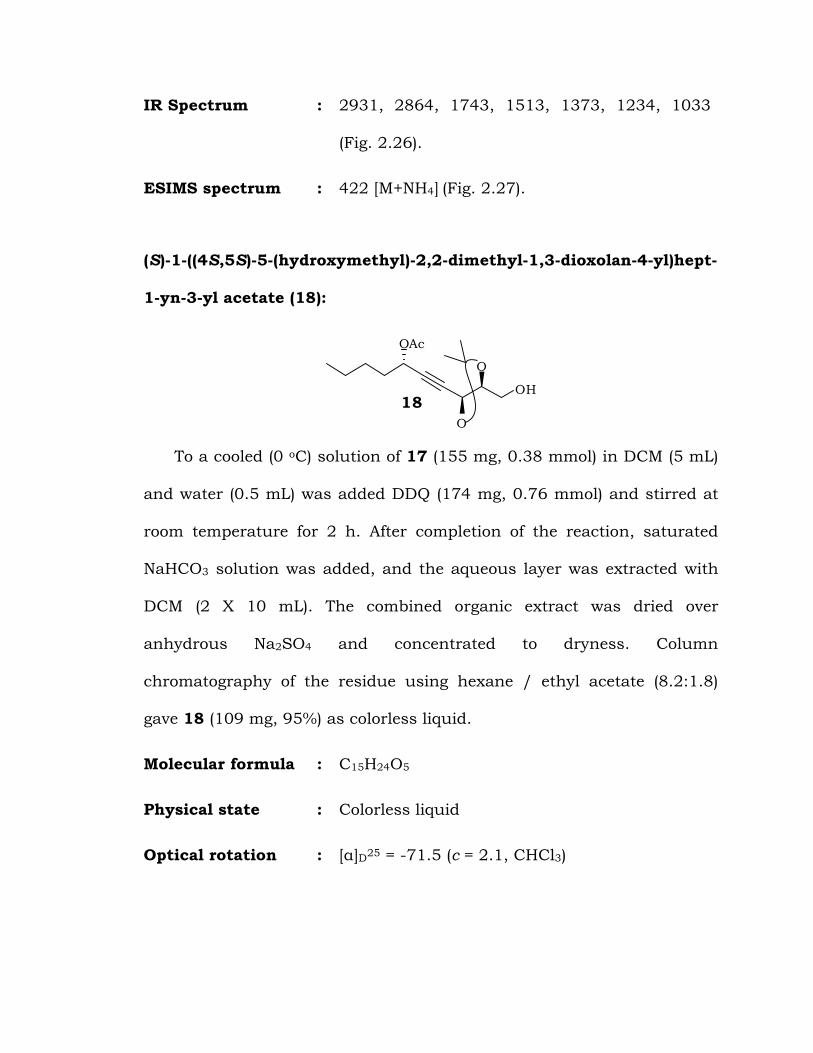
Now, the p-methoxybenzyl group in 17 was removed employing DDQ
in CH2Cl2/H2O (10:1) at r.t. for 2 h to give primary alcohol 18 in 95%
yield (Scheme 10).
DDQ, CH2Cl2/H2O(10:1),
r.t., 2 h, 95%
OAc
O
O
OH18
OAc
O
O
OPMB17
Scheme 10
The formation of primary alcohol 18 was confirmed from its 1H NMR
spectrum (Fig. 2.28) with the conspicuous disappearance of signals in
the aromatic region due to PMB group. Its IR spectrum (Fig. 2.30)
showed a band at 3466 cm-1 indicates the formation of hydroxyl
functional group and the molecular ion peak at m/z 302 [M+NH4] in its
mass spectrum (Fig. 2.31) indicated the formation of primary alcohol 18.
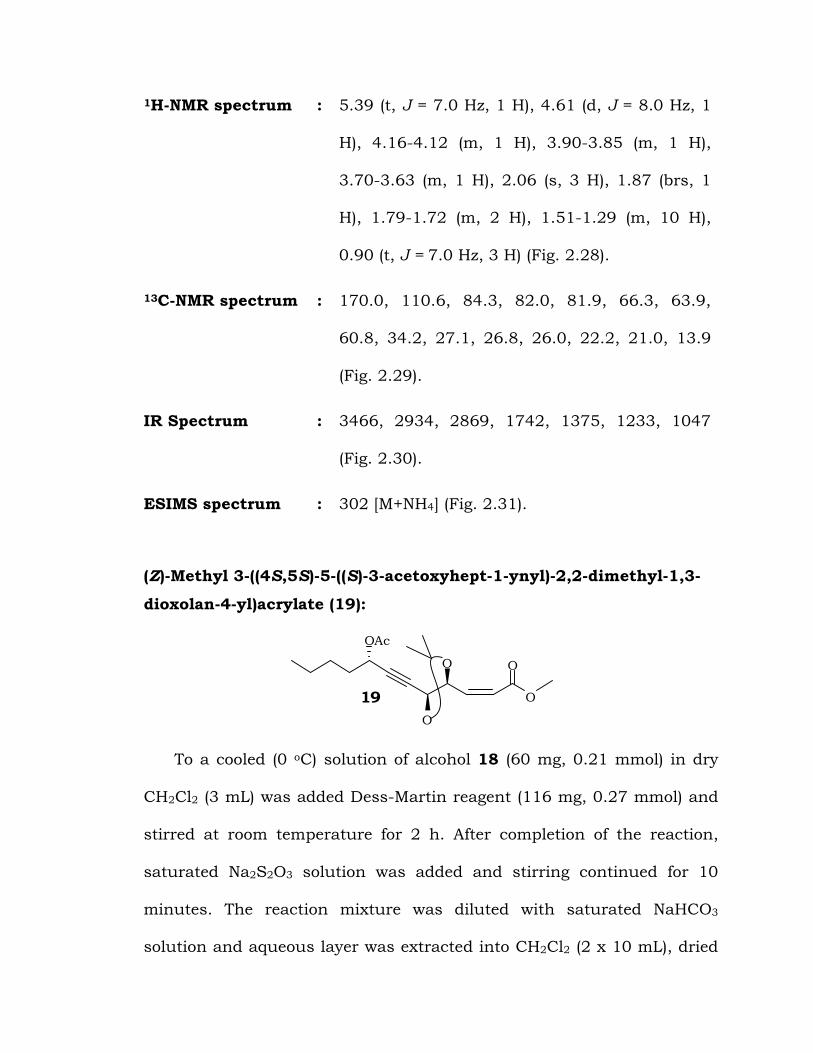
The primary alcohol 18 was oxidized with dess-martin periodinane
(DMP) in CH2Cl2 to afford aldehyde, which was further subjected to Z-
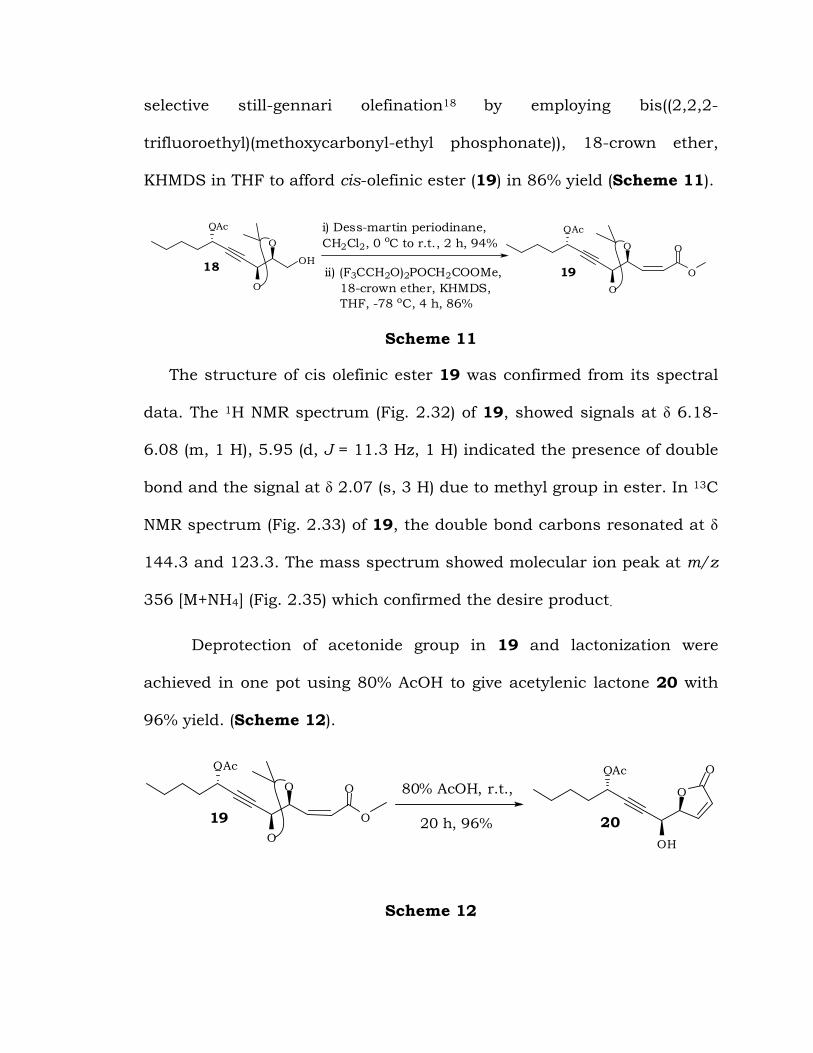
selective still-gennari olefination18 by employing bis((2,2,2-
trifluoroethyl)(methoxycarbonyl-ethyl phosphonate)), 18-crown ether,
KHMDS in THF to afford cis-olefinic ester (19) in 86% yield (Scheme 11).
i) Dess-martin periodinane,
CH2Cl2, 0 oC to r.t., 2 h, 94%
ii) (F3CCH2O)2POCH2COOMe,
18-crown ether, KHMDS,
THF, -78 oC, 4 h, 86%
OAc
O
O
OH18
OAc
O
O
O
O
19
Scheme 11
The structure of cis olefinic ester 19 was confirmed from its spectral
data. The 1H NMR spectrum (Fig. 2.32) of 19, showed signals at \ 6.18-
6.08 (m, 1 H), 5.95 (d, J = 11.3 Hz, 1 H) indicated the presence of double
bond and the signal at \ 2.07 (s, 3 H) due to methyl group in ester. In 13C
NMR spectrum (Fig. 2.33) of 19, the double bond carbons resonated at \
144.3 and 123.3. The mass spectrum showed molecular ion peak at m/z
356 [M+NH4] (Fig. 2.35) which confirmed the desire product.
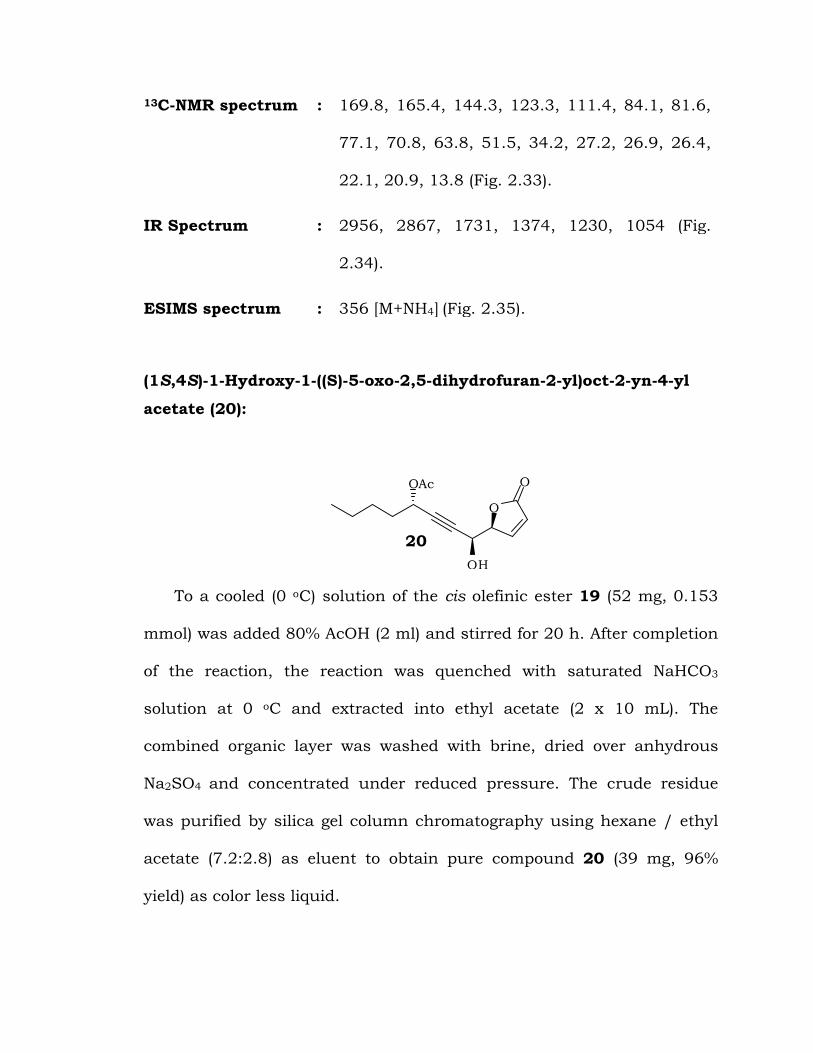
Deprotection of acetonide group in 19 and lactonization were
achieved in one pot using 80% AcOH to give acetylenic lactone 20 with
96% yield. (Scheme 12).
20
OAc
OH
O
O
80% AcOH, r.t.,
20 h, 96%
OAc
O
O
O
O
19
Scheme 12
The formation of lactone product 20 was confirmed from its 1H
NMR spectrum (Fig. 2.36) with the conspicuous disappearance of signals
due to the acetonide group protons, and appearance of a signal at \ 5.11
(td, J = 6.2, 1.5 Hz, 1 H) due to lactone center proton. Its IR spectrum
(Fig. 2.38) showed a band at 3438 cm-1 indicates the presence of
hydroxyl functional group and absorption band at 1750 cm-1 due to
lactone carbonyl group. The molecular ion peak at m/z 284 [M+NH4] in
its mass spectrum (Fig. 2.39), indicated the formation of lactone product
20.
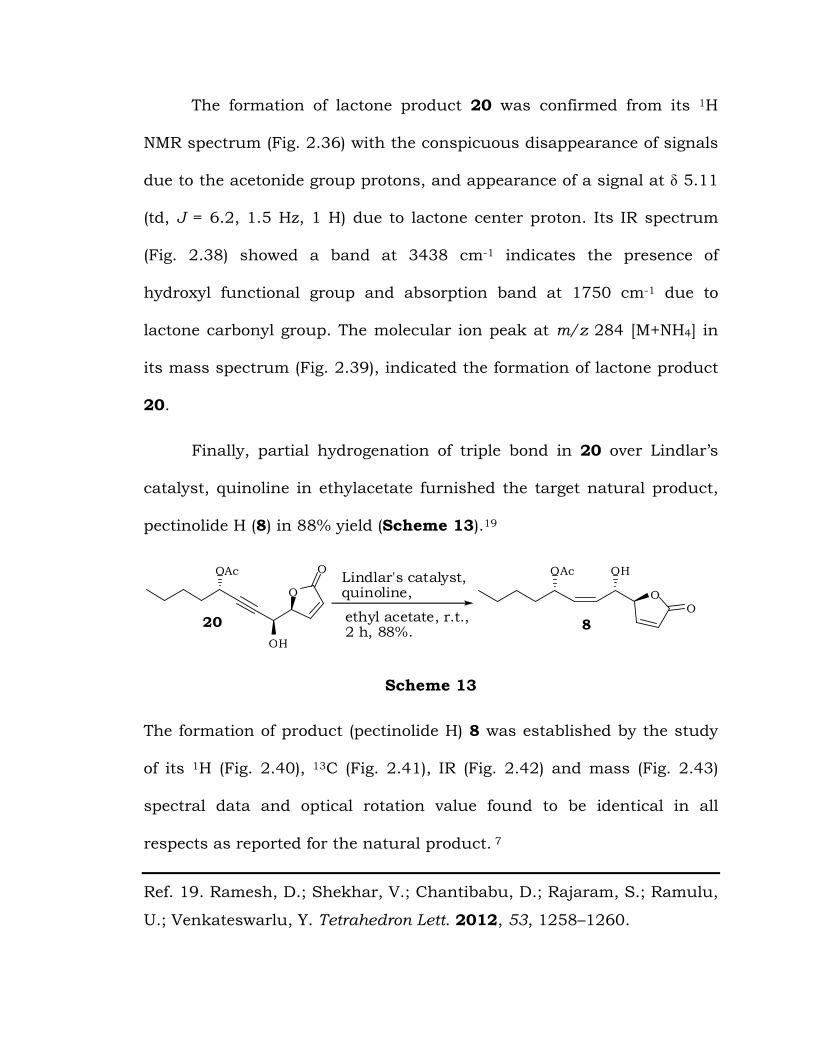
Finally, partial hydrogenation of triple bond in 20 over Lindlar’s
catalyst, quinoline in ethylacetate furnished the target natural product,
pectinolide H (8) in 88% yield (Scheme 13).19
20
OAc OH
OO
OAc
OH
O
O
8
Lindlar's catalyst,quinoline,
ethyl acetate, r.t.,2 h, 88%.
Scheme 13
The formation of product (pectinolide H) 8 was established by the study
of its 1H (Fig. 2.40), 13C (Fig. 2.41), IR (Fig. 2.42) and mass (Fig. 2.43)
spectral data and optical rotation value found to be identical in all
respects as reported for the natural product. 7
Ref. 19. Ramesh, D.; Shekhar, V.; Chantibabu, D.; Rajaram, S.; Ramulu,
U.; Venkateswarlu, Y. Tetrahedron Lett. 2012, 53, 1258–1260.
EXPERIMENTAL SECTION
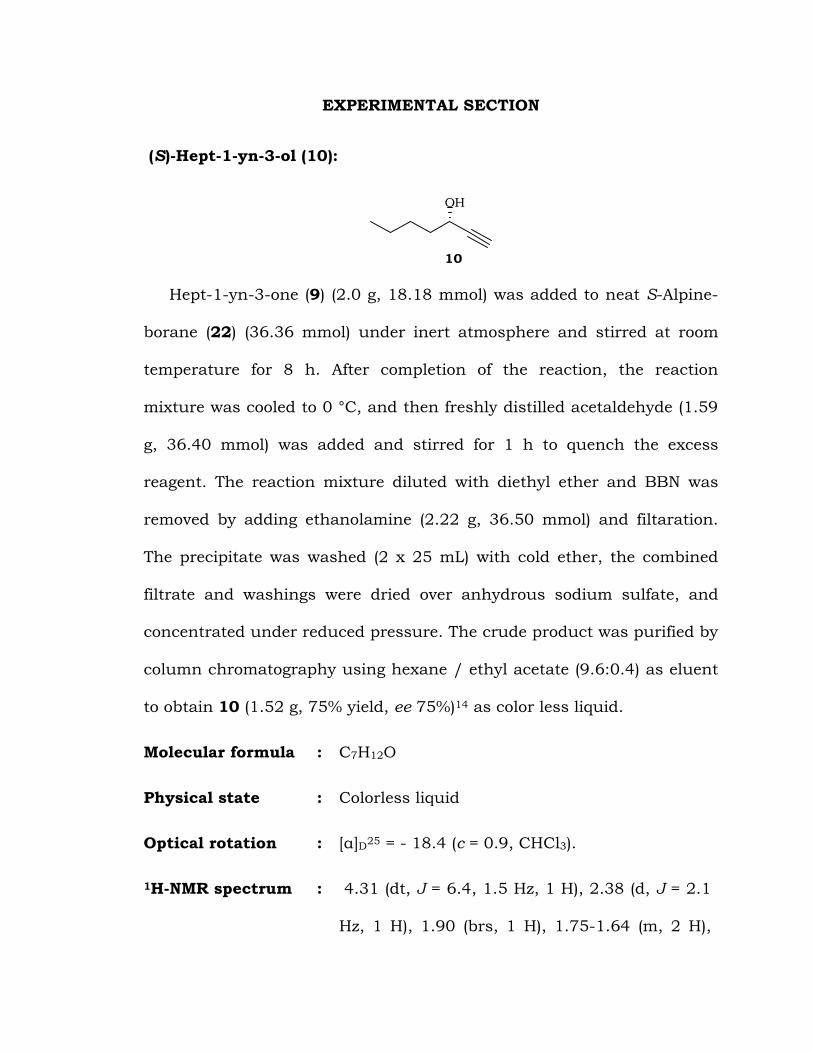
(S)-Hept-1-yn-3-ol (10):
OH
10
Hept-1-yn-3-one (9) (2.0 g, 18.18 mmol) was added to neat S-Alpine-
borane (22) (36.36 mmol) under inert atmosphere and stirred at room
temperature for 8 h. After completion of the reaction, the reaction
mixture was cooled to 0 °C, and then freshly distilled acetaldehyde (1.59
g, 36.40 mmol) was added and stirred for 1 h to quench the excess
reagent. The reaction mixture diluted with diethyl ether and BBN was
removed by adding ethanolamine (2.22 g, 36.50 mmol) and filtaration.
The precipitate was washed (2 x 25 mL) with cold ether, the combined
filtrate and washings were dried over anhydrous sodium sulfate, and
concentrated under reduced pressure. The crude product was purified by
column chromatography using hexane / ethyl acetate (9.6:0.4) as eluent
to obtain 10 (1.52 g, 75% yield, ee 75%)14 as color less liquid.
Molecular formula : C7H12O
Physical state : Colorless liquid
Optical rotation : [α]D25 = - 18.4 (c = 0.9, CHCl3).
1H-NMR spectrum : 4.31 (dt, J = 6.4, 1.5 Hz, 1 H), 2.38 (d, J = 2.1
Hz, 1 H), 1.90 (brs, 1 H), 1.75-1.64 (m, 2 H),
1.50-1.28 (m, 4 H), 0.93 (t, J = 6.9 Hz, 3 H)
(Fig. 2.1).
13C-NMR spectrum :
85.1, 72.6, 62.1, 37.2, 27.1, 22.2, 13.9 (Fig.
2.2).
IR Spectrum : 3308, 2958, 2867, 1021, 655 (Fig. 2.3).
ESI-Mass spectrum : 135 [M + Na]
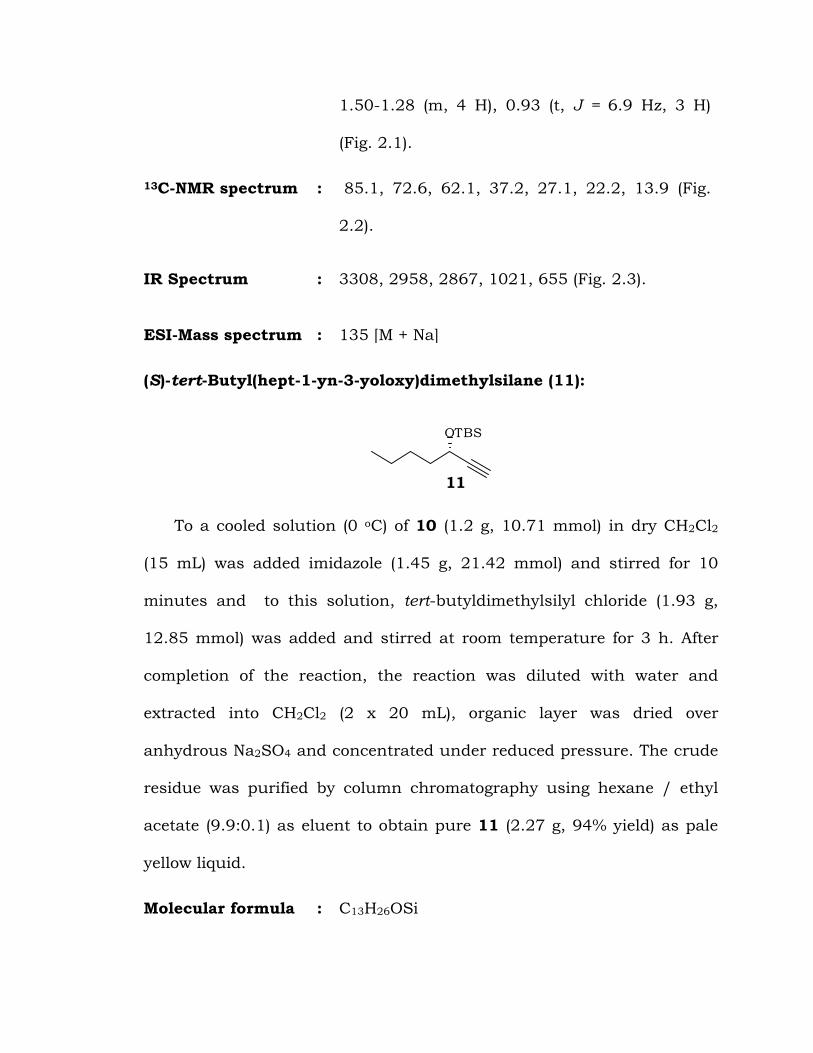
(S)-tert-Butyl(hept-1-yn-3-yoloxy)dimethylsilane (11):
OTBS
11
To a cooled solution (0 oC) of 10 (1.2 g, 10.71 mmol) in dry CH2Cl2
(15 mL) was added imidazole (1.45 g, 21.42 mmol) and stirred for 10
minutes and to this solution, tert-butyldimethylsilyl chloride (1.93 g,
12.85 mmol) was added and stirred at room temperature for 3 h. After
completion of the reaction, the reaction was diluted with water and
extracted into CH2Cl2 (2 x 20 mL), organic layer was dried over
anhydrous Na2SO4 and concentrated under reduced pressure. The crude
residue was purified by column chromatography using hexane / ethyl
acetate (9.9:0.1) as eluent to obtain pure 11 (2.27 g, 94% yield) as pale
yellow liquid.
Molecular formula : C13H26OSi
Physical state : Pale yellow liquid
Optical rotation : [α]D25 = -13.6 (c = 2.6, CHCl3).
1H-NMR spectrum : 4.31 (dt, J = 6.4, 2.0 Hz, 1 H), 2.30 (d, J = 2.1
Hz, 1 H), 1.71-1.62 (m, 2 H), 1.49-1.26 (m, 4
H), 0.93 (t, J = 6.9 Hz, 3 H), 0.91 (s, 9 H), 0.13
(s, 3 H), 0.10 (s, 3 H) (Fig. 2.4).
13C-NMR spectrum :
85.8, 71.8, 62.7, 38.3, 27.3, 25.8, 22.3, 18.2,
14.0, -4.5, -5.0 (Fig. 2.5).
IR Spectrum : 3312, 2958, 2860, 1255, 1088, 666 (Fig. 2.6).
ESI-Mass spectrum : 249 [M + Na]
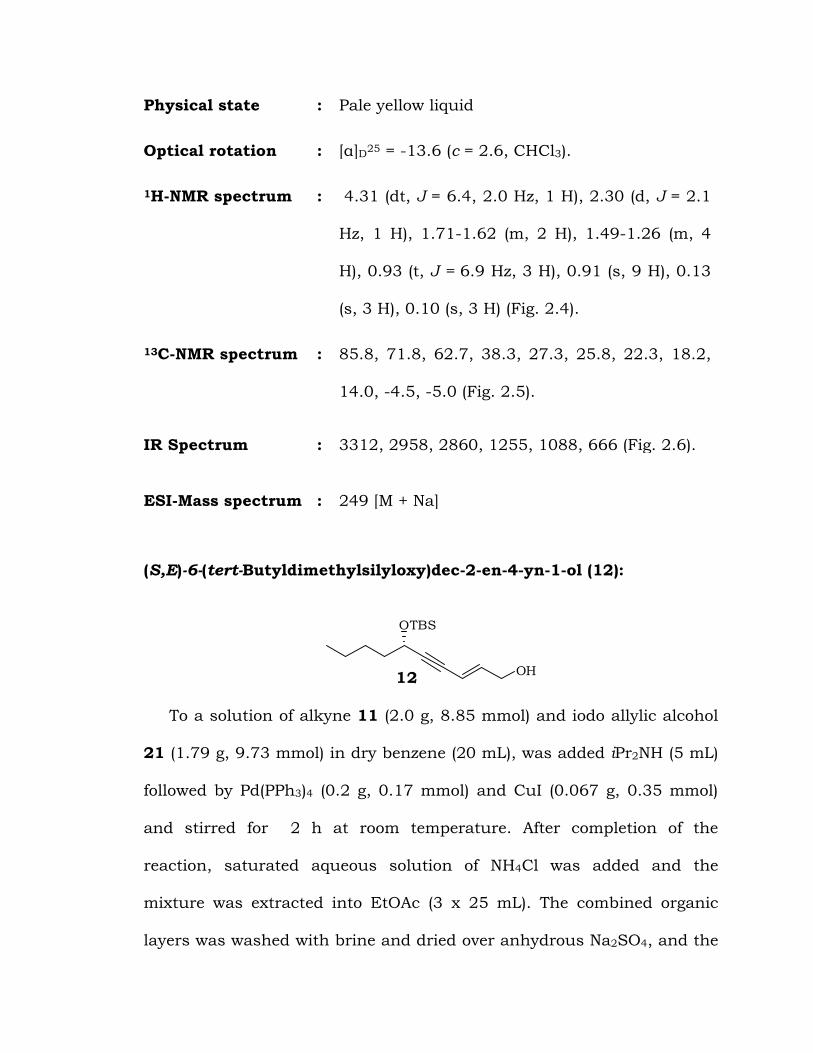
(S,E)-6-(tert-Butyldimethylsilyloxy)dec-2-en-4-yn-1-ol (12):
12
OTBS
OH
To a solution of alkyne 11 (2.0 g, 8.85 mmol) and iodo allylic alcohol
21 (1.79 g, 9.73 mmol) in dry benzene (20 mL), was added iPr2NH (5 mL)
followed by Pd(PPh3)4 (0.2 g, 0.17 mmol) and CuI (0.067 g, 0.35 mmol)
and stirred for 2 h at room temperature. After completion of the
reaction, saturated aqueous solution of NH4Cl was added and the
mixture was extracted into EtOAc (3 x 25 mL). The combined organic
layers was washed with brine and dried over anhydrous Na2SO4, and the
solvent was evaporated. The residue was purified by column
chromatography using hexane / ethyl acetate (9.2:0.8) as eluent to
obtain pure 12 (2.19 g, 88% yield) as colorless liquid.
Molecular formula : C16H30O2Si
Physical state : Colorless liquid
Optical rotation : [α]D25 = -20.8 (c = 3.72, CHCl3).
1H-NMR spectrum : 6.21 (td, J = 15.8, 5.2 Hz, 1 H), 5.80-5.72 (m,
1 H), 4.44 (dt, J = 6.4, 1.1 Hz, 1 H), 4.23-4.16
(m, 2 H), 1.72-1.62 (m, 2 H), 1.53 (brs, 1 H),
1.46-1.26 (m, 4 H), 0.91 (t, J = 6.9 Hz, 3 H),
0.90 (s, 9 H), 0.13 (s, 3 H), 0.10 (s, 3 H) (Fig.
2.7).
13C-NMR spectrum :
141.3, 110.2, 91.9, 81.9, 63.4, 62.7, 38.3,
27.4, 25.8, 22.3, 18.2, 14.0, -4.5, -5.0 (Fig.
2.8).
IR Spectrum : 3387, 2956, 2859, 2210, 1466, 1254, 1085,
837, 777 (Fig. 2.9).
ESI-Mass spectrum : 305 [M + Na]
(S,E)-tert-Butyl(10-(4-methoxybenzyloxy)dec-8-en-6-yn-5-yloxy)
dimethylsilane (13):
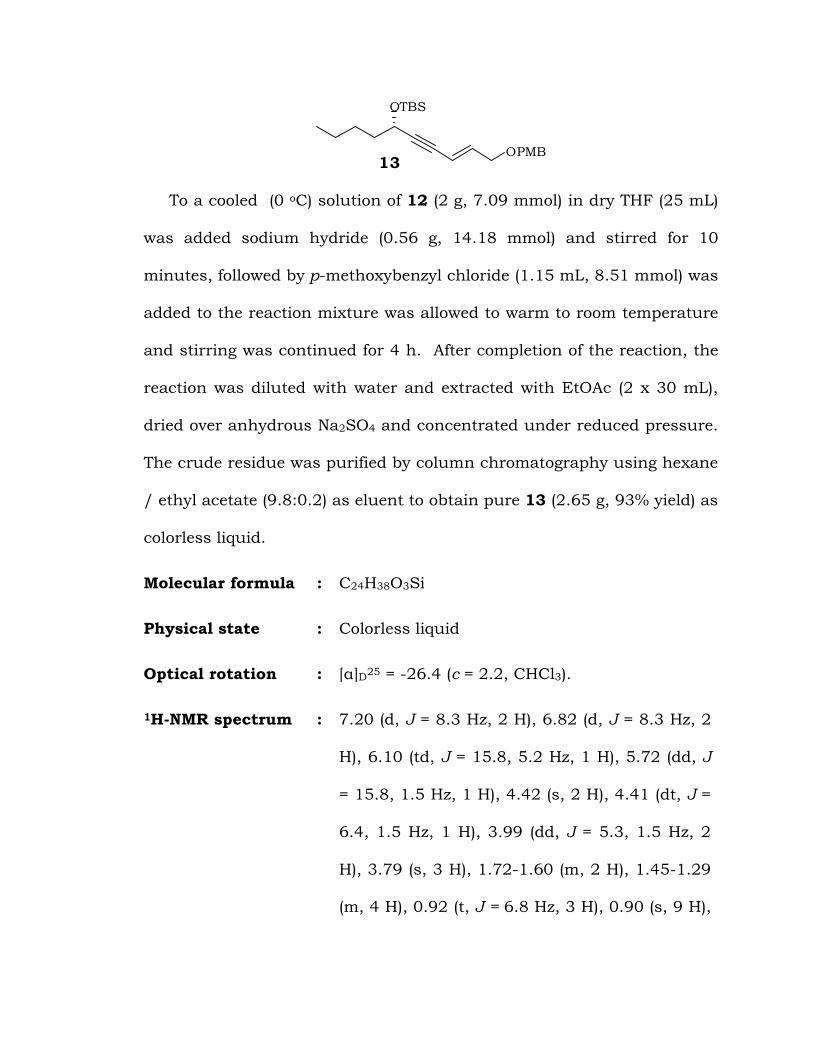
OTBS
OPMB13
To a cooled (0 oC) solution of 12 (2 g, 7.09 mmol) in dry THF (25 mL)
was added sodium hydride (0.56 g, 14.18 mmol) and stirred for 10
minutes, followed by p-methoxybenzyl chloride (1.15 mL, 8.51 mmol) was
added to the reaction mixture was allowed to warm to room temperature
and stirring was continued for 4 h. After completion of the reaction, the
reaction was diluted with water and extracted with EtOAc (2 x 30 mL),
dried over anhydrous Na2SO4 and concentrated under reduced pressure.
The crude residue was purified by column chromatography using hexane
/ ethyl acetate (9.8:0.2) as eluent to obtain pure 13 (2.65 g, 93% yield) as
colorless liquid.
Molecular formula : C24H38O3Si
Physical state : Colorless liquid
Optical rotation : [α]D25 = -26.4 (c = 2.2, CHCl3).
1H-NMR spectrum : 7.20 (d, J = 8.3 Hz, 2 H), 6.82 (d, J = 8.3 Hz, 2
H), 6.10 (td, J = 15.8, 5.2 Hz, 1 H), 5.72 (dd, J
= 15.8, 1.5 Hz, 1 H), 4.42 (s, 2 H), 4.41 (dt, J =
6.4, 1.5 Hz, 1 H), 3.99 (dd, J = 5.3, 1.5 Hz, 2
H), 3.79 (s, 3 H), 1.72-1.60 (m, 2 H), 1.45-1.29
(m, 4 H), 0.92 (t, J = 6.8 Hz, 3 H), 0.90 (s, 9 H),
0.12 (s, 3 H), 0.10 (s, 3 H) (Fig. 2.10).
13C-NMR spectrum :
159.2, 139.0, 130.0, 129.3, 113.8, 111.5,
91.9, 81.9, 71.9, 69.5, 63.4, 55.2, 38.3, 27.4,
25.8, 22.3, 18.2, 14.0, -4.5, -5.0 (Fig. 2.11).
IR Spectrum : 2953, 2859, 1513, 1250, 1081, 838, 775
ESIMS spectrum : 425 [M + Na] (Fig. 2.12).
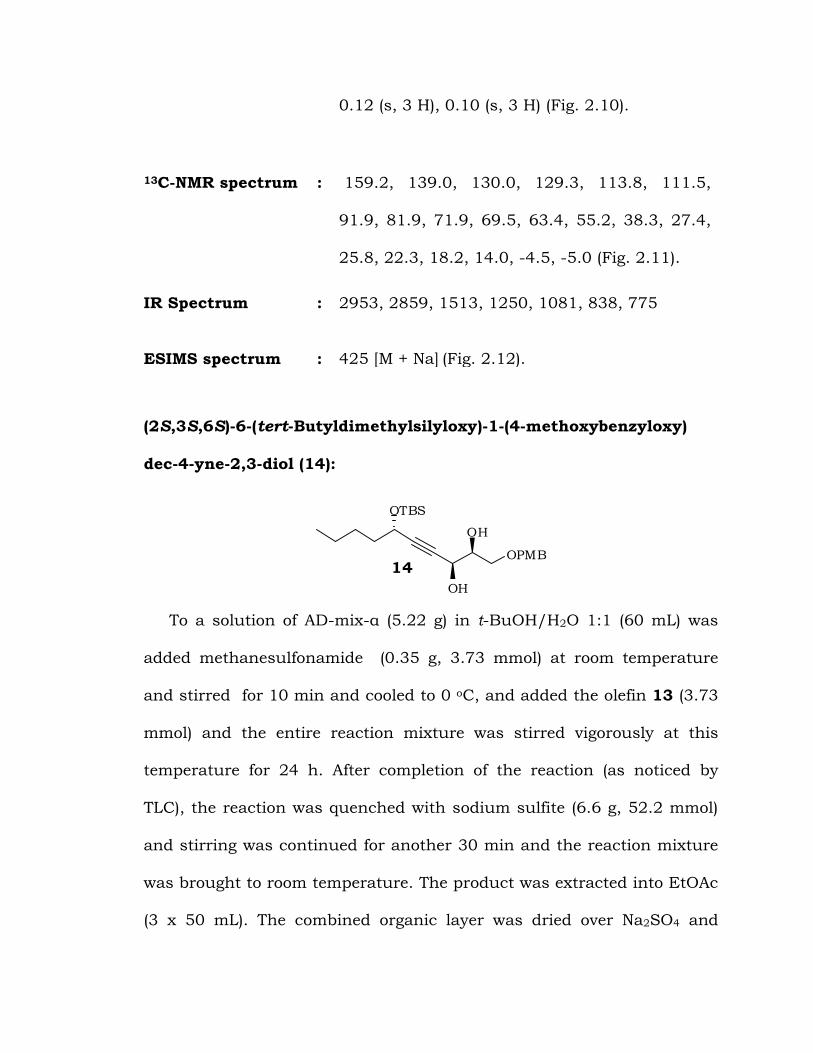
(2S,3S,6S)-6-(tert-Butyldimethylsilyloxy)-1-(4-methoxybenzyloxy)
dec-4-yne-2,3-diol (14):
OTBS
OH
OH
OPMB14
To a solution of AD-mix-α (5.22 g) in t-BuOH/H2O 1:1 (60 mL) was
added methanesulfonamide (0.35 g, 3.73 mmol) at room temperature
and stirred for 10 min and cooled to 0 oC, and added the olefin 13 (3.73
mmol) and the entire reaction mixture was stirred vigorously at this
temperature for 24 h. After completion of the reaction (as noticed by
TLC), the reaction was quenched with sodium sulfite (6.6 g, 52.2 mmol)
and stirring was continued for another 30 min and the reaction mixture
was brought to room temperature. The product was extracted into EtOAc
(3 x 50 mL). The combined organic layer was dried over Na2SO4 and
concentrated. The residue was purified by silica gel column
chromatography using hexane / ethyl acetate (8:2) as eluent to obtain
diol 14 (1.48 g, 82% yield, 96% de, Chiral HPLC) as colorless viscous
liquid
Molecular formula : C24H40O5Si
Physical state : Colorless viscous liquid
Optical rotation : [α]D25 = -40.38 (c = 2.1, CHCl3).
1H-NMR spectrum : 7.21 (d, J = 8.3 Hz, 2 H), 6.84 (d, J = 8.3 Hz, 2
H), 4.47 (s, 2 H), 4.39-4.30 (m, 2 H), 3.79 (s, 3
H), 3.78-3.72 (m, 1 H) 3.67-3.50 (m, 2 H), 2.62
(brs, 2 H), 1.69-1.56 (m, 2 H), 1.44-1.26 (m, 4
H), 0.91 (t, J = 6.8 Hz, 3 H), 0.89 (s, 9 H), 0.10
(s, 3 H), 0.08 (s, 3 H), (Fig. 2.13).
13C-NMR spectrum :
159.2, 129.6, 129.3, 113.7, 88.0, 81.4, 73.3,
73.1, 70.2, 63.5, 62.7, 55.1, 38.1, 27.2, 25.6,
22.2, 18.1, 13.9, -4.6, -5.1 (Fig. 2.14).
IR Spectrum : 3413, 2932, 2860, 1613, 1249, 1083, 838, 777
(Fig. 2.15).
ESIMS spectrum : 459 [M + Na] (Fig. 2.16).
tert-Butyl((S)-1-((4S,5S)-5-((4-methoxybenzyloxy)methyl)-2,2-
dimethyl-1,3-dioxolan-4-yl)hept-1-yn-3-yoloxy)dimethylsilane (15):
OTBS
O
O
OPMB15
To a cooled (0 oC) solution of 14 (0.48 g, 1.10 mmol) in CH2Cl2 (5 mL)
was added 2,2-dimethoxypropane (0.34 mL, 2.75 mmol) and a catalytic
amount of PTSA. The resulting mixture was brought to room temperature
and stirred for 12 h. After completion the reaction, the reaction was
quenched with saturated NaHCO3 solution and extracted into CH2Cl2 (2 x
20 mL). The organic layer was dried over anhydrous Na2SO4 and
concentrated under reduced pressure. The crude residue was purified by
column chromatography using hexane / ethyl acetate (9.5:0.5) as eluent
to obtain pure compound 15 (0.46 g, 90% yield) as color less liquid.
Molecular formula : C27H44O5Si
Physical state : Color less liquid.
Optical rotation : [α]D25 = -53.8 (c = 1.9, CHCl3).
1H-NMR spectrum : 7.22 (d, J = 8.3 Hz, 2 H), 6.82 (d, J = 8.3 Hz, 2
H), 4.51 (s, 2 H), 4.50-4.44 (m, 1 H), 4.34 (dt, J
= 6.8, 1.5 Hz, 1 H), 4.18-4.10 (m, 1 H), 3.79 (s,
3H), 3.60-3.46 (m, 2 H), 1.70-1.57 (m, 2 H),
1.45 (s, 3 H), 1.40 (s, 3 H), 1.39-1.26 (m, 4 H),
0.91 (t, J = 6.8 Hz, 3 H), 0.89 (s, 9 H), 0.10 (s, 3
H), 0.08 (s, 3 H) (Fig. 2.17).
13C-NMR spectrum :
159.2, 129.9, 129.3, 113.7, 110.5, 88.4, 80.9,
80.5, 73.2, 68.9, 67.4, 62.9, 55.2, 38.1, 27.3,
26.9, 26.1, 25.7, 22.2, 18.2, 14.0, -4.5, -5.0
(Fig. 2.18).
IR Spectrum 2932, 1612, 1513, 1250, 1085, 838, 777
ESIMS spectrum : 499 [M + Na] (Fig. 2.19).
(S)-1-((4S,5S)-5-((4-methoxybenzyloxy)methyl)-2,2-dimethyl-1,3-
dioxolan-4-yl)hept-1-yn-3-ol (16):
OH
O
O
OPMB16
To a solution of 15 (0.36 g, 0.75 mmol) in dry THF (4 mL) was added
TBAF (1 M in THF, 0.83 mL) and stirred for 2 h at room temperature.
After completion of the reaction, the reaction mixture was quenched with
saturated NaHCO3 solution, and extracted into EtOAc (2 x 20 mL), the
organic layer was washed with brine solution, dried over anhydrous
Na2SO4 and concentrated under reduced pressure. The crude residue was
purified by silica gel column chromatography using hexane / ethyl
acetate (8.4:1.6) as eluent to obtain pure compound 16 (0.26 g, 97%
yield) as colorless liquid.
Molecular formula : C21H30O5
Physical state : Colorless liquid
Optical rotation : [α]D25 = -48.6 (c = 1.29, CHCl3)
1H-NMR spectrum : 7.27 (d, J = 8.3 Hz, 2 H), 6.88 (d, J = 8.3 Hz, 2
H), 4.56-4.51 (m, 3 H), 4.44-4.34 (m, 1 H),
4.25-4.17 (m, 1 H), 3.81 (s, 3 H), 3.66-3.53 (m,
2 H), 1.81-1.60 (m, 3 H), 1.51-1.24 (m, 10 H),
0.90 (t, J = 6.9 Hz, 3 H) (Fig. 2.20).
13C-NMR spectrum :
159.2, 129.8, 129.3, 113.7, 110.5, 87.7, 81.3,
80.8, 73.2, 68.7, 67.4, 62.3, 55.2, 37.2, 27.2,
26.9, 26.2, 22.2, 13.9 (Fig. 2.21).
IR Spectrum : 3449, 2932, 2862, 1612, 1513, 1247, 1033
(Fig. 2.22).
ESIMS spectrum : 385 [M + Na] (Fig. 2.23).
(S)-1-((4S,5S)-5-((4-methoxybenzyloxy)methyl)-2,2-dimethyl-1,3-
dioxolan-4-yl)hept-1-yn-3-yl acetate (17):
OAc
O
O
OPMB17
To a cooled (0 oC) solution of secondary alcohol 16 (0.2 g,
0.552mmol) in pyridine (1 mL) was added Ac2O (0.5 mL) and stirred at
room temperature for 4 h. After completion of the reaction, the reaction
was diluted with aqueous CuSO4 (5 mL) and extracted into ethyl acetate
(2 x 15 mL), the combined organic phase was washed with brine, dried
over Na2SO4. After evaporation of the solvent, the crude residue was
purified by column chromatography using hexane / ethyl acetate
(8.8:1.2) as eluent to afford the desired product 17 (0.22 g, 96% yield) as
colorless liquid.
Molecular formula : C23H32O6
Physical state : Colorless liquid
Optical rotation : [α]D25 = -69.4 (c = 2.7, CHCl3)
1H-NMR spectrum : 7.27 (d, J = 8.6 Hz, 2 H), 6.88 (d, J = 8.6 Hz, 2
H), 5.39 (dt, J = 6.8, 1.5 Hz, 1 H), 4.56-4.51 (m,
3 H), 4.26-4.19 (m, 1 H), 3.81 (s, 3 H), 3.64-
3.52 (m, 2 H), 2.06 (s, 3 H), 1.79-1.70 (m, 2 H),
1.50-1.24 (m, 10 H), 0.90 (t, J = 6.9 Hz, 3 H)
(Fig. 2.24).
13C-NMR spectrum :
169.7, 159.1, 129.7, 129.2, 113.6, 110.6, 83.9,
82.1, 80.7, 73.1, 68.7, 67.2, 63.7, 55.1, 34.1,
26.9, 26.8, 26.0, 22.0, 20.8, 13.8 (Fig. 2.25).
IR Spectrum : 2931, 2864, 1743, 1513, 1373, 1234, 1033
(Fig. 2.26).
ESIMS spectrum : 422 [M+NH4] (Fig. 2.27).
(S)-1-((4S,5S)-5-(hydroxymethyl)-2,2-dimethyl-1,3-dioxolan-4-yl)hept-
1-yn-3-yl acetate (18):
OAc
O
O
OH18
To a cooled (0 oC) solution of 17 (155 mg, 0.38 mmol) in DCM (5 mL)
and water (0.5 mL) was added DDQ (174 mg, 0.76 mmol) and stirred at
room temperature for 2 h. After completion of the reaction, saturated
NaHCO3 solution was added, and the aqueous layer was extracted with
DCM (2 X 10 mL). The combined organic extract was dried over
anhydrous Na2SO4 and concentrated to dryness. Column
chromatography of the residue using hexane / ethyl acetate (8.2:1.8)
gave 18 (109 mg, 95%) as colorless liquid.
Molecular formula : C15H24O5
Physical state : Colorless liquid
Optical rotation : [α]D25 = -71.5 (c = 2.1, CHCl3)
1H-NMR spectrum : 5.39 (t, J = 7.0 Hz, 1 H), 4.61 (d, J = 8.0 Hz, 1
H), 4.16-4.12 (m, 1 H), 3.90-3.85 (m, 1 H),
3.70-3.63 (m, 1 H), 2.06 (s, 3 H), 1.87 (brs, 1
H), 1.79-1.72 (m, 2 H), 1.51-1.29 (m, 10 H),
0.90 (t, J = 7.0 Hz, 3 H) (Fig. 2.28).
13C-NMR spectrum :
170.0, 110.6, 84.3, 82.0, 81.9, 66.3, 63.9,
60.8, 34.2, 27.1, 26.8, 26.0, 22.2, 21.0, 13.9
(Fig. 2.29).
IR Spectrum : 3466, 2934, 2869, 1742, 1375, 1233, 1047
(Fig. 2.30).
ESIMS spectrum : 302 [M+NH4] (Fig. 2.31).
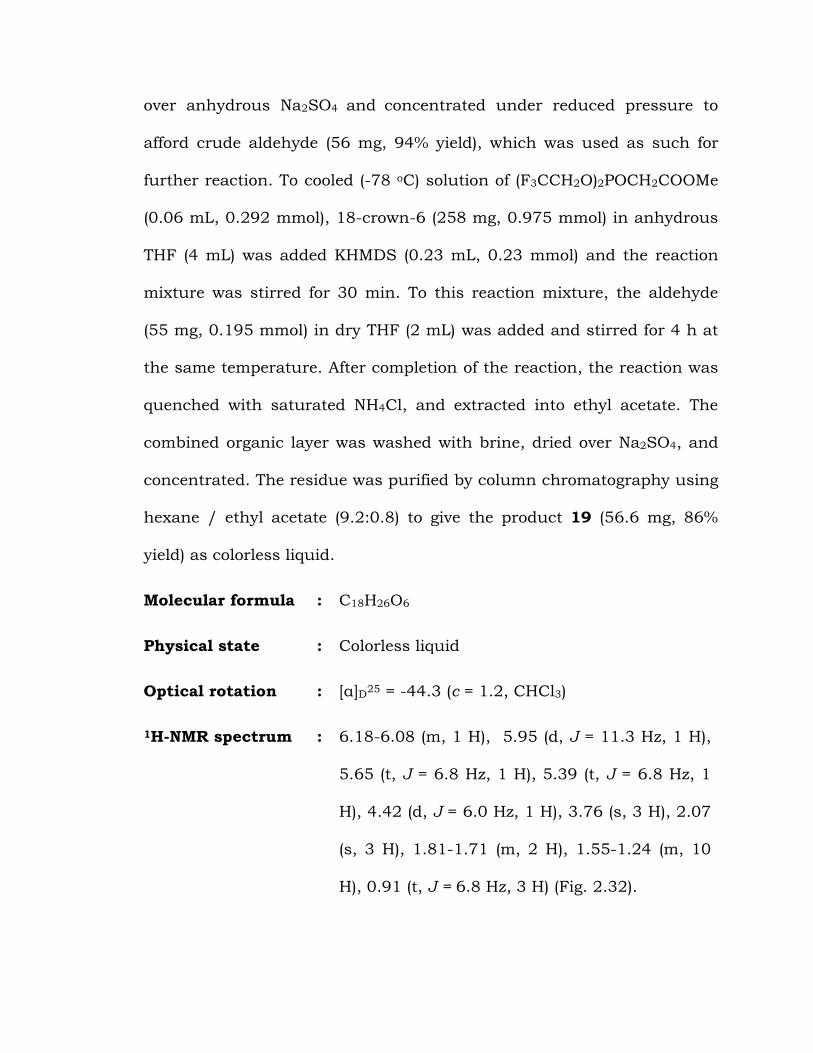
(Z)-Methyl 3-((4S,5S)-5-((S)-3-acetoxyhept-1-ynyl)-2,2-dimethyl-1,3-
dioxolan-4-yl)acrylate (19):
OAc
O
O
O
O
19
To a cooled (0 oC) solution of alcohol 18 (60 mg, 0.21 mmol) in dry
CH2Cl2 (3 mL) was added Dess-Martin reagent (116 mg, 0.27 mmol) and
stirred at room temperature for 2 h. After completion of the reaction,
saturated Na2S2O3 solution was added and stirring continued for 10
minutes. The reaction mixture was diluted with saturated NaHCO3
solution and aqueous layer was extracted into CH2Cl2 (2 x 10 mL), dried
over anhydrous Na2SO4 and concentrated under reduced pressure to
afford crude aldehyde (56 mg, 94% yield), which was used as such for
further reaction. To cooled (-78 oC) solution of (F3CCH2O)2POCH2COOMe
(0.06 mL, 0.292 mmol), 18-crown-6 (258 mg, 0.975 mmol) in anhydrous
THF (4 mL) was added KHMDS (0.23 mL, 0.23 mmol) and the reaction
mixture was stirred for 30 min. To this reaction mixture, the aldehyde
(55 mg, 0.195 mmol) in dry THF (2 mL) was added and stirred for 4 h at
the same temperature. After completion of the reaction, the reaction was
quenched with saturated NH4Cl, and extracted into ethyl acetate. The
combined organic layer was washed with brine, dried over Na2SO4, and
concentrated. The residue was purified by column chromatography using
hexane / ethyl acetate (9.2:0.8) to give the product 19 (56.6 mg, 86%
yield) as colorless liquid.
Molecular formula : C18H26O6
Physical state : Colorless liquid
Optical rotation : [α]D25 = -44.3 (c = 1.2, CHCl3)
1H-NMR spectrum : 6.18-6.08 (m, 1 H), 5.95 (d, J = 11.3 Hz, 1 H),
5.65 (t, J = 6.8 Hz, 1 H), 5.39 (t, J = 6.8 Hz, 1
H), 4.42 (d, J = 6.0 Hz, 1 H), 3.76 (s, 3 H), 2.07
(s, 3 H), 1.81-1.71 (m, 2 H), 1.55-1.24 (m, 10
H), 0.91 (t, J = 6.8 Hz, 3 H) (Fig. 2.32).
13C-NMR spectrum :
169.8, 165.4, 144.3, 123.3, 111.4, 84.1, 81.6,
77.1, 70.8, 63.8, 51.5, 34.2, 27.2, 26.9, 26.4,
22.1, 20.9, 13.8 (Fig. 2.33).
IR Spectrum : 2956, 2867, 1731, 1374, 1230, 1054 (Fig.
2.34).
ESIMS spectrum : 356 [M+NH4] (Fig. 2.35).
(1S,4S)-1-Hydroxy-1-((S)-5-oxo-2,5-dihydrofuran-2-yl)oct-2-yn-4-yl
acetate (20):
20
OAc
OH
O
O
To a cooled (0 oC) solution of the cis olefinic ester 19 (52 mg, 0.153
mmol) was added 80% AcOH (2 ml) and stirred for 20 h. After completion
of the reaction, the reaction was quenched with saturated NaHCO3
solution at 0 oC and extracted into ethyl acetate (2 x 10 mL). The
combined organic layer was washed with brine, dried over anhydrous
Na2SO4 and concentrated under reduced pressure. The crude residue
was purified by silica gel column chromatography using hexane / ethyl
acetate (7.2:2.8) as eluent to obtain pure compound 20 (39 mg, 96%
yield) as color less liquid.
Molecular formula : C14H18O5
Physical state : Colorless liquid
Optical rotation : [α]D25 = -105.3 (c = 1.1, CHCl3)
1H-NMR spectrum : 7.53 (dd, J = 5.6, 1.5 Hz, 1 H), 6.25 (dd, J =
5.6, 1.5 Hz, 1 H), 5.30 (t, J = 6.2 Hz, 1 H), 5.11
(td, J = 6.2, 1.5 Hz, 1 H), 4.58 (d, J = 5.6 Hz, 1
H), 2.09 (s, 3 H), 1.82-1.69 (m, 2 H), 1.46-1.29
(m, 4 H), 0.92 (t, J = 6.8 Hz, 3 H) (Fig. 2.36).
13C-NMR spectrum :
172.3, 170.2, 152.8, 123.3, 85.5, 84.4, 80.6,
63.8, 63.3, 34.0, 27.0, 22.1, 20.9, 13.8 (Fig.
2.37).
IR Spectrum : 3438, 2923, 2857, 1750, 1237, 1052, 759 (Fig.
2.38).
ESIMS spectrum : 284 [M + NH4] (Fig. 2.39).
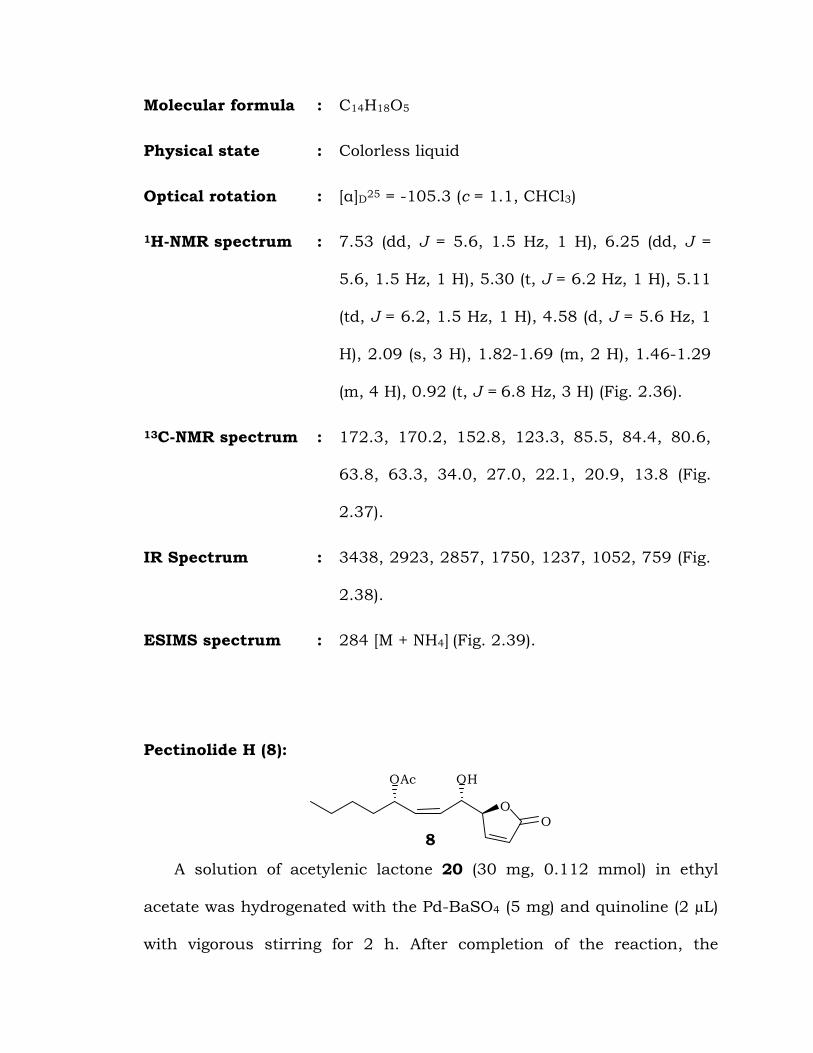
Pectinolide H (8):
OAc OH
OO
8
A solution of acetylenic lactone 20 (30 mg, 0.112 mmol) in ethyl
acetate was hydrogenated with the Pd-BaSO4 (5 mg) and quinoline (2 µL)
with vigorous stirring for 2 h. After completion of the reaction, the
catalyst was removed by filtration and washed with ethyl acetate. The
filtrate was washed with 0.5 N HCl and saturated NaHCO3 solution dried
over anhydrous Na2SO4 and concentrated under reduced pressure. The
crude residue was purified by silica gel column chromatography using
hexane / ethyl acetate (7.1:2.9) as eluent to obtain pure compound 8 (26
mg, 88% yield) as color less liquid.
Molecular formula : C14H20O5
Physical state : Colorless liquid
Optical rotation : [α]D25 = -43.7 (c = 0.18, CHCl3)
1H-NMR spectrum : 7.55 (dd, J = 6.1, 1.8 Hz, 1 H), 6.22 (dd, J =
6.1, 1.8 Hz, 1 H), 5.56-5.33 (m, 3 H), 5.16 (dt,
J = 6.1, 1.8 Hz, 1 H), 4.96 (dd, J = 7.8, 6.1 Hz,
1 H), 3.70 (d, J = 3.8 Hz, 1 H), 2.05 (s, 3 H),
1.79-1.48 (m, 2 H), 1.44-1.18 (m, 4 H), 0.92 (t,
J = 7.0 Hz, 3 H) (Fig. 2.40).
13C-NMR spectrum :
172.5, 171.8, 153.3, 133.1, 129.3, 123.2, 84.1,
71.0, 67.1, 33.6, 27.1, 22.4, 21.3, 13.9 (Fig.
2.41).
IR Spectrum : 3444, 2924, 2855, 1752, 1243, 1044 (Fig.
2.42).
ESIMS spectrum : 286 [M+NH4] (Fig. 2.43).
REFERENCES
1. (a) Rao,Y. S. Chem. Rev. 1976, 76, 625-627; (b) Fukusaki, E.;
Senda, S.; Nakazono, Y.; Omata, T. Tetrahedron 1991, 47, 6223-
6230; (c) Mori, K. Tetrahedron 1989, 45, 3233-3298;
2. (a) Gunasekera, S. P.; Mc Carthy, P. J.; Kelly-Borges, M.;
Lobkovsky, E.; Clardy, J. J. Am. Chem. Soc. 1996, 118, 8759–760;
(b) Avcibasi, H.; Anil, H. Phytochemistry 1987, 26, 2852–2854.
3. (a) Hentzer, M.; Eberl, L.; Nielsen, J.; Giviskov, M. Biodrugs 2003,
17, 241-250; (b) Hjelmgaard, T.; Persson, T.; Rasmussen, T. B.;
Givskov, M.; Nielsen, J. Bioorg. Med. Chem. 2003, 11, 3261-3271;
4. (a) Cateni, F.; Zillic, J.; Zacchigna, M.; Bonivento, P.; Frausin, F.;
Carcia, V. Eur. J. Med.Chem. 2006, 41, 192-200; (b) Brohm, D.;
Philippe, N.; Metzger, S.; Bhargava, A.; Muller, O.; Lieb, F.;
Waldmann, H. J. Am. Chem. Soc. 2002, 124, 13171–13178.
5. Li, D. H.; Zhu, T. J.; Liu, H. B.; Fang, C. Y.; Gu, Q. Q.; Zhu, W. M.
Arch. Pharm. Res. 2006, 29, 624-626.
6. Ma, S.; Shi, Z.; Yu, Z. Tetrahedron 1999, 55, 12137-12148.
7. Fragoso-Serrano, M.; Gibbons, S.; Perda-Miranda, R. Planta Med.
2005, 71, 278-280.
8. Mattinez, M. Las Plantas Medicinales de Mexico, Editorial Botas,
mexico, 1989, p. 508.
9. Malan, K.; Pelissier, Y.; Marion, C.; Blaise, A.; Blessiere, J. Planta
Med. 1988, 54, 531-532.
10. Perda-Miranda, R.; Hernandez, L.; Villavicencio, M. J.; Novelo, M.;
Ibarra, P. J. Nat. Prod. 1993, 56, 583-593.
11. Boalino, D. M.; Connolly, J. D.; McLean, S.; Reynolds, W. F.; Tinto,
W. F. Phytochemistry 2003, 64, 1303–1307.
12. (a) Reddy, D. K.; Shekhar, V.; Prabhakar, P.; Chanti Babu, D.;
Ramesh, D.; Siddhardha, B.; Murthy, U.S.N.; Venkateswarlu, Y.
Bioorg. Med. Chem. Lett. 2011, 21, 997-1000. (b) Ramesh, D.;
Rajaram, S.; Prabhakar, P.; Ramulu, U.; Reddy, D. K. Helv. Chim.
Acta 2011, 94, 1226-1233; (c) Shekhar, V.; Reddy, D. K.; Suresh,
V.; Chanti Babu, D.; Venkateswarlu, Y. Tetrahedron Lett. 2010, 51,
946-948.
13. (a) Colobert, F.; Genet, J-P. Tetrahedron Lett. 1985, 26, 2779-
2782; (b) Babudri, F.; Fiandanese, V.; Hasan, O.; Punzi, A.; Naso,
F. Tetrahedron 1998, 54, 4327-4336.
14. (a) Reddy, M. V. R.; Rearick, J. P.; Hoch, N.; Ramachandran, P. V.
Org. Lett. 2001, 3, 19-20; (b) Midland, M. M.; McDowell, D. C.;
Hatch, R. L.; Tramontano, A. J. Am. Chem. Soc. 1980, 102, 867-
869; (c) Stille, J. K.; Sweet, M. P. Tetrahedron Lett. 1989, 30, 3645-
3648.
15. Rossi, R.; Bellina, F.; Catanese, A.; Manninab, L.; Valensinc, D.
Tetrahedron, 2000, 56, 479–487.
16. (a) Vaz, B.; Pereira, R.; Perez, M.; Alvarez, R.; de Lera, A. R. J. Org.
Chem. 2008, 73, 6534–6541; (b) Andreini, B. P.; Carpita, A.; Rossi,
R.; Scamuzzi, B. Tetrahedron 1989, 45, 5621-5640.
17. (a) Caddick, S.; Shanmugathasan, S.; Brasseur, D.; Delisser, V. M.
Tetrahedron Lett. 1997, 38, 5735-5736; (b) Somfai, P.; Marchand,
P.; Torsell, S.; Lindstrom, U. M. Tetrahedron 2003, 59, 1293–1299.
18. Still, W. C.; Gennari, C. Tetrahedron Lett. 1983, 24, 4405–4408. b)
Horita, K.; Sakurai, Y.; Nagasawa, M.; Yonemitsu, O. Chem. Pharm.
Bull. 1997, 45, 1558-1572; c) Krishna, P. R.; Reddy P. S.
Tetrahedron 2007, 63, 3995–3999.
19. Ramesh, D.; Shekhar, V.; Chantibabu, D.; Rajaram, S.; Ramulu,
U.; Venkateswarlu, Y. Tetrahedron Lett. 2012, 53, 1258–1260.
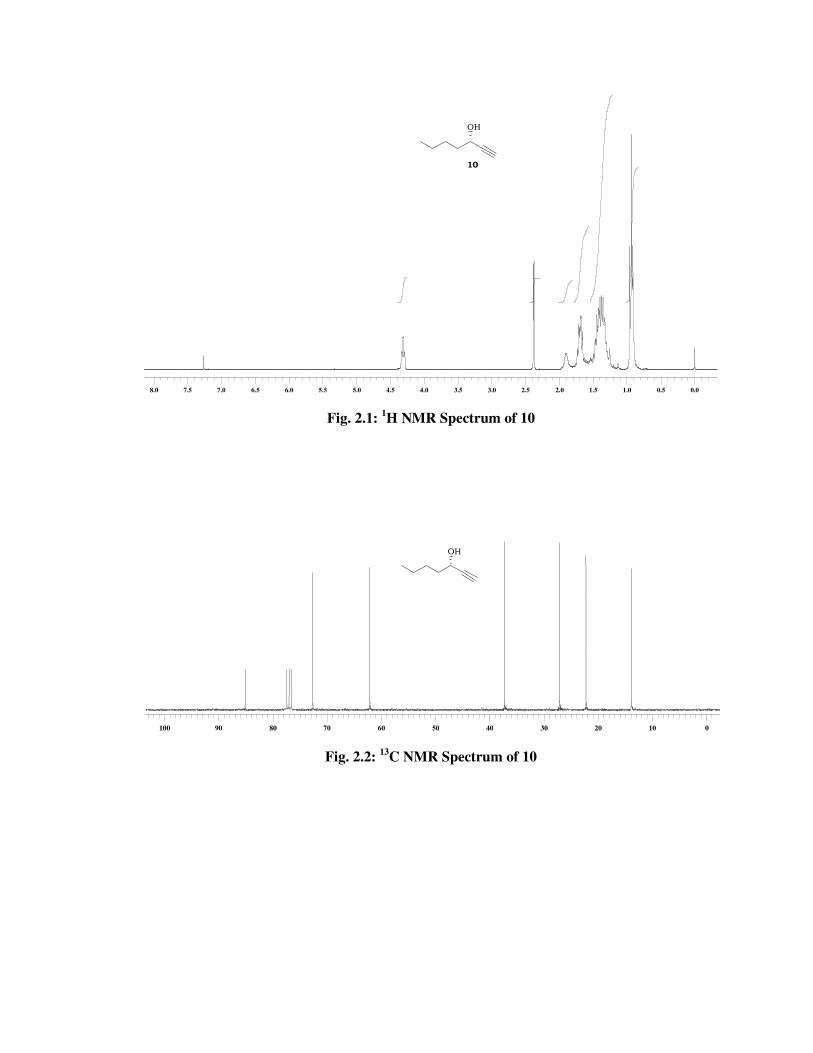
Fig. 2.1: 1H NMR Spectrum of 10
Fig. 2.2: 13
C NMR Spectrum of 10
0.00.00.50.51.01.01.51.52.02.02.52.53.03.03.53.54.04.04.54.55.05.05.55.56.06.06.56.57.07.07.57.58.08.0
OH
10
00101020203030404050506060707080809090100100
OH
5.55.56.06.06.56.57.07.07.57.5
Fig. 2. 3: IR spectrum of compound 10
Fig. 2.4: 1H NMR Spectrum of 11
1.51.52.02.02.52.53.03.03.53.54.04.04.54.55.05.05.55.5
OTBS
OH
0.00.00.50.51.01.0
80809090100100
Fig. 2.5: 13
C NMR Spectrum of 11
Fig. 2.6: IR spectrum of compound 11
202030304040505060607070
OTBS
11
OTBS
001010
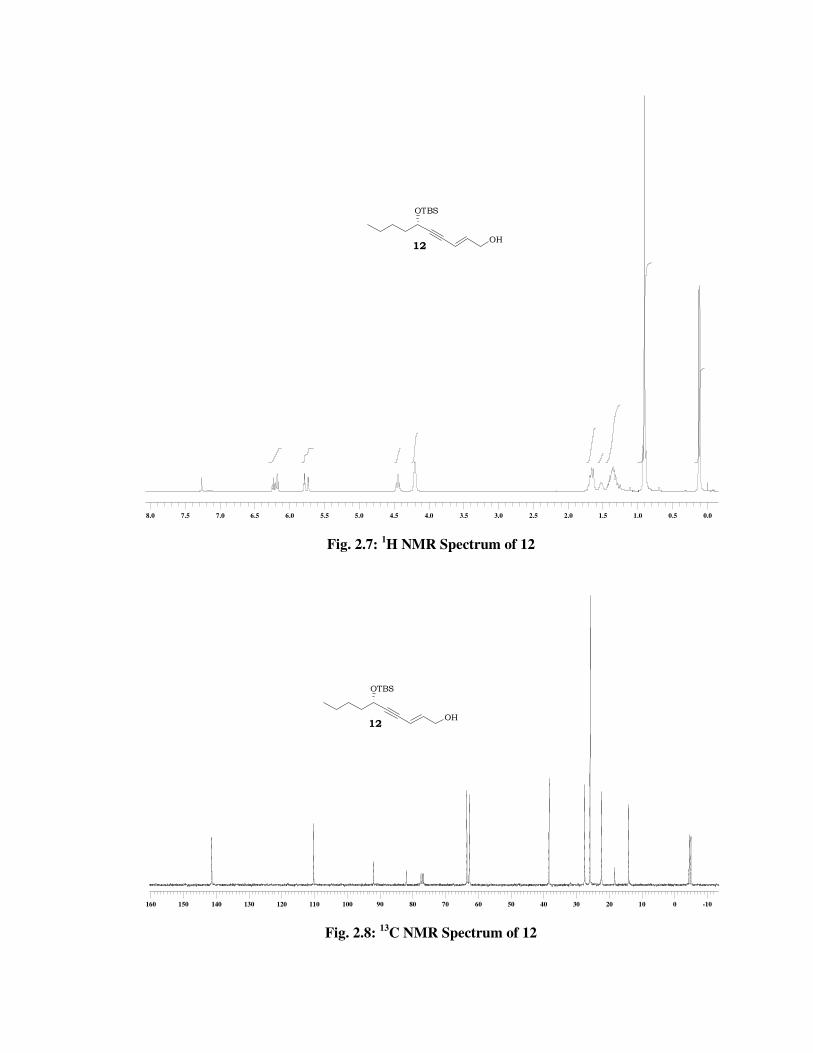
Fig. 2.7: 1H NMR Spectrum of 12
Fig. 2.8: 13
C NMR Spectrum of 12
0.00.00.50.51.01.01.51.52.02.02.52.53.03.03.53.54.04.04.54.55.05.05.55.56.06.06.56.57.07.07.57.58.08.0
12
OTBS
OH
-10-1000101020203030404050506060707080809090100100110110120120130130140140150150160160
12
OTBS
OH
5.55.56.06.06.56.57.07.07.57.5
Fig. 2.9: IR spectrum of compound 12
Fig. 2.10: 1H NMR Spectrum of 13
1.51.52.02.02.52.53.03.03.53.54.04.04.54.55.05.05.55.5
OTBS
OP MB 1 3
OTBS
OH
0.00.00.50.51.01.0
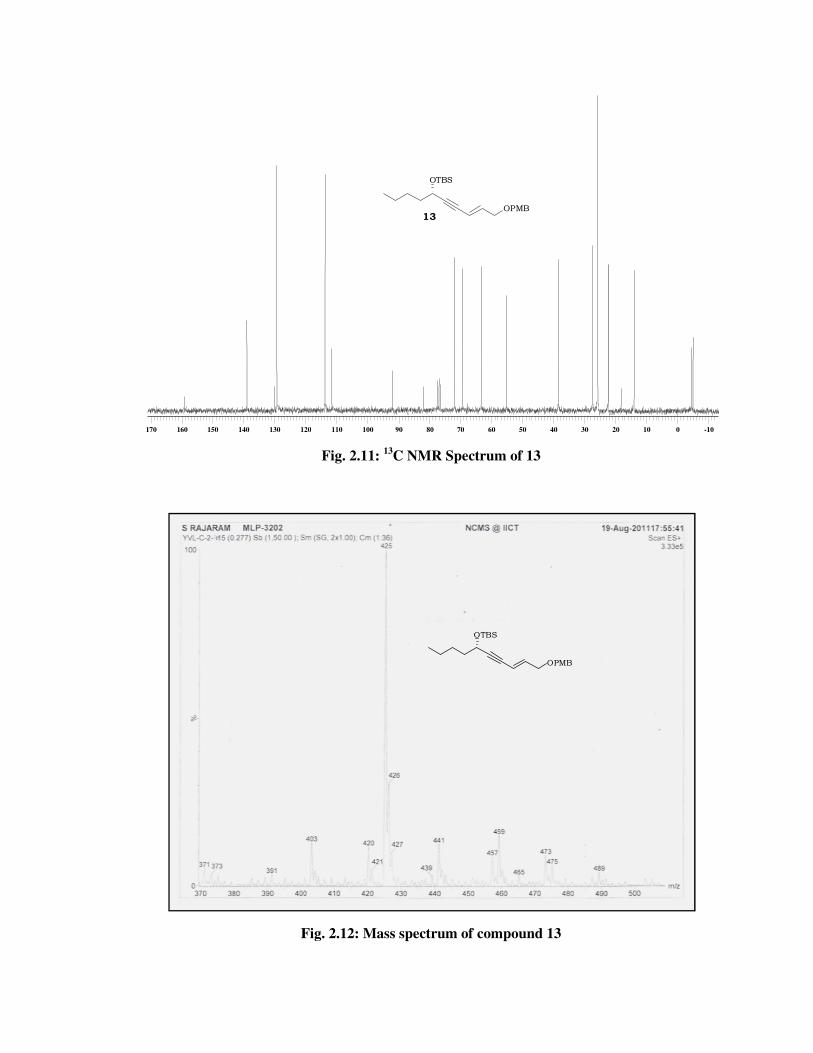
Fig.
120120130130140140150150160160170170
Fig. 2.11: 13
C NMR Spectrum of 13
Fig. 2.12: Mass spectrum of compound 13
3030404050506060707080809090100100110110120120
OTBS
OPMB13
OTBS
OPMB
-10-100010102020
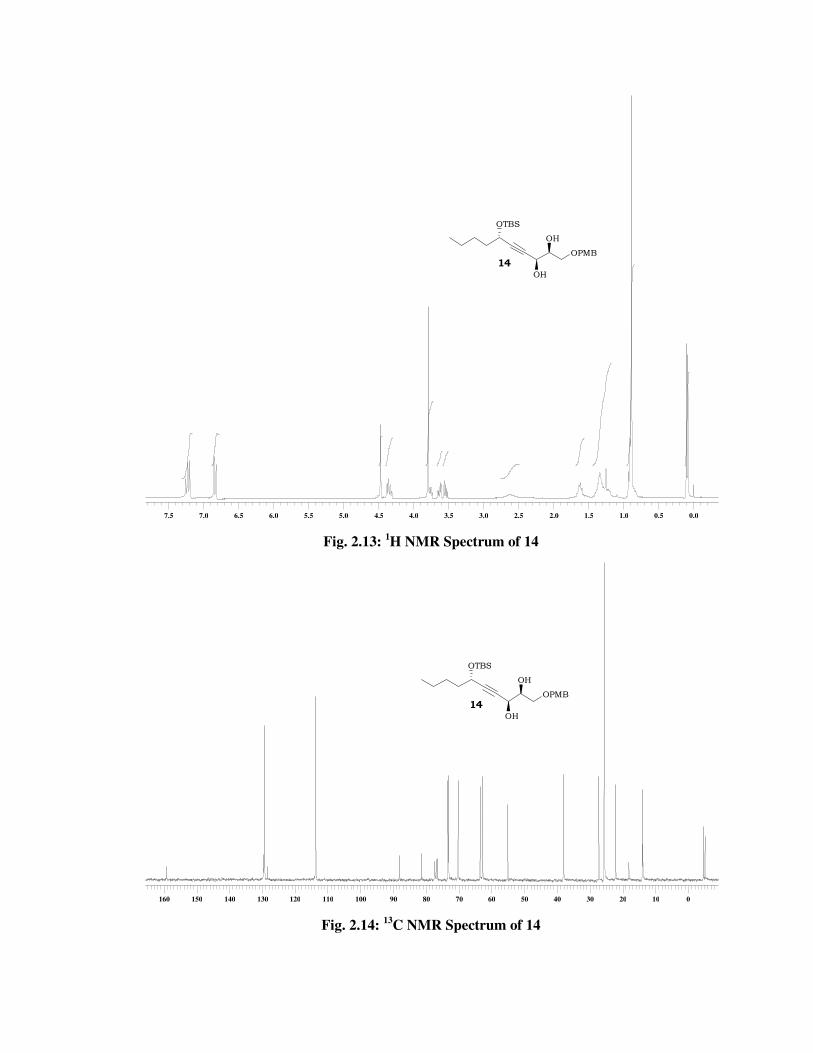
Fig. 2.13: 1H NMR Spectrum of 14
Fig. 2.14: 13
C NMR Spectrum of 14
0.00.00.50.51.01.01.51.52.02.02.52.53.03.03.53.54.04.04.54.55.05.05.55.56.06.06.56.57.07.07.57.5
OTBS
OH
OH
OPMB
14
00101020203030404050506060707080809090100100110110120120130130140140150150160160
OTBS
OH
OH
OPMB
14
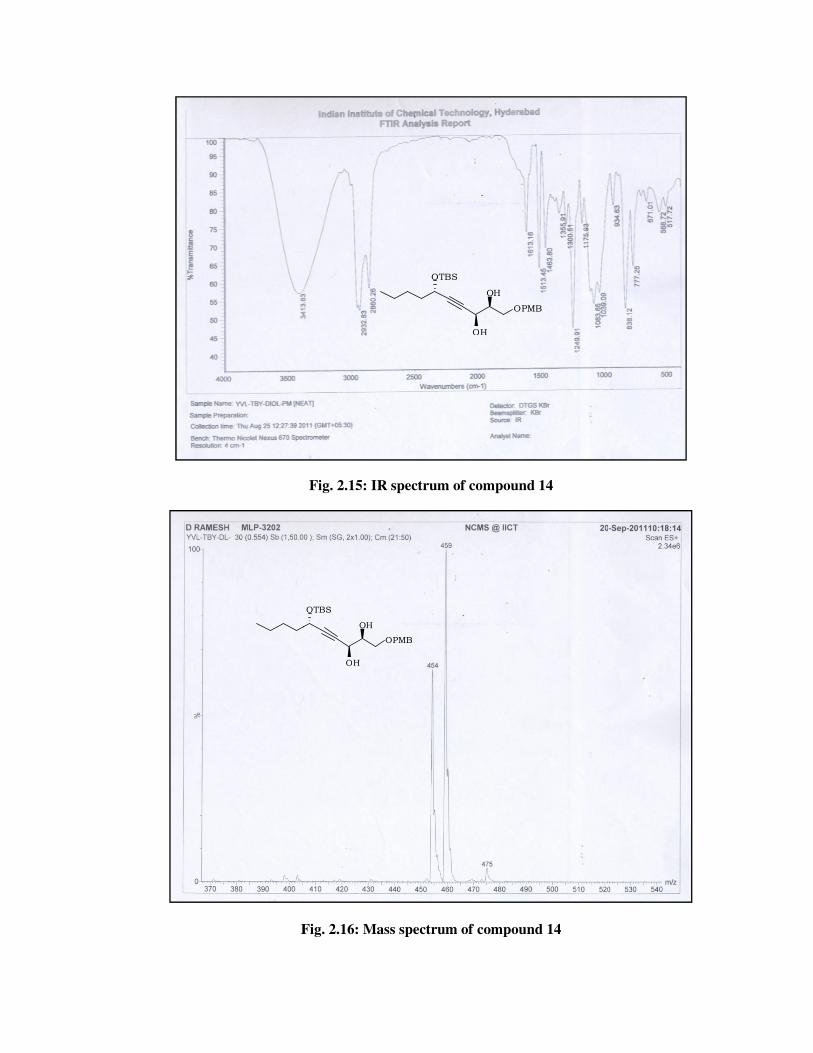
Fig.
Fig. 2.15: IR spectrum of compound 14
Fig. 2.16: Mass spectrum of compound 14
OTBS
OH
OH
OPMB
OTBS
OH
OH
OPMB
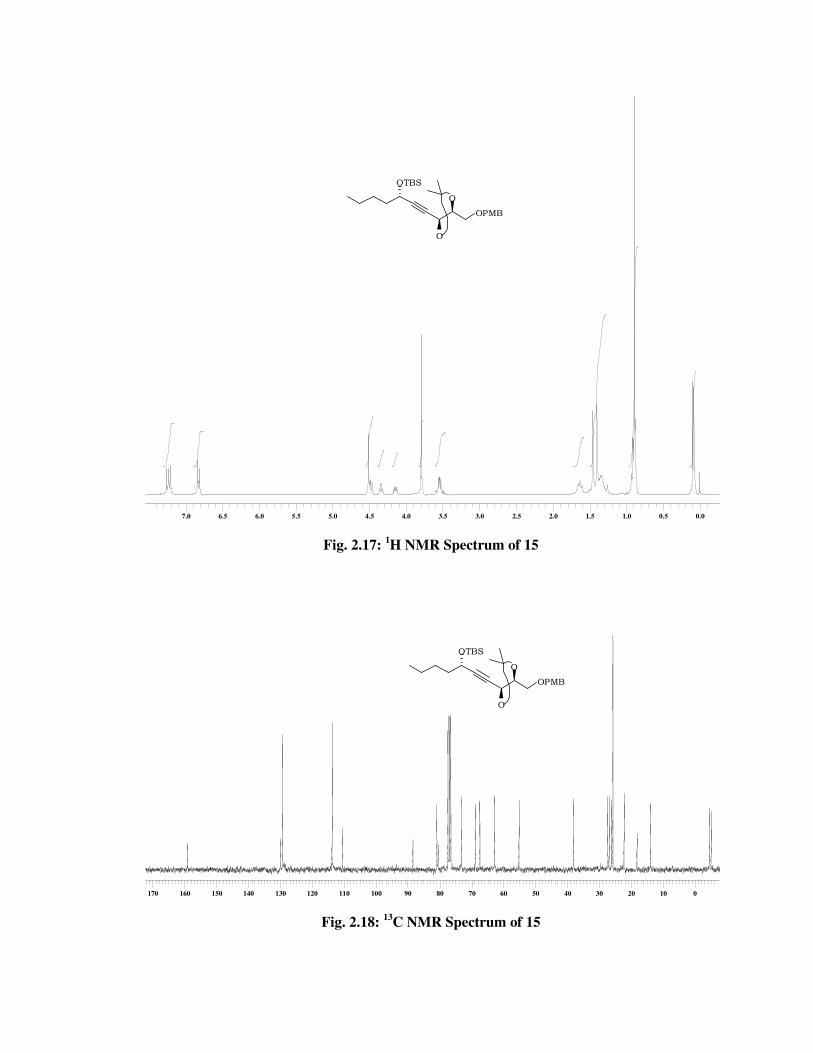
Fig. 2.17: 1H NMR Spectrum of 15
Fig. 2.18: 13
C NMR Spectrum of 15
0.00.00.50.51.01.01.51.52.02.02.52.53.03.03.53.54.04.04.54.55.05.05.55.56.06.06.56.57.07.0
00101020203030404050506060707080809090100100110110120120130130140140150150160160170170
OTBS
O
O
OPMB
OTBS
O
O
OPMB
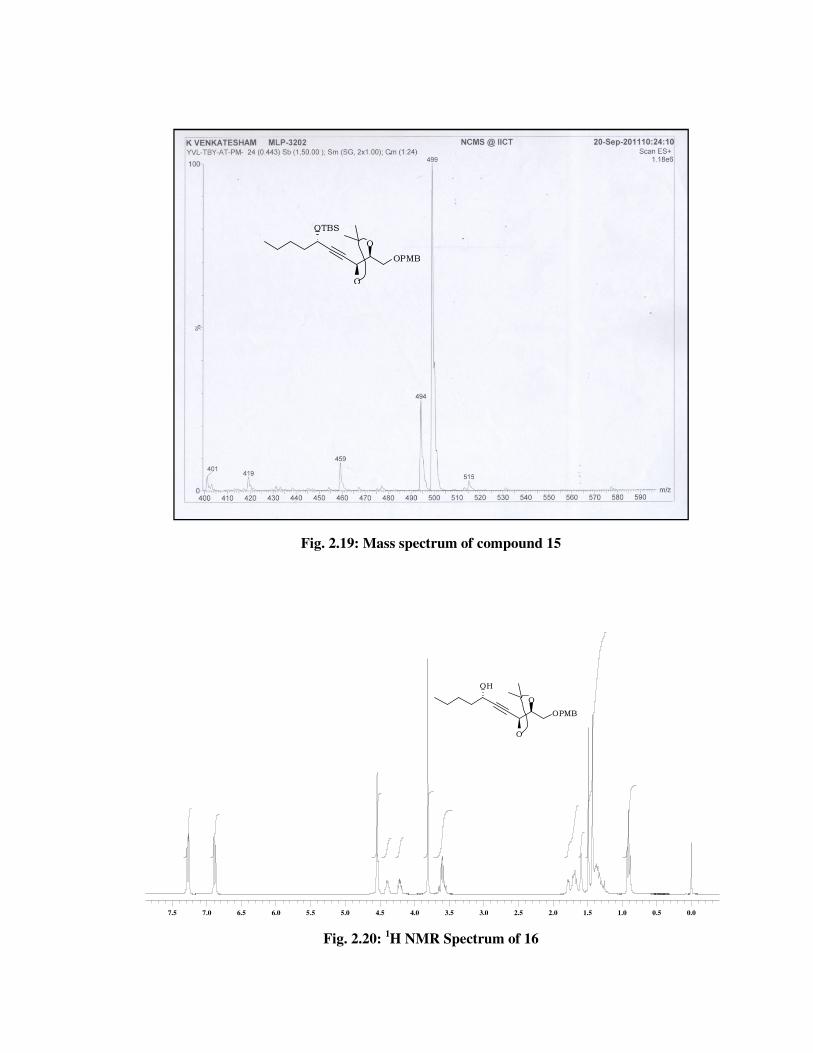
Fig. 2.19: Mass spectrum of compound 15
Fig. 2.20: 1H NMR Spectrum of 16
0.00.00.50.51.01.01.51.52.02.02.52.53.03.03.53.54.04.04.54.55.05.05.55.56.06.06.56.57.07.07.57.5
OTBS
O
O
OPMB
OH
O
O
OPMB
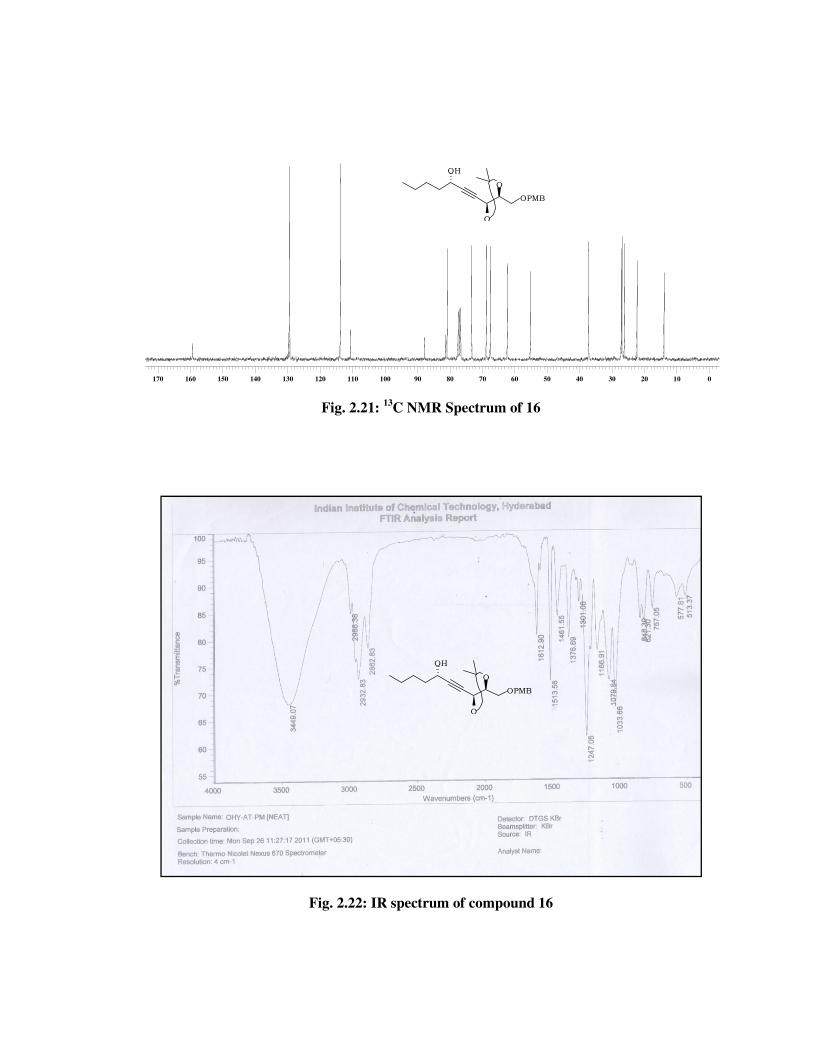
Fig. 2.21: 13
C NMR Spectrum of 16
Fig. 2.22: IR spectrum of compound 16
00101020203030404050506060707080809090100100110110120120130130140140150150160160170170
OH
O
O
OPMB
OH
O
O
OPMB
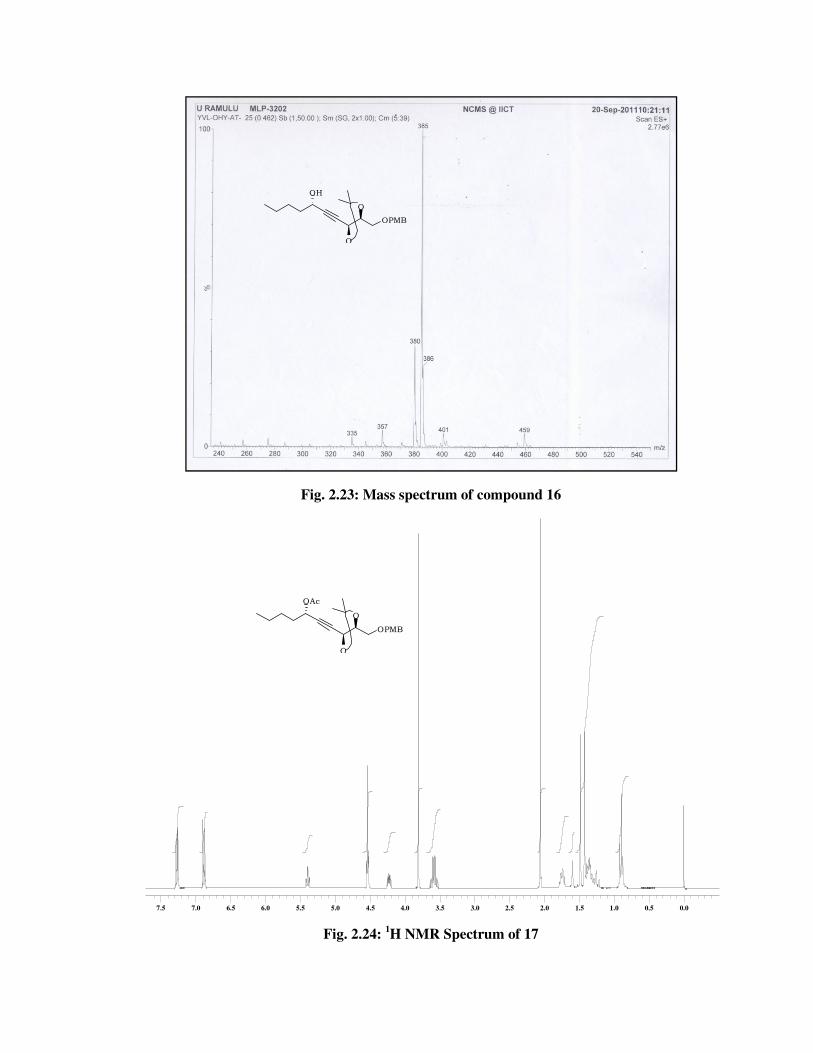
Fig. 2.23: Mass spectrum of compound 16
Fig. 2.24: 1H NMR Spectrum of 17
0.00.00.50.51.01.01.51.52.02.02.52.53.03.03.53.54.04.04.54.55.05.05.55.56.06.06.56.57.07.07.57.5
OH
O
O
OPMB
OAc
O
O
OPMB
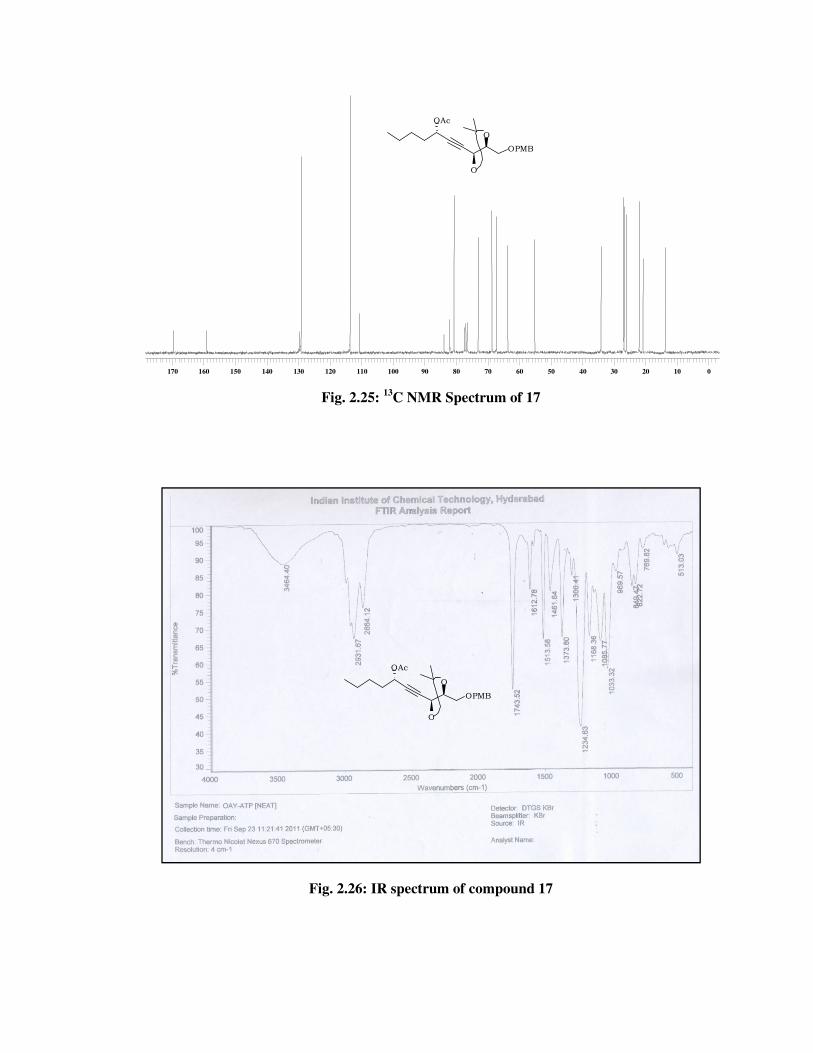
Fig. 2.25: 13
C NMR Spectrum of 17
Fig. 2.26: IR spectrum of compound 17
00101020203030404050506060707080809090100100110110120120130130140140150150160160170170
OAc
O
O
OPMB
OAc
O
O
OPMB
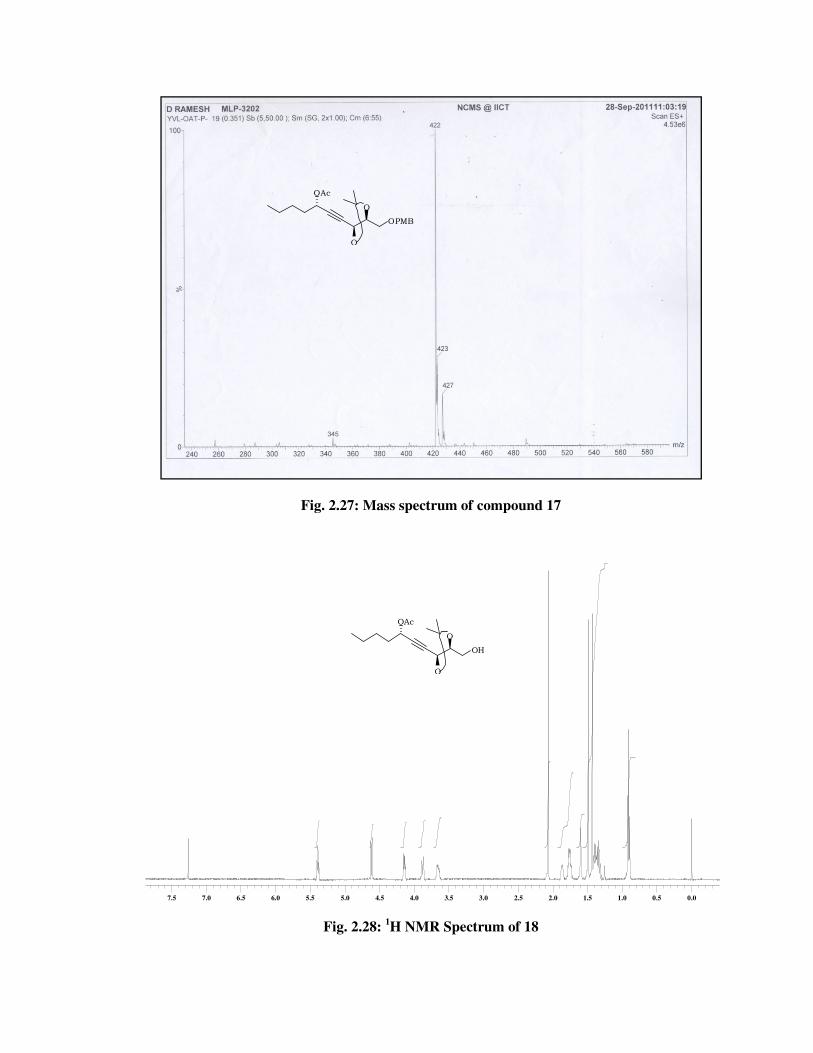
Fig. 2.27: Mass spectrum of compound 17
Fig. 2.28: 1H NMR Spectrum of 18
0.00.00.50.51.01.01.51.52.02.02.52.53.03.03.53.54.04.04.54.55.05.05.55.56.06.06.56.57.07.07.57.5
OAc
O
O
OPMB
OAc
O
O
OH
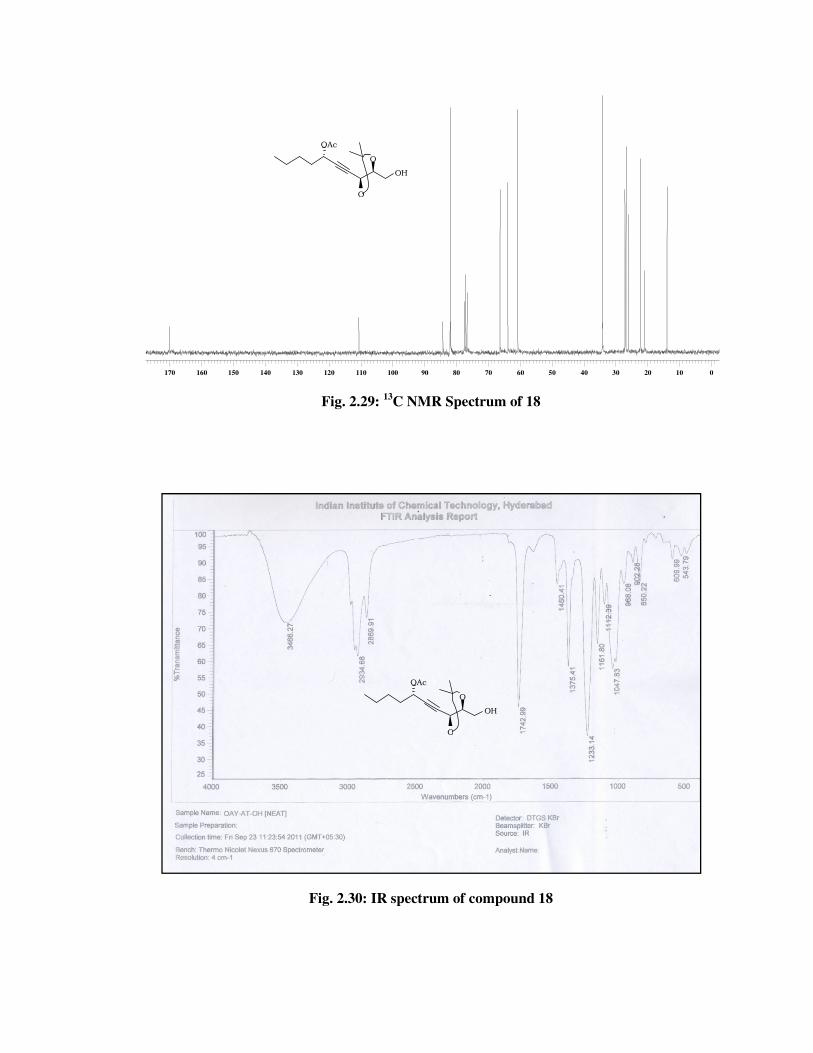
Fig. 2.29: 13
C NMR Spectrum of 18
Fig. 2.30: IR spectrum of compound 18
00101020203030404050506060707080809090100100110110120120130130140140150150160160170170
OAc
O
O
OH
OAc
O
O
OH
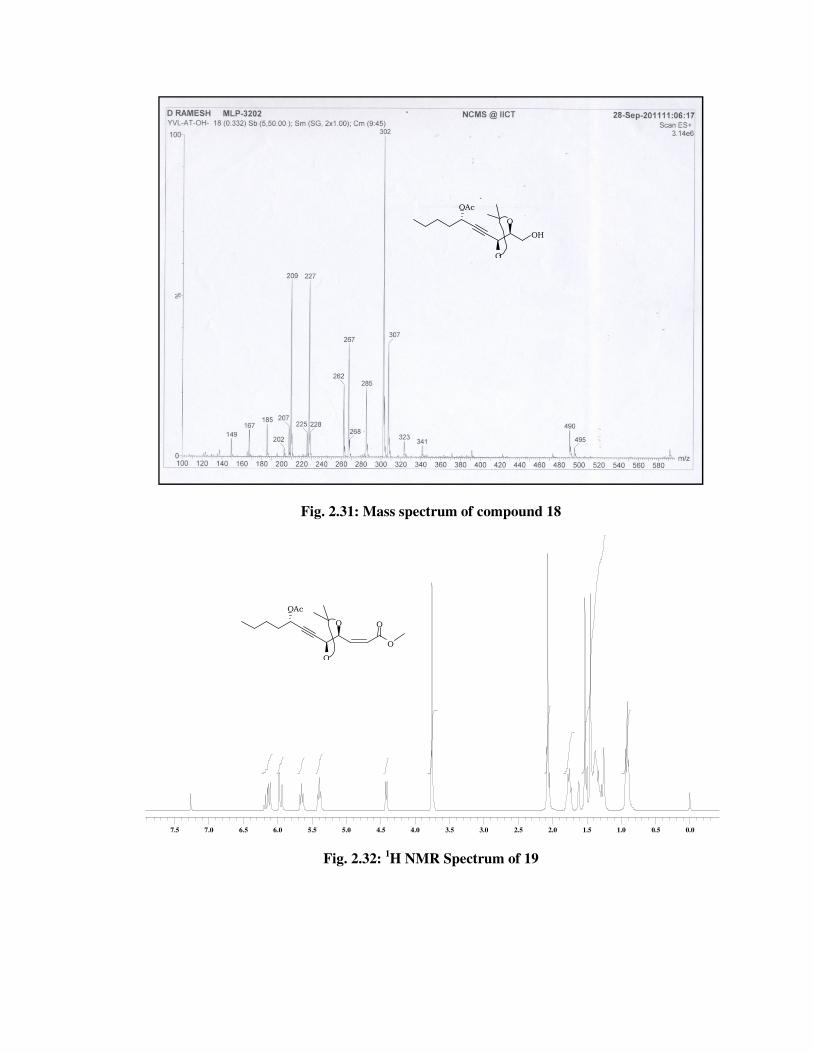
Fig. 2.31: Mass spectrum of compound 18
Fig. 2.32: 1H NMR Spectrum of 19
0.00.00.50.51.01.01.51.52.02.02.52.53.03.03.53.54.04.04.54.55.05.05.55.56.06.06.56.57.07.07.57.5
OAc
O
O
OH
OAc
O
O
O
O
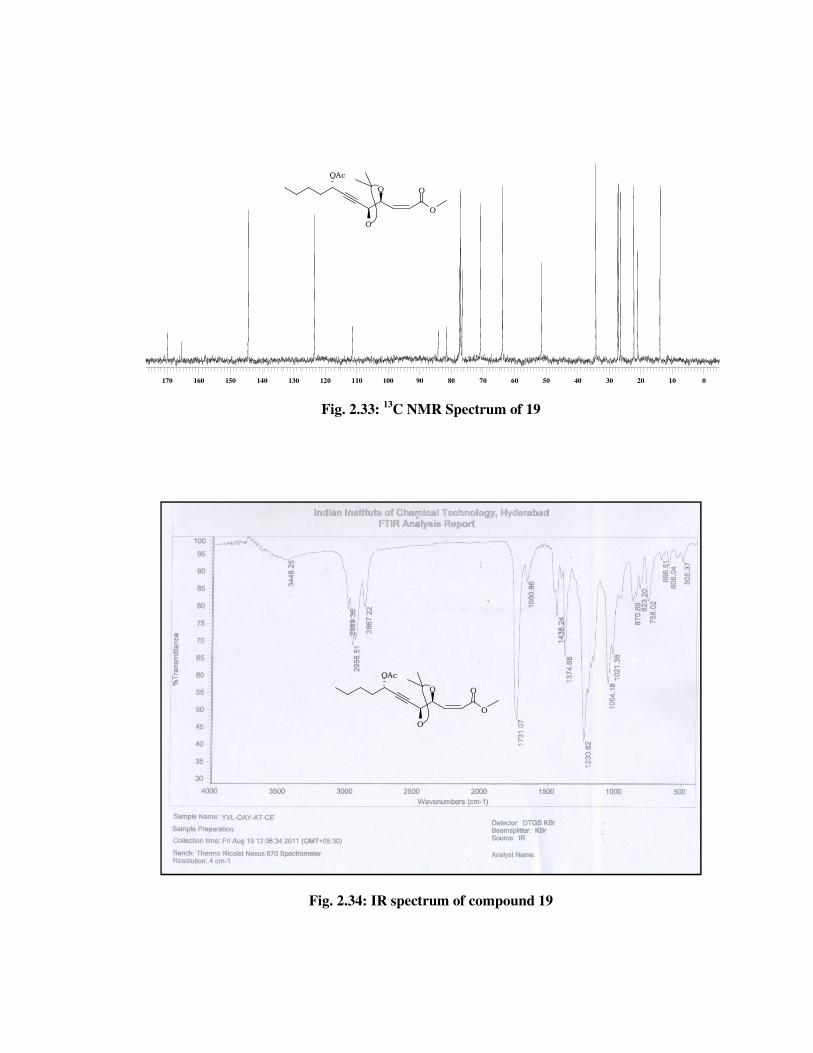
Fig. 2.33: 13
C NMR Spectrum of 19
Fig. 2.34: IR spectrum of compound 19
00101020203030404050506060707080809090100100110110120120130130140140150150160160170170
OAc
O
O
O
O
OAc
O
O
O
O
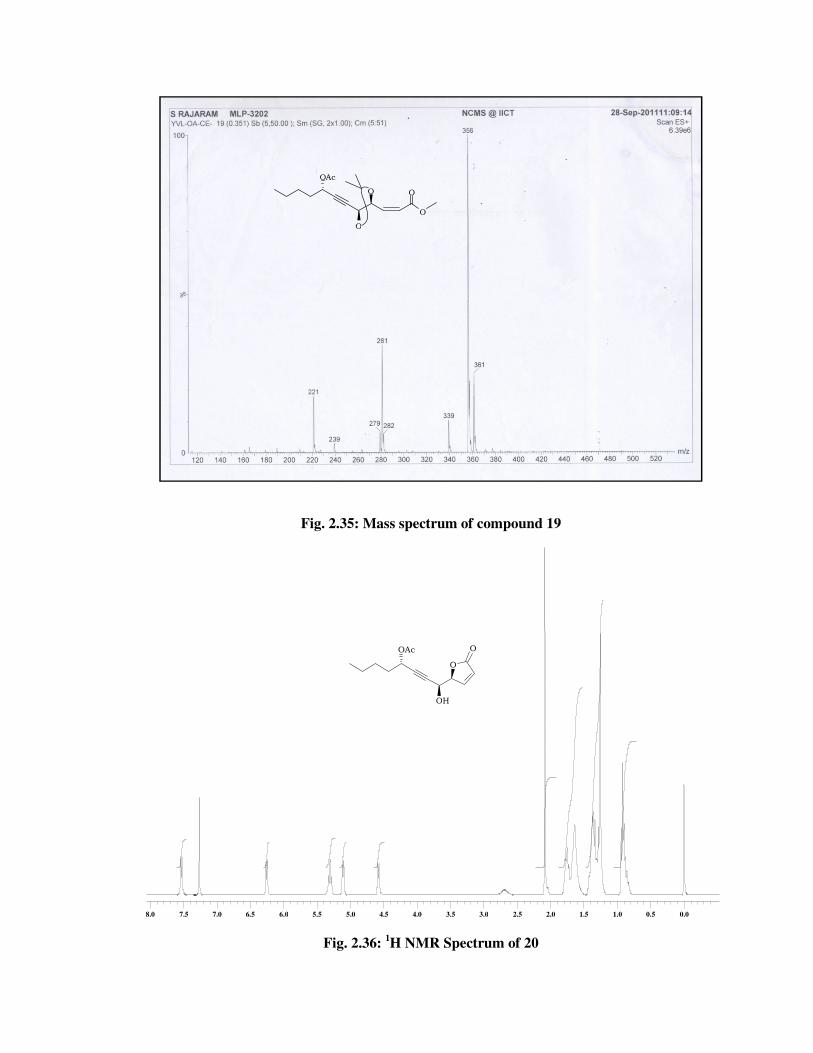
Fig. 2.35: Mass spectrum of compound 19
Fig. 2.36: 1H NMR Spectrum of 20
0.00.00.50.51.01.01.51.52.02.02.52.53.03.03.53.54.04.04.54.55.05.05.55.56.06.06.56.57.07.07.57.58.08.0
OAc
OH
O
O
OAc
O
O
O
O
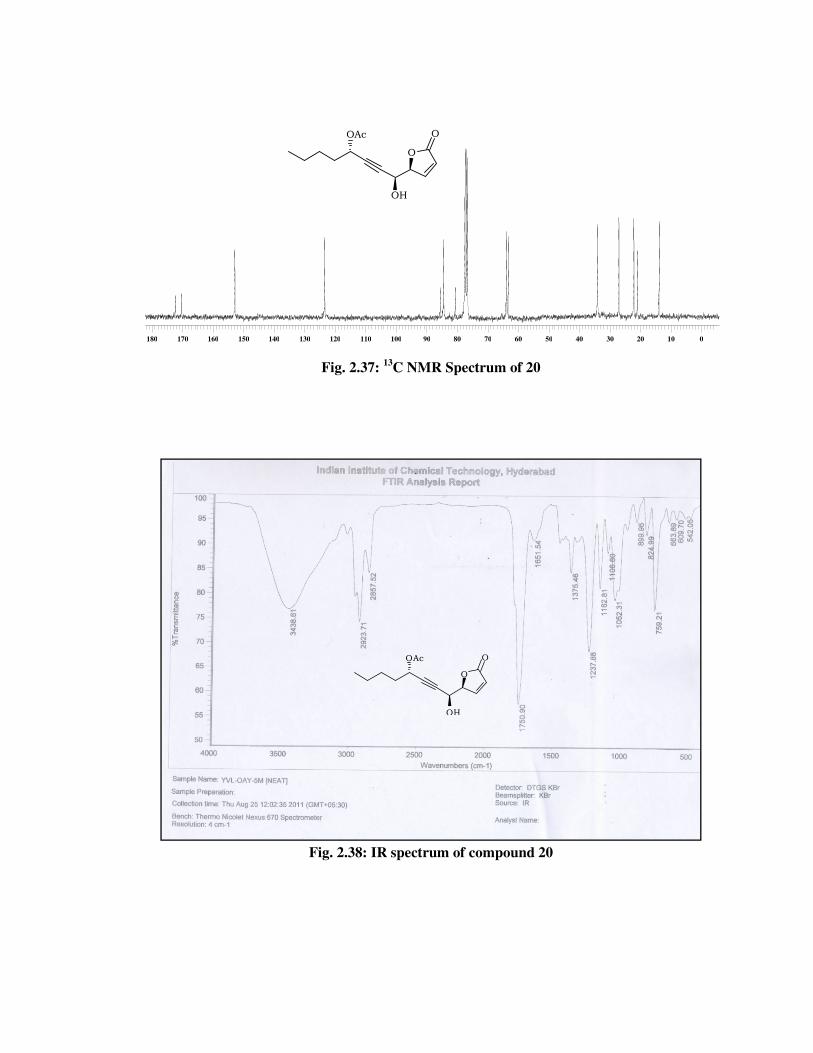
Fig. 2.37: 13
C NMR Spectrum of 20
Fig. 2.38: IR spectrum of compound 20
00101020203030404050506060707080809090100100110110120120130130140140150150160160170170180180
OAc
OH
O
O
OAc
OH
O
O
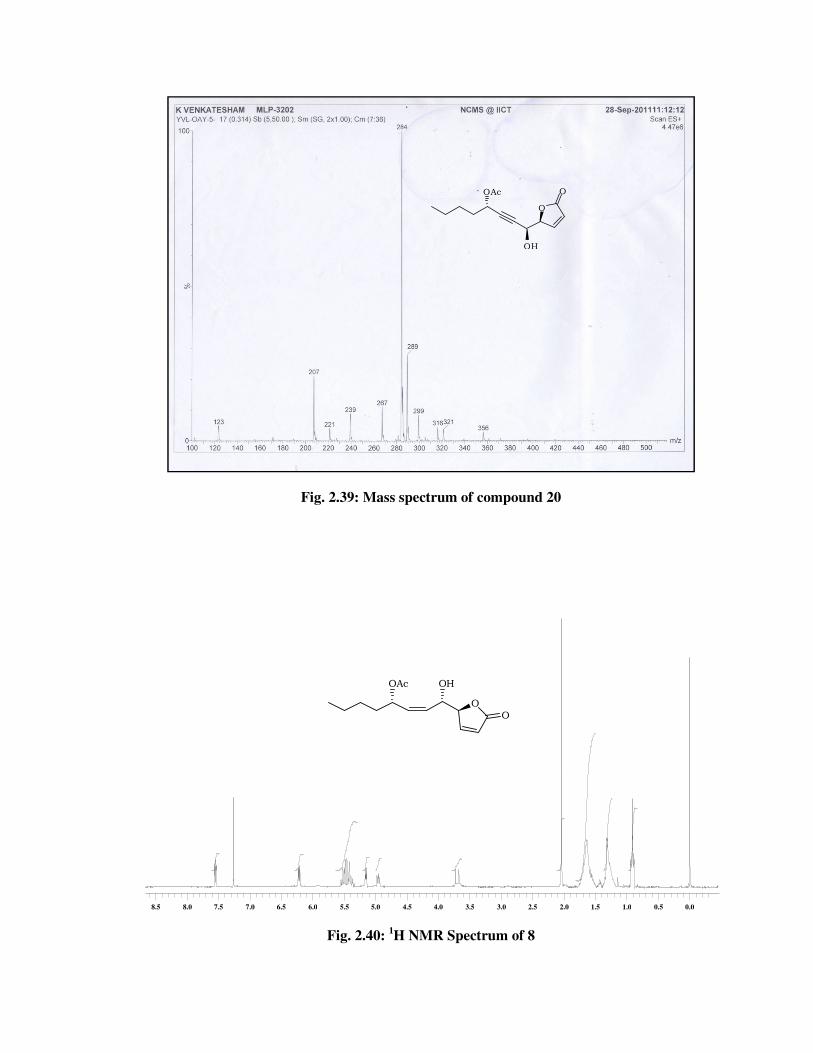
Fig. 2.39: Mass spectrum of compound 20
Fig. 2.40: 1H NMR Spectrum of 8
0.00.00.50.51.01.01.51.52.02.02.52.53.03.03.53.54.04.04.54.55.05.05.55.56.06.06.56.57.07.07.57.58.08.08.58.5
OAc OH
OO
OAc
OH
O
O
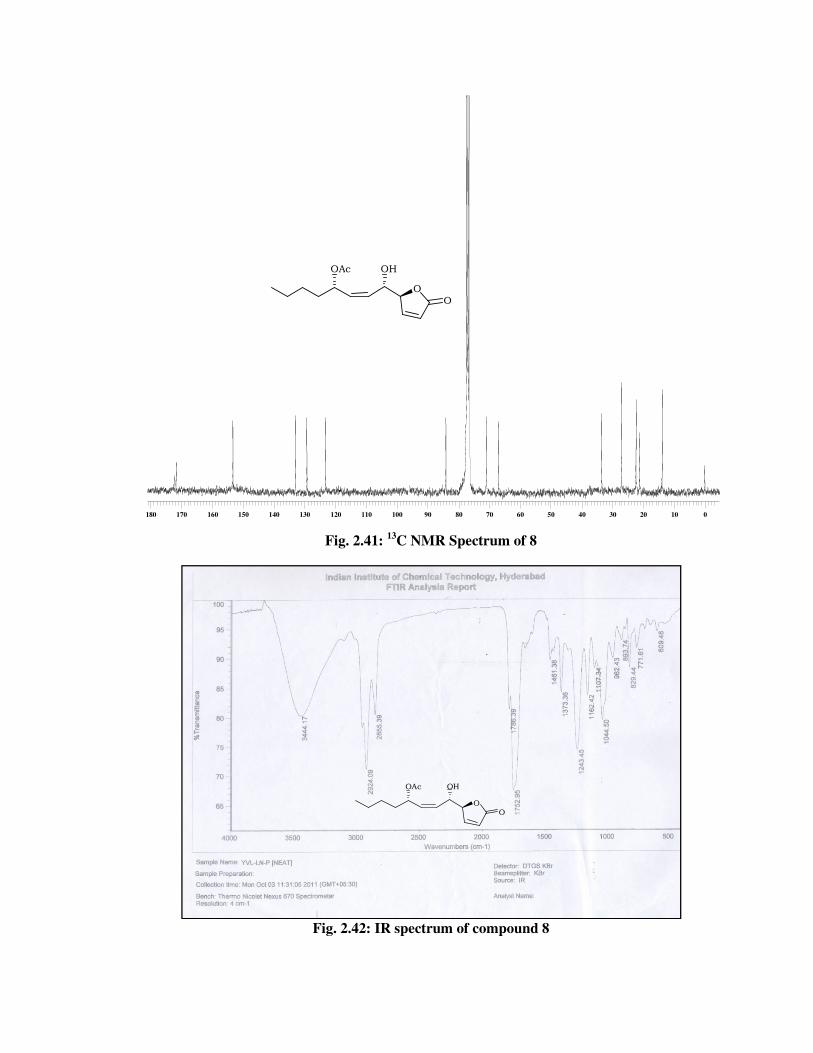
Fig. 2.41: 13
C NMR Spectrum of 8
Fig. 2.42: IR spectrum of compound 8
00101020203030404050506060707080809090100100110110120120130130140140150150160160170170180180
OAc OH
OO
OAc OH
OO
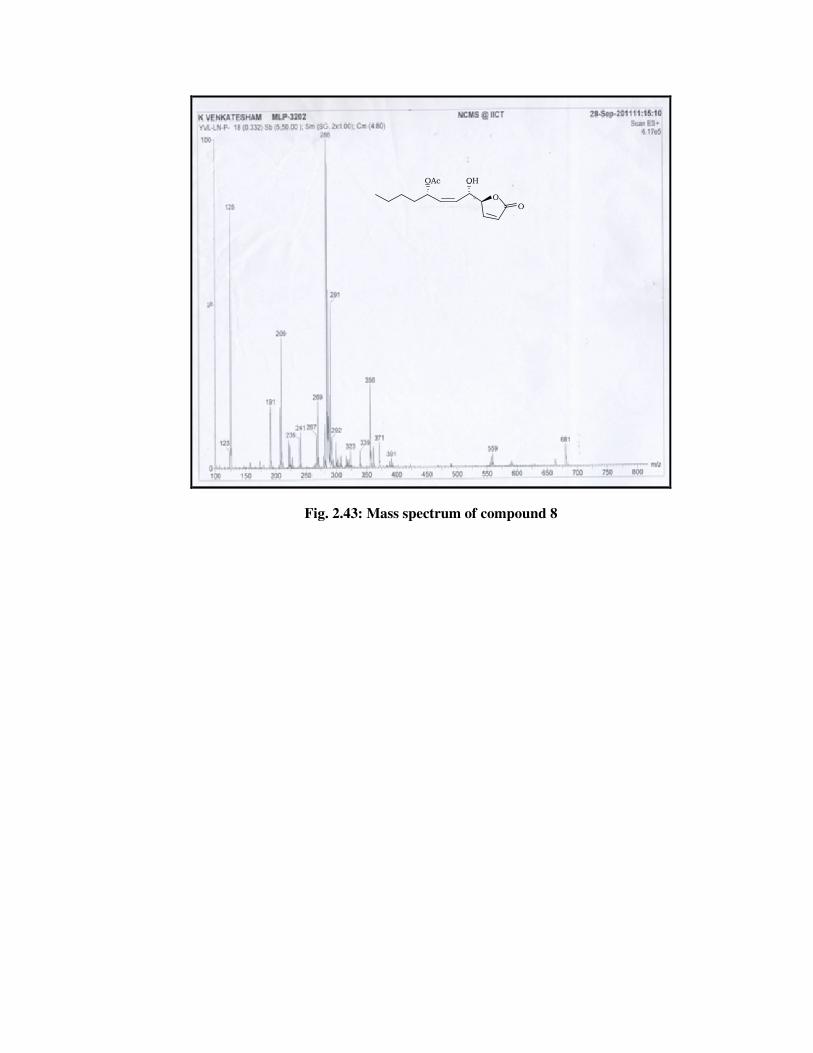
Fig. 2.43: Mass spectrum of compound 8
OAc OH
OO


![Electronic Supplementary Information (ESI) for · 2016. 10. 10. · S1 Electronic Supplementary Information (ESI) for Stereoselective photoreaction in P-stereogenic dithiazolylbenzo[b]phosphole](https://img.pdfslide.tips/doc/110x75/60d94a5bcd01870cf40fb448/electronic-supplementary-information-esi-2016-10-10-s1-electronic-supplementary.jpg)