Embed Size (px)
Citation preview

Lecture 2
Major Characteristics of Developing Countries
In this lecture, we will discuss some of the salient features of developing countries. As
discussed in the previous lecture, developing countries are characterized by low per-
capita income and human development. Recall that the essence of economic
development is structural change. We now discuss some of the most important
structural features of developing countries.
(i) Lower per-capita income
(ii) Low levels of human capital
(iii) High levels of poverty and under-nutrition
(iv) Higher population growth rates
(v) Predominance of agriculture and low levels of industrialization
(vi) Low level of urbanization but rapid rural-to-urban migration
(vii) Dominance of informal sector
(viii) Underdeveloped labor, financial, and other markets.
Lower Per-Capita Income: As we have already discussed, developing countries have
lower per-capita income compared to developed countries. Figure 1 depicts the annual
per-capita income of selected countries in 2005 in the U.S. dollar. Figure shows a wide
disparity in income levels. In 2005, the country with the highest per capita income,
Switzerland, had 345 times the per capita income of one of the poorest countries of the
world, Ethiopia, and 76 time that of one of the world’s largest nations, India.
However, such per-capita income comparison exaggerates the differentials in standards
of living between developing and developed countries. Recall that what matters for the
well-being is the amount of goods and services one can purchase. The amount of
goods and services one can purchase depends on two things: income and the price
level. Same amount of income buys fewer goods and services if prices are high
compared to the case when prices are low.
For example, suppose that there are two individuals A and B. Both have identical
incomes say $1000. Now suppose that A lives in a country where price level is 50, but B
lives in a country where price level is 100. Then, A can buy 20 units of good, while B
can buy only 10 units of goods. Thus, despite identical incomes A will have higher
standard of living than B.

This implies that if we ignore differences in price level across countries, then just the
comparison of per-capita income across countries can give misleading picture of
differences in the standards of living. It turns out that on average prices in developing
countries are lower than prices in developed countries. One dollar spent in India buys
more goods and services than in the United States. The main reason for lower prices in
developing countries is relatively low labor cost.
Researchers have tried to take into account such price differences across countries and
developed the concept of purchasing power parity (PPP). PPP is calculated using a
common set of international prices for all goods and services produced, valuing goods
in all countries at U.S. prices. PPP is defined as the number of units of a foreign
country’s currency required to purchase the identical quantity of goods and services in
the local markets as $1 would buy in the United States.
Table 1 provides comparison of exchange rate and PPP per-capita income of selected
countries for 2005. Table shows that per-capita income in terms of PPP in developing
countries is much higher compared to per-capita income in terms of nominal exchange
rate. For example, the exchange rate per-capita income in Bangladesh was $470, but
PPP per-capita income was $2,090 in 2005. Measured in PPP dollars, the gap between
the United Sates and Burundi would be 66 to 1 rather than 436 to 1 as measured at the
official exchange rate.
Low Levels of Human Capital – In the previous lecture we looked at human
development index. The developing countries are characterized by low HD score. Part
of the reason is their low per-capita income. However, low HD score is also due to low
human capital levels in terms of health and education.
Table 2 summarizes various indicators of health and education. It shows that low
income countries have substantially lower life expectancy at birth and higher under-5
mortality rate compared to high income countries. Life expectancy at birth is defined as
the number of years new-born children are expected to live. Under-5 mortality rate is
defined as the number of deaths among children between birth and 5 years of age per
1,000 live births.
The average life expectancy in low income countries in 2005 was 59 years, while in
high income countries it was 79 years. Thus, people in high income countries, on
average, live 20 more years than people in low income countries. Similarly, there is
wide disparity in under-5 mortality rate. Under-5 mortality rate in low income countries
was 20 times higher than in high income countries.
Figure 2 shows trend in under-5 mortality rate between 1990 and 2005. It shows that
the under-5 mortality rate is declining for all groups of countries. However, the rate of
decline is relatively slow for low income countries.
Table 2 also shows regional distribution of life expectancy and under-5 mortality rate.
Sub-Saharan region has the lowest life expectancy and the highest under-5 mortality
rate followed by South Asian region.
There is similar disparity in educational attainment across countries. Last two columns
of table 2 gives adult literacy rates for male and female. Adult literacy rate is defined as
the percentage of the population age 15 and over that is able to read and write.
Table 2 shows that low income countries have significantly less adult literacy rate
compared to high income countries. This disparity is wider for female. Looking at the
regional pattern, we find that both Sub-Saharan and Asian countries have substantially
lower adult literacy rate.
Table 3 shows net primary school enrollment rate and student (pupil)-teacher ratio in
primary schools for 2005. Net primary school enrollment rate is defined as the ratio of
the number of children actually attending primary school to the number of school-age
children in the population.
Student-teacher ratio captures the quality of education. Higher is this ratio, lower is the
quality of schooling. Table clearly shows that low income countries have lower primary
school enrolment and much higher student-teacher ratio. Only 78 percent of children (5-
14) in low income countries go to school. Also the children who go school, they receive
lower quality of education. Regional pattern shows that Sub-Saharan countries have the
lowest primary school enrollment and the highest student-teacher ratio followed by
South Asian countries.
High Levels of Poverty and Under-Nutrition – Developing countries, particularly low
income countries, are characterized by very high incidence of poverty and prevalence of
hunger and under-nutrition. Column 5 of table 2 shows the incidence of under-nutrition.
It shows that 24 percent of people in low income countries were under-nourished in
2005. The corresponding figure for high income countries was 3 percent. This show that
fully one fourth of people in low income countries does not get adequate food and
nourishment. The incidence of under-nourishment was highest in the Sub-Saharan
region. In this region, nearly 1/3rd of populace does not get adequate food.
Figure 3 depicts the trend in number of people living in abject poverty in various regions
of world in 2002. The incidence of abject poverty varies widely around the developing
world. The world Bank estimates that the share of the population living on less than $ 1
a day is 9.1% in East Asia and the Pacific, 8.6% in Latin America and Caribbean, 1.5%
in the Middle East and North Africa, 31.7% in South Asia, and 41.1% in Sub-Saharan
Africa. The incidence of people living in extreme poverty has declined over years.
However, most of the decline has taken place in East Asian and Pacific Region. The
decline in Sub-Saharan and South Asian regions has been painfully slow.
Figure 3 also shows that while the number of people living on less than $ 1 a day has
fallen between 1981 and 2002, but the number of people living on less than $ 2 a day
has remained persistently high. In 2002, 2.5 billion people were estimated to live on less
than $2 a day.
Higher Population Growth Rate – Developing countries, particularly low income
countries, are characterized by relatively high population growth rate despite the fact
that they have high child mortality rate. High population growth rate is due to vey high
birth rate.
Column 7 of table 2 shows crude birth rate for different regions of the world in 2005.
Crude birth rate is defined as the number of children born alive each year per 1,000
population. Table 2 shows that crude birth rate in low income countries was 29, while
the corresponding figure for high income countries was just 10. Within developing
countries, Sub-Saharan countries have highest crude birth rate and East Asian and
Pacific countries lowest.
Predominance of Agriculture and Low Levels of Industrialization – One striking
feature of developing countries is that agriculture accounts for a large part of gross
domestic product and employment. Table 3 shows the share of agriculture, industry,
and mining in GDP and employment of male and female for selected countries for the
period 2000-2005. Table shows that the share of agriculture in both employment and
GDP is tiny in the developed countries. However, its share in GDP and employment in
developing countries is quite substantial. In many developing countries, agriculture
accounts for more than a quarter of GDP. Its dominance in employment is even more
striking. In many developing countries, majority of male and female are employed in
agriculture.
Low Level of Urbanization -- Most of the people in developed countries live in urban
areas. On the other hand, the share of urban population in developing countries is much
smaller. Table 4 shows that the number and share of urban population for different
regions of the world in 2006. It shows that only 41 percent of population lived in urban
areas in less developed countries, while the share of urban population was 77 percent
in more developed countries. The share of urban population is particularly low in South
Central Asia and Sub-Saharan countries.
Figure 3 traces relationship between the level of urbanization and per-capita income. It
shows a strong positive relationship between the two. Higher the per-capita, larger is
the level of urbanization.
Dominance of Informal Sector – One very important feature of the developing
countries is the dominance of informal sector in economic activities. The main
characteristics of the informal sector jobs are: (i) low skill, (ii) low productivity, (iii) self-
employment (iv) lack of complementary inputs particularly capital, (v) small scale
measured in terms of sales, assets, employment etc., (vi) favored by recent migrants,
(vii) ease of entry for employers and workers, and (viii) lack of formal contractual
agreements.
Rural areas in developing countries are largely informal. Even in cities informal sector
in developing countries is quite big. Figure 4 shows the share of informal sector in
employment in different cities in 2000. It shows that in many cities majority of employed
workers are in informal sector. Due to the dominance of informal sector, most of the
workers are engaged in low productivity and low paying jobs. Dominance of the informal
sector is largely due to underdeveloped labor, financial, and other markets in developing
countries.
Underdeveloped Labor, Financial, and Other Markets -- Markets and institutions in
developing countries are quite different from markets and institutions in developing
countries. Markets and institutions are largely informal in developing countries.
Informality of these markets can largely be traced to informational and incentive
constraints and limits to contractual enforcement.
Asymmetric information arises when the market participants or agents do not have
identical information. Such situation can arise in variety of settings: a worker may know
more about his innate ability and skills than his employer, a seller may have better
information about the quality of good than a buyer, and an employer may not perfectly
observe effort exerted by his employee.
In the case of asymmetric information, markets may not develop and even if markets
develop may lead to inefficient outcomes. Thus, we may have missing markets or
imperfect markets. Asymmetric information provides incentive to better informed agents
to exploit their private information in a manner that adversely affects less informed
agents. Two types of asymmetric information problems are of particular relevance:
unobserved actions and unobserved types/quality
Unobserved Actions (Moral Hazard): Moral hazard problem arises when there is
asymmetric information with regard to actions. Basically, one side cannot observe the
actions of other side. For example, suppose an employer cannot (perfectly)
observe/monitor the effort exerted by the worker and there is no one to one relationship

between output and effort exerted. The lack of one to one relationship between output
and effort exerted prevents the employer from inferring amount of effort exerted by the
worker by observing output. This provides incentive to worker to put less effort. While
hiring worker and designing wage contract, the employer takes into account incentive of
the workers to shirk.
Unobserved Types or Quality (Adverse Selection): Adverse selection may arise
when there is asymmetric information regarding the quality or type of agents, products,
or commodities. Such asymmetric information also provides incentive to better
informed agents to exploit their private information in a manner that adversely affects
less informed agents. For example, suppose an employer cannot (perfectly) observe the
type or quality of workers. In this case, a worker of low quality has incentive to lie about
his quality and pretend to be of high quality. Similarly, lenders may not perfectly know
the type of borrowers (their ability, risk of default, riskiness of projects etc.). This
provides incentive to low quality borrowers to pretend as high quality borrowers.
Asymmetric Information, Markets, and Policy: Asymmetric information arises
because it is costly to obtain information. Informational imperfections impose transaction
cost on the working of markets and affect the nature of contracts and incentive
schemes. These imperfections to a large extent explain the existence of phenomena
such as the prevalence of share cropping, very high inequality of land holding, village
money lenders, micro-credit organization etc.
Design of contracts and incentive schemes also depends on the extent to which
contracts can be enforced. Developing countries may not have formal institutions (e.g.
law courts) or weak institutions or inadequate capacity to enforce contracts. Weak
enforcement limits the development of markets. For instance, formal insurance or credit
market may not develop due to weak enforcement.
Informational failures, difficulty in designing appropriate incentive system, and
enforcement problems limit the growth of formal institutions and arrangements in
developing countries. Informal institutions emerge as a substitute to formal institutions
to ameliorate these problems and facilitate trading.

Figure 1
Per-Capita Income in Selected Countries
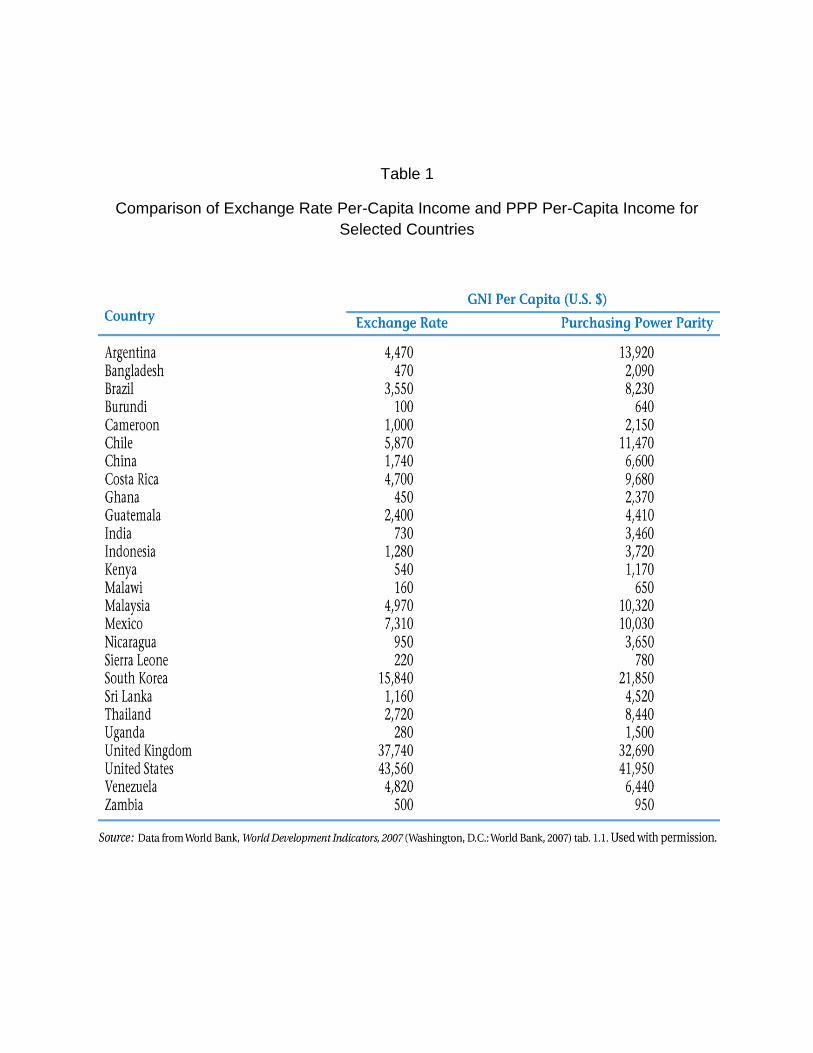
Table 1
Comparison of Exchange Rate Per-Capita Income and PPP Per-Capita Income for
Selected Countries

Table 2
Human Capital Indicators
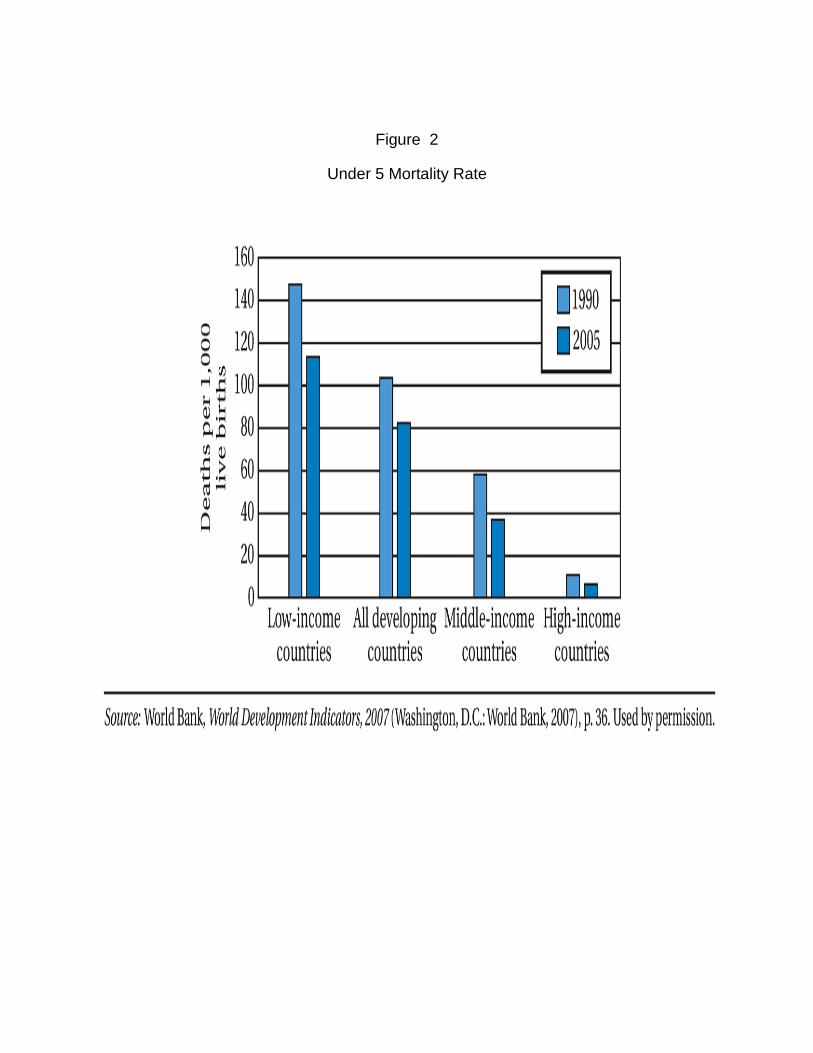
Figure 2
Under 5 Mortality Rate

Table 3
Primary School Enrollment and Student (Pupil)-Teacher Ratio
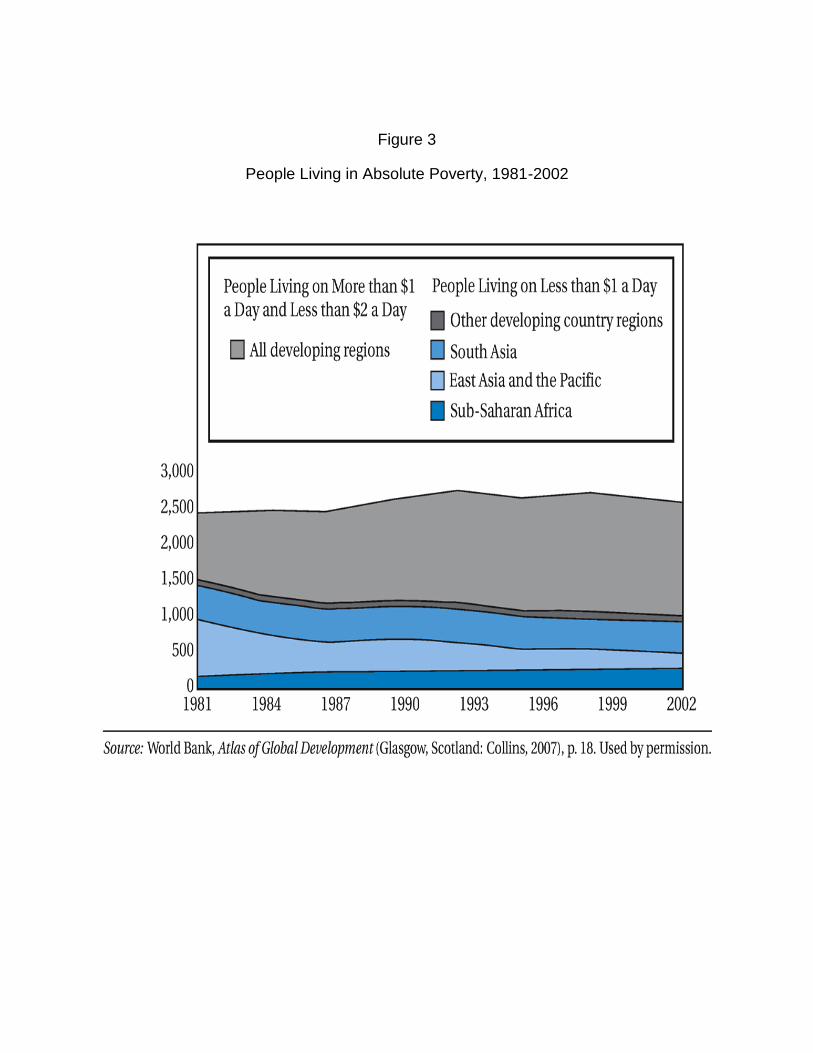
Figure 3
People Living in Absolute Poverty, 1981-2002

Table 4
Sectoral Distribution of GDP and Employment in Selected Countries , 2000-2005 (%)

Table 5
Number and Share of Urban Population
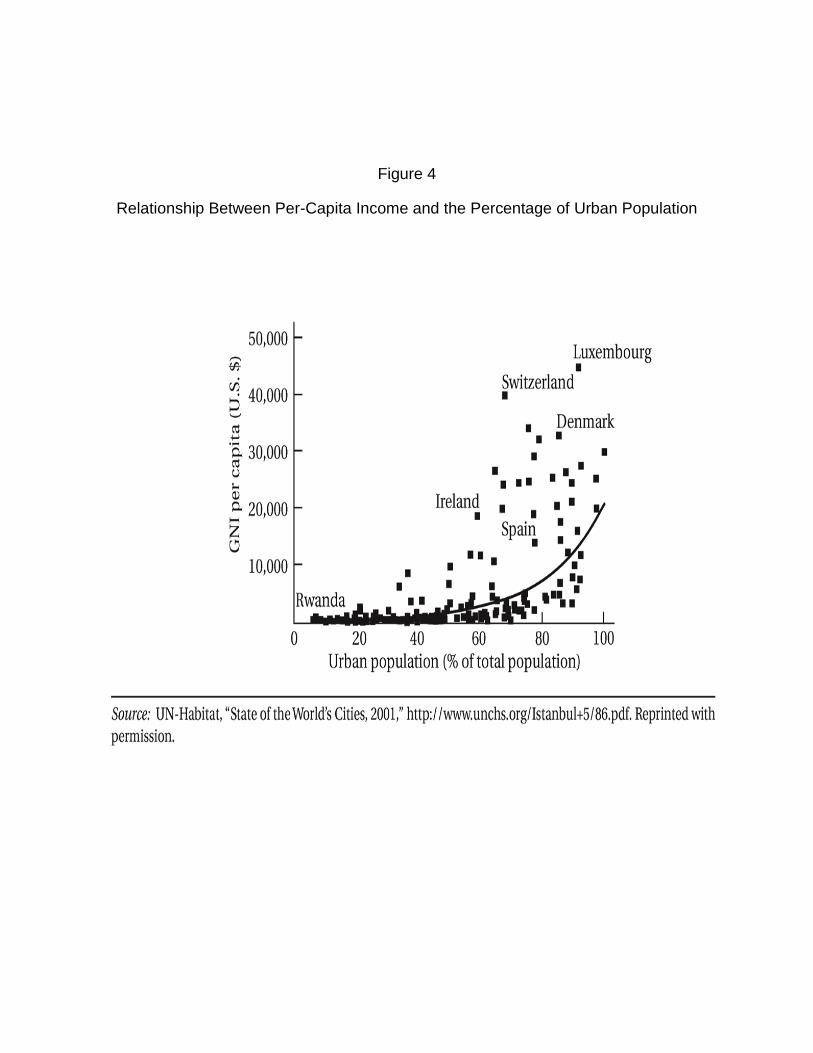
Figure 4
Relationship Between Per-Capita Income and the Percentage of Urban Population
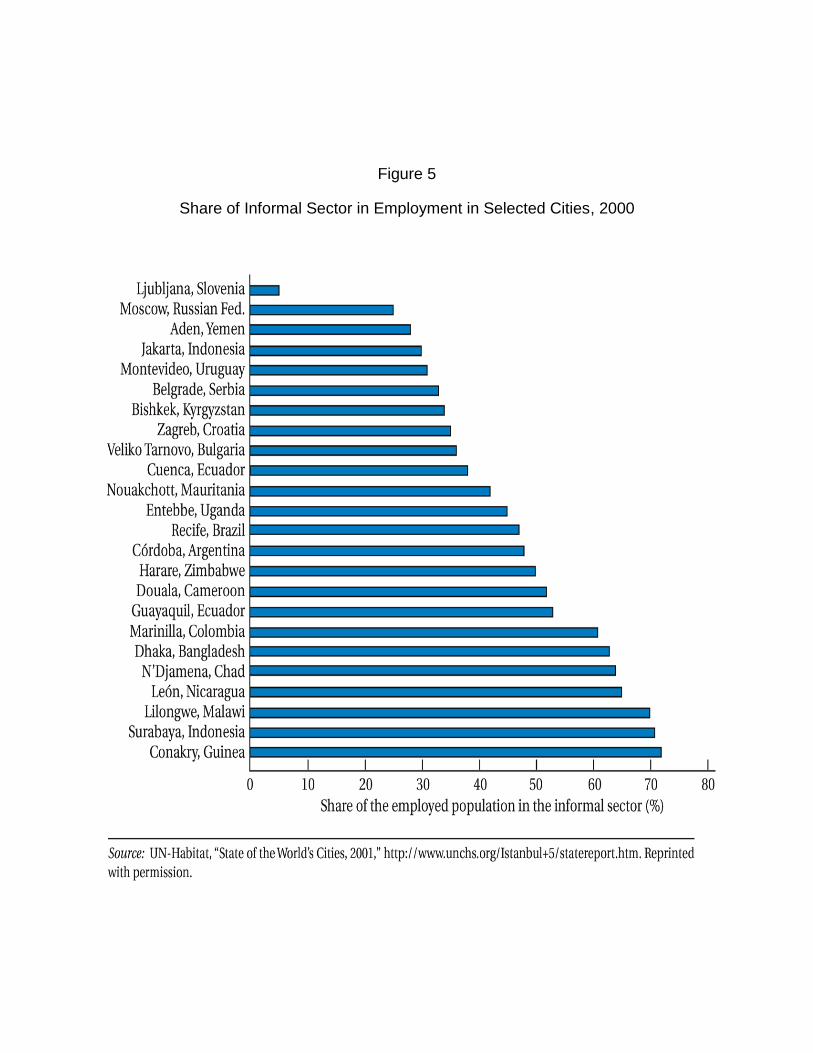
Figure 5
Share of Informal Sector in Employment in Selected Cities, 2000