Embed Size (px)
Citation preview

CHARACTERIZATION OF HYDROCARBON MICROSEEPAGES IN THE TUCANO BASIN, (BRAZIL) THROUGH HYPERSPECTRAL CLASSIFICATION AND NEURAL NETWORK ANALYSIS OF ADVANCED SPACEBORNE THERMAL EMISSION AND
REFLECTION RADIOMETER (ASTER) DATA
T. Lammogliaa , C. R. Souza Filhoa , R. A. Filhob
aGeosciences Institute, University of Campinas, PO Box 6152, 13083-970, Campinas, São Paulo, Brazil - [email protected]; [email protected]
bInstituto Nacional de Pesquisas Espaciais, PO Box 515, 12227-010, São José dos Campos, São Paulo, Brazil - [email protected].
KEY WORDS: Geology, Detection, GIS, Satellite, ASTER, Landsat ETM, Neural Network, Hydrocarbon Microseepage ABSTRACT: This study focus on the characterization of hydrocarbon microseepages in the northern Tucano Basin (Bahia State, Brazil), using geostatistical analysis of regional hydrocarbon geochemical data yielded from soil samples and digital processing of Enhanced Thematic plus (ETM+/Landsat7 satellite) and Advanced Spaceborne Thermal Emission and Reflection Radiometer imagery (ASTER/Terra satellite). A theoretical detection model was devised in which gas anomalies (seeps) indicated by hydrocarbon geochemistry should spatially match a number of surface expressions, such as bleaching of soils and rocks (i.e., reduction of Fe3+ to Fe2+ ), geobotanical markers and development of specific clays (kaolinite) and carbonates (siderite). These indirect evidences were employed for the application of remote sensing data and information extraction techniques in order to locate sites more favorable to host hydrocarbon seeps in the Tucano Basin. The ETM+ data was processed using the pseudo-ratio technique - an adaptation of the classic principal components analysis. The ASTER data was processed using the Spectral Angle Mapper and the Mixture Tuned Matched Filtering techniques, which are commonly used for the processing of hyperspectral data, though adapted here for these multispectral dataset. In addition, the ASTER data were classified using three different neural network systems (Fuzzy Clustering, Radial Basis Functional Link Network and Probabilistic Neural Network). The results showed that a number of the sites predicted using the applied detection model concurred with known geochemical anomalies. Other sites with similar characteristics but for which no geochemical data were available were also revealed. These sites are taken as new potential targets for the presence of seeps and oil reservoirs. The research demonstrated the excellent potential of ASTER data and spectral-spatial methodologies for low-cost, onshore exploration of hydrocarbons in Brazil.
1. INTRODUCTION
Remote sensing techniques can potentially be applied to onshore hydrocarbon detection at both regional and local scales. At the regional scale, a synoptic view allows for the evaluation of lineaments, rivers, and spectra-mineralogical correlations. This information can be integrated with other data, such as the geology, geochemical (e.g. gasometrical) and geophysical (gravimetric, magnetometric, and seismic) data. At the local or detailed scale, diagnostic spectral features associated with the effects of microseepage on mineralogy or vegetation can be targeted. Ideally, these should be associated with the structural features, lithologic contacts, and rivers. The Tonã area within the Tucano Norte Basin (Bahia – Brazil), was selected for study because of its known occurrences of hydrocarbon seeps. Previous studies in the area include the characterization of surface light hydrocarbons based on geochemistry (Babinski et. al. 1993), and reconnaissance remote sensing studies (Almeida-Filho 1999, 2001, 2002 a,b,c). A new generation of satellite sensors are now better suited for geological applications compared with sensors like Landsat Thematic Mapper, which were designed most specifically for vegetation studies. This new generation of geoscience sensors includes the multispectral ASTER (Advanced Spaceborne thermal Emission and Reflection Radiometer) system on board the Terra platform.
The objectives of this study are to evaluate the role of new generation multispectral satellite data for targeting hydrocarbon seepages in the Tucano Norte Basin. The work has both a regional perspective, as well as a local-scale perspective and uses geostatistical studies and neural network systems to explore for correlations with surface geochemistry (gasometry) leading to the development of a prediction model for hydrocarbon microseepage. 2. STUDY AREA: TUCANO BASIN, NORTHEASTERN
BRAZIL
The study area is located at the northern Tucano Basin, northeast Brazil (Figure 1). As a half-graben, this basin belongs to the Recôncavo-Tucano-Jatobá rift, formed on the early stages of the South Atlantic opening in the Early Cretaceous (Magnavita et al. 2003). The predominant lithologies in the study area belong to the Marizal Formation and Tona Sequence. The Marizal formation comprises white to red sandstones and subordinate calcareous and bituminous shales. The Tona Sequence, which lies conformably on the Marizal Formation, is approximately an 80m thick intercalation of sandstones and cherty limestones (Rolim 1984, Almeida-Filho 2002). The directions of the axis of the folds in the basin are variable, indicating complex phase of
1195
The International Archives of the Photogrammetry, Remote Sensing and Spatial Information Sciences. Vol. XXXVII. Part B8. Beijing 2008
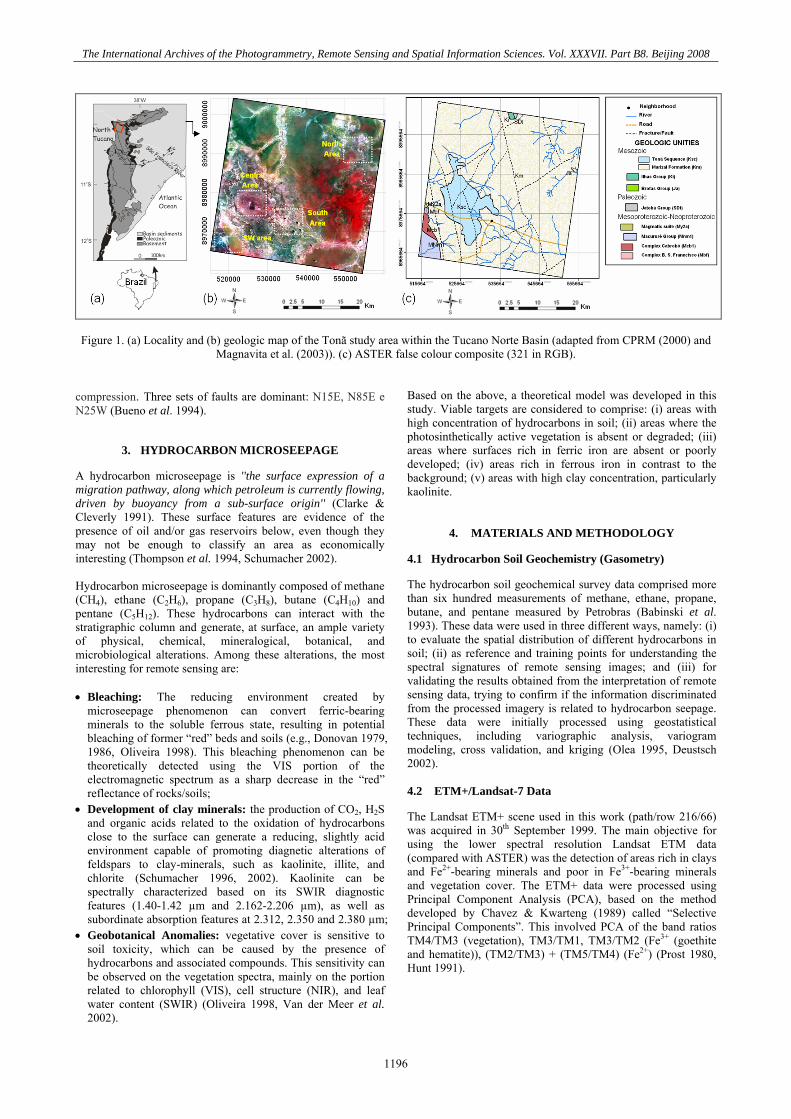
Figure 1. (a) Locality and (b) geologic map of the Tonã study area within the Tucano Norte Basin (adapted from CPRM (2000) and
Magnavita et al. (2003)). (c) ASTER false colour composite (321 in RGB).
compression. Three sets of faults are dominant: N15E, N85E e N25W (Bueno et al. 1994).
3. HYDROCARBON MICROSEEPAGE
A hydrocarbon microseepage is ''the surface expression of a migration pathway, along which petroleum is currently flowing, driven by buoyancy from a sub-surface origin'' (Clarke & Cleverly 1991). These surface features are evidence of the presence of oil and/or gas reservoirs below, even though they may not be enough to classify an area as economically interesting (Thompson et al. 1994, Schumacher 2002). Hydrocarbon microseepage is dominantly composed of methane (CH4), ethane (C2H6), propane (C3H8), butane (C4H10) and pentane (C5H12). These hydrocarbons can interact with the stratigraphic column and generate, at surface, an ample variety of physical, chemical, mineralogical, botanical, and microbiological alterations. Among these alterations, the most interesting for remote sensing are: • Bleaching: The reducing environment created by
microseepage phenomenon can convert ferric-bearing minerals to the soluble ferrous state, resulting in potential bleaching of former “red” beds and soils (e.g., Donovan 1979, 1986, Oliveira 1998). This bleaching phenomenon can be theoretically detected using the VIS portion of the electromagnetic spectrum as a sharp decrease in the “red” reflectance of rocks/soils;
• Development of clay minerals: the production of CO2, H2S and organic acids related to the oxidation of hydrocarbons close to the surface can generate a reducing, slightly acid environment capable of promoting diagnetic alterations of feldspars to clay-minerals, such as kaolinite, illite, and chlorite (Schumacher 1996, 2002). Kaolinite can be spectrally characterized based on its SWIR diagnostic features (1.40-1.42 µm and 2.162-2.206 µm), as well as subordinate absorption features at 2.312, 2.350 and 2.380 µm;
• Geobotanical Anomalies: vegetative cover is sensitive to soil toxicity, which can be caused by the presence of hydrocarbons and associated compounds. This sensitivity can be observed on the vegetation spectra, mainly on the portion related to chlorophyll (VIS), cell structure (NIR), and leaf water content (SWIR) (Oliveira 1998, Van der Meer et al. 2002).
Based on the above, a theoretical model was developed in this study. Viable targets are considered to comprise: (i) areas with high concentration of hydrocarbons in soil; (ii) areas where the photosinthetically active vegetation is absent or degraded; (iii) areas where surfaces rich in ferric iron are absent or poorly developed; (iv) areas rich in ferrous iron in contrast to the background; (v) areas with high clay concentration, particularly kaolinite.
4. MATERIALS AND METHODOLOGY
4.1
4.2
Hydrocarbon Soil Geochemistry (Gasometry)
The hydrocarbon soil geochemical survey data comprised more than six hundred measurements of methane, ethane, propane, butane, and pentane measured by Petrobras (Babinski et al. 1993). These data were used in three different ways, namely: (i) to evaluate the spatial distribution of different hydrocarbons in soil; (ii) as reference and training points for understanding the spectral signatures of remote sensing images; and (iii) for validating the results obtained from the interpretation of remote sensing data, trying to confirm if the information discriminated from the processed imagery is related to hydrocarbon seepage. These data were initially processed using geostatistical techniques, including variographic analysis, variogram modeling, cross validation, and kriging (Olea 1995, Deustsch 2002).
ETM+/Landsat-7 Data
The Landsat ETM+ scene used in this work (path/row 216/66) was acquired in 30th September 1999. The main objective for using the lower spectral resolution Landsat ETM data (compared with ASTER) was the detection of areas rich in clays and Fe2+-bearing minerals and poor in Fe3+-bearing minerals and vegetation cover. The ETM+ data were processed using Principal Component Analysis (PCA), based on the method developed by Chavez & Kwarteng (1989) called “Selective Principal Components”. This involved PCA of the band ratios TM4/TM3 (vegetation), TM3/TM1, TM3/TM2 (Fe3+ (goethite and hematite)), (TM2/TM3) + (TM5/TM4) (Fe2+) (Prost 1980, Hunt 1991).
1196

The International Archives of the Photogrammetry, Remote Sensing and Spatial Information Sciences. Vol. XXXVII. Part B8. Beijing 2008
4.3
5.1
ASTER/Terra Data
The ASTER Level 1B (Abrams et al 2002) were obtained in 14th May 2006. The nine “reflective” ASTER bands (numbered 1-9) were data were all resampled to 15 into a single image file. The following processing steps were then applied to the data:
Pre-processing and Hyperspectral Classification of ASTER data. A cross-talk correction was applied to all SWIR bands pre-processed to the Level 1B data (ERSDAC 2001). The atmospheric correction was executed using the software Atmospheric Correction Now (ACORN). This process included the calculation of radiant transference based on the MODTRAN-4 model (Imspec 2001), which reduced the data to surface reflectance. A mask for removing vegetation and clouds was also applied. The hyperspectral classification was done using different endmembers (field or image-derived) and executed based on a semi-automatic procedure. This procedure included first the Minimum Noise Fraction (MNF) and Pixel Purity Index (PPI) techniques which were applied ASTER’s “reflected” bands 1 to 9 bands. Then the classification was preceded using two algorithms: the Spectral Angle Mapper (SAM) (Kruse et al. 1993) and the Mixture Tuned Matched Filtering (MTMF) (Boardman 1998).
ASTER Data Classification by Neural Networks. Digital classification of ASTER data by neural networks is a practical tool for building favorability maps of economic minerals (e.g. Nóbrega et al 2003). In addition, it is useful for hydrocarbon seepage detection, since it aims to recognize hidden patterns in the scene pixels based on the available bands and spatial resolutions. The neural network processing can be applied directly to Level 1B ASTER data or to the reflectance data. In this research, the data was processed through the GeoXplore software (Looney & Yu 2000) based on three systems: Fuzzy Clustering (unsupervised), Radial Basis Functional Link Network (RBFLN) and Probabilistic Neural Network (PNN) (supervised). Following several training steps using the available gasometrical data as a control, these three systems were then used to process similar data to generate predictions as to which class/s they belonged. It is relevant to highlight that before training the neural network, the gas anomalies and not-anomalies were tuned into a fuzzy set using the “Large” and “Small” pertinence functions, respectively (Looney & Yu 2000). The neural networks yield different results which may differ for each of the study sites approached here (Figure 1B). Here, results from these three networks were compared, as well as the results obtained using pre-processed and processed ASTER data.
5. RESULTS & DISCUSSION
Kriging of Gasometrical data
The kriging results of the soil gasometrical point data (ethane+propane+butane+pentane) were merged with the geologic map (Figure 2a) to reveal two large anomalies, here coined, the “north anomaly” and the “south anomaly”. Two additional, but less expressive anomalies, were also enhanced - one on the top of the Tonã Sequence (central area) and another on the southeast portion of the area. Except for the anomaly at the central area, all the anomalies are associated to lithologic contacts or rivers (usually at the headwaters). Soil gas concentration was interpolated individually in order to evaluate the spatial distribution of each hydrocarbon in the area. Maps of the lighter gases (i.e. ethane (C2H10), propane (C3H8), and butane (C4H6)) were combined in a false color composite and draped over an ASTER band 1 imagery (Figure 2b). The
northeastern anomalies, which are composed mostly of ethane and propane, are here taken as prime evidences of the position of hydrocarbon reservoirs, since such lighter gases can migrate as amorphous plumes.
(a) (b)
Figure 2. (a) Kriging results of gasometrical data (C2-C5
concentration) merged with the geologic map (Figure 1). Note the anomalies (lighter colors) related to rivers and lithologic
contacts. (b) False color composite of Ethane (C2H10), Propane (C3H8) and butane (C4H6) draped over ASTER band 1 imagery.
Note singular anomalies of lighter and heavier gases. 5.2
5.3
ETM+/LANDSAT-7 Data Processing
The Landsat ETM+ scene was processed through Selective PCA to enhance surfaces rich in ferric and ferrous iron, clays and vegetation. The results (Figure 3) illustrates a consistent correlation among C2-C5 anomalies and areas rich in ferrous iron and clays, but lacking in vegetation, a result that agrees with the theoretical model here proposed for the detection of seeps on-shore.
ASTER/Terra Data Processing
Hyperespectral Processing. Although ETM+ data have enough spectral resolution to allow the discrimination between surfaces generically distinct in composition, it is difficult to identify specific minerals at the surface using these data. Kaolinite minerals are particularly interesting for microssepage detection and they can be mapped using ASTER’s 6 SWIR bands (e.g., Ducart et al. 2006). In this study, the processing for targeting kaolinite was based on algorithms usually employed for hyperspectral data classification (Boardman and Kruse, 1994; Boardman, 1998), here adapted for ASTER reflectance data.
Figure 3. PCA applied to ETM+ data for the central area (Figure 1B). (a) false colour composite showing surfaces rich in
ferrous iron (red) and ferric iron – goethithe (green) and hematite (blue); (b) density of photosynthetically active
vegetation; (c) clays and/or carbonate abundance.
1197

The International Archives of the Photogrammetry, Remote Sensing and Spatial Information Sciences. Vol. XXXVII. Part B8. Beijing 2008
The reference spectra used for such classification were gathered from soil samples collected in the center of the hydrocarbon anomaly observed in the south area (Figure 2b). Spectral measurements were carried out under laboratory conditions using a FieldSpec-Full Resolution spectroradiometer (Analytical Spectral Devices). These spectra were compared to the USGS spectral library and showed diagnostic features of kaolinite in the SWIR range. For the other sites, a different experiment was performed. Reference (reflectance) spectra were collected directly from the sites observed in the ASTER imagery as high concentrations (≥ 30 ppm) of C2-C5 in the soil. These imagery-derived spectra are similar to the spectra derived from field samples, as well as to the USGS kaolinite spectra. Based on these reference pixels (endmembers), all sites were classified using the Spectral Angle Mapper (SAM) and the Mixture Tuned Matched Filtering (MNMF) techniques. The MTMF classification revealed superior results against SAM classification, and were mostly coincident to the gasometrical anomalies (Figure 4).
Figure 4. MTMF results for the (a) north and (b) central anomalies based on endmembers derived from the ASTER imagery. (c) MTMF result for the south anomaly based on
endmembers yielded from lab spectra of field samples.
Neural Network Classification. The favorability maps obtained using the Probabilistic Neural Network (PNN) and the Radial Basis Functional Link Network (RBFLN) applied to ASTER data showed an improved classification of sites containing gas anomalies, in contrast to the inferior results provided by Fuzzy Clustering. The experiments using comparative classifications based on Level 1B and reflectance data showed the latter to be advantageous. The neural network processing indicated that the areas classified as strongly favorable to hydrocarbon accumulation are related to the rivers and lithologic contacts, as previously pointed by the geostatistical analysis (Figure 5). It also confirmed the relationship between microseepage and river’s headwaters. In the southwest area, there are two important geologic features: the Sainté Fault and the contact between the Tucano Basin and basement rocks. Both of them were indicated as favorable sites to hydrocarbon accumulation by gasometry. Similarly, the neural network classification mapped only the Tucano Basin side of this contact. For the south area, the anomaly earlier described by the kriging technique and also by Almeida-Filho et al. (2002a) was detected by the neural network classification.
6. CONCLUSIONS
The geostatitics (kriging) of the hydrocarbon geochemical data proved very efficient and provided an easy understanding of the spatial distribution of microseepages over the Tucano Basin. The kriging results revealed the relation between the gas anomalies with the structural lineaments, lithologic contacts, and rivers. These results were used as guides for the subsequent digital image processing steps.
Figure 5. Hydrocarbon favorability by PNN ((a) and (b)) and by RBFLN ((c) e (d)) for the central, southwest, south and north
sub-areas.
The results yielded thorough Principal Components Analysis of the ETM+/Landsat was consistent with the known hydrocarbon microseepages based on a hypothetical detection model. That is, all of the microseepage sites show an absence of green vegetation and ferric iron minerals and the presence of ferrous iron minerals and of clays and/or carbonates. The hyperspectral classification of the ASTER data was successfully applied to target areas rich in kaolinite – a mineral that can be used as a potential vector to oil/gas accumulations. The best classifications where obtained with the MTMF algorithm using known endmembers. These classifications where more restrictive, but included the gas anomalies. The spectro-spatial classification of ASTER data - a pioneer approach using the GeoXplore software for this type of application - was implemented using three different artificial neural networks. The results, especially those obtained with the Probabilistic Neural Network (PNN) and Radial Basis Functional Link Network (RBFLN) systems, were robust and comparable to the hyperspectral classification results. The neural network processing included, mostly, the anomalous points from the geochemistry data and excluded those points known as not anomalous. These classifications showed, even in small areas, tight correlation of the high hydrocarbon favorability with the structural features and rivers, as previously indicated by kriging. In addition, these classifications revealed potential targets for microssepage even without surface geochemical data. The use of neural network through the GeoXplore software proved to be an additional, rapid, and efficient methodology for characterization of features in ASTER/Terra images related to hydrocarbon microseepages.
1198
The International Archives of the Photogrammetry, Remote Sensing and Spatial Information Sciences. Vol. XXXVII. Part B8. Beijing 2008
REFERENCES
Abrams, M., Hook S.J., Ramachandran B. 2002. ASTER User Handbook - Version 2, Jet Propulsion Laboratory, 135 p.
Almeida-Filho, R., Miranda, F.P., Yamakawa, T. 1999. Remote detection of a tonal anomaly in an area of hydrocarbon microseepage, Tucano basin, north-eastern Brazil. Int. J. Rem. Sens., 20: 2683-2688.
Almeida-Filho, R. 2001. Processamento Digital de Imagens Landsat-TM na Detecção de Áreas de Microexsudação de Hidrocarbonetos, Região da Serra do Tonã, Bahia. Anais X SBSR, Foz de Iguaçu, 21-26 april 2001, INPE, p. 235-242.
Almeida-Filho, R., Miranda F.P., Yamakawa T., Bueno G.V., Moreira F.R., Camargo E.G., Bentz C.M. 2002a. Data integration for a geologic model of hydrocarbon microseepage areas in the Tonã Plateau region, North Tucano basin, Brazil. Can. J. Rem. Sens., 28 (1): 96–107.
Almeida-Filho, R. 2002b. Remote detection of hydrocarbon microseepage areas in the Serra do Tonã region, Tucano basin, Brazil. Can. J. Rem Sens, 28 (6): 750–757.
Almeida-Filho, R., Miranda F.P., Galvão L.S., Freitas C.C. 2002c. Terrain chacteristics of a tonal anomaly remotely detected in an area of hydrocarbon microseepage, Tucano Basin, north-eastern Brazil. Int. J. Rem Sens, 23 (18): 3893-3898.
Babinski, N. A., Santos, R. C. R., Bueno, G. V., Guimarães, M. F., Freire A.F.M., Gouveia, C.A.S., Almeida, M.F., Volpan, A.G., 1993. Prospecção geoquímica de superfície (gasometria e microbiologia de petróleo) na bacia de Tucano Norte. CENPES/SINTEP/MCT, 650–15.106. Relatório Não Publicado, 15 p.
Boardman, J.W. & Kruse, F.A. 1994. Automated spectral analysis: A geologic example using AVIRIS data, north Grapevine Mountains, Nevada. In: ERIM Tenth Thematic Conference on Geologic Remote Sensing, 10. (Ann Arbor, Michigan: Environmental Research Institute of Michigan) pp. 407-418.
Boardman, J.W., 1998. Leveraging the High Dimensionality of AVIRIS Data for Improved Sub-Pixel Target Unmixing and Rejection of False Positives Mixture Tuned Matched Filtering. AVIRIS Proceeding, JPL Publication, pp.: 97-21.
Bueno, G.V., Peraro, A.A., Sarnelli, C., Marques, E.J.J., Civatti, F.V., Costa, I.P., Guimarães M.F., Makino, R.K., 1994. Projeto Tucano – Petrobras E&P-BA, Relatório não publicado, 124 pp.
Chavez, P.S.Jr. & Kwarteng, A.Y., 1989. Selective Principal Component Analysis Photogram. Phot Eng Rem Sens, 55 (9): 1163-1169.
Clarke, R.H. & Cleverly, R.W., 1991. Petroleum seepage and post accumulation migration. In: W. A. England e A. J. Fleet, (eds.) Petroleum Migration. Geol. Soc. Sp. Publ., Geological Society of London, 59, pp.: 265-271.
CPRM & Brazilian Geological Survey. 2000. Carta Geológica. Escala 1:500000.
Deutsch, C.V., 2002. Geostatistical Reservoir Modeling in Applied Geostatistical Series. Oxford Univ. Press, 376 pp.
Donovan, T.J., Forgey, R.L. & Roberts, A A. 1979. Aeromagnetic detection of diagenetic magnetite over oil field. The AAPG Bulletin, 63: 245-248.
Donovan, T.J., O'Brien, D.P., Bryan, J.G., Cunningham, K.I., 1986. Near surface magnetic indicators of buried hydrocarbons: aeromagnetic detection and separation of spurious signals. 5th Thematic Conference Remote Sensing for Exploration Geology. Proceedings, vol. 1, pp.: 219-232.
Ducart, D.F. ; Crosta, A.P. ; Souza Filho, C. R., Coniglio, J. 2006. Alteration Mineralogy at the Cerro La Mina Epithermal Prospect, Patagonia, Argentina: Field Mapping, Short-Wave Infrared Spectroscopy, and ASTER Images. Economic Geology and the Bulletin of the Society of Economic Geologists, v. 101, p. 1010-1025.
Earth remote sensing data analysis center (ERSDAC). 2001. The Crosstalk Correction Software: User’s Guide. Mitsubishi Space Software Co. Ltd., 17 pp.
Hunt, G.A. 1991. Geological applications of reflected and emitted multispectral data over lateritised Archean terrain in Western Australia. PhD thesis, Open University, Milton Keynes, United Kingdom.
Imspec, 2001. ACORN User’s Guide. Analytical Imaging and Geophysics. Boulder, CO, USA, 64 p.
Kruse, F. A., Lefkoff A. B., Boardman J. B., Heidebrecht K. B., Shapiro A. T., Barloon, P. J., e Goetz A. F. H. 1993. The Spectral Image Processing System (SIPS) - Interactive Visualization and Analysis of Imaging spectrometer Data. Remote Sensing of Environment, 44:145-163.
Looney, C.G. & Yu H., 2000. Special Software Development for Neural Network and Fuzzy Clustering Analysis in Geological Information Systems. Geological Survey of Canada, 34 p.
Magnavita, L, Destro N., Carvalho, M. S. S., Milhomen P. S., Souza-Lima W. 2003. Bacia de Tucano. Fundação paleontológica PHOENIX. Ano 5. n52. Disponível em http://www.phoenix.org.br/Phoenix52_Abr03.htm. Consultado em 16/05/06.
Nóbrega, R.P. & Souza-Filho, C.R. 2003. Análise Espacial Guiada Pelos Dados (Data-Driven): O uso de Redes Neurais para Avaliação do Potencial Poli-Minerálico na região Centro-Leste da Bahia. Rev. Bras. de Geociências, 33(2-Suplemento): 111-120.
Olea, R.A. 1995. Fundamentals of Semivarigram Estimation, Modeling, and Usage In Chambers R. L., Yarus J. M. (eds.) Stochastic Modeling and Geostatistics Principles, Methods and Case Studies. AAPG Computer Application in Geology, No 3, pp.: 27-35.
Oliveira, W.J. 1998. Caracterização das emanações gasosas de hidrocarbonetos na região do Remanso do Fogo (MG), através do uso integrado de sensoriamento remoto, geoquímica, geofísica, geologia estrutural e espectrometria de reflectância. Dissertação de Doutorado, Instituto de Geociências, Universidade Estadual de Campinas-SP, 239 p.
Prost, G. 1980. Alteration mapping with airbone multiespectral scanners. Economic Geology, 75:894-906.
Rolim, J. L. 1984. Estudo da Seqüência Clástica e Carbonática da Serra do Tonã Macururé, Estado da Bahia. Dissertação de
1199

The International Archives of the Photogrammetry, Remote Sensing and Spatial Information Sciences. Vol. XXXVII. Part B8. Beijing 2008
Doutorado, Instituto de Geociências, Univ. Fed. do Rio Grande do Sul, 155 p.
Schumacher, D., 1996. Hydrocarbon-induced alteration of soils and sediments, In D. Schumacher e M. A. Abrams (eds.) Hydrocarbon Migration and its Near Surface Expression. AAPG Memoir 66, pp.: 71–89.
Schumacher, D., 2002. Hydrocarbons Geochemical Exploration for Petroleum In D. Schumacher e M.A. Abrams (eds) Hydrocarbon migration and its near-surface expression. AAPG, Memoir 66, pp.:184-204.
Thompson, C.K, Saunders, D.F., Burson, K.R. 1994. Model advanced for hydrocarbon microseepage, related alterations. Oil & Gas Journal. ABI/INFORM Global, 84: 95-99.
Van der Meer, F., Van Dijk, P., Van der Werff H., Yang, H., 2002. Remote Sensing and Petroleum Seepage: a review and case study. Terra Nova, 14 (1): 1-17.
ACKNOWLEDGEMENTS
The authors are grateful to PETROBRAS for providing the gasometrical data, Sérgio Sacani and Armando Zaupa for helping with statistics, and CNPq for the research grants.
1200