Embed Size (px)
Citation preview
CHARACTERIZATION OF PHOTOTOXICITY REACTIONS IN HUMAN AND ANIMAL SKIN
MODELS
Inauguraldissertation
zur
Erlangung der Würde eines Doktors der Philosophie
vorgelegt der
Philosophisch-Naturwissenschaftlichen Fakultät der Universität Basel
Von
Stéphanie Boudon
aus Frankreich
Basel, 2013
Original document stored on the publication server of the University of Basel edoc.unibas.ch
This work is licenced under the agreement „Attribution Non-Commercial No Derivatives – 2.5 Switzerland“. The complete text may be viewed here:
creativecommons.org/licenses/by-nc-nd/2.5/ch/deed.en
Genehmigt von der Philosophisch-Naturwissenschaftlichen Fakultät auf Antrag von Prof. Dr. Alex Odermatt Dr. Daniel Bauer Prof. Dr. med. Stephan Krähenbühl Basel, den 10 Dezember 2013.
Prof. Dr. Jörg Schibler Dekan


To my parents


Acknowledgements
I wish to express my gratitude to Dr. Daniel Bauer for giving me the opportunity to prepare my thesis at Novartis Institute for BioMedical Research and for supervising me during this thesis. I am very grateful to Prof. Alex Odermatt for accepting to be the Faculty responsible, for sharing with me his enthusiasm for Science and for his valuable help for the successful conclusion of my PhD. I would like to extend my gratitude to Prof. Stephan Krähenbühl who kindly accepted to review this thesis. My general thanks to Novartis Pharma AG, University of Basel and the ProDoc program for their financial and nonfinancial support. My gratitude goes to Dr. Ulla Plappert for her support throughout my PhD. Thank you for your excellent support, your positive energy, and encouragement. My gratitude goes to Martin Schneider. I was honored to work with you during my thesis and I am grateful for your continuous support. I would like to thank Brendan Prideaux, Gregory Morandi and Dr. Markus Stoeckli from the Analytical Sciences Department at Novartis Institute for BioMedical Research for the Mass Spectrometry Imaging results. I want to thank the PreClinical Safety Department at Novartis Institute for BioMedical Research. Special thanks to Monika Spielmann, Christine Blumer, Nathalie Noll, Deborah Garcia, René Schaffner, Brigitte Mueller, Philippe Scheubel and Catherine Schiltz for sharing their valuable knowledge and expertise, and above all, for the many cheerful laughers. I will end by deeply thanking my family and dear friends in Switzerland and France. Their continuous support throughout all these years made this thesis not only an academic achievement but a rewarding and meaningful Life’s experience. I am deeply grateful to Joshua Blumer for his wholehearted support, encouragement, affection and love.

S u m m a r y | IX
Summary
Phototoxicity is a relatively common phenomenon and is an adverse effect of some systemic
drugs. A large number of pharmaceutical drug substances are known to carry the potential to
elicit a phototoxic response (Moore 2002, Ferguson 2002). Reported cases of phototoxic
responses may account for 5 to 10 % of recorded cutaneous adverse drug reactions (Selvaag
1997). As these abnormal reactions seriously limit or exclude the usage of certain drugs, it is
essential to identify such liabilities early in development. Therefore, photosafety of drug
candidate molecules needs to be evaluated (ICH M3 R2, 2009). Often this follows a step-wise
process starting with physicochemical properties (light absorption), followed by in vitro, in vivo
and/or clinical testing as suggested by each successive study. A key principle in such a tiered
testing strategy is that a negative result obtained in a generally accepted and highly sensitive
assay does usually not warrant further testing.
In this work, we were interested in comparing the results obtained in nonclinical models (in vitro
and in vivo experiments) with the clinical signs observed in human of well-known
photosensitizer. The results of our investigation of phototoxicity mechanisms are presented in
three research papers published in (or submitted to) peer reviewed journals representing the core
of this thesis.
Starting from an established standard model we used the modified oral UV-Local Lymph Node
Assay (UV-LLNA or photo-LLNA) in Balb/c mice. We demonstrated the performance of this
optimized modified murine local lymph node assay, adapted for phototoxicity assessment of
S u m m a r y | X
systemically applied compounds. Several clinically phototoxic reference compounds were tested
in mice using a sun light simulator to establish time- and dose-dependent profiles.
In order to further investigate the phototoxic reaction, we decided to focus on one molecule. We
took the example of vemurafenib, a B-Raf kinase inhibitor for the treatment of patients with
unresectable or metastatic melanoma carrying the BRAFV600E mutation, commercially
available since 2011. This drug was selected because the phototoxicity of this drug was
discarded in preclinical testing but has been reported in clinical trial. Therefore, it became a
fundamental question to understand this discrepancy. The aforementioned mouse oral UV-Local
Lymph Node Assay, was used to investigate the impact of formulations, dose levels, duration of
treatment and timing of irradiation. The initial studies performed as part of the non-clinical
development of vemurafenib with hairless rats was compared to the current study in mice.
Duration of treatment and exposure to both vemurafenib and the formal UVA dose (limited to
350 to 400 nm) was clearly exceeding the conditions we have used in our studies in mice. The
most apparent difference was the spectral range of the irradiation light source (350 to 400 nm
versus 320 to 700 nm). Since vemurafenib does not absorb sufficiently light above 350 nm, this
difference alone can easily explain the negative earlier study result in hairless rats.
To enhance our molecular understanding of phototoxicity mechanisms, an imaging technique
based on matrix-assisted laser desorption/ionization mass spectrometric (MALDI-MS) was
applied to samples from mouse skin and from a human 3D skin model. Using sparfloxacin as a
model compound, concentration-dependent and irradiation-dependent effects could be observed
in vitro. Furthermore, in the aforementioned established in vivo phototoxicity model, time- and
S u m m a r y | XI
irradiation dependent exposure to sparfloxacin in skin samples from mouse ears following oral
treatment were demonstrated.
Taken together, these results illustrate important lessons regarding photosafety testing. First of
all, they demonstrate that the modified murine UV-LLNA is suitable to support preclinical
photosafety assessment of systemically applied drug candidates. Furthermore, they highlight the
impact of carefully designed in vivo phototoxicity studies. It is apparent that duration of
treatment, timing of irradiation and appropriate irradiation conditions are key parameters to
ensure an appropriate sensitivity.
References Ferguson, J. 2002. Photosensitivity due to drugs. Photodermatol. Photoimmunol. Photomed. 18(5):262-9.
ICH, M3 (R2). 2009. Guidance on nonclinical safety studies for the conduct of human clinical trials and
marketing authorization of pharmaceuticals.
http://www.ich.org/fileadmin/Public_Web_Site/ICH_Products/Guidelines/Multidisciplinary/M3_R
2/Step4/M3_R2__Guideline.pdf.
Moore, E.M. 2002. Drug-induced cutaneous photosensitivity. Drug Saf. 25: 345-372.
Selvaag , E. 1997. Clinical drug photosensitivity – A retrospective analysis of reports to the Norwegian
Adverse Drug Reactions Committee from the years 1970-1994. Photodermatol. Photoimmunol.
Photomed. 13: 21-23.

S u m m a r y | XII
T a b l e o f C o n t e n t | XIII
Table of Contents
Summary………………………………………………………………………..IX
Abbreviations………………………………………………………………XVII
1. Introduction……………………………………………………………….1 1.1. Photosafety evaluation of pharmaceuticals……...………………………………………2
1.1.1. Photochemical properties………………………………………………………………..3
1.1.2. Tissue Distribution/Pharmacokinetics…………………………………………………..3
1.1.3. Nonclinical photosafety testing………………………………………………………….4
1.2. Scope of the thesis……………………………………………………………………….6
References……………………………………………………………………………………….8
2. Integrated preclinical photosafety testing strategy for systemically
applied pharmaceuticals………………………………………………..13 Abstract…………………………………………………………………………………………14
2.1. Introduction…………………………………………………………………………….15
2.2. Materials and Methods…………………………………………………………………17
2.2.1. UV/visible light absorption spectra……………………………………………………17
2.2.2. In vitro 3T3 NRU phototoxicity test…………………………………………………...17
2.2.3. Mice…………………………………………………………………………………….19
2.2.4. Treatment of mice………………………………………………………………………19
2.2.5. Exposure of mice to simulated sun light………………………………………………20
2.2.6. Erythema scoring………………………………………………………………………21
2.2.7. Determination of ear biopsy weights and auricular LN weights and cell counts………21
2.2.8. Histopathology of retina……………………………………………………………......22
2.2.9. Statistical analysis……………………………………………………………………...22
2.3. Results …………………………………………………………………………………23
T a b l e o f C o n t e n t | XIV
2.3.1. Clinically phototoxic reference compounds in the modified murine oral (gavage) photo-
LLNA…………………………………………………………………………………23
2.3.2. Drug candidates in the modified murine systemic photo-LLNA………………………31
2.4. Discussion………………………………………………………………………………41
2.5. Conclusion……………………………………………………………………………...45
Acknowledgements……………………………………………………………………………46
References……………………………………………………………………………46
3. Characterization of Vemurafenib Phototoxicity in a Mouse
Model……………………………………………………………………51 Abstract...………………………………………………………………………………….….52
3.1. Introduction…………………………………………………………………………..53
3.2. Material and methods…………………………………………………………………55
3.2.1. Test compounds and positive and negative control items ……………………………55
3.2.2. UV-visible light absorption spectra…………………………………………………...56
3.2.3. In vitro 3T3 neutral red uptake phototoxicity test………………………………..56
3.2.4. Animal experiments………………………………………………………………....58
3.2.4.1. Animal husbandry………………………………………………………………..58
3.2.4.2. Irradiation conditions for animal experiments………………………………………59
3.2.4.3. Treatment protocols and endpoints…………………………………………………59
3.2.4.3.1. Oral UV-Local Lymph Node Assay in BALB/c mice……………………………59
3.2.4.3.2. Time-profile of erythema and edema formation after irradiation…………………63
3.2.4.3.3. Pharmacokinetic profile of vemurafenib in BALB/c mice……………………… … . .6 4
3.2.4.4. Statistical analysis ……………………………………………………………………64
3.3. Results………………………………………………………………………………65
3.3.1. UV-visible light absorption spectra…………………………………………………...65
3.3.2. In vitro phototoxicity test results……………………………………………………66
3.3.3. Oral UV-Local Lymph Node Assay…………………………………………………67
3.3.4. Time-profile of erythema and edema formation after irradiation………………. ……69
3.3.5. Pharmacokinetic Profile………………………………………………………………70
T a b l e o f C o n t e n t | XV
3.4. Discussion and Conclusion…………………………………………………………71
Acknoledgements………………………………………………………………………………...74
Funding…………………………………………………………………….................................74
References…………….………………………………………………………………………….74
4. Evaluation of Sparfloxacin Phototoxicity with Mass Spectrometry
Imaging…………………………………………………………………………77 Abstract…………………………………………………………………………………………79
4.1. Introduction…………………………………………………………………………….80
4.2. Materials and methods………………………………………………………………….81
4.2.1. Human 3D skin model………………………………………………………………….81
4.2.2. Animal experiments………………………………………………………………. ……82
4.2.2.1. Animal husbandry………………………………………………………………………82
4.2.2.3. Treatment protocols……………………………………………………………….……83
4.2.2.4. Statistical analysis………………………………………………………………………84
4.2.3. Mass spectrometry imaging……………………………………………………….……85
4.2.3.1. Preparation of tissue samples for MALDI-MSI………………………………………85
4.2.3.2. MALDI-MSI analysis…………………………………………………………………..86
4.3. Results and discussion………………………………………………………………….87
4.3.1. Localization and quantification of sparfloxacin in vitro………………………………87
4.3.2. Localization and quantification of sparfloxacin as part of an in vivo phototoxicity
study in mice ……………………………………………………………………………87
4.4. Conclusion……………………………………………………………………………93
Acknoledgements………………………………………………………………………………93
References…………….………………………………………………………………………….93
5. Conclusion and Perspectives……………………………………………..95

T a b l e o f C o n t e n t | XVI
A b b r e v i a t i o n s | XVII
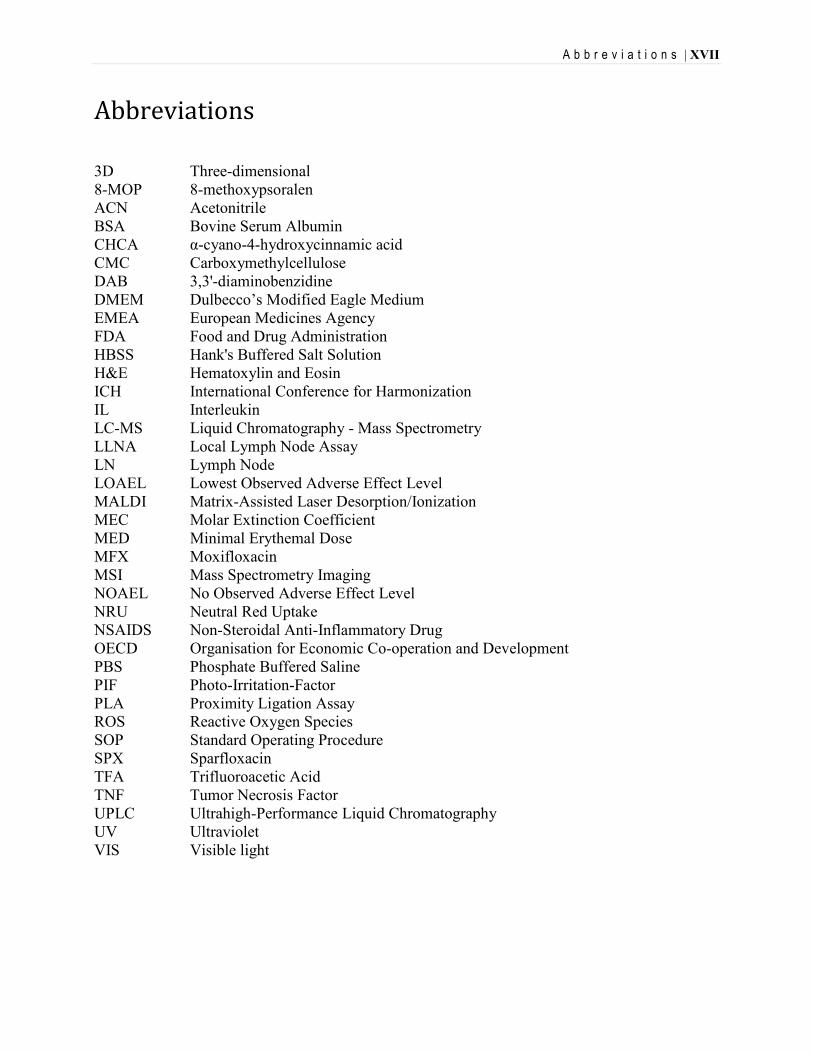
Abbreviations 3D Three-dimensional 8-MOP 8-methoxypsoralen ACN Acetonitrile BSA Bovine Serum Albumin CHCA α-cyano-4-hydroxycinnamic acid CMC Carboxymethylcellulose DAB 3,3'-diaminobenzidine DMEM Dulbecco’s Modified Eagle Medium EMEA European Medicines Agency FDA Food and Drug Administration HBSS Hank's Buffered Salt Solution H&E Hematoxylin and Eosin ICH International Conference for Harmonization IL Interleukin LC-MS Liquid Chromatography - Mass Spectrometry LLNA Local Lymph Node Assay LN Lymph Node LOAEL Lowest Observed Adverse Effect Level MALDI Matrix-Assisted Laser Desorption/Ionization MEC Molar Extinction Coefficient MED Minimal Erythemal Dose MFX Moxifloxacin MSI Mass Spectrometry Imaging NOAEL No Observed Adverse Effect Level NRU Neutral Red Uptake NSAIDS Non-Steroidal Anti-Inflammatory Drug OECD Organisation for Economic Co-operation and Development PBS Phosphate Buffered Saline PIF Photo-Irritation-Factor PLA Proximity Ligation Assay ROS Reactive Oxygen Species SOP Standard Operating Procedure SPX Sparfloxacin TFA Trifluoroacetic Acid TNF Tumor Necrosis Factor UPLC Ultrahigh-Performance Liquid Chromatography UV Ultraviolet VIS Visible light

A b b r e v i a t i o n s | XVIII
I n t r o d u c t i o n | 1
1. Introduction
Phototoxicity is a relatively common phenomenon and is an adverse effect of some systemic
drugs. A large number of pharmaceutical drug substances are known to carry the potential to
elicit a phototoxic response (Moore 2002, Ferguson 2002). Reported cases of phototoxic
responses may account for 5 to 10 % of recorded cutaneous adverse drug reactions (Selvaag
1997).
Phototoxicity is an acute light-induced skin response to a photoreactive chemical, which may
represent like sunburn (dermatitis solaris). Phototoxicity can be elicited by a wide range of
pharmaceutical agents like Non-Steroidal Anti-Inflammatory Drug (NSAIDS) and various
anti-infective agents like tetracyclines or fluoroquinolones (Allen, 1993; Epstein, 1985;
Gould et al., 1995). On the other hand, photoallergy is an immunologically mediated reaction
to a chemical initiated by the formation of photoproducts, which may be more similar to an
eczematous dermatitis.
As these abnormal reactions seriously limit or exclude the usage of certain drugs, it is
essential to identify such liabilities early in development. Therefore, photosafety of drug
candidate molecules needs to be evaluated (ICH M3 R2, 2009).
I n t r o d u c t i o n | 2
1.1. Photosafety evaluation of pharmaceuticals
The need to perform photosafety evaluation as an integral part of pharmaceutical drug
development has developed during the last 20 years. Initial, clinically relevant symptoms
were only seen late during development or even after marketing of a new drug. In some
cases, e.g. the fluoroquinolones class antibiotics, the risk/benefit assessment had to be
changed leading to significant limitations (Domagala, 1994). Approximately 10 years later
and following the validation of the in vitro 3T3 Neutral Red Uptake Phototoxicity Test
(Spielmann H et al., 1998) in the U.S.A as well as in the E.U. guidance documents were
issued detailing the expectations of the regulatory authorities (FDA, 2003; EMEA, 2002).
More recently, the European position was slightly revised (EMA Q&A document, 2011) and
efforts have been initiated to harmonize regulatory requirements internationally (ICH M3 R2,
section 14, 2009; ICH S10, 2013).
In general, the following characteristics are evaluated in order to determine if a drug
candidate will present a photosafety concern:
• Absorbance of light within the range of natural sunlight (290-700 nm);
• Generation of reactive species following absorption of UV/visible light; and
• Sufficient distribution to light-exposed tissues (e.g., skin, eye).
If these three conditions are not simultaneously met, a compound will not be considered as
potentially phototoxic.
I n t r o d u c t i o n | 3
1.1.1. Photochemical properties
The first step is to consider the absorption of light in the range of 290 to 700 nm. According
to the Molar Extinction Coefficient (MEC)-based approach proposed by Henry and co-
workers (Henry, Foti and Alsante, 2009), a compound would be considered to absorb
sufficiently light of its MEC value is above 1000 L * mol-1* cm-1.
Although different mechanisms for phototoxicity are known (e.g. formation of photoadducts
or cytotoxic photoproducts), it appears that the excitation of molecules by light can typically
lead to generation of Reactive Oxygen Species (ROS), including superoxide and singlet
oxygen via energy transfer mechanisms. Thus, ROS generation following irradiation with UV
or visible light can be an indicator of phototoxic potential (Onoue et al., 2010).
1.1.2. Tissue Distribution/Pharmacokinetics
A variety of factors influence the ability of a photoreactive chemical to reach light-exposed
tissues. The plasma concentration, the perfusion of the tissue, the partitioning from vascular
to interstitial and cellular compartments, and the binding, retention, and accumulation will
influence concentration of the chemical in the tissue. If a photoreactive chemical reaches
light-exposed tissues, a phototoxic reaction might occur depending on the excitation
wavelength. UVA and visible light photons sufficiently penetrate into deeper skin layers. In
comparison, only a small fraction of UVB reaches the dermis.
Binding, retention or accumulation of a compound in sun-exposed tissue might be taken into
consideration as longer residence times or higher tissue to plasma concentration ratios may
increase the probability of a phototoxic tissue reaction.
I n t r o d u c t i o n | 4
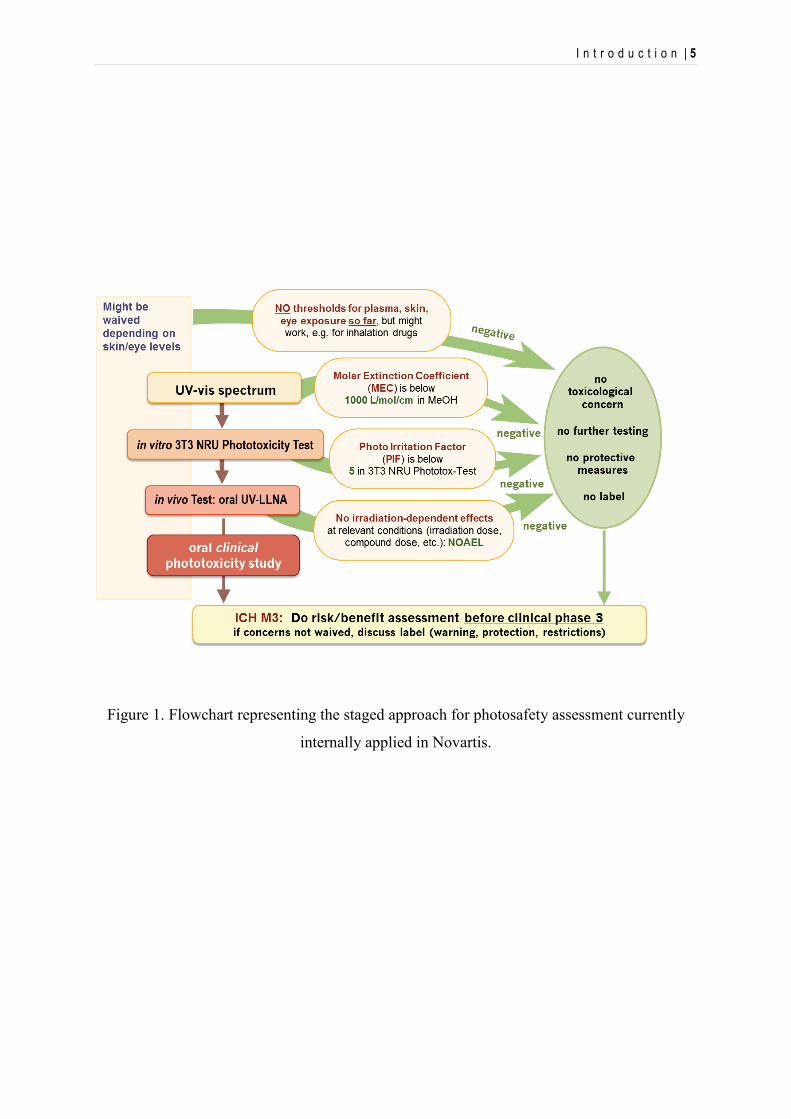
1.1.3. Nonclinical photosafety testing
The available and routinely used nonclinical assays, both in vitro and in vivo (e.g. UV-vis
light absorption spectrum, in vitro 3T3 Neutral Red Uptake phototoxicity test, oral UV Local
Lymph Node Assay), are focused primarily on detecting potential phototoxicity. The most
widely used in vitro assay for phototoxicity is the in vitro 3T3 Neutral Red Uptake
Phototoxicity Test (3T3 NRU-PT) as it is considered the most appropriate in vitro screen for
soluble compounds that are not exclusively UVB absorbers (OECD guideline, 2004).
However, this monolayer cell culture assay shows a high frequency of positive results and
may overpredict the human photosafety risk (Lynch & Wilcox, 2011).
For both in vitro and in vivo assays, the selection of irradiation conditions is critical. The
broadest range of light exposure that humans might be regularly exposed to is natural
sunlight. Therefore it is important to select a suitable sunlight simulator light source.
Irradiance and irradiation dose are normalized based on the UVA part (320 to 400 nm) of the
applied spectrum. UVA doses ranging from 5 to 20 J/cm2 have been used to establish in vitro
and in vivo phototoxicity assays as they are comparable to those obtained during outdoor
activities on summer days at noon time, in temperate zones, and at sea level (ICH, S10,
2013).
I n t r o d u c t i o n | 5
Figure 1. Flowchart representing the staged approach for photosafety assessment currently
internally applied in Novartis.
I n t r o d u c t i o n | 6
1.2. Scope of the thesis
In this work, we were interested in a more in-depth understanding of the underlying
mechanisms of phototoxicity, particularly in vivo. The results of our investigation of
phototoxicity mechanisms are presented in three research papers published in peer reviewed
journals which represent the different sections of this thesis.
In the first manuscript (Boudon et al, 2013), we report the further optimization of the
establishment of modified murine UV-local lymph node assay (UV-LLNA), adapted for
phototoxicity assessment of systemically applied compounds. Several clinically phototoxic
reference compounds were tested in mice using a sun light simulator to establish time- and
dose-dependent profiles. The reference compounds included sparfloxacin (Dawe et al., 2003;
Hamanaka et al., 1998; Lipsky et al., 1999a, 1999b; Pierfitte et al., 2000), enoxacin (Dawe et
al., 2003; Izu et al., 1992; Kang et al., 1993), lomefloxacin (Cohen and Bergstresser, 1994;
Correia and Delgado, 1994; Man et al., 1999), doxycycline (Bjellerup and Ljunggren, 1994;
Blank et al., 1968; Frost et al., 1972; Layton and Cunliffe, 1993), promethazine (Tzanck et
al., 1951; Sidi et al., 1955; Epstein and Rowe, 1957; Epstein,1960; Newill, 1960),
vemurafenib (Chapman et al., 2011; Flaherty et al., 2010, Lacouture et al. 2013) and
ketoprofen (Camarasa, 1985; Alomar, 1985; Foti et al., 2011).
Once time- and dose-dependent profiles of these reference compounds were established, the
experimental approach initially included the investigation of co-localization of compound
concentration and signs of acute toxicity. The aim was to use immunohistochemical methods
to localize and quantify the release of inflammatory markers and the immune cells infiltrate,
as well as early developmental stages of inflammation. For this purpose, comprehensive
investigations were undertaken with skin samples from the aforementioned in vivo studies in
I n t r o d u c t i o n | 7
mice. In order to characterize immunocompetent cells, we used antibodies raised against
neutrophils, macrophages and lymphocytes. For characterization of secreted markers, we
used primary antibodies raised against interleukins IL-1α, -2, -6, -8, -10, -12 and TNFα.
Although promising, this technique is complex and its reliability is not only depending on
antibody quality, but also other important factors such as tissue fixation and processing,
antigen retrieval and sensitivity of the protein detection system. In order to set up suitable
protocols on positive tissues, we used both manual and automatic methods (VENTATA,
Roche, Switzerland). We tried different type of sample fixation (Tissues fixed in Formalin
during 2 hours or 48 hours, in HISTOCHOICE™ during 6 hours or cryosections with no
fixation or fixed with Formaldehyde 4%, Glutaraldehyde or Acetone). Pretreatment of the
tissues, antigen retrievals (Protease 1, Borate, Citrate pH6 or pH7) and different type of
detection methods (Labeled Streptavidin Biotin revelation with Vector VIP reagent, Avidine
Biotin Complex revelation with DAB (3,3'-diaminobenzidine), Avidine Biotin Complex
revelation with Alkaline Phosphatase and counterstained with Hematoxylin or 2%
methylgreen, and Duolink in situ Proximity Ligation Assay (PLA) method) were also
investigated. Unfortunately, the results were not conclusive and are not presented in this
work.
In the second manuscript, we focused our work on vemurafenib, a B-Raf kinase inhibitor for
the treatment of patients with unresectable or metastatic melanoma carrying the BRAFV600E
mutation. It is commercially available since 2011 (Zelboraf, Roche). We selected this drug
because signs of clinical photosensitivity were reported in 42 % of patients included in the
Phase I trial extension cohort. Similarly, during Phase II and Phase III, 52 % and 30 % of
vemurafenib-treated patients were affected, respectively (Chapman et al., 2011; Flaherty et
al., 2010, Lacouture et al. 2013). Surprisingly, the phototoxic potential evaluation in an
I n t r o d u c t i o n | 8
animal model during drug development concluded that there would exist no relevant risk for
humans. Therefore, it became a fundamental question to understand this discrepancy.
The aforementioned mouse oral UV-Local Lymph Node Assay, was used to investigate the
impact of formulations, dose levels, duration of treatment and timing of irradiation. Moreover
a basic pharmacokinetic profile was established within the same mouse strain.
The third manuscript covers investigations on imaging techniques to follow the fate of
photoreactive molecules in tissue samples. Matrix-assisted laser desorption/ionization mass
spectrometry (MALDI-MS)-based imaging (MSI) was applied to evaluate the distribution of
sparfloxacin, an antibiotic drug belonging to the class of fluoroquinolons and a well-known
photosensitizer in human. Both, samples from mouse skin and from a human 3D skin model
were used in order to assess the potential advantage of this technique in the context of
photosafety evaluation.
References
Allen, J.E. 1993. Drug-induced photosensitivity. Clin. Pharm. 12: 580–587.
Alomar, A. 1985. Ketoprofen photodermatitis. Contact Dermatitis. 12(2): 112-3.
Bjellerup, M., Ljunggren, B. 1994. Differences in phototoxic potency should be considered when
tetracyclines are prescribed during summertime: a study on doxycycline and lymecycline in human
volunteers, using an objective method for recording erythema. Br. J. Dermatol. 130: 356-360.
Blank, H., Cullen, S.I., Catalano, P.M. 1968. Photosensitivity studies with demethylchlortetracycline
and doxycycline. Arch. Derm. 97: 1-2.
I n t r o d u c t i o n | 9
Boudon, S.M, Plappert-Helbig, U., Odermatt, A., Bauer, D. 2013. Characterization of vemurafenib
phototoxicity in a mouse model. Toxicol. Sci., doi: 10.1093/toxsci/kft237, first published online:
October 23, 2013.
Camarasa, J.G. 1985. Contact dermatitis to ketoprofen. Contact Dermatitis. 12(2):120-2.
Chapman, P.B., Hauschild, A., Robert, C., Haanen, J.B., Ascierto, P., Larkin, J., Dummer, R., Garbe,
C., Testori, A., Maio, M., Hogg, D., Lorigan, P., Lebbe, C., Jouary, T.,Schadendorf, D., Ribas,
A., O'Day, S.J., Sosman, J.A., Kirkwood, J.M., Eggermont, A.M., Dreno, B., Nolop, K., Li,
J., Nelson, B., Hou, J., Lee, R.J., Flaherty, K.T., McArthur, G.A. and BRIM-3 Study Group
(2011). Improved survival with vemurafenib in melanoma with BRAF V600E mutation. N. Engl.
J. Med. 364:2507–2516.
Cohen, J.B., Bergstresser, P.R. 1994. Inadvertent phototoxicity from home tanning equipment. Arch.
Dermatol. 130: 804-806.
Correia, O., Delgado, L. 1994. Bullous photodermatosis after lomefloxacin. Arch. Dermatol. 130:
808-809.
Dawe, R.S., Ibbotson, S.H., Sanderson, J.B., Thomson, E.M., Ferguson, J. 2003. A randomzed
controlled trial (volunteer study) of sitafloxacin, enoxacin, levofloxacin and sparfloxacin
phototoxicity. Br. J. Dermatol. 149: 1232-1241.
Domagala, J.M. 1994. Structure–activity and structure–side-effect relationships for the quinolone
antibacterials, J. Antimicrob. Chemother. 33: 685–706.
EMEA Note for Guidance on photosafety testing, EMEA, CPMP/SWP/398/01, London, 27 June
2002.
EMEA Questions and answers on the ‘Note for guidance of photosafety testing’, EMA,
CHMP/SWP/336670, London, 17 March 2011.
Epstein, S. 1960. Allergic photocontact dermatitis from promethazine (phenergan). Arch Dermatol.
81:175-80.
Epstein, S., Rowe, R.J. 1957. Photoallergy and photocross-sensitivity to phenergan. J Invest
Dermatol. 29(5):319-26.
I n t r o d u c t i o n | 10
Epstein, J.H., Wintroub, B.U. 1985. Photosensitivity due to drugs. Drugs 30: 42–57.
FDA Guidance for Industry on Photosafety Testing, US Department of Health and Human Services—
Food and Drug Administration, Center for Drug Evaluation and Research (CDER), May 2003,
Pharmacology and Toxicology, Rockville, MD, USA.
FDA Guidance for Industry on Photosafety Testing, US Department of Health and Human Services—
Food and Drug Administration, Center for Drug Evaluation and Research (CDER), January 2000,
Pharmacology and Toxicology, Rockville, MD, USA.
Ferguson, J. 2002. Photosensitivity due to drugs. Photodermatol. Photoimmunol. Photomed.
18(5):262-9.
Flaherty, K.T., Puzanov, I., Kim, K.B., McArthur, G.A., Sosman, J.A., O'Dwyer, P.J., Lee,
R.J., Grippo, J.F., Nolop, K. and Chapman, P.B. (2010). Inhibition of mutated, activated BRAF in
metastatic melanoma. N. Engl. J. Med. 363:809–819.
Foti, C., Cassano, N., Vena, G.A., Angelini, G. 2011. Photodermatitis caused by oral ketoprofen: two
case reports. Contact Dermatitis. 64: 181-183.
Frost, P., Weinstein, G.D., Gomez, E.C. 1972. Phototoxic potential of minocycline and doxycycline.
Arch. Derm. 105: 681-683.
Gould, J.W., Mercurino, M.G., Elemets, C.A. 1995. Cutaneous photosensitivity diseases induced by
exogenous agents. J. Am. Acad. Dermatol. 33(4):551–573.
Hamanaka, H., Mizutani, H., Shimizu, M. 1998. Sparfloxacin-induced photosensitivity and the
occurrence of a lichenoid tissue reaction after prolonged exposure. J. Am. Acad. Dermatol. 38:
945-949.
Henry, B., Foti, C., Alsante, K. 2009. Can light absorption and photostability data be used to assess
the photosafety risks in patients for a new drug molecule? J Photochem Photobiol B. 96(1):57-62.
ICH, M3 (R2). 2009. Guidance on nonclinical safety studies for the conduct of human clinical trials
and marketing authorization of pharmaceuticals.
http://www.ich.org/fileadmin/Public_Web_Site/ICH_Products/Guidelines/Multidisciplinary/M3_R2/S
tep4/M3_R2__Guideline.pdf.
I n t r o d u c t i o n | 11
ICH (2012), draft guideline S10 “Photosafety evaluation of pharmaceuticals”,
<http://www.ich.org/fileadmin/Public_Web_Site/ICH_Products/Guidelines/Safety/S10/S10_Step_
2.pdf >.
Izu, R., Gardeazabal, J., González, M., Landa, N., Ratón, J.A., Díaz-Pérez, J.L. 1992. Enoxacin-
induced photosensitivity: study of two cases. Photodermatol. Photoimmunol. Photomed. 9: 86-88.
Kang, J.S., Kim, T.H., Park, K.B., Chung, B.H., Youn, J.I. 1993. Enoxacin photosensitivity.
Photodermatol. Photoimmunol. Photomed. 9: 159-161.
Lacouture, M.E., Duvic, M., Hauschild, A., Prieto, V.G., Robert, C., Schadendorf, D., Kim, C.C.,
McCormack, C.J., Myskowski, P.L., Spleiss, O., Trunzer, K., Su, F., Nelson, B., Nolop, K.B.,
Grippo, J.F., Lee, R.J., Klimek, M.J., Troy, J.L., Joe, A.K. (2013). Analysis of dermatologic events
in vemurafenib-treated patients with melanoma. Oncologist. 18(3):314-22.
Layton, A.M., Cunliffe, W.J. 1993. Phototoxic eruptions due to doxycycline – a dose-related
phenomenon. Clin. Exp. Dermatol. 18: 425-427.
Lipsky, B.A., Dorr, M.B., Magner, D.J., Talbot, G.H., 1999a. Safety profile of sparfloxacin, a new
fluoroquinolone antibiotic. Clin. Ther. 21: 148-159.
Lipsky, B.A., Miller, B., Schwartz, R., Henry, D.C., Nolan, T., McCabe, A., Magner, D.J., Talbot,
G.H., 1999b. Sparfloxacin versus ciprofloxacin for the treatment of community-acquired,
complicated skin and skin-structure infections. Clin. Ther. 21: 675-690.
Lynch A.M., Wilcox P. 2011. Review of the performance of the 3T3 NRU in vitro phototoxicity assay
in the pharmaceutical industry. Exp Toxicol Pathol. 63(3):209-14.
Man, I., Murphy, J., Ferguson, J. 1999. Fluoroquinolone phototoxicity: a comparison of moxifloxacin
and lomefloxacin in normal volunteers. J. Antimicrob. Chemother. 43 (Suppl. B): 77-82.
Moore, E.M. 2002. Drug-induced cutaneous photosensitivity. Drug Saf. 25: 345-372.
Newill, R.G. 1960. Photosensitivity caused by promethazine. Br Med J. 2(5195):359-60.
OECD Guidelines for the Testing of Chemicals Section 4. 2004. Test No. 432: In vitro 3T3 NRU
phototoxicity test.
I n t r o d u c t i o n | 12
Onoue, S., Kawamura, K., Igarashi, N., Zhou,Y., Fujikawa, M., Yamada, H., Tsuda, Y., Seto, Y.,
Yamada, S. 2008. Reactive oxygen species assay-based risk assessment of drug-induced
phototoxicity: classification criteria and application to drug candidates. Pharm Biomed Anal. 47(4-
5):967-72.
Pierfitte, C., Royer, R.J., Moore, N., Bégaud, B. 2000. The link between sunshine and phototoxicity
of sparfloxacin. Br. J. Clin. Pharmacol. 49: 609-612.
Selvaag , E. 1997. Clinical drug photosensitivity – A retrospective analysis of reports to the
Norwegian Adverse Drug Reactions Committee from the years 1970-1994. Photodermatol.
Photoimmunol. Photomed. 13: 21-23
Spielmann, H., Balls, M., Dupuis, J., Pape, W.J., Pechovitch, G., de Silva, O., Holzhütter, H.G.,
Clothier, R., Desolle, P., Gerberick, F., Liebsch, M., Lovell, W.W., Maurer, T., Pfannenbecker, U.,
Potthast, J.M., Csato, M., Sladowski, D., Steiling, W., Brantom, P. 1998. The International
EU/COLIPA In Vitro Phototoxicity Validation Study: Results of Phase II (Blind Trial). Part 1: The
3T3 NRU Phototoxicity Test. Toxicol In Vitro. 12(3):305-27.
Sidi, E., Hincky, M., Gervais, A. 1955. Allergic sensitization and photosensitization to phenergan
cream. J Invest Dermatol. 24(3):345-52.
Toback A.C., Anders J.E. 1986. Phototoxicity from systemic agents. Dermatol. Clin. 4(2):223-230.
Tzanck, Sidi, Mazalton, Kohen. 1951. Two cases of dermatitis from phenergan with
photosensitization. Bull Soc Fr Dermatol Syphiligr. 58(4):433.
I n t e g r a t e d p r e c l i n i c a l p h o t o s a f e t y t e s t i n g s t r a t e g y f o r s y s t e m i c a l l y a p p l i e d p h a r m a c e u t i c a l | 13
2. Integrated preclinical photosafety testing strategy for
systemically applied pharmaceuticals
[Schümann, J., Boudon, S. M., Ulrich, P., Loll, N., Garcia, D., Schaffner, R., Streich, J.,
Kittel, B., and Bauer, D. 2013. Integrated preclinical photosafety testing strategy for
systemically applied pharmaceuticals. Toxicological Sciences.] Submitted
This work was presented at the EUROTOX 2013. Interlaken, Switzerland, Sept. 2013.
Boudon, S., Schneider, M., Morandy, G., Junker, U., Plappert-Helbig, U., Odermatt, A.,
Bauer, D. A modified oral UV-LLNA in Balb/c mice to investigate phototoxicity
mechanisms and pharmacokinetic properties in skin. Toxicology Letters. Volume 221.
Supplement. 28 August 2013, Pages S87-S88, ISSN 0378-4274.
http://dx.doi.org/10.1016/j.toxlet.2013.05.107.
I n t e g r a t e d p r e c l i n i c a l p h o t o s a f e t y t e s t i n g s t r a t e g y f o r s y s t e m i c a l l y a p p l i e d p h a r m a c e u t i c a l | 14
Abstract
Phototoxic properties of systemically applied pharmaceuticals may be the cause of serious
adverse drug reactions. Therefore, a reliable preclinical photosafety assessment strategy,
combining in vitro and in vivo approaches in a quantitative manner is important and has not
been described so far. Here we report the establishment of an optimized modified murine
local lymph node assay (LLNA), adapted for phototoxicity assessment of systemically
applied compounds, as well as the test results for 34 drug candidates in this in vivo photo-
LLNA. The drug candidates were selected based on their ability to absorb ultraviolet/visible
light and the photo irritation factors (PIF) determined in the well-established in vitro 3T3
neutral red uptake phototoxicity test. An in vivo phototoxic potential was identified for 13 of
these drug candidates. The use of multiple dose levels in the described murine in vivo
phototoxicity studies enabled the establishment of no- and/or lowest-observed-adverse-effect-
levels (NOAEL/LOAEL), supporting also human photosafety assessment. An in vitro – in
vivo correlation demonstrated that a drug candidate classified as “phototoxic” in vitro is not
necessarily phototoxic in vivo. However, the probability for a drug candidate to cause
phototoxicity in vivo clearly correlated with the magnitude of the phototoxicity identified in
vitro.
I n t e g r a t e d p r e c l i n i c a l p h o t o s a f e t y t e s t i n g s t r a t e g y f o r s y s t e m i c a l l y a p p l i e d p h a r m a c e u t i c a l | 15
2.1. Introduction
Phototoxicity of pharmaceutical products may cause serious adverse drug
reactions. This does not only apply to topically applied chemicals absorbing
ultraviolet (UV) and/or visible (vis) light, but also to those which reach light-
exposed tissues such as skin or eyes following systemic exposure (for review see
Drucker and Rosen, 2011; Ferguson, 2002; Moore, 2002). The contact phototoxic
potential of topically applied pharmaceuticals is typically assessed preclinically
using in vivo phototoxicity assays. These include monitoring of skin reactions in
topically treated guinea pigs or the murine local lymph node assay (LLNA) in
albino mice, including its non-radioactive modifications (for these, the term
“modified LLNA” is commonly used), with quantification of skin and lymph node
(LN) reactions (Homey et al., 1998; Neumann et al., 2005; Ulrich et al., 2001;
Vohr et al., 2001). However, for systemically applied pharmaceuticals, an
integrated preclinical photosafety assessment strategy has not been established so
far.
The standard preclinical in vitro assay for phototoxicity assessment is the “in vitro
3T3 neutral red uptake (NRU) phototoxicity test” (OECD, 2004), which may be
considered for compounds showing relevant light absorption in the range of
natural sun light (290 to 700 nm) (Bauer et al., 2013). Neumann et al. (2005) and
Vohr et al. (2001) reported the testing of selected systemically applied reference
compounds in different preclinical in vitro and/or in vivo assays, including an
“integrated model for the differentiation of skin reactions” (IMDS) based on a
modified murine LLNA with endpoints limited to ear thickness, local lymph node
(LN) weight and cell counts.
I n t e g r a t e d p r e c l i n i c a l p h o t o s a f e t y t e s t i n g s t r a t e g y f o r s y s t e m i c a l l y a p p l i e d p h a r m a c e u t i c a l | 16
Here we report the establishment of a further optimized and extended modified
murine LLNA, adapted for phototoxicity assessment of systemically applied
compounds (photo-LLNA), the correlation between the in vitro and in vivo
photosafety testing of 34 drug candidates in this system, and the relevance to
preclinical photosafety assessment. The reference compounds included
sparfloxacin (Dawe et al., 2003; Hamanaka et al., 1998; Lipsky et al., 1999a,
1999b; Pierfitte et al., 2000), enoxacin (Dawe et al., 2003; Izu et al., 1992; Kang
et al., 1993), lomefloxacin (Cohen and Bergstresser, 1994; Correia and Delgado,
1994; Man et al., 1999), doxycycline (Bjellerup and Ljunggren, 1994; Blank et al.,
1968; Frost et al., 1972; Layton and Cunliffe, 1993), ketoprofen (Bagheri et al.,
2000; Foti et al., 2011), and 8-methoxypsoralen (8-MOP), the latter also being
used as an orally administered photoactive drug together with UVA irradiation in
photochemotherapy (“PUVA”, psoralen + UVA) of severe psoriasis (for review
see Lapolla et al., 2011). For completeness, previously reported results with the
reference compound vemurafenib (Boudon et al, 2013) are included as well.
In addition to clinically relevant reference compounds, 34 systemically applied
drug candidates were tested at three dose levels in this in vivo assay. The
following major optimizations compared to the described IMDS for systemically
applied phototoxic reference compounds (Neumann et al., 2005; Vohr et al.,
2001) were done: i. systematic monitoring of erythema formation at least twice
daily using a defined scoring system, ii. determination of ear biopsy weights
instead of ear thickness, i.e. exclusion of a subjective component associated with
the measurement of ear thickness using a micrometer (Ulrich and Vohr, 2012), iii.
inclusion of histopathological analysis of the retina due to residual absorption of
visible light at wavelengths that reach the human retina. Altogether, determination
I n t e g r a t e d p r e c l i n i c a l p h o t o s a f e t y t e s t i n g s t r a t e g y f o r s y s t e m i c a l l y a p p l i e d p h a r m a c e u t i c a l | 17
of erythema formation and ear weight, local LN reactions (quantification of LN
weights and cell counts), and retina changes as well as identification of a no- or
lowest-observed-adverse-effect-level (NOAEL/LOAEL) are described as key
elements supporting later human photosafety assessment. Finally, the implications
of an in vitro – in vivo phototoxicity correlation on the preclinical in vivo
photosafety testing strategy are discussed.
2.2. Materials and Methods
2.2.1. UV/visible light absorption spectra
Light absorption spectra within sun light range (290 to 700 nm) were recorded on
a Cary 300 spectrophotometer (Varian Australia Pty Ltd, Australia) using UV-
transparent quartz glass cuvettes (1 cm path length). Substances were dissolved in
methanol applying individual solvent-specific baseline correction. For each peak
(and for 290 nm if this was the highest observed absorption value) the molar
extinction coefficient (ε or MEC) was calculated: ε = A / (c x l)
(A, absorbance; c, concentration; l, path length (cuvette)).
2.2.2. In vitro 3T3 NRU phototoxicity test
The BALB/c mouse fibroblast cell line 3T3.A31 was obtained from the European
Collection of Cell Cultures (ECACC, no. 86110401, at passage 82), United
Kingdom. Cells were cultivated in Dulbecco's Modified Eagle Medium (DMEM)
(with phenol red) containing 10% fetal calf serum, 1% glutamine, and 1%
I n t e g r a t e d p r e c l i n i c a l p h o t o s a f e t y t e s t i n g s t r a t e g y f o r s y s t e m i c a l l y a p p l i e d p h a r m a c e u t i c a l | 18
penicillin/streptomycin. The assay was performed in accordance with OECD
Testing Guideline 432. Briefly, 24 hours after seeding the mouse fibroblast cells
(not exceeding passage 99) into 96-well plates, the medium was removed and the
cells were treated with different concentrations of the test compound for 1 hour
using Hank's Balanced Salt Solution (HBSS, without phenol red) as medium
replacement. Subsequently, these cells were irradiated (+Irr) with simulated sun
light (SOL500 H1, Dr. Hönle, Germany) with a main spectral output from 320
until beyond 700 nm. The integrated H1 filter system attenuated the highly
cytotoxic UVB range to a level which was tolerated by the cell culture as
suggested by the mentioned guideline. In parallel, an identically prepared 96-well
plate was kept in the dark (-Irr), serving as control. UVA irradiance was measured
by a UVA meter (Dr. Hönle, Germany) with spectral sensitivity in the range from
320 to 400 nm and a measuring range between 0 and 199.9 mW/cm2. The yearly
calibration using an externally calibrated spectroradiometer covering the full
spectral range from 250 to 800 nm was performed by opto.cal GmbH
(Switzerland), which is a calibration laboratory accredited by the Swiss
Accreditation Service. The applied intensity was 1.67 mW/cm2 resulting in a total
UVA dose of 5 J/cm2 after 50 minutes of irradiation. After irradiation the HBSS
buffer was replaced by fresh medium. Cell viability was determined 24 hours later
using neutral red as the vital dye, which was measured at 540 nm after incubation
and extraction. The PIF was calculated according to OECD TG 432 using the
following equation: PIF = IC50(-Irr) / IC50(+Irr).
I n t e g r a t e d p r e c l i n i c a l p h o t o s a f e t y t e s t i n g s t r a t e g y f o r s y s t e m i c a l l y a p p l i e d p h a r m a c e u t i c a l | 19
2.2.3. Mice
Female BALB/c mice, obtained in a specific pathogen-free state from Charles
River Laboratories (France or Germany), were used throughout the studies,
usually at the age of 8 to 10 weeks. The photo-LLNA studies were performed in
conformity with the Swiss Animal Welfare Law and in accordance with internal
standard operating procedures and guidelines for care and use of laboratory
animals. Mice had ad libitum access to pelleted standard rodent diet and tap water
from the domestic supply and were kept under temperature- and humidity-
controlled conditions and an automatic 12 hour light/dark cycle with background
radio coordinated with light hours.
2.2.4. Treatment of mice
For the establishment of the optimized modified murine systemic photo-LLNA
the following reference compounds (all obtained from Sigma-Aldrich,
Switzerland, with the exception of 8-MOP, for which meladinine tablets from
Galderma, Switzerland, were used) were administered by oral gavage at three
dose levels (twelve mice per group) once a day for three consecutive days:
sparfloxacin (in 1% (w/v) aqueous solution of carboxymethylcellulose (CMC));
enoxacin (in water); doxycycline (in water); ketoprofen (in 0.5% CMC).
Lomefloxacin (in water) was used as reference compound at three dose levels but
only administered for two consecutive days, and meladinine (in water) was
administered at two dose levels only for three consecutive days. Drug candidates
were administered systemically (by oral gavage or intravenously) at three dose
I n t e g r a t e d p r e c l i n i c a l p h o t o s a f e t y t e s t i n g s t r a t e g y f o r s y s t e m i c a l l y a p p l i e d p h a r m a c e u t i c a l | 20
levels in suitable vehicles for three consecutive days. Selection of dose levels was
mostly based on expected maximal tolerated exposure (high dose level),
pharmacologically relevant exposure (low dose level), and an exposure level in
between those two (intermediate dose level).
2.2.5. Exposure of mice to simulated sun light
During irradiation mice were kept in specific cages allowing only for lateral
movements and ensuring a uniform irradiation of their backs and ears. Non-
irradiated animals were kept in their housing cages under standard room light. Six
mice per dose level were exposed to simulated sun light (Psorisan 900 H1 lamp;
Dr. Hönle, Germany) with a main spectral output from 320 until beyond 590 nm.
Irradiation was normalized to a dose of 10 J/cm2 UVA. The integrated H1 filter
system attenuated the highly cytotoxic UVB range to a level which was tolerated
by the animals. This adjustment is recommended for testing oral drugs, since in
such cases photosafety assessment is mainly focusing on UVA and visible light as
only these wavelengths are penetrating sufficiently into skin (ICH S10, 2013).
With the sun light simulator used, spectral output between 450 and 490 nm and
beyond 590 nm was under-represented compared to sun light. However, none of
the administered compounds had its absorption peak in these ranges. UVA
irradiance was measured with a UV radiometer (Gigahertz-Optik GmbH,
Germany). The yearly calibration of this GLP-compliant equipment with an
externally calibrated spectroradiometer covering the full spectral range from 250
to 800 nm was performed by opto.cal GmbH (Switzerland). Dose groups were
exposed to simulated sun light separately from each other. Selection of the time

I n t e g r a t e d p r e c l i n i c a l p h o t o s a f e t y t e s t i n g s t r a t e g y f o r s y s t e m i c a l l y a p p l i e d p h a r m a c e u t i c a l | 21
point of exposure to simulated sun light was mostly based on pharmacokinetic
properties of the compounds (i.e. expected tmax). Corresponding control groups
treated with vehicle, not exposed to simulated sun light, were included. For the
reference compounds exposure to simulated sun light started not later than 1.5
hours after treatment (exception: 2 hours for doxycycline).
2.2.6. Erythema scoring
During the dosing period, formation of ear skin erythema was monitored at least
twice daily using a defined scoring system (0 = no erythema; 1 = slight erythema;
2 = moderate erythema; 3 = strong erythema).
2.2.7. Determination of ear biopsy weights and auricular LN
weights and cell counts
Approximately 24 hours after the last treatment, mice were sacrificed by
exposure to carbon dioxide. If not indicated differently in the results part, from
both ears circular pieces from the apical area of each ear with a diameter of 8 mm
(= 0.5 cm2) were excised using a disposable punch and weighed as pairs on an
analytical balance. For assessment of auricular LN weights and cell counts, the
superficial parotid LNs that can be found as single LNs at the jugular bifurcation
and that are referred to as “auricular LNs” (c.f. Van den Broeck et al., 2006; NIH,
1999) here, were excised bilaterally, weighed on an analytical balance and kept in
1 mL ice-cold 0.5% BSA/PBS per pair. LN cell suspensions were prepared by
mechanical disruption of the LNs using a stainless steel mesh. From the resulting
I n t e g r a t e d p r e c l i n i c a l p h o t o s a f e t y t e s t i n g s t r a t e g y f o r s y s t e m i c a l l y a p p l i e d p h a r m a c e u t i c a l | 22
suspensions, cell counts were determined in a conductometer (CASY® TTC,
Schärfe System, Germany).
2.2.8. Histopathology of retina
In murine photo-LLNA studies for sparfloxacin and several drug candidates, one
eye from each animal was taken and fixed in Davidson’s solution. Tissue was
embedded in Paraplast®, sectioned, stained with hematoxylin and eosin, and
examined microscopically. For the human retina only exposure to visible light is
relevant, since wavelengths below 400 nm do not sufficiently penetrate human
cornea, lens and vitreous body (Dillon et al., 2000; Sliney, 2002; Lei and Yao,
2006; ICH S10, 2013). Therefore, histopathological examination of the retina was
not done for all compounds.
2.2.9. Statistical analysis
For statistical calculations either SigmaStat or SAS® was used. A One-Way-
Analysis-of-Variance was used as statistical method. A normality test was
performed to assure that the data were normally distributed (significance level =
0.01). The equal variance test was used to check the assumption that the sample
was drawn from populations with the same variance (significance level = 0.01). In
case of significant results of the One-Way-ANOVA (P < 0.05), multiple
comparisons were performed with the Student-Newman-Keuls test. If the
normality test and/or the equal variance test gave P values < 0.01, a suitable
transformation (log, square root) was applied; if the normality test and/or equal
I n t e g r a t e d p r e c l i n i c a l p h o t o s a f e t y t e s t i n g s t r a t e g y f o r s y s t e m i c a l l y a p p l i e d p h a r m a c e u t i c a l | 23
variance test still gave P values < 0.01, the non-parametric Kruskal-Wallis test
was used, and in case of a significant result of the Kruskal-Wallis test (P < 0.05),
multiple comparisons were performed with the Student-Newman-Keuls test for
the ranks of the original observations. For the Student-Newman-Keuls test, the
confidence level for the difference of the means was set to 95% (α = 0.05).
Groups of mice treated with compound were statistically compared with the group
of mice treated with vehicle and not exposed to simulated sun light. Furthermore,
groups of mice treated with compound and exposed to simulated sunlight were
compared to corresponding groups not exposed to simulated sun light.
2.3. Results
2.3.1. Clinically phototoxic reference compounds in the
modified murine oral (gavage) photo-LLNA
The UV-vis absorption spectra of six clinically relevant phototoxic compounds,
i.e. sparfloxacin, enoxacin, lomefloxacin, doxycycline, ketoprofen, and 8-MOP,
were recorded and analyzed to identify absorption peaks with associated MECs
(Table 1). The in vitro phototoxic potential of these compounds was identified by
determination of PIF values using the well-established 3T3 NRU test. All six
reference compounds were phototoxic in vitro with PIF values > 25, and they
showed a phototoxic potential in the herein described optimized modified murine
oral (gavage) photo-LLNA (Table 1). For completeness, the results with the
previously reported reference compound vemurafenib (Boudon et al., 2013) are
listed as well. Signs of ear skin irritation (erythema and/or increased ear biopsy
I n t e g r a t e d p r e c l i n i c a l p h o t o s a f e t y t e s t i n g s t r a t e g y f o r s y s t e m i c a l l y a p p l i e d p h a r m a c e u t i c a l | 24
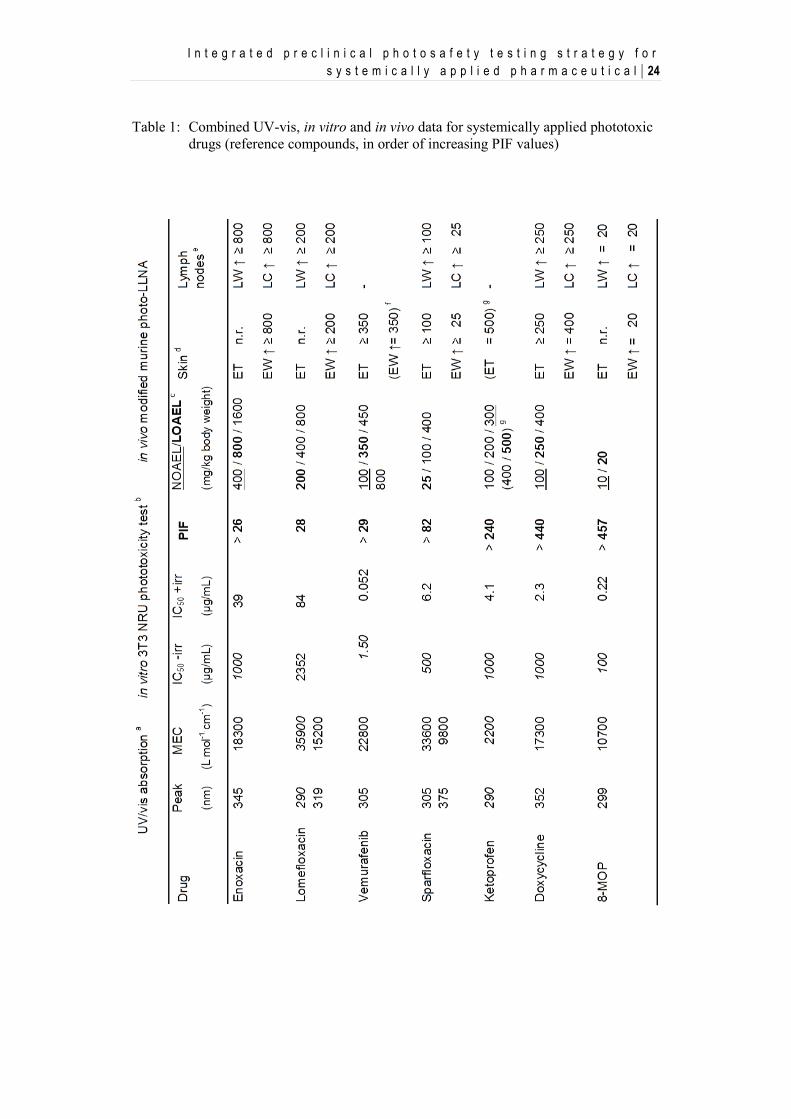
Table 1: Combined UV-vis, in vitro and in vivo data for systemically applied phototoxic
drugs (reference compounds, in order of increasing PIF values)
I n t e g r a t e d p r e c l i n i c a l p h o t o s a f e t y t e s t i n g s t r a t e g y f o r s y s t e m i c a l l y a p p l i e d p h a r m a c e u t i c a l | 25
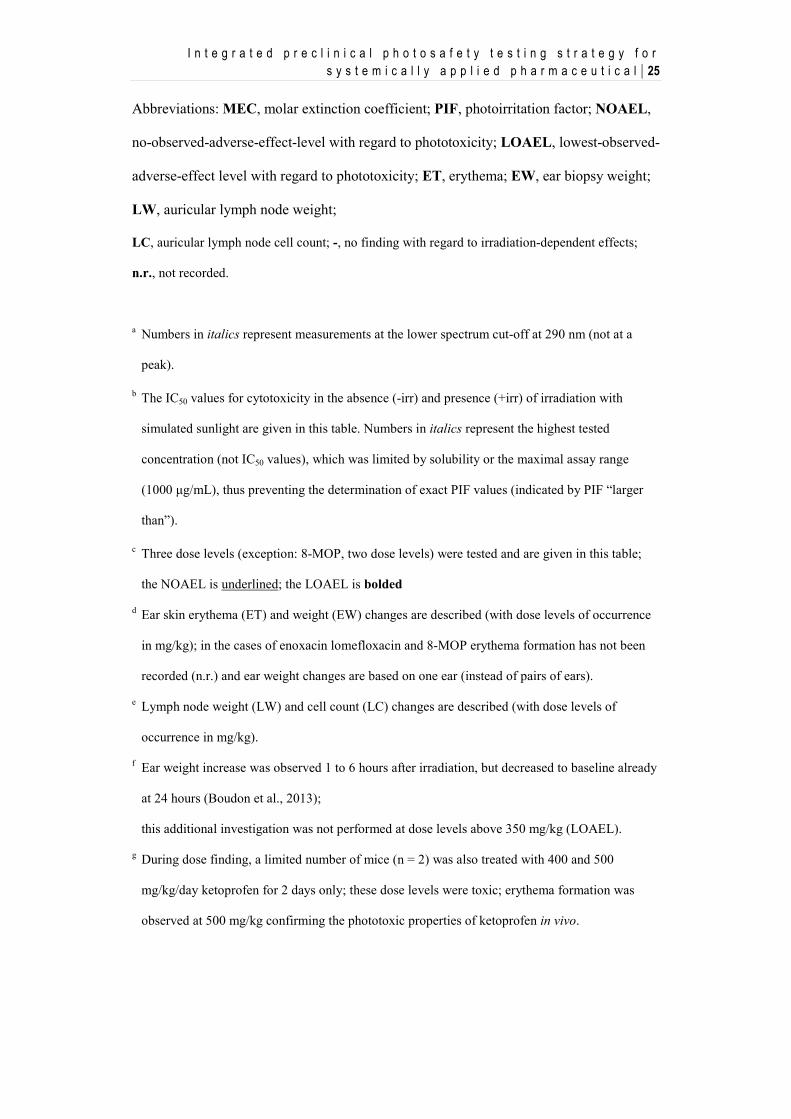
Abbreviations: MEC, molar extinction coefficient; PIF, photoirritation factor; NOAEL,
no-observed-adverse-effect-level with regard to phototoxicity; LOAEL, lowest-observed-
adverse-effect level with regard to phototoxicity; ET, erythema; EW, ear biopsy weight;
LW, auricular lymph node weight;
LC, auricular lymph node cell count; -, no finding with regard to irradiation-dependent effects;
n.r., not recorded.
a Numbers in italics represent measurements at the lower spectrum cut-off at 290 nm (not at a
peak).
b The IC50 values for cytotoxicity in the absence (-irr) and presence (+irr) of irradiation with
simulated sunlight are given in this table. Numbers in italics represent the highest tested
concentration (not IC50 values), which was limited by solubility or the maximal assay range
(1000 μg/mL), thus preventing the determination of exact PIF values (indicated by PIF “larger
than”).
c Three dose levels (exception: 8-MOP, two dose levels) were tested and are given in this table;
the NOAEL is underlined; the LOAEL is bolded
d Ear skin erythema (ET) and weight (EW) changes are described (with dose levels of occurrence
in mg/kg); in the cases of enoxacin lomefloxacin and 8-MOP erythema formation has not been
recorded (n.r.) and ear weight changes are based on one ear (instead of pairs of ears).
e Lymph node weight (LW) and cell count (LC) changes are described (with dose levels of
occurrence in mg/kg).
f Ear weight increase was observed 1 to 6 hours after irradiation, but decreased to baseline already
at 24 hours (Boudon et al., 2013);
this additional investigation was not performed at dose levels above 350 mg/kg (LOAEL).
g During dose finding, a limited number of mice (n = 2) was also treated with 400 and 500
mg/kg/day ketoprofen for 2 days only; these dose levels were toxic; erythema formation was
observed at 500 mg/kg confirming the phototoxic properties of ketoprofen in vivo.

I n t e g r a t e d p r e c l i n i c a l p h o t o s a f e t y t e s t i n g s t r a t e g y f o r s y s t e m i c a l l y a p p l i e d p h a r m a c e u t i c a l | 26
weights) and auricular LN response (increased LN weight and cell count) mostly
occurred concomitantly. As an exception, ketoprofen did not induce skin irritation
or auricular LN response up to 300 mg/kg/day.
However, during a dose-finding phase, a limited number of mice (n = 2) was also
treated with 400 and 500 mg/kg/day ketoprofen. These dose levels were identified
to be toxic, but irradiation-dependent erythema formation was observed at 500
mg/kg/day. Hence, the phototoxic properties of ketoprofen were confirmed in
BALB/C mice. For all six tested reference compounds, in vivo phototoxicity was
dose-dependent.
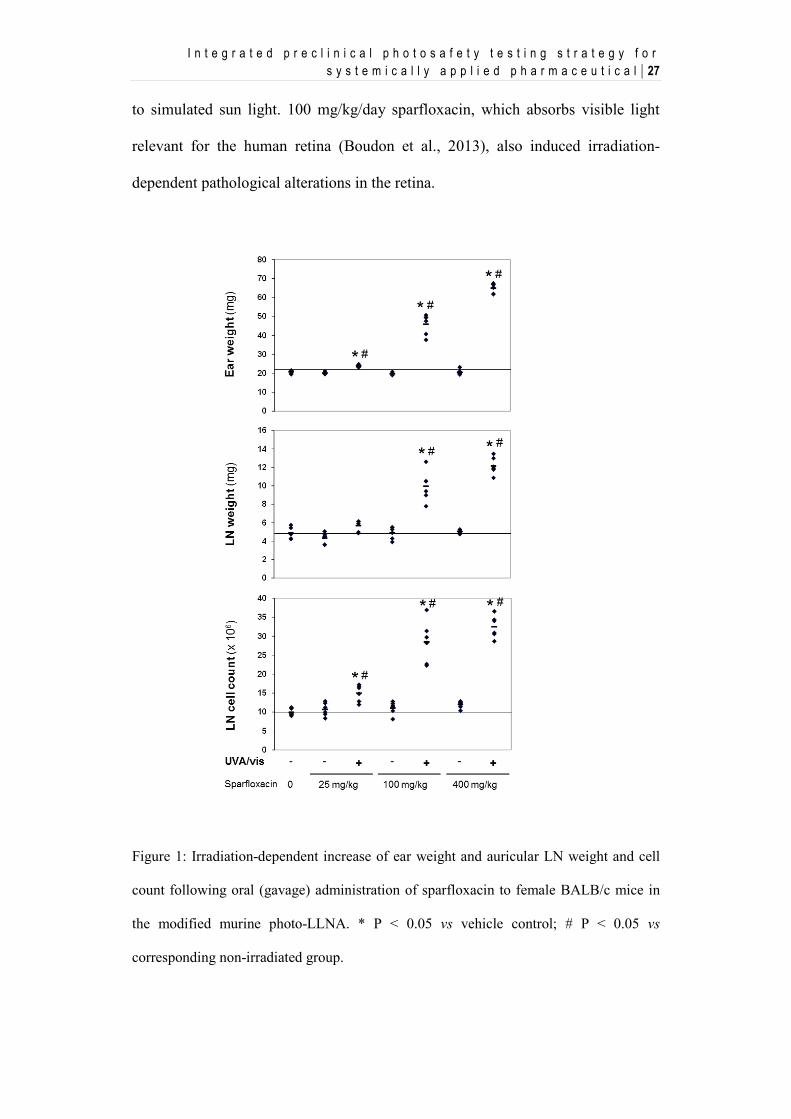
As shown as an example in Figure 1, sparfloxacin induced weak signs of
irradiation-dependent ear skin irritation (increase of ear biopsy weights) and a LN
response (increase of auricular LN cell counts) in the modified murine photo-
LLNA at 25 mg/kg/day, establishing the lowest-observed-adverse-effect-level
(LOAEL) with regard to phototoxicity. At 100 and 150 mg/kg/day sparfloxacin,
all quantitatively determined parameters (ear biopsy weight, auricular LN weight
and cell count) were dose-dependently and statistically significantly increased
depending on additional exposure to simulated sun light. Due to the robust
response, 100 mg/kg/day sparfloxacin was chosen as standard positive control
item in further studies using the modified murine photo-LLNA for systemically
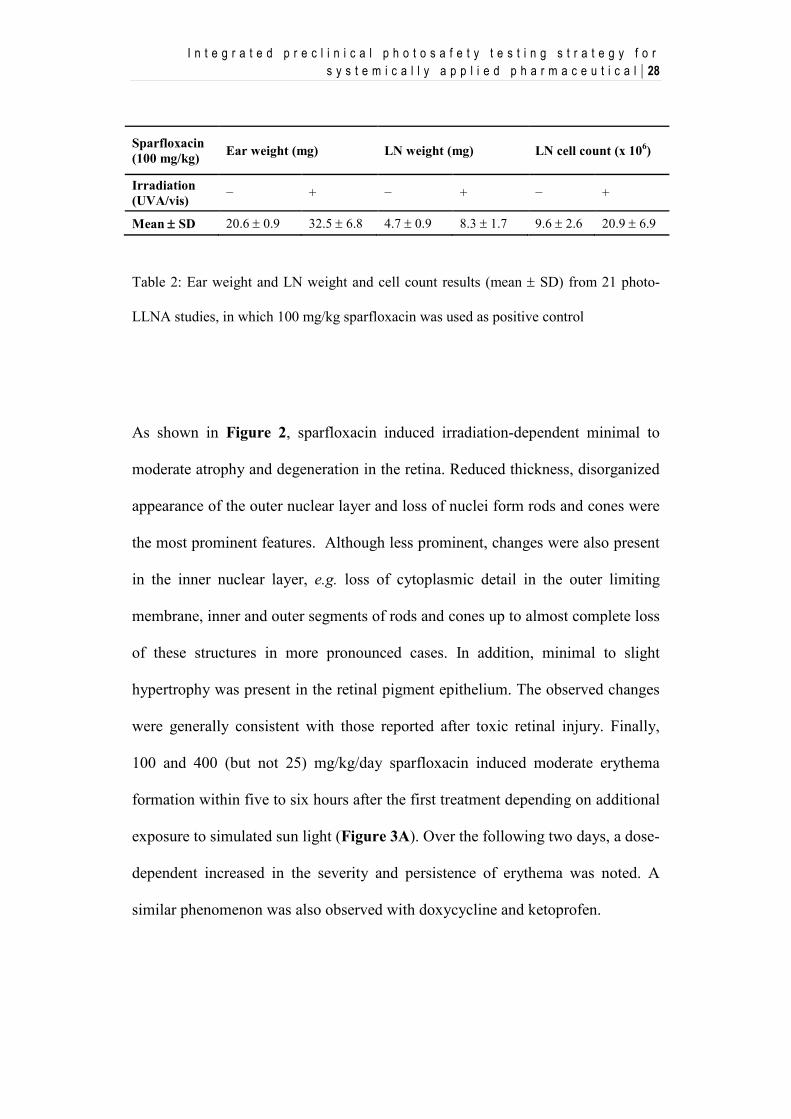
applied drug candidates. The mean values and standard deviations of
sparfloxacin/irradiation-induced ear biopsy weight as well as auricular LN weight
and cell count changes derived from 21 studies, in which sparfloxacin was used as
the positive control item, are described in Table 2. On average, ear biopsy
weights increased by a factor of 1.58, auricular LN weights by a factor of 1.77,
and auricular LN cell counts by a factor of 2.18, depending on additional exposure
I n t e g r a t e d p r e c l i n i c a l p h o t o s a f e t y t e s t i n g s t r a t e g y f o r s y s t e m i c a l l y a p p l i e d p h a r m a c e u t i c a l | 27
to simulated sun light. 100 mg/kg/day sparfloxacin, which absorbs visible light
relevant for the human retina (Boudon et al., 2013), also induced irradiation-
dependent pathological alterations in the retina.
Figure 1: Irradiation-dependent increase of ear weight and auricular LN weight and cell
count following oral (gavage) administration of sparfloxacin to female BALB/c mice in
the modified murine photo-LLNA. * P < 0.05 vs vehicle control; # P < 0.05 vs
corresponding non-irradiated group.
I n t e g r a t e d p r e c l i n i c a l p h o t o s a f e t y t e s t i n g s t r a t e g y f o r s y s t e m i c a l l y a p p l i e d p h a r m a c e u t i c a l | 28
Table 2: Ear weight and LN weight and cell count results (mean ± SD) from 21 photo-
LLNA studies, in which 100 mg/kg sparfloxacin was used as positive control
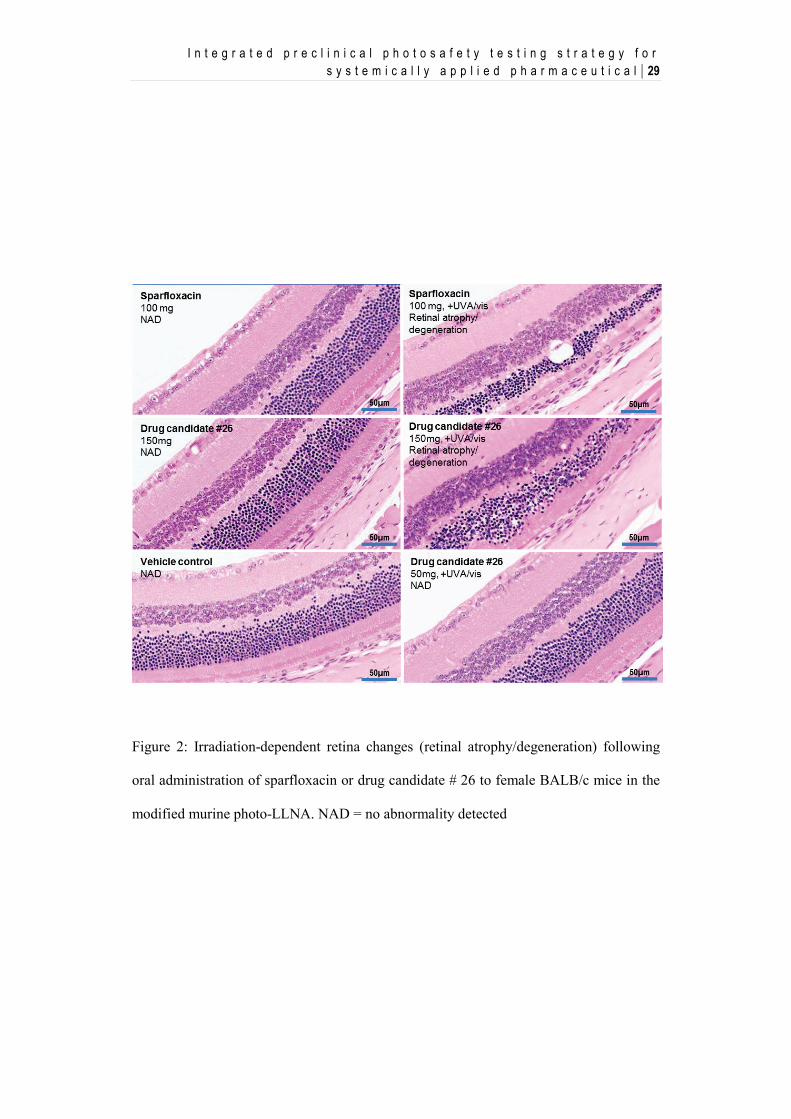
As shown in Figure 2, sparfloxacin induced irradiation-dependent minimal to
moderate atrophy and degeneration in the retina. Reduced thickness, disorganized
appearance of the outer nuclear layer and loss of nuclei form rods and cones were
the most prominent features. Although less prominent, changes were also present
in the inner nuclear layer, e.g. loss of cytoplasmic detail in the outer limiting
membrane, inner and outer segments of rods and cones up to almost complete loss
of these structures in more pronounced cases. In addition, minimal to slight
hypertrophy was present in the retinal pigment epithelium. The observed changes
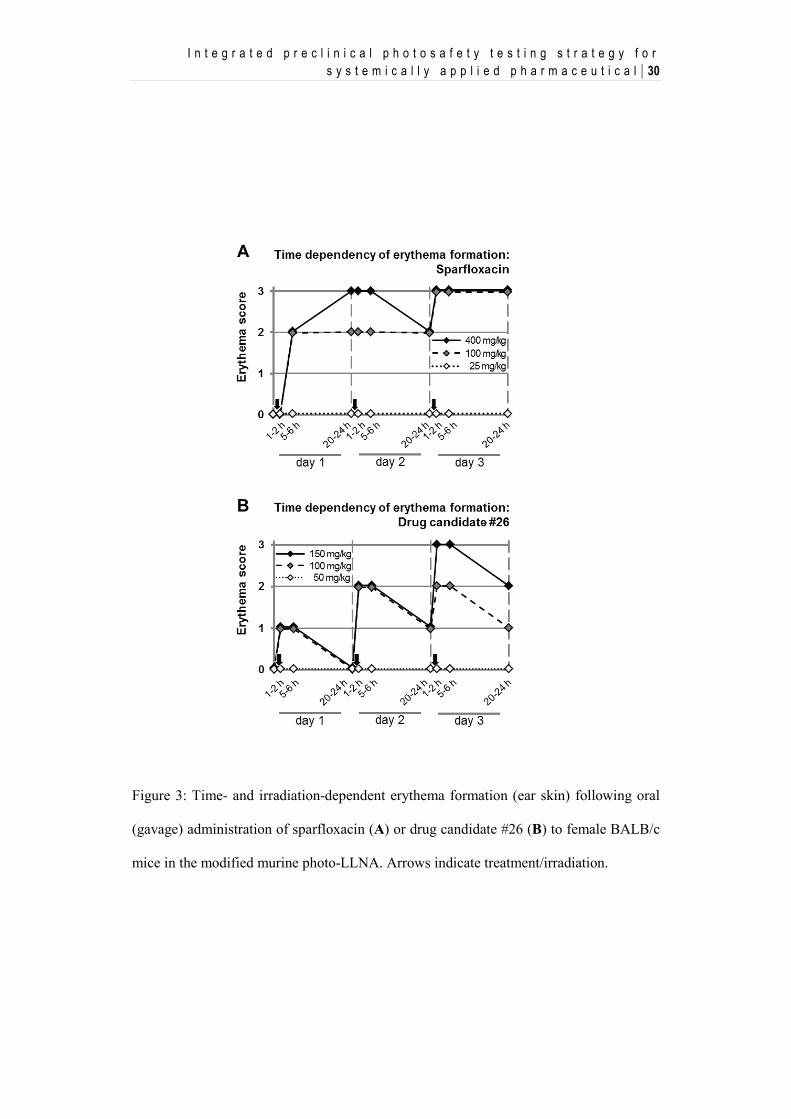
were generally consistent with those reported after toxic retinal injury. Finally,
100 and 400 (but not 25) mg/kg/day sparfloxacin induced moderate erythema
formation within five to six hours after the first treatment depending on additional
exposure to simulated sun light (Figure 3A). Over the following two days, a dose-
dependent increased in the severity and persistence of erythema was noted. A
similar phenomenon was also observed with doxycycline and ketoprofen.
Sparfloxacin (100 mg/kg) Ear weight (mg) LN weight (mg) LN cell count (x 106)
Irradiation (UVA/vis) − + − + − +
Mean ± SD 20.6 ± 0.9 32.5 ± 6.8 4.7 ± 0.9 8.3 ± 1.7 9.6 ± 2.6 20.9 ± 6.9
I n t e g r a t e d p r e c l i n i c a l p h o t o s a f e t y t e s t i n g s t r a t e g y f o r s y s t e m i c a l l y a p p l i e d p h a r m a c e u t i c a l | 29
Figure 2: Irradiation-dependent retina changes (retinal atrophy/degeneration) following
oral administration of sparfloxacin or drug candidate # 26 to female BALB/c mice in the
modified murine photo-LLNA. NAD = no abnormality detected
I n t e g r a t e d p r e c l i n i c a l p h o t o s a f e t y t e s t i n g s t r a t e g y f o r s y s t e m i c a l l y a p p l i e d p h a r m a c e u t i c a l | 30
Figure 3: Time- and irradiation-dependent erythema formation (ear skin) following oral
(gavage) administration of sparfloxacin (A) or drug candidate #26 (B) to female BALB/c
mice in the modified murine photo-LLNA. Arrows indicate treatment/irradiation.
I n t e g r a t e d p r e c l i n i c a l p h o t o s a f e t y t e s t i n g s t r a t e g y f o r s y s t e m i c a l l y a p p l i e d p h a r m a c e u t i c a l | 31
2.3.2. Drug candidates in the modified murine systemic
photo-LLNA
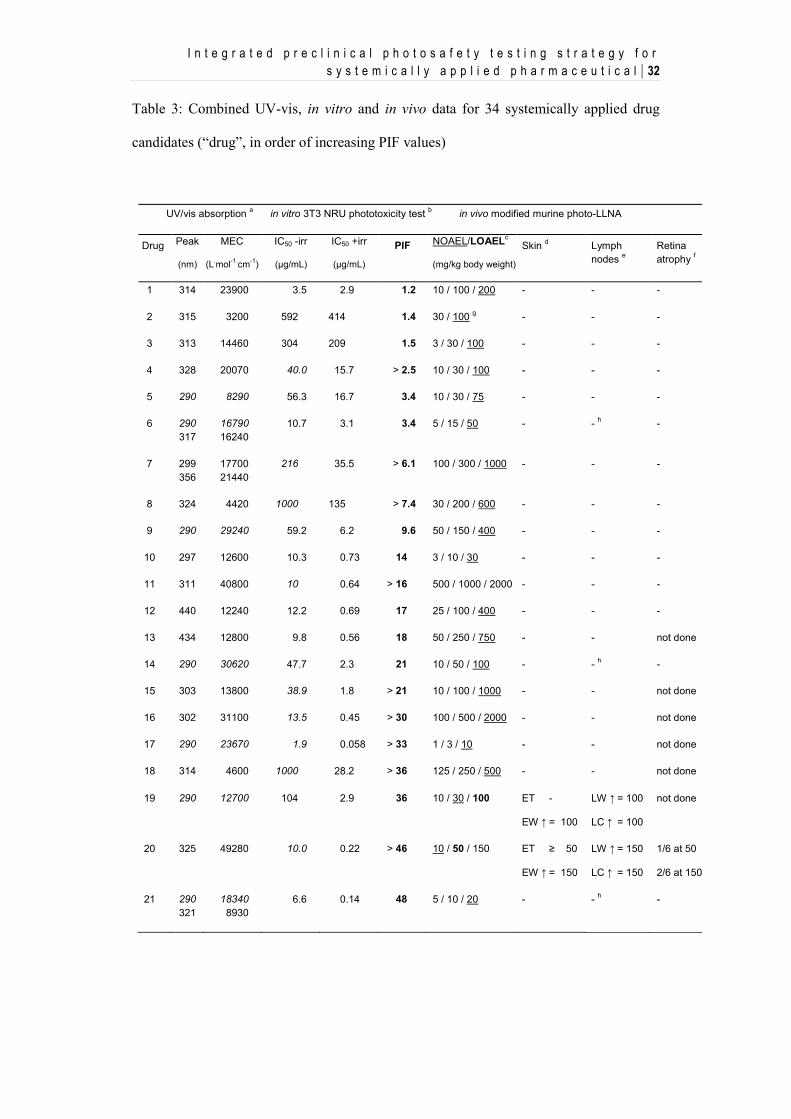
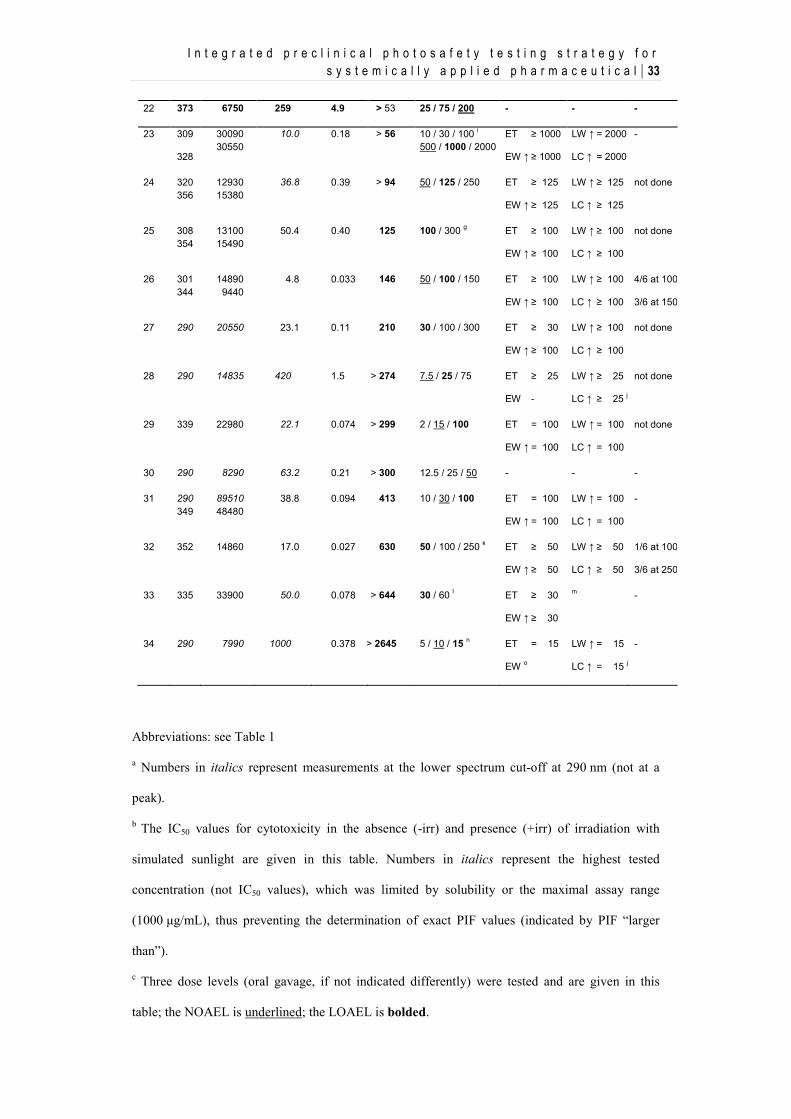
The UV-vis absorption spectra of 34 systemically applied drug candidates were
recorded and analyzed to identify absorption peaks with associated molar
extinction coefficients (MEC) and to assess the need and relevance of retina
evaluation due to residual absorption of visible light, which is relevant for the
human retina (Table 3). The phototoxic potential of these drug candidates was
determined in vitro with the 3T3 NRU test and in vivo with the optimized
modified murine photo-LLNA. Out of the 34 drug candidates, three had a PIF < 2
(“not phototoxic”), three had a PIF between 2 and 5 (“probably phototoxic”), and
28 had a PIF > 5 (“phototoxic”). As shown in Table 3, all 17 drug candidates with
a PIF up to at least 33 did not show a phototoxic potential in the in vivo assay.
Furthermore, the probability for a drug candidate to cause phototoxicity in vivo
correlated with the magnitude of the phototoxicity identified in vitro. 76 % of all
tested drug candidates with a PIF ≥ 36 and 92% of all drug candidates with a PIF
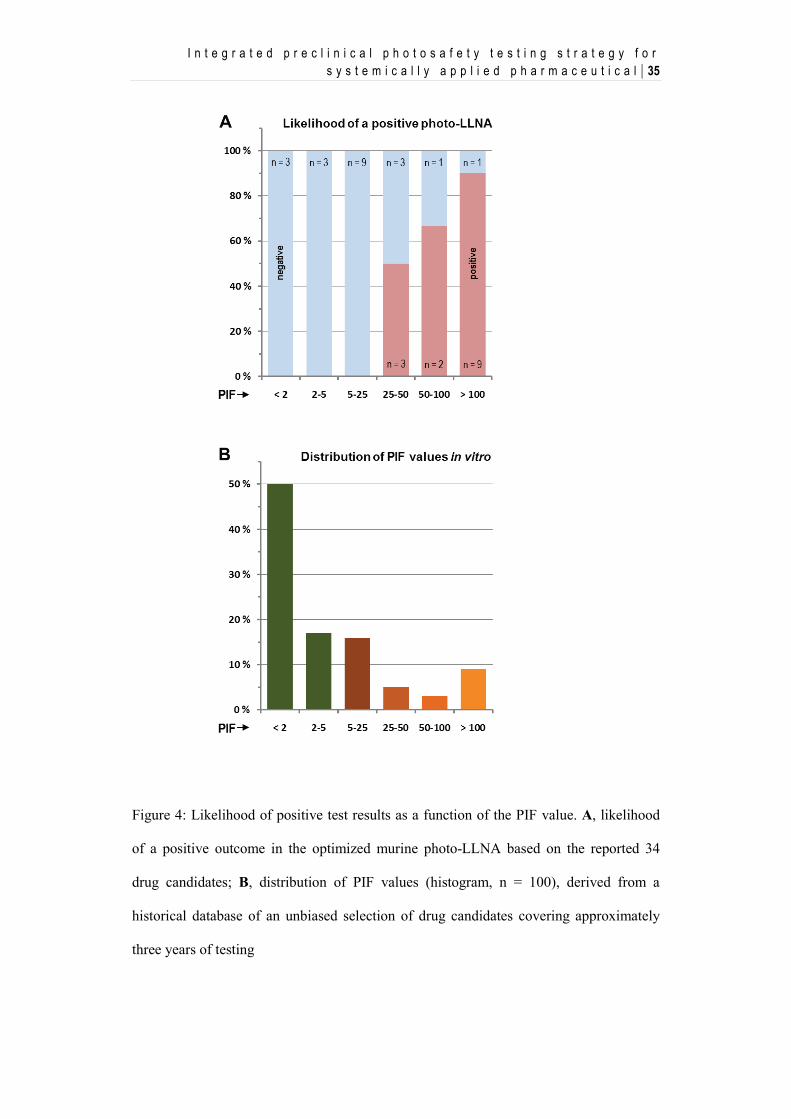
≥ 56 showed a phototoxic potential in the in vivo assay. Figure 4A shows the
frequencies of compounds identified as phototoxic in vivo relative to in vitro PIF
(categorized). Figure 4B shows the categorized distribution of PIF values
(histogram, n = 100), derived from a historical database of an unbiased selection
of drug candidates covering approximately three years.
I n t e g r a t e d p r e c l i n i c a l p h o t o s a f e t y t e s t i n g s t r a t e g y f o r s y s t e m i c a l l y a p p l i e d p h a r m a c e u t i c a l | 32
Table 3: Combined UV-vis, in vitro and in vivo data for 34 systemically applied drug
candidates (“drug”, in order of increasing PIF values)
UV/vis absorption a in vitro 3T3 NRU phototoxicity test b in vivo modified murine photo-LLNA
Drug
Peak
(nm)
MEC
(L.mol-1.cm-1)
IC50 -irr
(μg/mL)
IC50 +irr
(μg/mL)
PIF
NOAEL/LOAELc
(mg/kg body weight)
Skin d
Lymph nodes e
Retina atrophy f
1 314 23900 3.5 2.9 1.2 10 / 100 / 200 - - -
2 315 3200 592 414 1.4 30 / 100 g - - -
3 313 14460 304 209 1.5 3 / 30 / 100 - - -
4 328 20070 40.0 15.7 > 2.5 10 / 30 / 100 - - -
5 290 8290 56.3 16.7 3.4 10 / 30 / 75 - - -
6 290 317
16790 16240
10.7 3.1 3.4 5 / 15 / 50 - - h -
7 299 356
17700 21440
216 35.5 > 6.1 100 / 300 / 1000 - - -
8 324 4420 1000 135 > 7.4 30 / 200 / 600 - - -
9 290 29240 59.2 6.2 9.6 50 / 150 / 400 - - -
10 297 12600 10.3 0.73 14 3 / 10 / 30 - - -
11 311 40800 10 0.64 > 16 500 / 1000 / 2000 - - -
12 440 12240 12.2 0.69 17 25 / 100 / 400 - - -
13 434 12800 9.8 0.56 18 50 / 250 / 750 - - not done
14 290 30620 47.7 2.3 21 10 / 50 / 100 - - h -
15 303 13800 38.9 1.8 > 21 10 / 100 / 1000 - - not done
16 302 31100 13.5 0.45 > 30 100 / 500 / 2000 - - not done
17 290 23670 1.9 0.058 > 33 1 / 3 / 10 - - not done
18 314 4600 1000 28.2 > 36 125 / 250 / 500 - - not done
19 290 12700 104 2.9 36 10 / 30 / 100 ET -
EW ↑ = 100
LW ↑ = 100
LC ↑ = 100
not done
20 325 49280 10.0 0.22 > 46 10 / 50 / 150 ET ≥ 50
EW ↑ = 150
LW ↑ = 150
LC ↑ = 150
1/6 at 50
2/6 at 150
21 290 321
18340 8930
6.6 0.14 48 5 / 10 / 20 - - h -
I n t e g r a t e d p r e c l i n i c a l p h o t o s a f e t y t e s t i n g s t r a t e g y f o r s y s t e m i c a l l y a p p l i e d p h a r m a c e u t i c a l | 33
22 373 6750 259 4.9 > 53 25 / 75 / 200 - - -
23 309
328
30090 30550
10.0 0.18 > 56 10 / 30 / 100 i 500 / 1000 / 2000
ET ≥ 1000
EW ↑ ≥ 1000
LW ↑ = 2000
LC ↑ = 2000
-
24 320 356
12930 15380
36.8 0.39 > 94 50 / 125 / 250 ET ≥ 125
EW ↑ ≥ 125
LW ↑ ≥ 125
LC ↑ ≥ 125
not done
25 308 354
13100 15490
50.4 0.40 125 100 / 300 g ET ≥ 100
EW ↑ ≥ 100
LW ↑ ≥ 100
LC ↑ ≥ 100
not done
26 301 344
14890 9440
4.8 0.033 146 50 / 100 / 150 ET ≥ 100
EW ↑ ≥ 100
LW ↑ ≥ 100
LC ↑ ≥ 100
4/6 at 100
3/6 at 150
27 290
20550 23.1 0.11 210 30 / 100 / 300 ET ≥ 30
EW ↑ ≥ 100
LW ↑ ≥ 100
LC ↑ ≥ 100
not done
28 290 14835 420 1.5 > 274 7.5 / 25 / 75 ET ≥ 25
EW -
LW ↑ ≥ 25
LC ↑ ≥ 25 j
not done
29 339 22980 22.1 0.074 > 299 2 / 15 / 100 ET = 100
EW ↑ = 100
LW ↑ = 100
LC ↑ = 100
not done
30 290 8290 63.2 0.21 > 300 12.5 / 25 / 50 - - -
31 290 349
89510 48480
38.8 0.094 413 10 / 30 / 100 ET = 100
EW ↑ = 100
LW ↑ = 100
LC ↑ = 100
-
32 352 14860 17.0 0.027 630 50 / 100 / 250 k ET ≥ 50
EW ↑ ≥ 50
LW ↑ ≥ 50
LC ↑ ≥ 50
1/6 at 100
3/6 at 250
33 335 33900 50.0 0.078 > 644 30 / 60 l ET ≥ 30
EW ↑ ≥ 30
m -
34 290 7990 1000 0.378 > 2645 5 / 10 / 15 n ET = 15
EW o
LW ↑ = 15
LC ↑ = 15 j
-
Abbreviations: see Table 1
a Numbers in italics represent measurements at the lower spectrum cut-off at 290 nm (not at a
peak).
b The IC50 values for cytotoxicity in the absence (-irr) and presence (+irr) of irradiation with
simulated sunlight are given in this table. Numbers in italics represent the highest tested
concentration (not IC50 values), which was limited by solubility or the maximal assay range
(1000 μg/mL), thus preventing the determination of exact PIF values (indicated by PIF “larger
than”).
c Three dose levels (oral gavage, if not indicated differently) were tested and are given in this
table; the NOAEL is underlined; the LOAEL is bolded.
I n t e g r a t e d p r e c l i n i c a l p h o t o s a f e t y t e s t i n g s t r a t e g y f o r s y s t e m i c a l l y a p p l i e d p h a r m a c e u t i c a l | 34
d Ear skin erythema (ET) and weight (EW) changes are described (with dose levels of occurrence
in mg/kg).
e Lymph node weight (LW) and cell count (LC) changes are described (with dose levels of
occurrence in mg/kg).
f Incidences at indicated dose levels (in mg/kg) are described
g 300 mg/kg/day (drug candidate # 2) / 900 mg/kg/day (drug candidate # 25) toxic (terminated
ahead of schedule).
h At 50 mg/kg/day (drug candidate # 6) / 100 mg/kg/day (drug candidate # 14) / all dose levels
(drug candidate # 21), UV/vis-independent decrease of lymph node parameters.
i In a first murine photo-LLNA study, dose levels of 10, 30, and 100 mg/kg/day were tested with
no ear, lymph node, or retina finding.
j Auricular lymph node hyperplasia also in the absence of irradiation at 75 mg/kg/day (drug
candidate # 28) / 15 mg/kg/day (drug candidate # 34), making interpretation difficult.
k No irradiation on day 3 due to persisting skin reactions.
l Only two dose levels tested.
m Reversal of auricular lymph node hypoplasia induced by drug candidate # 33 at ≥ 30 mg/kg/day.
n intravenous administration (all three dose levels)
o Drug candidate # 34 induced increased ear weights in the absence of UV/vis irradiation with no
clear effect of UV/vis irradiation on this parameter.
I n t e g r a t e d p r e c l i n i c a l p h o t o s a f e t y t e s t i n g s t r a t e g y f o r s y s t e m i c a l l y a p p l i e d p h a r m a c e u t i c a l | 35
Figure 4: Likelihood of positive test results as a function of the PIF value. A, likelihood
of a positive outcome in the optimized murine photo-LLNA based on the reported 34
drug candidates; B, distribution of PIF values (histogram, n = 100), derived from a
historical database of an unbiased selection of drug candidates covering approximately
three years of testing
I n t e g r a t e d p r e c l i n i c a l p h o t o s a f e t y t e s t i n g s t r a t e g y f o r s y s t e m i c a l l y a p p l i e d p h a r m a c e u t i c a l | 36
The majority of drug candidates (67 %) had a PIF below 5 and was not considered
phototoxic in vitro. Moreover, 83 % of all candidates had PIF values below 25,
while 8 % of drug candidates showed PIF values between 25 and 100, and further
9 % of drug candidates were highly phototoxic in vitro (PIF > 100).
In most cases, signs of ear skin irritation (erythema and/or increased ear biopsy
weights) and auricular LN response (increased LN weight and cell count)
occurred together. As exceptions, drug candidates # 20, 23, and 27 were
characterized by a high sensitivity to irradiation-dependent skin reactions,
particularly erythema formation. These started to occur at dose levels, at which
local LNs were not responding yet. The most severe case of phototoxicity in vivo
was associated with drug candidate # 32, characterized by a PIF of 630. In the
modified murine photo-LLNA for this orally applied drug candidate, exposure to
simulated sun light was not done on day 3 because of persisting
compound/irradiation-induced skin reactions.
The use of three dose levels in the modified murine photo-LLNA enabled the
establishment of NOAELs and/or LOAELs. As an example, the results of the in
vivo testing of drug candidate # 26 are shown in Figure 5 (ear weight and
auricular LN responses), Figure 2 (eye histopathology), and 3B (erythema
formation). No significant ear, LN, or eye response was observed at
50 mg/kg/day, representing the NOAEL with regard to phototoxicity. Irradiation-
dependent ear irritation (erythema formation, increased ear biopsy weights),
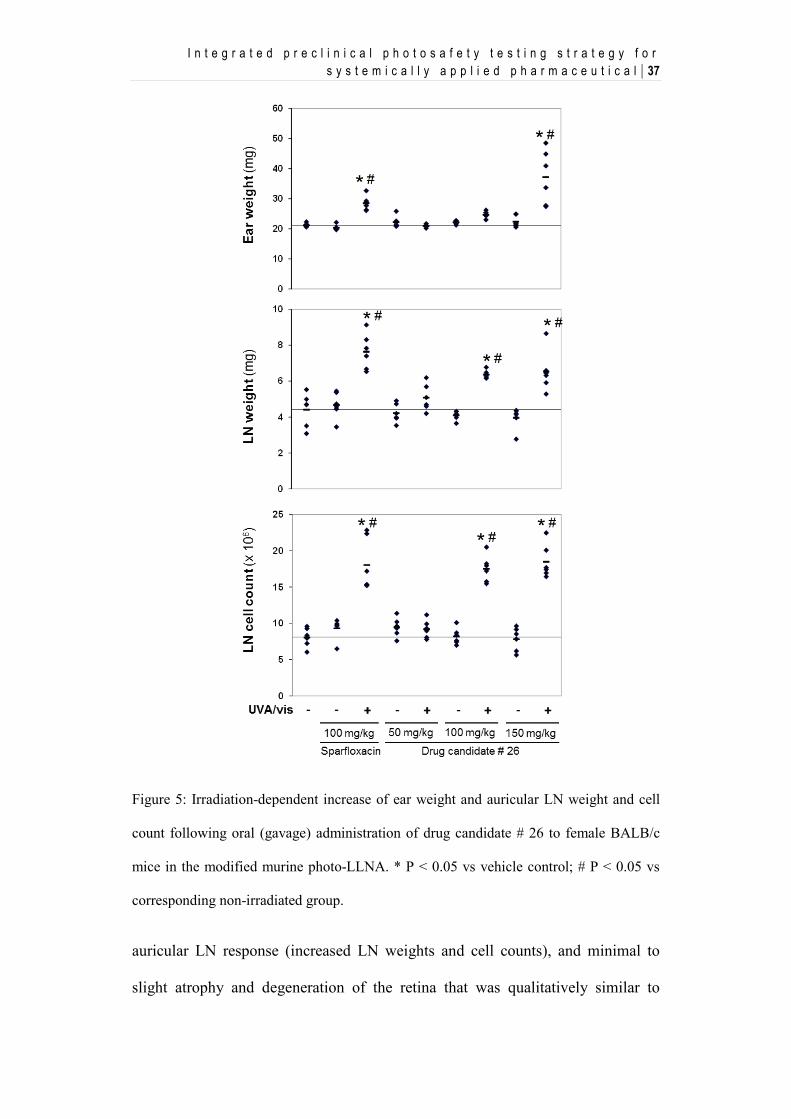
I n t e g r a t e d p r e c l i n i c a l p h o t o s a f e t y t e s t i n g s t r a t e g y f o r s y s t e m i c a l l y a p p l i e d p h a r m a c e u t i c a l | 37
Figure 5: Irradiation-dependent increase of ear weight and auricular LN weight and cell
count following oral (gavage) administration of drug candidate # 26 to female BALB/c
mice in the modified murine photo-LLNA. * P < 0.05 vs vehicle control; # P < 0.05 vs
corresponding non-irradiated group.
auricular LN response (increased LN weights and cell counts), and minimal to
slight atrophy and degeneration of the retina that was qualitatively similar to
I n t e g r a t e d p r e c l i n i c a l p h o t o s a f e t y t e s t i n g s t r a t e g y f o r s y s t e m i c a l l y a p p l i e d p h a r m a c e u t i c a l | 38
changes observed with sparfloxacin and irradiation, became apparent at
100 mg/kg/day (LOAEL) and 150 mg/kg/day. As for sparfloxacin, also in the case
of drug candidate # 26 and other drug candidates showing a phototoxic potential
in vivo, irradiation-dependent erythema formation increased over the treatment
period dose-dependently.
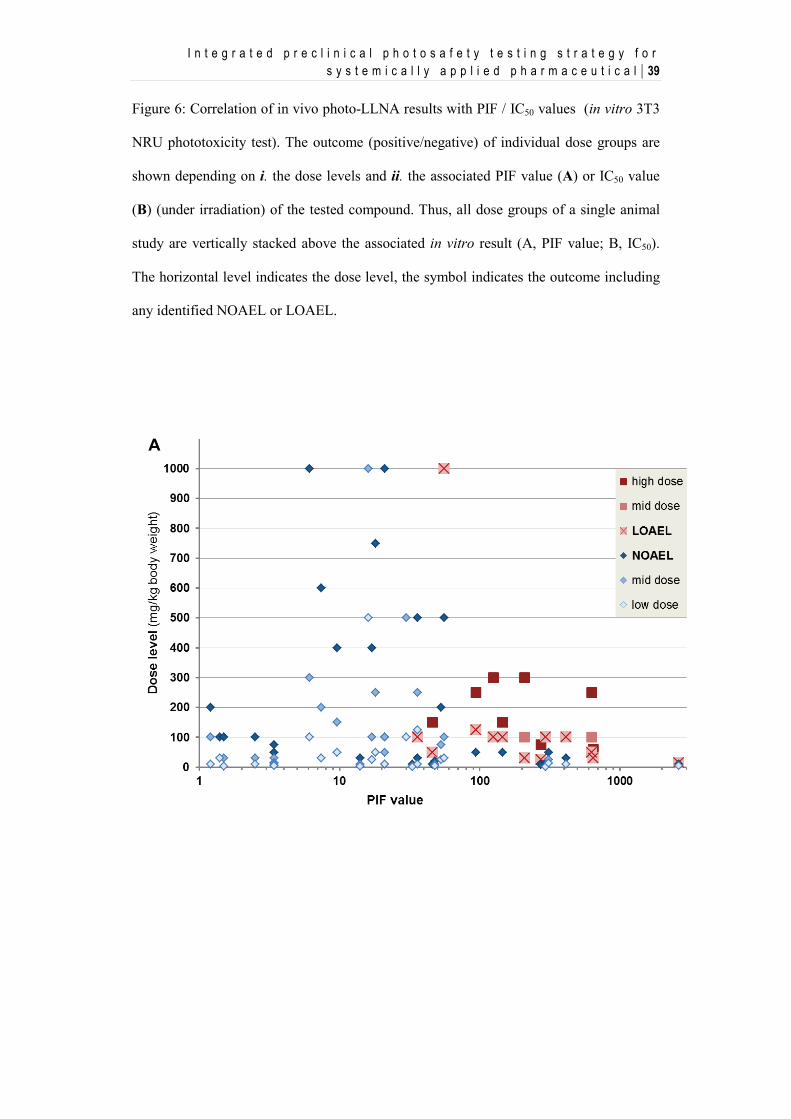
Figure 6A shows the correlation of the in vivo photo-LLNA results with the PIFs
of the in vitro 3T3 NRU phototoxicity test results. With the exception of
compound # 23, the LOAEL for all drug candidates identified as phototoxic in the
photo-LLNA was ≤ 125 mg/kg/day. Among the 12 drug candidates with a PIF ≥
56, the only drug candidate that did not show a phototoxic potential was
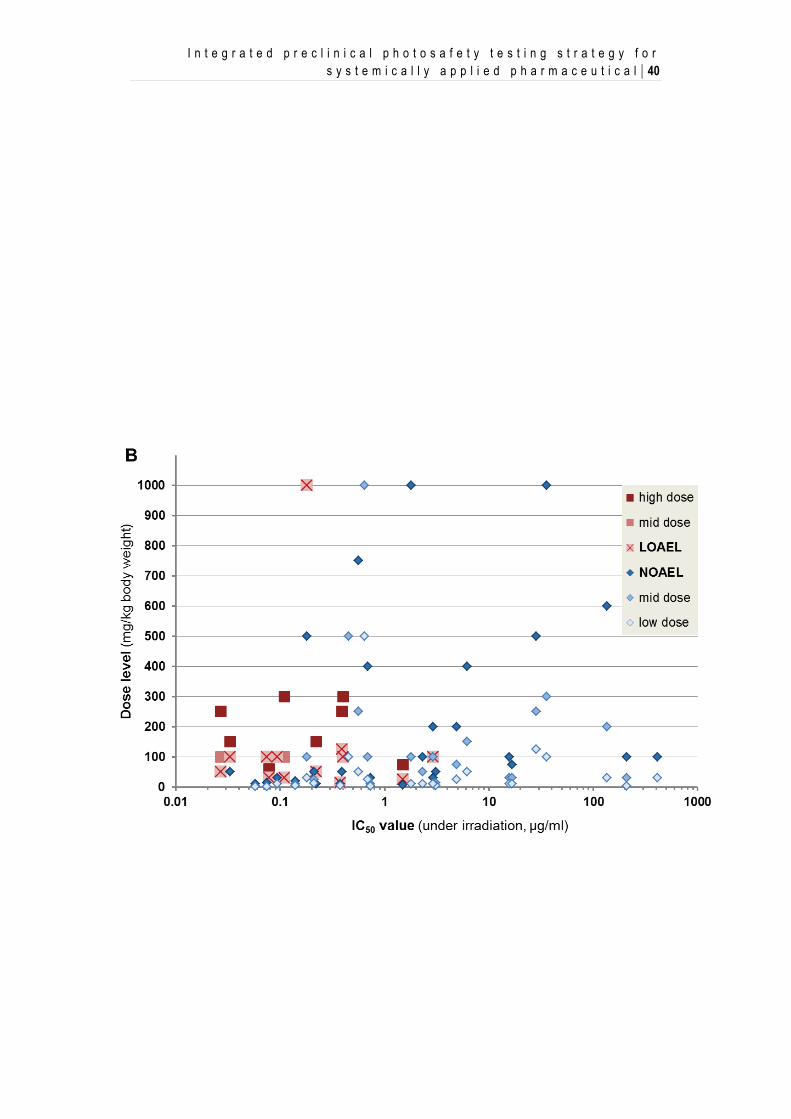
compound # 30, which was tested only up to 50 mg/kg/day. Figure 6B shows the
correlation of the in vivo photo-LLNA results with the IC50 values of the 3T3
NRU test results. The probability to cause phototoxicity in vivo was higher for
drug candidates with low IC50 values. Out of all 24 tested drug candidates with an
IC50 value < 3 μM, 13 candidates (= 54 %), and out of all 8 tested drug candidates
with an IC50 value < 0.2 μM, 7 candidates (= 88 %) showed a phototoxic potential
in the in vivo assay.
I n t e g r a t e d p r e c l i n i c a l p h o t o s a f e t y t e s t i n g s t r a t e g y f o r s y s t e m i c a l l y a p p l i e d p h a r m a c e u t i c a l | 39
Figure 6: Correlation of in vivo photo-LLNA results with PIF / IC50 values (in vitro 3T3
NRU phototoxicity test). The outcome (positive/negative) of individual dose groups are
shown depending on i. the dose levels and ii. the associated PIF value (A) or IC50 value
(B) (under irradiation) of the tested compound. Thus, all dose groups of a single animal
study are vertically stacked above the associated in vitro result (A, PIF value; B, IC50).
The horizontal level indicates the dose level, the symbol indicates the outcome including
any identified NOAEL or LOAEL.
I n t e g r a t e d p r e c l i n i c a l p h o t o s a f e t y t e s t i n g s t r a t e g y f o r s y s t e m i c a l l y a p p l i e d p h a r m a c e u t i c a l | 40
I n t e g r a t e d p r e c l i n i c a l p h o t o s a f e t y t e s t i n g s t r a t e g y f o r s y s t e m i c a l l y a p p l i e d p h a r m a c e u t i c a l | 41
2.4. Discussion
The clinically relevant phototoxic compounds sparfloxacin, enoxacin,
lomefloxacin, doxycycline, 8-MOP and vemurafenib were reliably identified as
phototoxic in the herein described optimized modified murine photo-LLNA.
These results are in alignment with previous studies including sparfloxacin,
enoxacin, lomefloxacin, and 8-MOP in similar in vivo murine phototoxicity assays
(Matsumoto et al., 2010; Neumann et al., 2005; Vohr et al., 2001). However,
whereas enoxacin has been described to exclusively induce irradiation-dependent
LN responses but no increase in ear thickness (Vohr et al., 2001), it induced a
statistically significant increase of ear biopsy weights in addition to LN responses
in our study using the optimized modified murine oral (gavage) photo-LLNA at
the same dose level. Furthermore, whereas 8-MOP has been described to induce
phototoxicity at 10 mg/kg/day (Neumann et al., 2005; Vohr et al., 2001), 10
mg/kg/day represented the NOAEL and 20 mg/kg/day the LOAEL in our study.
Differences in the mouse strain and/or irradiation conditions may explain these
differences. Additionally, differences in the chosen endpoints (ear biopsy weight
vs ear thickness) may have contributed to the described differences regarding
irradiation-dependent ear skin reactions to enoxacin. The in vivo phototoxic
potential of systemically applied ketoprofen could only be identified based on
erythema formation at the toxic dose level of 500 mg/kg/day. Clinically,
ketoprofen is well known as a phototoxic compound upon topical application
(Bagheri et al., 2000). However, only anecdotal cases of ketoprofen-induced
phototoxicity upon systemic application have been reported (Foti et al., 2011).
Therefore, the modified murine photo-LLNA confirmed the relatively weak
potential of ketoprofen to induce phototoxicity upon systemic treatment and
I n t e g r a t e d p r e c l i n i c a l p h o t o s a f e t y t e s t i n g s t r a t e g y f o r s y s t e m i c a l l y a p p l i e d p h a r m a c e u t i c a l | 42
emphasizes the clinically observed difference of ketoprofen-associated
phototoxicity risks following topical vs systemic administration. Promethazine,
another clinically phototoxic compound upon topical application (Sidi et al.,
1955), did not show a phototoxic potential in the modified murine photo-LLNA
up to the maximally tolerated dose of 100 mg/kg/day (data not shown). It should
be noted that incidence and relevance of phototoxicity seen clinically after oral
administration of promethazine remains unclear as well, even though such cases
have been reported occasionally (e.g. Epstein and Rowe, 1957; Newill, 1960).
Compared to other phenothiazine derivatives the in vitro phototoxicity potential of
promethazine is slightly below chlorpromazine (photo-hemolysis test, Eberlein-
König et al., 1997; in vitro 3T3 NRU, in-house data, not shown). However, in
mice promethazine showed hardly any phototoxicity reaction after intraperitoneal
administration, while chlorpromazine was clearly positive (Ljunggren and Möller,
1977), thus confirming an overall low phototoxicitiy potential after systemic
administration.
Sparfloxacin at a dose of 100 mg/kg/day was chosen as standard positive control
item in further murine photo-LLNA studies for drug candidates. This reference
compound absorbs visible light in addition to UV light so that it also represents a
relevant reference compound with regard to retinal phototoxicity. Indeed,
sparfloxacin did not only reliably induce irradiation-dependent local ear irritation
and an auricular LN response, but also retina atrophy, a strongly adverse
phototoxic effect relevant for systemically applied compounds which absorb light
above 400 nm. Histopathological evaluation of the retina for systemically applied
compounds absorbing light at > 400 nm represents an important endpoint of the
optimized modified murine photo-LLNA.
I n t e g r a t e d p r e c l i n i c a l p h o t o s a f e t y t e s t i n g s t r a t e g y f o r s y s t e m i c a l l y a p p l i e d p h a r m a c e u t i c a l | 43
For lomefloxacin (Matsumoto et al, 2010) as well as for sparfloxacin,
doxycycline, ketoprofen, and several drug candidates showing a phototoxic
potential in the modified murine photo-LLNA, irradiation-dependent erythema
formation increased over the treatment period dose-dependently. This strongly
argues for the general need of multiple treatment days rather than only one for in
vivo systemic phototoxicity testing. The three-day treatment as used here for the
modified murine photo-LLNA appears to be appropriate.
In vivo phototoxicity is a dose-dependent effect. In addition, photosafety
assessment may not only consider the phototoxic potential of a drug candidate but
also the relevance for the therapeutic treatment. Therefore, inclusion of multiple
dose levels in the in vivo phototoxicity test, considering the maximal tolerated and
pharmacologically efficacious dose levels with the aim to identify NOAELs
and/or LOAELs and potential safety margins versus therapeutically relevant drug
levels, is important. Since exposure to simulated sun light is done for a limited
period of time, determination of drug exposure at the time of irradiation is
considered to be relevant for photosafety assessment. Overall, the results obtained
with the clinically relevant reference compounds convincingly demonstrate the
general suitability of the selected study design including irradiation conditions and
endpoints which are in line with current regulatory recommendations (ICH S10,
2013).
An in vitro – in vivo correlation demonstrated that a drug candidate classified as
“phototoxic” in vitro based on the 3T3 NRU test is not necessarily phototoxic in
vivo. However, the probability of a drug candidate to cause phototoxicity in vivo
clearly correlated with the magnitude of the phototoxicity identified in vitro. This
I n t e g r a t e d p r e c l i n i c a l p h o t o s a f e t y t e s t i n g s t r a t e g y f o r s y s t e m i c a l l y a p p l i e d p h a r m a c e u t i c a l | 44
has implications on the preclinical in vivo photosafety testing strategy. For
example, none of the 15 tested drug candidates, which were characterized by a
PIF < 25 showed a phototoxic potential in the modified murine systemic photo-
LLNA. Since based on historical data 83 % of all drug candidates fell into this
category, in vivo efforts early in drug development may primarily focus on the
17 % of drug candidates with a PIF > 25, which were associated with a probability
of 68 % to show a phototoxic potential in vivo. Most strikingly, this probability
increased to 90 % for drug candidates with a PIF > 100. It should be noted that
due to inter-laboratory differences regarding the in vitro 3T3 NRU phototoxicity
test, the mentioned PIF threshold of 25 may not be applicable to other
laboratories. Thus, corresponding PIF thresholds need to be identified by
laboratories individually.
I n t e g r a t e d p r e c l i n i c a l p h o t o s a f e t y t e s t i n g s t r a t e g y f o r s y s t e m i c a l l y a p p l i e d p h a r m a c e u t i c a l | 45
2.5. Conclusion
Taken together, the modified murine photo-LLNA, based on quantification of skin
irritation (erythema, ear biopsy weight) and auricular LN weight and cell count, is
suitable to support preclinical photosafety assessment of systemically applied
drug candidates. For drug candidates absorbing visible light, additional
histopathological analysis of the retina is informative and can thus be
recommended. The observed increase of erythema formation over the treatment
period as well as pharmacokinetic considerations support the need for multiple
treatment days, and a three-day treatment design as used in our study seemed
appropriate. The establishment of NOAELs and LOAELs is supported by the
inclusion of three dose levels. This allows for the calculation of multiples (safety
margin) between non-phototoxic and pharmacologically relevant drug levels in
order to determine therapeutic indices and support human photosafety assessment.
Since the probability for a drug candidate to cause phototoxicity in vivo correlated
with the magnitude of the phototoxicity identified in vitro, further in vivo efforts
early in drug development may primarily focus on drug candidates with PIF
values above a certain threshold. This PIF threshold needs to be defined
individually for each laboratory due to potential inter-laboratory variability, in our
case it is 25. For all other drug candidates identified as phototoxic in vitro, the in
vivo photosafety testing may be delayed to a later time point in drug development.
I n t e g r a t e d p r e c l i n i c a l p h o t o s a f e t y t e s t i n g s t r a t e g y f o r s y s t e m i c a l l y a p p l i e d p h a r m a c e u t i c a l | 46
Acknowledgements
We thank the following Novartis colleagues for their excellent support: W.
Dalcher, P. Scheubel, M. Schneider, and M. Spielmann (technical and
experimental support); J. Boisclair, E. Perentes, and D.R. Roth (pathology
support); D. Brees, M. Kammüller, and U. Plappert-Helbig (scientific support).
References
Bagheri, H., Lhiaubet, V., Montastruc, J.L., Chouini-Lalanne, N., 2000. Photosensitivity
to ketoprofen: mechanisms and pharmacoepidemiological data. Drug Saf. 22, 339-
349.
Bauer, D., Averett, L.A., De Smedt, A., Kleinman, M.H., Muster, W., Pettersen, B.A.,
Robles, C., 2013. Standardized UV-vis spectra as the foundation for a threshold-based,
integrated photosafety evaluation. Regul. Toxicol. Pharmacol., submitted.
Boudon, S.M, Plappert-Helbig, U., Odermatt, A., Bauer, D., 2013. Characterization of
vemurafenib phototoxicity in a mouse model. Toxicol. Sci., doi:
10.1093/toxsci/kft237, first published online: October 23, 2013.
Bjellerup, M., Ljunggren, B., 1994. Differences in phototoxic potency should be
considered when tetracyclines are prescribed during summertime: a study on
doxycycline and lymecycline in human volunteers, using an objective method for
recording erythema. Br. J. Dermatol. 130, 356-360.
Blank, H., Cullen, S.I., Catalano, P.M., 1968. Photosensitivity studies with
demethylchlortetracycline and doxycycline. Arch. Derm. 97, 1-2.
Cohen, J.B., Bergstresser, P.R., 1994. Inadvertent phototoxicity from home tanning
equipment. Arch. Dermatol. 130, 804-806.
I n t e g r a t e d p r e c l i n i c a l p h o t o s a f e t y t e s t i n g s t r a t e g y f o r s y s t e m i c a l l y a p p l i e d p h a r m a c e u t i c a l | 47
Correia, O., Delgado, L., 1994. Bullous photodermatosis after lomefloxacin. Arch.
Dermatol. 130, 808-809.
Dawe, R.S., Ibbotson, S.H., Sanderson, J.B., Thomson, E.M., Ferguson, J., 2003. A
randomzed controlled trial (volunteer study) of sitafloxacin, enoxacin, levofloxacin
and sparfloxacin phototoxicity. Br. J. Dermatol. 149, 1232-1241.
Dillon, J., Zheng, L., Merriam, J.C., Gaillard, E.R., 2000. Transmission spectra of light to
the mammalian retina. Photochem. Photobiol. 71, 225-229.
Drucker, A.M., Rosen, C.F., 2011. Drug-induced photosensitivity. Drug Saf. 34, 821-837.
Eberlein-König, B., Bindl, A., Przybilla, B., 1997. Phototoxic properties of neuroleptic
drugs. Dermatology 194, 131-135.
Epstein, S., Rowe, R.J., 1957. Photoallergy and photocross-sensitivity to phenergan. J.
Invest. Dermatol. 29, 319-326.
Ferguson, J., 2002. Photosensitivity due to drugs. Photodermatol. Photoimmunol.
Photomed. 18, 262-269.
Foti, C., Cassano, N., Vena, G.A., Angelini, G., 2011. Photodermatitis caused by oral
ketoprofen: two case reports. Contact Dermatitis. 64, 181-183.
Frank, G. B. and Jhamandas, K. 1970. Effects of drugs acting alone and in combination
on the motor activity of intact mice. Br. J. Pharmac. 39, 696-706.
Frost, P., Weinstein, G.D., Gomez, E.C., 1972. Phototoxic potential of minocycline and
doxycycline. Arch. Derm. 105, 681-683.
Hamanaka, H., Mizutani, H., Shimizu, M., 1998. Sparfloxacin-induced photosensitivity
and the occurrence of a lichenoid tissue reaction after prolonged exposure. J. Am.
Acad. Dermatol. 38, 945-949.
Homey, B., von Schilling, C., Blümel, J., Schuppe, H.C., Ruzicka, T., Ahr, H.J.,
Lehmann, P., Vohr, H.W., 1998. An integrated model for the differentiation of
chemical-induced allergic and irritant skin reactions. Toxicol. Appl. Pharmacol. 153,
83-94.
I n t e g r a t e d p r e c l i n i c a l p h o t o s a f e t y t e s t i n g s t r a t e g y f o r s y s t e m i c a l l y a p p l i e d p h a r m a c e u t i c a l | 48
ICH Harmonized Tripartite Guidline S10 “Photosafety evaluation of pharmaceuticals”,
2013.
http://www.ich.org/products/guidelines/safety/article/safety-guidelines.html
Izu, R., Gardeazabal, J., González, M., Landa, N., Ratón, J.A., Díaz-Pérez, J.L., 1992.
Enoxacin-induced photosensitivity: study of two cases. Photodermatol.
Photoimmunol. Photomed. 9, 86-88.
Kang, J.S., Kim, T.H., Park, K.B., Chung, B.H., Youn, J.I., 1993. Enoxacin
photosensitivity. Photodermatol. Photoimmunol. Photomed. 9, 159-161.
Lapolla, W., Yentzer, B.A., Bagel, J., Halvorson, C.R., Feldman, S.R., 2011. A review of
phototherapy protocols for psoriasis treatment. J. Am. Acad. Dermatol. 64, 936-949.
Layton, A.M., Cunliffe, W.J., 1993. Phototoxic eruptions due to doxycycline – a dose-
related phenomenon. Clin. Exp. Dermatol. 18, 425-427.
Lei, B., Yao, G., 2006. Spectral attenuation of the mouse, rat, pig and human lenses from
wavelengths 360 nm to 1020 nm. Exp. Eye Res. 83, 610-614.
Lipsky, B.A., Dorr, M.B., Magner, D.J., Talbot, G.H., 1999a. Safety profile of
sparfloxacin, a new fluoroquinolone antibiotic. Clin. Ther. 21, 148-159.
Lipsky, B.A., Miller, B., Schwartz, R., Henry, D.C., Nolan, T., McCabe, A., Magner,
D.J., Talbot, G.H., 1999b. Sparfloxacin versus ciprofloxacin for the treatment of
community-acquired, complicated skin and skin-structure infections. Clin. Ther. 21,
675-690.
Ljunggren, B., Möller, H., 1977. Phenothiazine phototoxicity: an experimental study on
chlorpromazine and related tricyclic drugs. Acta Derm. Venereol. 57, 325-329.
Man, I., Murphy, J., Ferguson, J., 1999. Fluoroquinolone phototoxicity: a comparison of
moxifloxacin and lomefloxacin in normal volunteers. J. Antimicrob. Chemother. 43
(Suppl. B), 77-82.
Matsumoto, N., Akimoto, A, Kawashima, H., Kim, S., 2010. Comparative study of skin
phototoxicity with three drugs by an in vivo mouse model. J. Toxicol. Sci. 35, 97-100.
I n t e g r a t e d p r e c l i n i c a l p h o t o s a f e t y t e s t i n g s t r a t e g y f o r s y s t e m i c a l l y a p p l i e d p h a r m a c e u t i c a l | 49
Moore, E.M., 2002. Drug-induced cutaneous photosensitivity. Drug Saf. 25, 345-372.
Neumann, N.J., Blotz, A., Wasinska-Kempka, G., Rosenbruch, M., Lehmann, P., Ahr,
H.J., Vohr, H.W., 2005. Evaluation of phototoxic and photoallergic potentials of 13
compounds by different in vitro and in vivo methods. J. Photochem. Photobiol. B. 79,
25-34.
Newill, R.G., 1960. Photosensitivity caused by promethazine. Br. Med. J. 30, 359-360.
NIH publication no. 99-4494, 1999. The murine local lymph node assay: a test method
for assessing the allergic contact dermatitis potential of chemicals/compounds.
OECD guideline for testing of chemicals no. 432, 2004. In vitro 3T3 NRU phototoxicity
test.
Pierfitte, C., Royer, R.J., Moore, N., Bégaud, B., 2000. The link between sunshine and
phototoxicity of sparfloxacin. Br. J. Clin. Pharmacol. 49, 609-612.
Sidi, E., Hincky, M., Gervais, A., 1955. Allergic sensitization and photosensitization to
phenergan cream. J. Invest. Dermatol. 24, 345-352.
Sliney, D.H., 2002. How light reaches the eye and its components. Int. J. Toxicol. 21,
501-509.
Ulrich, P., Streich, J., Suter, W., 2001. Intralaboratory validation of alternative endpoints
in the murine local lymph node assay for the identification of contact allergic
potential: primary ear skin irritation and ear-draining lymph node hyperplasia induced
by topical chemicals. Arch. Toxicol. 74, 733-744.
Ulrich, P., Vohr, H.W., 2012. Utilization of irritation data in the local lymph node assay,
in: Wilhelm, K.P., Zhai, H., Maibach, H.I. (Eds.), Dermatotoxicology. Informa
Healthcare, London, pp. 306-312.
Van den Broeck, W., Derore, A., Simoens, P., 2006. Anatomy and nomenclature of
murine lymph nodes: descriptive study and nomenclatory standardization in
BALB/cAnNCrl mice. J. Immunol. Methods 312:12-19.

I n t e g r a t e d p r e c l i n i c a l p h o t o s a f e t y t e s t i n g s t r a t e g y f o r s y s t e m i c a l l y a p p l i e d p h a r m a c e u t i c a l | 50
Vohr, H.W., Blümel, J., Blotz, A., Homey, B., Ahr, H.J., 2001. An intra-laboratory
validation of the integrated model for the differentiation of skin reactions (IMDS):
discrimination between (photo)allergic and (photo)irritant skin reactions in mice.
Arch. Toxicol. 73, 501-509.
C h a r a c t e r i z a t i o n o f V e m u r a f e n i b P h o t o t o x i c i t y i n a M o u s e M o d e l | 51
3. Characterization of Vemurafenib Phototoxicity
in a Mouse Model
Boudon, S.M., Plappert-Helbig, U., Odermatt, A., Bauer, D. 2013. Characterization of
Vemurafenib Phototoxicity in a Mouse Model. Tox. Sci. doi: 10.1093/toxsci/kft237
First published online: October 23, 2013
This work was presented at the 14th Annual XeRR Meeting 2013. Zürich, Switzerland,
Dec. 2013.
Abbreviations
8-MOP 8-methoxypsoralen CMC carboxymethylcellulose DMEM Dulbecco’s modified eagle medium HBSS Hank's Buffered Salt Solution LC-MS liquid chromatography - mass spectrometry LLNA local lymph node assay LOAEL lowest observed adverse effect level MED minimal erythemal dose NOAEL no observed adverse effect level NRU neutral red uptake UPLC ultrahigh-performance liquid chromatography UV ultraviolet
C h a r a c t e r i z a t i o n o f V e m u r a f e n i b P h o t o t o x i c i t y i n a M o u s e M o d e l | 52
Abstract
Vemurafenib is a first-in-class, small molecule B-Raf kinase inhibitor for the treatment of
patients with unresectable or metastatic melanoma carrying the BRAFV600E mutation,
commercially available since 2011. A general phototoxic potential was identified early during
development; however based on results of an animal study in hairless rats, it was concluded
that there would exist no relevant risk for humans. Surprisingly, signs of clinical
photosensitivity were reported in many patients during clinical development. Therefore, it
became a fundamental question to understand this discrepancy.
An established mouse model (oral UV-Local Lymph Node Assay, UV-LLNA) for the
assessment of in vivo photosafety was used to investigate the impact of formulations, dose
levels, duration of treatment and timing of irradiation. Moreover a basic pharmacokinetic
profile was established within the same mouse strain.
We were able to demonstrate dose- and time-dependent phototoxicity of vemurafenib using
commercially available tablets (stabilized amorphous material). The lowest phototoxic dose
was 350 mg/kg administrated for three consecutive days followed by exposure to UV-visible
irradiation at a UVA-normalized dose of 10 J/cm2. In comparison, pure vemurafenib, which
easily forms crystalline variants and is known to have poor bioavailability, was tested at 350
mg/kg and no signs of phototoxicity could be seen. The most apparent difference between the
early study in hairless rats and the current study in mice was the spectral range of the
irradiation light source (350 to 400 nm versus 320 to 700 nm). Since vemurafenib does not
absorb sufficiently light above 350 nm, this difference can easily explain the negative earlier
study result in hairless rats.
Keywords:
Phototoxicity, Photosensitivity, Photosafety, LLNA, BRAF, Vemurafenib
C h a r a c t e r i z a t i o n o f V e m u r a f e n i b P h o t o t o x i c i t y i n a M o u s e M o d e l | 53
3.1. Introduction
Vemurafenib is a first-in-class, small molecule B-Raf kinase inhibitor for the treatment of
patients with unresectable or metastatic melanoma carrying the BRAFV600E mutation. It
was approved in 2011 in the United States (FDA review, 2011), in the European Union
(CHMP review) and in Switzerland.
Although a general phototoxic potential was identified early for this compound (based on
UV-vis spectra and in vitro 3T3 Neutral Red Uptake (NRU) phototoxicity data) the initial
conclusion was made that no relevant human risk would exist. Apparently, this was driven by
the results of an animal study suggesting that no increased sensitivity to light could be
induced (FDA review 2011, CHMP review 2011). Surprisingly, signs of clinical
photosensitivity were reported in 42 % of patients included in the Phase I trial extension
cohort. Similarly, during Phase II and Phase III, 52 % and 30 % of vemurafenib-treated
patients were affected, respectively (Chapman et al., 2011; Flaherty et al., 2010, Lacouture et
al. 2013). The findings included severe (grade 2 and 3) sun-burn-like reactions, which
occurred even after exposure to sun light through window glass (e.g. while driving a car) and,
thus, had a significant impact on the quality of life. Later, Dummer et al. (2012) confirmed
that the minimal erythema dose (MED) in patients receiving vemurafenib was markedly
reduced in the UVA range, while the UVB-dependent MED remained unchanged when
compared to untreated subjects. Therefore, we felt encouraged to understand the reasons
behind this situation that a clinically relevant strong phototoxicity had gone undetected
preclinically. In particular, it was of great interest to learn how such potentially “false
negative” animal studies can be avoided in the future.
In the present study we utilized an established mouse model for the assessment of in vivo
photosafety. This model is based on a modified (cell count-based) UV-Local Lymph Node
C h a r a c t e r i z a t i o n o f V e m u r a f e n i b P h o t o t o x i c i t y i n a M o u s e M o d e l | 54
Assay (UV-LLNA) in albino Balb/c mice as described by Ulrich et al. (2001). However, with
oral administration, the main endpoint of this model is acute phototoxicity rather than
(photo)-contact allergy. A similar approach was also described by Vohr et al. (2000).
Typically, mice were treated for three days including daily exposure to simulated sun light.
The light source used provided a reasonable coverage of the UVA and visible light range,
while highly cytotoxic UVB irradiation was attenuated in order to not limit the overall
irradiation (which was normalized to a UVA dose of 10 J/cm2 UVA). Any skin reactions
(mainly erythema seen at the ears) were recorded during these days. Subsequently, edema (by
measuring ear weight) and markers of local inflammation (weight and cell count of the ear-
draining auricular lymph nodes) were assessed. Historically, a treatment period of three days
has been used to allow for sufficient activation of the local lymph nodes. However, in the
context of photosafety evaluation of systemically administered drugs the repeated-dose
protocol does also ensures sufficient distribution of compounds to skin.
During clinical development of vemurafenib it became apparent that reaching sufficient
systemic exposure in patients was a key challenge, because this drug substance is practically
insoluble in an aqueous environment. Finally, solubility was improved by using a stabilized
amorphous variant of vemurafenib. This solid dispersion contains amorphous vemurafenib
and hypromellose acetate succinate (HPMCAS) in which the drug substance is uniformly
dispersed within the polymeric substrate. Currently, the approved daily dose of vemurafenib
is 1920 mg (which equals twice daily 4 tablets containing 240 mg each) (Bollag G et al.,
2010; Shah et al., 2013). Since reaching sufficient bioavailability is also a key challenge in
animal studies with vemurafenib, we performed our experiments with both crystalline and
stabilized amorphous material in order to test different conditions. In addition, a
pharmacokinetic profile was established within the same mouse strain in order to support
C h a r a c t e r i z a t i o n o f V e m u r a f e n i b P h o t o t o x i c i t y i n a M o u s e M o d e l | 55
comparisons with published exposure data from both non-clinical safety studies in animals
and human clinical trials.
3.2. Material and methods
3.2.1. Test compounds and positive and negative control items
For most animal studies amorphous vemurafenib was used, which was commercially
available as ZELBORAF ® tablets (240 mg/tablet, Roche, Basel, Switzerland). Prior to
immediate dosing the tablets were fine grinded with a pestle and a mortar. An appropriate
amount of aqueous carboxymethylcellulose (CMC) 0.5 % was added to form a fine
suspension (final dosage volume of 20 mL/kg) which was sonicated without heating for 5
minutes and shaken/vortexed. The vehicle, CMC 0.5 %, was used as control.
In addition, in-house synthetized vemurafenib was used, mainly for experiments requiring
solutions (e.g. recording of UV-vis spectra, in vitro 3T3 phototoxicity test). This material was
assumed to be composed of crystalline forms, which are obtained from chemical synthesis if
no special precautions are taken. Identity was confirmed based on 1H-NMR, LC-MS and
UPLC. The obtained data is in agreement with the known structure of vemurafenib. Purity
was assessed using UPLC demonstrating 98 % content with ethyl acetate as major remaining
impurity.
Sparfloxacin, and 8-methoxypsoralene (8-MOP), used as positive control reference
compounds, were obtained from Sigma Aldrich (Buchs,Switzerland) with at least 98 % purity
and available certificates of analysis.
C h a r a c t e r i z a t i o n o f V e m u r a f e n i b P h o t o t o x i c i t y i n a M o u s e M o d e l | 56
3.2.2. UV-visible light absorption spectra
Light absorption spectra in the UV-visible range were recorded on a Cary 300
spectrophotometer (Varian Australia Pty Ltd, Mulgrave, Australia) using UV-transparent
quartz glass cuvettes (1 cm path length). Substances were dissolved in methanol applying
individual solvent-specific baseline correction.
For each peak the molar extinction coefficient (ε or MEC) was calculated: ε = A / (c x l)
A: absorbance, c: concentration of the solution in methanol, l: path length (cuvette)
3.2.3. In vitro 3T3 neutral red uptake phototoxicity test
The Balb/c mouse fibroblast cell line 3T3.A31 was obtained from the European Collection
of Cell Cultures (ECACC, no. 86110401, at passage 82), United Kingdom. Cells were
cultivated in Dulbecco's Modified Eagle Medium (DMEM) (with phenol red) containing 10 %
fetal calf serum, 1 % glutamine and 1 % penicillin/streptomycin. The assay was performed in
accordance with OECD Testing Guideline 432 (2004). Briefly, twenty-four hours after
seeding the mouse fibroblast cells into 96-well plates, the medium was removed and the cells
were treated with different concentrations of the test compound for 1 h using Hank's Buffered
Salt Solution (HBSS) without phenol red as medium replacement. Subsequently these cells
were irradiated (+Irr) with simulated sun light (SOL 500 H1, Dr.Hönle GmbH, Gräfelfing,
Germany) with a main spectral output from 320 until beyond 700 nm. The integrated H1
filter system attenuated the highly cytotoxic UVB range to a level which was tolerated by the
cell culture as suggested by the mentioned guideline. (Figure 1) The polystyrene lids were on
the 96-well plates during light exposure. Calibration was performed through the lids as well.
In parallel, an identically prepared 96-well plate was kept in the dark (-Irr), serving as control.
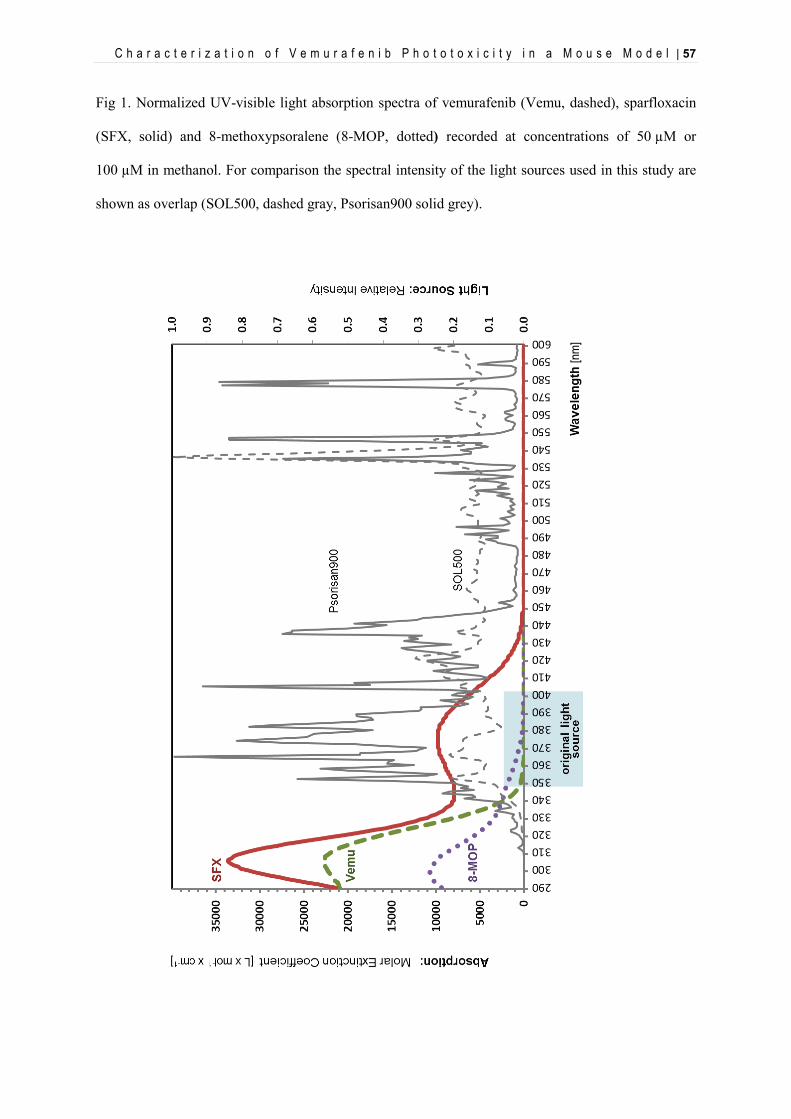
C h a r a c t e r i z a t i o n o f V e m u r a f e n i b P h o t o t o x i c i t y i n a M o u s e M o d e l | 57
Fig 1. Normalized UV-visible light absorption spectra of vemurafenib (Vemu, dashed), sparfloxacin
(SFX, solid) and 8-methoxypsoralene (8-MOP, dotted) recorded at concentrations of 50 µM or
100 µM in methanol. For comparison the spectral intensity of the light sources used in this study are
shown as overlap (SOL500, dashed gray, Psorisan900 solid grey).
C h a r a c t e r i z a t i o n o f V e m u r a f e n i b P h o t o t o x i c i t y i n a M o u s e M o d e l | 58
UVA irradiance was measured by a UVA meter (Dr. Hönle AG, Gräfelfing, Germany) with
spectral sensitivity in the range from 320 to 400 nm and a measuring range between 0 and
199.9 mW/cm2. The applied intensity was 1.67 mW/cm2 resulting in a total UVA dose of 5
J/cm2 after 50 minutes of irradiation. The related UVB exposure (calculated from the spectral
irradiance of the light source) was around 15 mJ/cm2 . After irradiation the HBSS buffer was
replaced by fresh medium. Cell viability was determined 24 h later using neutral red as the
vital dye, which was measured after incubation at 540 nm and extraction. The Photo-
Irritation-Factor (PIF) was calculated according to OECD TG 432 using the following
equation: PIF = IC50 (-Irr) / IC50(+Irr).
3.2.4. Animal experiments
3.2.4.1. Animal husbandry
Female BALB/C mice aged of about 8 weeks at the start of the experiment, purchased from
Charles River (L’Arbresle, France), were acclimatized for around one week. The experiments
were performed in conformity with the Swiss Animal Welfare Law and in accordance with
internal SOPs and guidelines for care and use of laboratory animals. Animals had ad libitum
access to pelleted standard rodent diet and tap water from the domestic supply and were kept
in an air-conditioned animal room under periodic bacteriological control, at 22°C ± 2°C with
monitored 30 % - 80 % humidity, a 12 hour light/dark cycle and background radio
coordinated with light hours.
C h a r a c t e r i z a t i o n o f V e m u r a f e n i b P h o t o t o x i c i t y i n a M o u s e M o d e l | 59
3.2.4.2. Irradiation conditions for animal experiments
During irradiation mice were kept in specific cages allowing only for lateral movements and
ensuring a uniform irradiation of their back and ears. Non-irradiated animals were kept in
their housing cages under standard room light. For irradiation a sun light simulator (Psorisan
900 H1, Dr.Hönle GmbH, Gräfelfing, Germany) was used showing a main spectral output
from 320 until beyond 590 nm. The integrated H1 filter system attenuated the highly
cytotoxic UVB range to a level which was tolerated by the animals. UVA irradiance was
measured by a UV-radiometer (Dr.Hönle GmbH, Gräfelfing, Germany) with a spectral
sensitivity in a range from 320 to 400 nm and a measuring range between 0 and 199.9
mW/cm2. Typically, the applied intensity was 4.8 mW/cm2 at a distance of 50 cm. Irradiation
was normalized to a dose of 10 J/cm2 UVA which was typically achieved after 35 minutes of
light exposure. The related UVB exposure (calculated from the spectral irradiance of the light
source) was around 30 mJ/cm2. External calibration of the equipment was performed by
Opto.cal GmbH (Movelier, Switzerland) which is a calibration laboratory accredited by the
Swiss Accreditation Service.
3.2.4.3. Treatment protocols and endpoints
3.2.4.3.1. Oral UV-Local Lymph Node Assay in BALB/c mice
Studies A, B and C: On three consecutive days, six mice per group were treated orally with
the test compound (see Table 1 and Figure 2 for details) dissolved in 0.5 % aqueous
carboxymethylcellulose (CMC) or with vehicle. Two hours after each treatment, mice from
the groups “with UV” were irradiated.
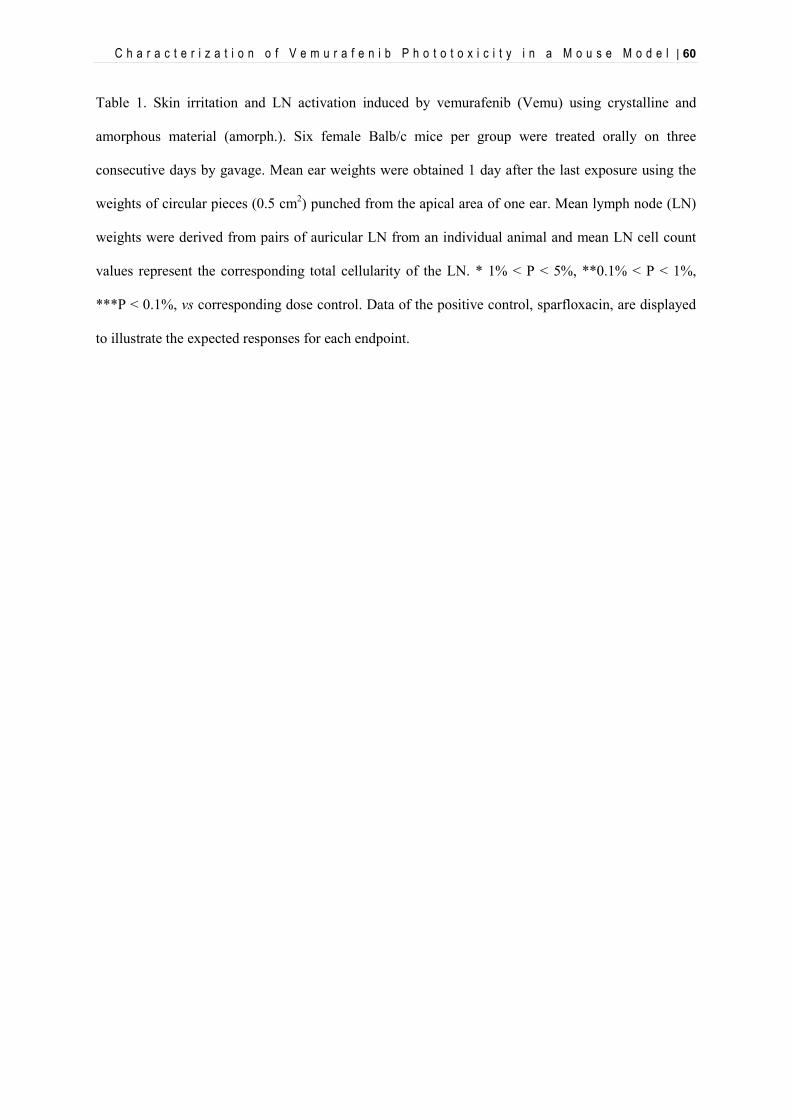
C h a r a c t e r i z a t i o n o f V e m u r a f e n i b P h o t o t o x i c i t y i n a M o u s e M o d e l | 60
Table 1. Skin irritation and LN activation induced by vemurafenib (Vemu) using crystalline and
amorphous material (amorph.). Six female Balb/c mice per group were treated orally on three
consecutive days by gavage. Mean ear weights were obtained 1 day after the last exposure using the
weights of circular pieces (0.5 cm2) punched from the apical area of one ear. Mean lymph node (LN)
weights were derived from pairs of auricular LN from an individual animal and mean LN cell count
values represent the corresponding total cellularity of the LN. * 1% < P < 5%, **0.1% < P < 1%,
***P < 0.1%, vs corresponding dose control. Data of the positive control, sparfloxacin, are displayed
to illustrate the expected responses for each endpoint.
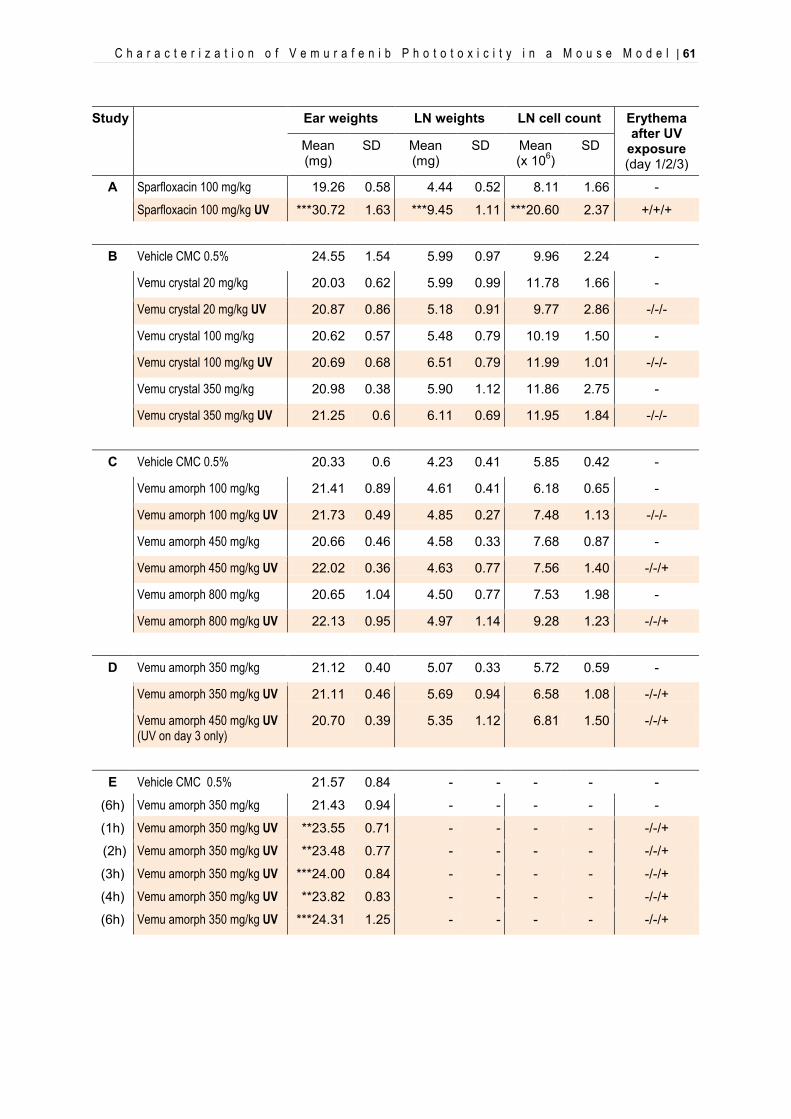
C h a r a c t e r i z a t i o n o f V e m u r a f e n i b P h o t o t o x i c i t y i n a M o u s e M o d e l | 61
Study Ear weights LN weights LN cell count Erythema after UV
exposure (day 1/2/3)
Mean (mg)
SD Mean (mg)
SD Mean (x 106)
SD
A Sparfloxacin 100 mg/kg 19.26 0.58 4.44 0.52 8.11 1.66 -
Sparfloxacin 100 mg/kg UV ***30.72 1.63 ***9.45 1.11 ***20.60 2.37 +/+/+
B Vehicle CMC 0.5% 24.55 1.54 5.99 0.97 9.96 2.24 -
Vemu crystal 20 mg/kg 20.03 0.62 5.99 0.99 11.78 1.66 -
Vemu crystal 20 mg/kg UV 20.87 0.86 5.18 0.91 9.77 2.86 -/-/-
Vemu crystal 100 mg/kg 20.62 0.57 5.48 0.79 10.19 1.50 -
Vemu crystal 100 mg/kg UV 20.69 0.68 6.51 0.79 11.99 1.01 -/-/-
Vemu crystal 350 mg/kg 20.98 0.38 5.90 1.12 11.86 2.75 -
Vemu crystal 350 mg/kg UV 21.25 0.6 6.11 0.69 11.95 1.84 -/-/-
C Vehicle CMC 0.5% 20.33 0.6 4.23 0.41 5.85 0.42 -
Vemu amorph 100 mg/kg 21.41 0.89 4.61 0.41 6.18 0.65 -
Vemu amorph 100 mg/kg UV 21.73 0.49 4.85 0.27 7.48 1.13 -/-/-
Vemu amorph 450 mg/kg 20.66 0.46 4.58 0.33 7.68 0.87 -
Vemu amorph 450 mg/kg UV 22.02 0.36 4.63 0.77 7.56 1.40 -/-/+
Vemu amorph 800 mg/kg 20.65 1.04 4.50 0.77 7.53 1.98 -
Vemu amorph 800 mg/kg UV 22.13 0.95 4.97 1.14 9.28 1.23 -/-/+
D Vemu amorph 350 mg/kg 21.12 0.40 5.07 0.33 5.72 0.59 -
Vemu amorph 350 mg/kg UV 21.11 0.46 5.69 0.94 6.58 1.08 -/-/+
Vemu amorph 450 mg/kg UV (UV on day 3 only)
20.70 0.39 5.35 1.12 6.81 1.50 -/-/+
E Vehicle CMC 0.5% 21.57 0.84 - - - - -
(6h) Vemu amorph 350 mg/kg 21.43 0.94 - - - - -
(1h) Vemu amorph 350 mg/kg UV **23.55 0.71 - - - - -/-/+
(2h) Vemu amorph 350 mg/kg UV **23.48 0.77 - - - - -/-/+
(3h) Vemu amorph 350 mg/kg UV ***24.00 0.84 - - - - -/-/+
(4h) Vemu amorph 350 mg/kg UV **23.82 0.83 - - - - -/-/+
(6h) Vemu amorph 350 mg/kg UV ***24.31 1.25 - - - - -/-/+
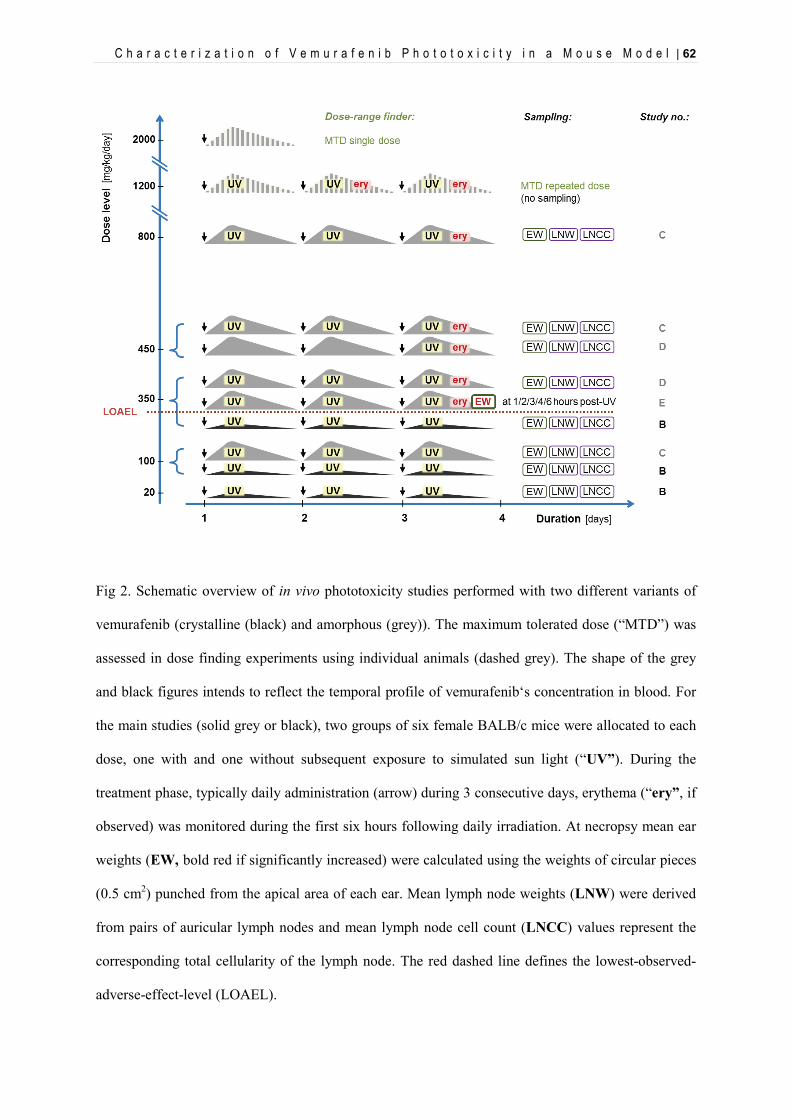
C h a r a c t e r i z a t i o n o f V e m u r a f e n i b P h o t o t o x i c i t y i n a M o u s e M o d e l | 62
Fig 2. Schematic overview of in vivo phototoxicity studies performed with two different variants of
vemurafenib (crystalline (black) and amorphous (grey)). The maximum tolerated dose (“MTD”) was
assessed in dose finding experiments using individual animals (dashed grey). The shape of the grey
and black figures intends to reflect the temporal profile of vemurafenib‘s concentration in blood. For
the main studies (solid grey or black), two groups of six female BALB/c mice were allocated to each
dose, one with and one without subsequent exposure to simulated sun light (“UV”). During the
treatment phase, typically daily administration (arrow) during 3 consecutive days, erythema (“ery”, if
observed) was monitored during the first six hours following daily irradiation. At necropsy mean ear
weights (EW, bold red if significantly increased) were calculated using the weights of circular pieces
(0.5 cm2) punched from the apical area of each ear. Mean lymph node weights (LNW) were derived
from pairs of auricular lymph nodes and mean lymph node cell count (LNCC) values represent the
corresponding total cellularity of the lymph node. The red dashed line defines the lowest-observed-
adverse-effect-level (LOAEL).
C h a r a c t e r i z a t i o n o f V e m u r a f e n i b P h o t o t o x i c i t y i n a M o u s e M o d e l | 63
Study D: On three consecutive days, six mice per group were treated orally with 350 mg/kg
or 450 mg/kg of the amorphous form of vemurafenib. Mice from the 350 mg/kg “with UV”
group were irradiated two hours after each treatment while mice from group 450 mg/kg “with
UV” were irradiated two hours after last treatment only on day 3.
Measurement of LLNA endpoints was done as described before (Ulrich et al. 2001): 24 h
after the last irradiation, mice were sacrificed using carbon dioxide asphyxiation. Circular
biopsies (0.5 cm2) from the apical area of each ear were excised using a disposable punch and
weighed as pairs on an analytical scale. Lymph node weights were obtained from lymph node
pairs taken from individual animals and weighed using analytical scales. For the
determination of individual lymph node cell counts, single-cell suspensions from the lymph
node pairs from individual animals were prepared by mechanical tissue disaggregation
through a sterile stainless steel gauze in 1 ml phosphate-buffered saline PBS (Ca2+/Mg2+ -free)
containing 0.5% bovine serum albumin BSA. Individual cell counts were determined in a cell
counter (CASY®TTC cell counter, Schärfe System, Reutlingen, Germany) gating on a
particle diameter above 4.88 μm.
3.2.4.3.2. Time-profile of erythema and edema formation after irradiation
Study E: On three consecutive days, six mice per group were treated orally with 350 mg/kg
of the amorphous form of vemurafenib or with vehicle. Mice were irradiated two hours after
each treatment and sacrificed at 1 h, 2 h, 3 h, 4 h and 6 h after light exposure on day 3.
Circular biopsies (0.5 cm2) from the apical area of each ear were excised using a disposable
punch and weighed as pairs on analytical scales.
C h a r a c t e r i z a t i o n o f V e m u r a f e n i b P h o t o t o x i c i t y i n a M o u s e M o d e l | 64
3.2.4.3.3. Pharmacokinetic profile of vemurafenib in BALB/c mice
On three consecutive days, six mice per group were treated orally with a suspension of the
amorphous form of vemurafenib. Blood samples from three animals per time point per group
were collected from the vena saphena 1 h, 2 h, 4 h and 7 h post-dosing; blood specimens from
six mice per time point per group were collected from terminal heart puncture at 24 h after
treatment on day 1 for animals from group 1, on day 2 for animals from group 2, and on day
3 for animals from group 3. Plasma was prepared from blood specimens and stored on ice
water until all plasma specimens were prepared. Specimens from all animals were analyzed.
24 h after the administration on day 1, 2 and 3, mice were sacrificed using carbon dioxide
asphyxiation. Circular biopsies (= 0.5 cm2) from the apical area of each ear were excised
using a disposable punch and weighed as pairs on an analytical scale. They were snap-frozen
in liquid nitrogen and stored in a deep freezer at –70 °C or below. Determination of
vemurafenib in mouse plasma was performed by protein precipitation followed by
LC-MS/MS using electrospray ionization in positive mode. The ear samples were
homogenized with nine volume equivalents of acetonitrile/water, then processed and
analyzed like the plasma samples.
3.2.4.4. Statistical analysis
For all statistical calculations SigmaPlot for Windows (version 11.0) was used. A One-Way-
Analysis-of-Variance was used as the statistical method (Glantz SA, 1992). A normality test
was performed to assure that the specimens were drawn from a normal population
(significance level = 0.01). The equal variance test was used to check the assumption that the
sample was drawn from populations with the same variance (significance level = 0.01). In
case of significant results of the One-Way-ANOVA, multiple comparisons were performed
C h a r a c t e r i z a t i o n o f V e m u r a f e n i b P h o t o t o x i c i t y i n a M o u s e M o d e l | 65
with the Student-Newman-Keuls test. If the normality test and/or the equal variance test gave
P values < 0.01, a suitable transformation (log, square root) was applied; if the normality test
and/or equal variance test still gave P values < 0.01, the non-parametric Kruskal-Wallis test
was used and multiple comparisons for the ranks of the original observations were performed.
The confidence interval for the difference of the means was set to 95 % (α= 0.05).
3.3. Results
3.3.1. UV-visible light absorption spectra
UV-visible spectra of vemurafenib and the reference compounds sparfloxacin and 8-methoxy
psoralene were recorded from 290 to 700 nm, which is the spectral region relevant for
photosafety assessment (sun light) (Table 2). Vemurafenib shows absorption mainly in the
UVB (peak at 305 nm) and the short UVA region. Importantly, above 350 nm no relevant
absorption is observed. In comparison, 8-MOP shows a similar absorption profile (peak at
299 nm), but absorption extends into the long UVA region up to 380 nm. Sparfloxacin,
shows an additional peak (375 nm) in the long UVA and absorption extends into the visible
region up to 440 nm. For comparison, an overlay of these absorption spectra with the spectral
irradiance of the light sources (in vitro: SOL500 / H1 filter, in vivo: Psorisan900 / H1 filter) is
shown up to 600 nm in Figure 1. It should be noted that the obvious absorption of all three
compounds in the UVB range is a common phenomenon among the majority of low
molecular weight drug substances. However, for oral drugs photosafety assessment is mainly
focusing on UVA and visible light as these wavelengths are penetrating sufficiently into skin
(ICH S10, step 2 draft, 2012).
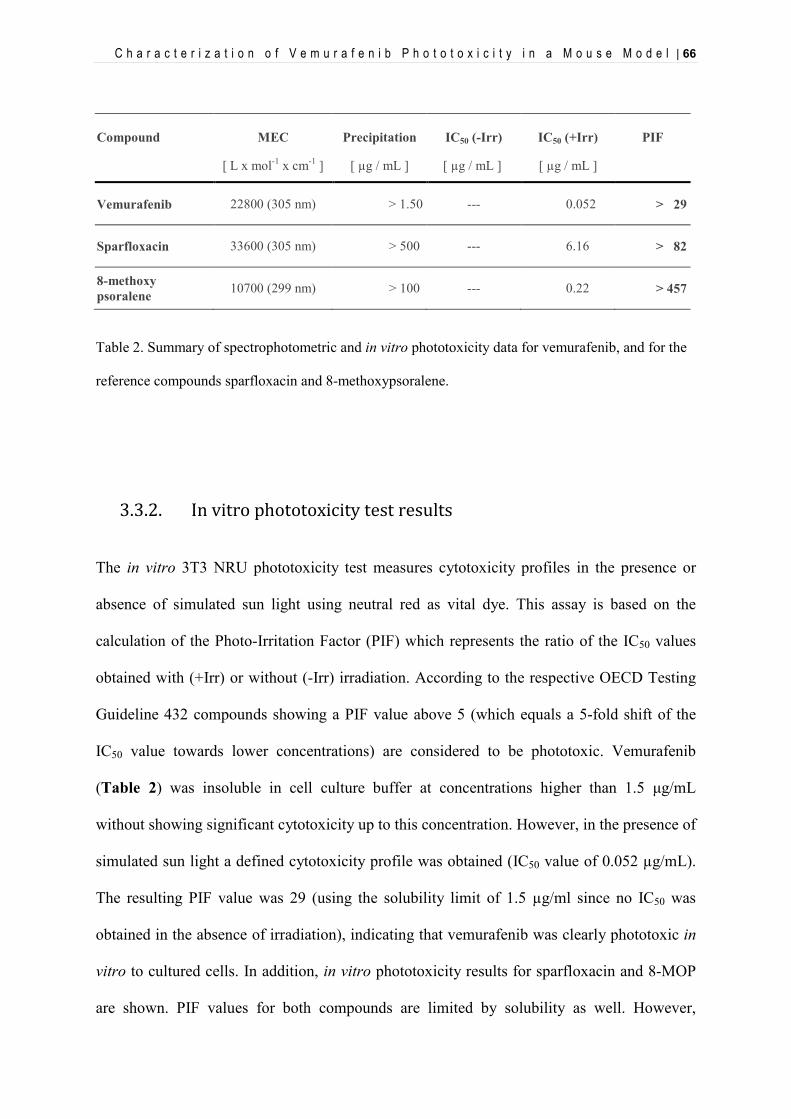
C h a r a c t e r i z a t i o n o f V e m u r a f e n i b P h o t o t o x i c i t y i n a M o u s e M o d e l | 66
Table 2. Summary of spectrophotometric and in vitro phototoxicity data for vemurafenib, and for the
reference compounds sparfloxacin and 8-methoxypsoralene.
3.3.2. In vitro phototoxicity test results
The in vitro 3T3 NRU phototoxicity test measures cytotoxicity profiles in the presence or
absence of simulated sun light using neutral red as vital dye. This assay is based on the
calculation of the Photo-Irritation Factor (PIF) which represents the ratio of the IC50 values
obtained with (+Irr) or without (-Irr) irradiation. According to the respective OECD Testing
Guideline 432 compounds showing a PIF value above 5 (which equals a 5-fold shift of the
IC50 value towards lower concentrations) are considered to be phototoxic. Vemurafenib
(Table 2) was insoluble in cell culture buffer at concentrations higher than 1.5 μg/mL
without showing significant cytotoxicity up to this concentration. However, in the presence of
simulated sun light a defined cytotoxicity profile was obtained (IC50 value of 0.052 µg/mL).
The resulting PIF value was 29 (using the solubility limit of 1.5 µg/ml since no IC50 was
obtained in the absence of irradiation), indicating that vemurafenib was clearly phototoxic in
vitro to cultured cells. In addition, in vitro phototoxicity results for sparfloxacin and 8-MOP
are shown. PIF values for both compounds are limited by solubility as well. However,
Compound MEC
[ L x mol-1 x cm-1 ]
Precipitation
[ µg / mL ]
IC50 (-Irr)
[ µg / mL ]
IC50 (+Irr)
[ µg / mL ]
PIF
Vemurafenib 22800 (305 nm) > 1.50 --- 0.052 > 29
Sparfloxacin 33600 (305 nm) > 500 --- 6.16 > 82
8-methoxy psoralene 10700 (299 nm) > 100 --- 0.22 > 457
C h a r a c t e r i z a t i o n o f V e m u r a f e n i b P h o t o t o x i c i t y i n a M o u s e M o d e l | 67
achieved concentrations were significantly higher which resulted in much higher PIF values.
Under these conditions, the extremely low IC50 value of vemurafenib (0.052 µg/mL)
illustrates the potent inherent photoreactivity while the solubility-limited PIF value of 29 is
likely an underestimate of the true phototoxic potential.
3.3.3. Oral UV-Local Lymph Node Assay
Data obtained with the positive control sparfloxacin are displayed in Table 1 (study A) to
illustrate the expected responses for each endpoint. After oral administration of sparfloxacin
(100 mg/kg) redness of the ears (erythema) was observed after each irradiation. At the time of
necropsy increased ear weight (edema) and a proliferation response in the ear-draining
auricular lymph nodes was seen.
For vemurafenib (Figure 2), the maximum tolerated dose (MTD) was established at 800
mg/kg in a dose-finding experiment using individual animals. Clinical symptoms were
monitored during the dose-finding experiment which started at a dose of 2000 mg/kg body
weight/day using amorphous material (finely grinded tablets). Following the first
administration reduced activity, piloerection and hunched posture were observed during the
initial 5 hours. In concordance with Mackay et al (1992), 1200 mg/kg was used as the next
lower dose. Similar symptoms, although less pronounced, were observed allowing for
additional irradiation after treatment. During the second and third day of treatment, erythema
at the ear skin was observed. The next lower dose, 800 mg/kg, was well tolerated by mice for
three days (apart from the irradiation-dependent erythema on day 3) and, therefore was
regarded as the MTD for amorphous vemurafenib to be considered in subsequent studies.
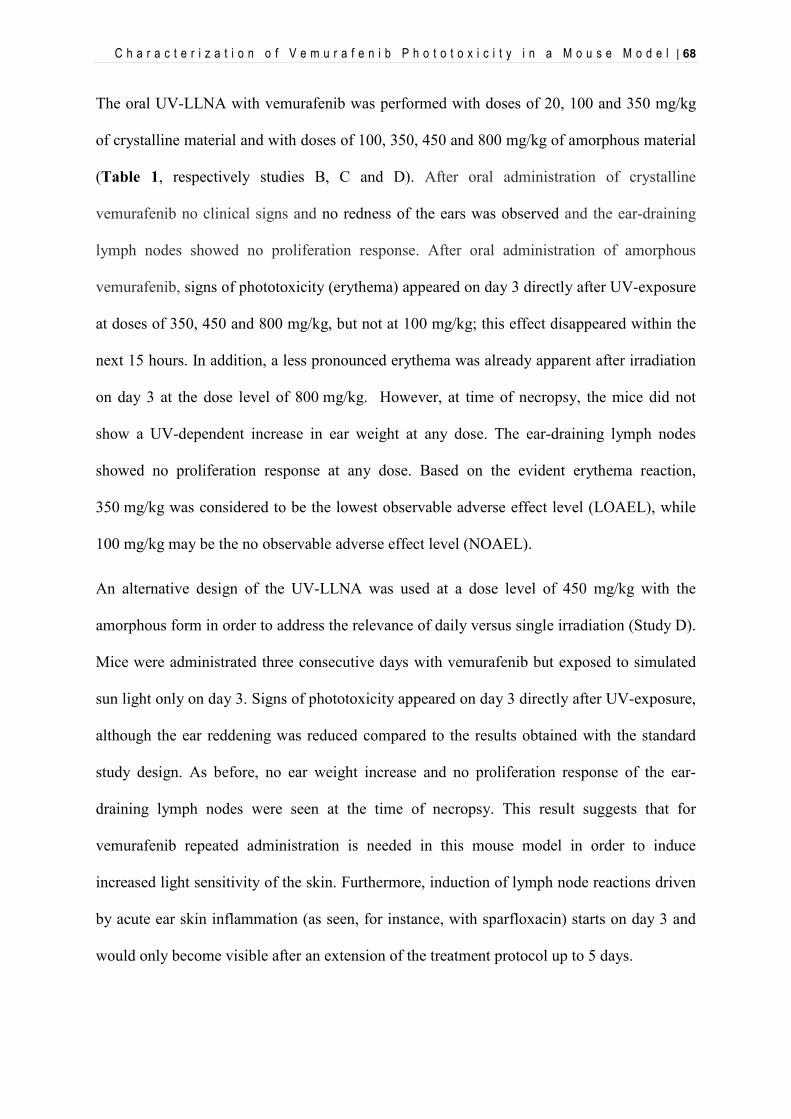
C h a r a c t e r i z a t i o n o f V e m u r a f e n i b P h o t o t o x i c i t y i n a M o u s e M o d e l | 68
The oral UV-LLNA with vemurafenib was performed with doses of 20, 100 and 350 mg/kg
of crystalline material and with doses of 100, 350, 450 and 800 mg/kg of amorphous material
(Table 1, respectively studies B, C and D). After oral administration of crystalline
vemurafenib no clinical signs and no redness of the ears was observed and the ear-draining
lymph nodes showed no proliferation response. After oral administration of amorphous
vemurafenib, signs of phototoxicity (erythema) appeared on day 3 directly after UV-exposure
at doses of 350, 450 and 800 mg/kg, but not at 100 mg/kg; this effect disappeared within the
next 15 hours. In addition, a less pronounced erythema was already apparent after irradiation
on day 3 at the dose level of 800 mg/kg. However, at time of necropsy, the mice did not
show a UV-dependent increase in ear weight at any dose. The ear-draining lymph nodes
showed no proliferation response at any dose. Based on the evident erythema reaction,
350 mg/kg was considered to be the lowest observable adverse effect level (LOAEL), while
100 mg/kg may be the no observable adverse effect level (NOAEL).
An alternative design of the UV-LLNA was used at a dose level of 450 mg/kg with the
amorphous form in order to address the relevance of daily versus single irradiation (Study D).
Mice were administrated three consecutive days with vemurafenib but exposed to simulated
sun light only on day 3. Signs of phototoxicity appeared on day 3 directly after UV-exposure,
although the ear reddening was reduced compared to the results obtained with the standard
study design. As before, no ear weight increase and no proliferation response of the ear-
draining lymph nodes were seen at the time of necropsy. This result suggests that for
vemurafenib repeated administration is needed in this mouse model in order to induce
increased light sensitivity of the skin. Furthermore, induction of lymph node reactions driven
by acute ear skin inflammation (as seen, for instance, with sparfloxacin) starts on day 3 and
would only become visible after an extension of the treatment protocol up to 5 days.
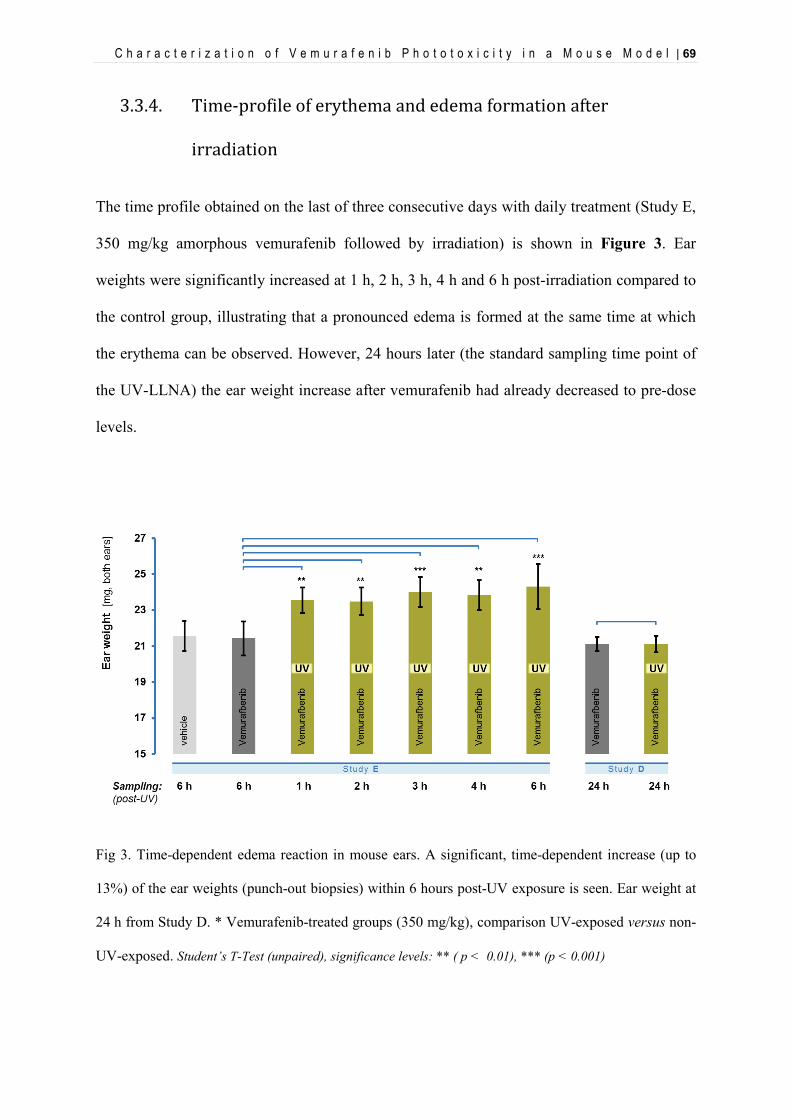
C h a r a c t e r i z a t i o n o f V e m u r a f e n i b P h o t o t o x i c i t y i n a M o u s e M o d e l | 69
3.3.4. Time-profile of erythema and edema formation after
irradiation
The time profile obtained on the last of three consecutive days with daily treatment (Study E,
350 mg/kg amorphous vemurafenib followed by irradiation) is shown in Figure 3. Ear
weights were significantly increased at 1 h, 2 h, 3 h, 4 h and 6 h post-irradiation compared to
the control group, illustrating that a pronounced edema is formed at the same time at which
the erythema can be observed. However, 24 hours later (the standard sampling time point of
the UV-LLNA) the ear weight increase after vemurafenib had already decreased to pre-dose
levels.
Fig 3. Time-dependent edema reaction in mouse ears. A significant, time-dependent increase (up to
13%) of the ear weights (punch-out biopsies) within 6 hours post-UV exposure is seen. Ear weight at
24 h from Study D. * Vemurafenib-treated groups (350 mg/kg), comparison UV-exposed versus non-
UV-exposed. Student’s T-Test (unpaired), significance levels: ** ( p < 0.01), *** (p < 0.001)
C h a r a c t e r i z a t i o n o f V e m u r a f e n i b P h o t o t o x i c i t y i n a M o u s e M o d e l | 70
3.3.5. Pharmacokinetic Profile
Concentrations of vemurafenib found in mouse plasma over 3 days were found to be similar
(Figure 4) ranging from 54 to 193 µg/ml (Cmin, Cmax) on day 3.The time to reach the highest
plasma concentration was between 2 and 4 hours after the administration irrespective of the
day. The apparent half-life time was 10 to 13 hours showing a slight decrease during
treatment days. The amount of vemurafenib found in ear skin tended to decrease after
repetitive administration and was about 2-fold lower compared to plasma. Distinct
accumulation was neither found in plasma nor in ear skin.
Fig 4. Mean Concentrations of Vemurafenib versus time in mouse plasma. Six mice per group were
treated orally with a suspension of amorphous vemurafenib on up to three consecutive days. Blood
samples from three animals per time point per group were collected from the vena saphena at 1h, 2h,
4h and 7h post-dose. In addition, from all animals of a group (one per day) terminal samples at 24 h
were taken from heart puncture. At the same time point ear samples were taken (punch-out biopsies).
C h a r a c t e r i z a t i o n o f V e m u r a f e n i b P h o t o t o x i c i t y i n a M o u s e M o d e l | 71
3.4. Discussion and Conclusion
From a chemical point of view, vemurafenib carries all features of a clinically relevant
phototoxic substance: a) it does absorb sun light within UVB and UVA up to 350 nm; b) it
shows in vitro a significant phototoxic reaction in cell culture (proving photochemical
reactivity) and c) it contains a fundamental structural element (diaryl ketone or benzophenone
chromophore) also seen in known clinically phototoxic drugs such as ketoprofen or
amiodarone. However, it is important to remember that without sufficient distribution to sun-
light exposed tissues such compounds do not lead to clinically relevant phototoxic reactions.
Therefore, it is essential to confirm these in vitro findings in established animal models of
phototoxicity as long as meaningful human phototoxicity data cannot be generated easily.
In our established in-house in vivo phototoxicity model (oral UV-LLNA in mice) we were
able to demonstrate dose- and time-dependent phototoxicity of vemurafenib using
commercially available tablets (stabilized amorphous material). The lowest phototoxic dose
was 350 mg/kg given for three consecutive days followed by exposure to UV-visible
irradiation at a UVA-normalized dose of 10 J/cm2 (related blood plasma levels of
vemurafenib on day 3, Cmax: 193 µg/ml, Cmin: 54 µg/ml). In comparison, pure vemurafenib,
which forms easily crystalline variants and is known to have poor bioavailability, was tested
at 350 mg/kg. Indeed, no signs of phototoxicity could be seen, which emphasizes the
importance of adequate formulations and confirmed systemic exposure (either measured in
blood or tissue or indirectly by clinical signs).
Interestingly, initial studies performed as part of the non-clinical development of vemurafenib
could not confirm any phototoxicity in vivo (for details see: CHMP review 2011, FDA review
2011). At that time, hairless female rats (Ico:OFA-hr/hr) were treated daily for 7 days at dose
levels of 30, 150 and 450 mg/kg using stabilized amorphous material comparable to that used
C h a r a c t e r i z a t i o n o f V e m u r a f e n i b P h o t o t o x i c i t y i n a M o u s e M o d e l | 72
later in commercial tablets. Although not reported for the hairless rat sufficient systemic
exposure can be assumed based on toxikokinetic data available from general toxicity studies
(26-week toxicity study, female Crl:CD(SD) rats, daily dose of 450 mg/kg: Cmax at day 1:
70 µg/ml, Cmax at day 91: 115 µg/mL, converted from reported molar concentrations:
143.1 µM and 234.7 µM, respectively). Irradiation of the treated hairless rats was performed
on the last day of treatment starting 90 minutes after last administration of vemurafenib with
UVA doses ranging from 5 J/cm2 to 35 J/cm2. The light source had apparently the
characteristics of fluorescent tubes with a reported maximal spectral output range from
350 nm to 400 nm and a peak at 370 nm (Figure 1). In comparison to the light absorption
spectrum of vemurafenib it is becoming evident that there is no spectral overlap between this
original light source used during development of vemurafenib and the test compound. This
fact alone may fully explain the negative results of this earlier study in hairless rats, since
duration of treatment and exposure to both vemurafenib and the formal UVA dose (limited to
350 to 400 nm) was clearly exceeding the conditions we have used in our studies in mice
reported above.
In patients efficacious dose levels have been reported to show average Cmax values around
60 µg/mL (CHMP review, 960 mg b.i.d., day 15), which is comparable to the exposure
reached in mice at 350 mg/kg and in rats at 450 mg/kg. However, human PK profiles differ
significantly from those seen in preclinical animal species. Particularly half-life in blood
plasma appears to be several-fold longer in men (57 hours), which suggests that a steady state
is reached only after many days of treatment. Nevertheless, it should be noted, that
phototoxicity in vivo (both animal and human) is driven by the presence of photoreactive
molecules in light exposed tissues. Therefore, comparison of achieved peak concentrations
(Cmax) – even at different Tmax – remains the most appropriate exposure assessment (see also
ICH S10, 2012) whereas AUC-based evaluations are of limited value.
C h a r a c t e r i z a t i o n o f V e m u r a f e n i b P h o t o t o x i c i t y i n a M o u s e M o d e l | 73
So far, human phototoxicity data has only been reported from patient populations (see
Introduction). Two groups (Dummer 2012, Gerlot 2013) have reported follow-on
investigations for individual patients. In summary, clinical representation of vemurafenib-
induced phototoxicity was described as a quickly occurring erythema accompanied by an
edema and in some cases a burning sensation during light exposure and was apparently UVA
dependent. As described by Ferguson (2002) this clinical presentation is typical for direct
photochemical mechanisms of phototoxicity. Gerlot et al. speculated that the observed UVA-
dependency could be explained by increased systemic porphyrin levels. However, the authors
did not discuss the known intrinsic photoreactivity of vemurafenib, which is – as confirmed
by our own results – indeed UVA driven (UV-vis spectrum, in vitro and in vivo phototoxicity
tests) and can easily explain the clinical reactions. The quick onset of edema formation in
mice (Figure 3) resembles the acute clinical reactions in men. Although vemurafenib does
not show typical signs of accumulation or retention in skin (neither in animals nor in men),
phototoxicity may be linked to steady-state conditions. In our in vivo studies an irradiation-
induced skin reaction at the lowest effective dose level (350 mg/kg) became apparent only
after 3 consecutive days of dosing. However, at higher dose levels these skin reactions started
already on day 2. Currently, there is no data providing further insight. Assuming that
vemurafenib molecules represent the photoreactive species (rather than endogenous
molecules as discussed above), there may be slower but critical redistribution processes
(within skin, within cells), which are ultimately driving susceptibility of skin to UVA light.
In conclusion, our investigations on the kinase inhibitor vemurafenib confirm a non-clinical
safety profile which is consistent with the clinical signs of phototoxicity seen in many treated
patients. Furthermore, these results highlight once again the impact of carefully designed in
vivo phototoxicity studies. It is apparent that duration of treatment and timing of irradiation
are key parameters to ensure an appropriate sensitivity. These elements of the study design
C h a r a c t e r i z a t i o n o f V e m u r a f e n i b P h o t o t o x i c i t y i n a M o u s e M o d e l | 74
should be supported by relevant pharmacokinetic data. The common perception is that if a
compound presents an identical pharmacokinetic profile over several days, a single-
treatment/single-irradiation design is appropriate as it would not be affected by an
accumulation of the compound into the skin. However, this case clearly shows that even for
compounds without apparent overproportional distribution to skin, a single-treatment/single-
irradiation design can be inappropriate. Finally, it is evident that appropriate irradiation
conditions are crucial. The more general use of “solar simulator” light sources covering at
least the full range of UVA and visible light should be considered state-of-the-art.
Acknoledgements
We thank Mrs. Monika Spielmann and Mrs. Christine Blumer for their support with the in vitro 3T3
NRU phototoxicity test; Mr. Martin Schneider, Mrs. Nathalie Noll, Mrs. Jeannine Streich, Mr. René
Schaffner, Mrs. Déborah Garcia, Mr. Philippe Scheubel and Dr. Jens Schuemann for their expertise
and support with the animal experiments; Dr. Frank Picard and Dr. Daniel Neddermann for their
support with the pharmacokinetic study; Dr. Ursula Junker for her expertise with the pathology review;
Dr. Hans-Joerg Martus and Dr. Willi Suter for their scientific support (all Novartis Pharma AG).
Funding
This work was supported by Novartis Institute for BioMedical Research, Novartis Pharma AG,
Switzerland.
References
Bollag, G., Hirth, P., Tsai, J., Zhang, J., Ibrahim, P.N., Cho, H., Spevak, W., Zhang, C., Zhang,
Y., Habets, G., Burton, E.A., Wong, B., Tsang, G., West, B.L., Powell, B.,Shellooe, R., Marimuthu,
A., Nguyen, H., Zhang, K.Y., Artis, D.R., Schlessinger, J., Su, F., Higgins, B., Iyer, R., D'Andrea,
C h a r a c t e r i z a t i o n o f V e m u r a f e n i b P h o t o t o x i c i t y i n a M o u s e M o d e l | 75
K., Koehler, A., Stumm, M., Lin, P.S., Lee, R.J.,Grippo, J., Puzanov, I., Kim, K.B., Ribas,
A., McArthur, G.A., Sosman, J.A., Chapman, P.B., Flaherty, K.T., Xu, X., Nathanson, K.L.
and Nolop, K. (2010). Clinical efficacy of a RAF inhibitor needs broad target blockade in BRAF-
mutant melanoma. Nature. 467(7315):596-9.
Chapman, P.B., Hauschild, A., Robert, C., Haanen, J.B., Ascierto, P., Larkin, J., Dummer, R., Garbe,
C., Testori, A., Maio, M., Hogg, D., Lorigan, P., Lebbe, C., Jouary, T.,Schadendorf, D., Ribas,
A., O'Day, S.J., Sosman, J.A., Kirkwood, J.M., Eggermont, A.M., Dreno, B., Nolop, K., Li,
J., Nelson, B., Hou, J., Lee, R.J., Flaherty, K.T., McArthur, G.A. and BRIM-3 Study Group (2011).
Improved survival with vemurafenib in melanoma with BRAF V600E mutation. N. Engl. J. Med.
364:2507–2516.
Committee for Medicinal Products for Human Use (CHMP) (2011). Assessment Report of Zelboraf,
vemurafenib. EMA/CHMP/926998/2011
Dummer, R., Rinderknecht, J. and Goldinger, S.M. (2012). Ultraviolet A and photosensitivity during
vemurafenib therapy. N. Engl. J. Med. 366(5):480-1.
FDA/Center for Drug Evaluation and Research, Division of Drug Oncology Products (HFD-150)
(2011). Pharmacology and Toxicology NDA Review and Evaluation of Zelboraf, vemurafenib.
Flaherty, K.T., Puzanov, I., Kim, K.B., McArthur, G.A., Sosman, J.A., O'Dwyer, P.J., Lee,
R.J., Grippo, J.F., Nolop, K. and Chapman, P.B. (2010). Inhibition of mutated, activated BRAF in
metastatic melanoma. N. Engl. J. Med. 363:809–819.
Ferguson, J. (2002). Photosensitivity due to drugs. Photodermatol. Photoimmunol. Photomed.
18(5):262-9.
Gelot, P., Dutartre, H., Khammari, A., Boisrobert, A., Schmitt, C., Deybach, J.-C., Nguyen, J.-M.,
Seité, S. and Dréno, B. (2013), Vemurafenib: an unusual UVA-induced photosensitivity.
Experimental Dermatology, 22: 297–298.
Glantz SA: Primer of Biostatistics, 3rd ed. New York, McGraw-Hill, 1992.
C h a r a c t e r i z a t i o n o f V e m u r a f e n i b P h o t o t o x i c i t y i n a M o u s e M o d e l | 76
ICH (2012), draft guideline S10 “Photosafety evaluation of pharmaceuticals”,
<http://www.ich.org/fileadmin/Public_Web_Site/ICH_Products/Guidelines/Safety/S10/S10_Ste
p_2.pdf >.
Lacouture, M.E., Duvic, M., Hauschild, A., Prieto, V.G., Robert, C., Schadendorf, D., Kim, C.C.,
McCormack, C.J., Myskowski, P.L., Spleiss, O., Trunzer, K., Su, F., Nelson, B., Nolop, K.B.,
Grippo, J.F., Lee, R.J., Klimek, M.J., Troy, J.L., Joe, A.K. (2013). Analysis of dermatologic events
in vemurafenib-treated patients with melanoma. Oncologist. 18(3):314-22.
Mackay, J.M., Elliott, B.M. (1992). Dose ranging and dose settings for in vivo genetic toxicology
studies. Mutat. Res..271:97-99.
OECD (2004), Test No. 432: In Vitro 3T3 NRU Phototoxicity Test, OECD Guidelines for the Testing
of Chemicals, Section 4, OECD Publishing. doi: "http://dx.doi.org/10.1787/9789264071162-
en"10.1787/9789264071162-en”
Shah, N., Iyer, R. M., Mair, H.-J., Choi, D. S., Tian, H., Diodone, R., Fähnrich, K., Pabst-Ravot, A.,
Tang, K., Scheubel, E., Grippo, J. F., Moreira, S. A., Go, Z., Mouskountakis, J., Louie, T., Ibrahim,
P. N., Sandhu, H., Rubia, L., Chokshi, H., Singhal, D. and Malick, W. (2013), Improved human
bioavailability of vemurafenib, a practically insoluble drug, using an amorphous polymer-
stabilized solid dispersion prepared by a solvent-controlled coprecipitation process. J. Pharm. Sci.
102: 967–981.
Ulrich, P., Streich, J. and Suter, W. (2001). Intralaboratory validation of alternative endpoints in the
murine local lymph node assay for the identification of contact allergic potential: primary ear skin
irritation and ear-draining lymph node hyperplasia induced by topical chemicals. Arch. Toxicol. 74:
733-744.
Vohr, H.W., Blümel, J., Blotz, A., Homey, B. and Ahr, H.J. (2000). An intra-laboratory validation of
the Integrated Model for the Differentiation of Skin Reactions (IMDS): discrimination between
(photo)allergic and (photo)irritant skin reactions in mice. Arch. Toxicol. Jan;73(10-11):501-9.
E v a l u a t i o n o f S p a r f l o x a c i n P h o t o t o x i c i t y w i t h M a s s S p e c t r o m e t r y I m a g i n g | 77
4. Evaluation of Sparfloxacin Phototoxicity with
Mass Spectrometry Imaging
[Boudon, S.M., Morandi, G., Prideaux, B., Staab, D., Junker, U., Odermatt, A., Stoeckli,
M., Bauer, D. 2013. Evaluation of Sparfloxacin Phototoxicity with Mass Spectrometry
Imaging. JASMS.] Submitted
This work was presented at the Gordon Research Conference: Cellular & Molecular
Mechanisms of Toxicity. Proctor Academy, Andover, NH, USA, Aug. 2011. Boudon, S.,
Schiltz, C., Scheubel, P., Prideaux, B., Luehrs, D., Stoeckli, M., Schuemann, J., Bauer, D.
Use of a modified oral UV-LLNA in Balb/c mice for the investigation of phototoxicity
mechanisms and pharmacokinetic properties in skin. Granted the 3rd Poster Award.
This work was presented at the 14th Congress of the European Society for Photobiology,
Geneva, Switzerland, Sept. 2011. Boudon, S., Schiltz, C., Scheubel, P., Prideaux, B.,
Luehrs, D., Stoeckli, M., Schuemann, J., Bauer, D. Use of a modified oral UV-LLNA in
Balb/c mice for the investigation of phototoxicity mechanisms and pharmacokinetic
properties in skin.
E v a l u a t i o n o f S p a r f l o x a c i n P h o t o t o x i c i t y w i t h M a s s S p e c t r o m e t r y I m a g i n g | 78
Abbreviations
3D three-dimensional ACN acetonitrile CHCA α-cyano-4-hydroxycinnamic acid CMC carboxymethylcellulose HBSS Hank’s Balanced Salt solution MALDI matrix-assisted laser desorption/ionization MFX moxifloxacin MSI mass spectrometry imaging SOP standard operating procedure SPX sparfloxacin TFA trifluoroacetic acid UV ultraviolet VIS visible light
E v a l u a t i o n o f S p a r f l o x a c i n P h o t o t o x i c i t y w i t h M a s s S p e c t r o m e t r y I m a g i n g | 79
Abstract
Mass spectrometry imaging (MSI) was applied to samples from mouse skin and from a
human in vitro 3D skin model in order to assess the potential advantage of this technique in
the context of photosafety evaluation. MSI proved to be a suitable method for the detection of
the model compound sparfloxacin in biological tissues following systemic administration
(oral gavage) and subsequent exposure to simulated sun light. In the human in vitro 3D skin
model, a concentration-dependent increase as well as an irradiation-dependent decrease of
sparfloxacin in tissue samples was observed. The MSI data on samples from mouse skin
showed high concentrations of sparfloxacin 8 hours after dosing. In contrast, animals
irradiated with simulated sun light showed a significant lower tissue exposure starting already
at 1 hour post-irradiation, with no measurable intensity at the later time points (3 hours and 6
hours), suggesting a time- and irradiation-dependent degradation of sparfloxacin. The
resolution of 100 µm proved to be adequate for the resolution of a total tissue concentration,
but higher resolutions beyond 10 µm would be required to resolve tissue structures. The
detection of sparfloxacin parent compound was apparently only the first step in an attempt to
gain a deeper understanding of the phototoxic processes. Further work is needed to identify
the degradation products of sparfloxacin implicated in the observed inflammatory processes
in order to better understand the origin and the mechanism of the phototoxic reaction.
E v a l u a t i o n o f S p a r f l o x a c i n P h o t o t o x i c i t y w i t h M a s s S p e c t r o m e t r y I m a g i n g | 80
4.1. Introduction
Phototoxic properties of pharmaceutical products may cause serious adverse drug reactions.
This does not only apply to ultraviolet (UV) and/or visible (vis) light absorbing chemicals,
which are used topically, but also to those which reach light-exposed tissues such as skin or
eyes following systemic exposure (for review see Drucker and Rosen, 2011; Ferguson, 2002;
Moore, 2002).
To enhance our molecular understanding of phototoxicity mechanisms, matrix-assisted laser
desorption/ionization mass spectrometric imaging (MALDI-MSI) was applied to samples
from mouse skin and from a human 3D skin model in order to assess the potential advantage
of this technique in the context of photosafety evaluation.
Since its introduction over 10 years ago (Caprioli et al, 1997), MALDI-MSI has emerged as a
valuable method of mapping the distribution of compounds and metabolites in animal tissues
after dosing (Steockli et al, 2007; Rohner et al, 2005; Trim et al, 2008). It offers the distinct
advantage compared to alternative molecular imaging techniques of allowing label-free and
simultaneous detection of hundreds of molecules in a single experiment. This makes it the
method of choice for applications to investigate molecular effects in combination with
substance dosing, or to measure multiple substances simultaneously. As an example, the
strength of mass spectrometry imaging was demonstrated by analyzing the distribution of
multiple fluoroquinolones in lung tissue of tuberculosis infected rabbits (Prideaux et al, 2011).
Based on these findings, the phototoxic effects of sparfloxacin, an antibiotic drug belonging
to the class of fluoroquinolons and a well-known photosensitizer in human (Pierfitte et al,
E v a l u a t i o n o f S p a r f l o x a c i n P h o t o t o x i c i t y w i t h M a s s S p e c t r o m e t r y I m a g i n g | 81
2000), were analyzed in the present study. We aimed to spatially follow the substance and its
metabolites, as well as molecular changes, in the tissue following the treatment.
In vitro 3D human skin models represent a simplified system for studying the interaction
between irradiation with simulated sun light and human skin at both the cellular and
molecular levels. In this study, we used the Phenion® Full Thickness Skin Model which
consists of keratinocytes and fibroblasts and presents an epidermis, a basement membrane
and a dermis featuring morphology and tissue functionality very close to the characteristics of
human skin (Ackermann et al, 2010).
Furthermore, starting from an established in vivo phototoxicity model (Boudon et al., 2013;
Schuemann et al. 2014), the study design was supplemented with early sampling time points
of typical light exposed tissues. Balb/c mice were treated orally with sparfloxacin and
subsequently irradiated with simulated sun light in order to establish time-dependent profiles
for both inflammatory responses (erythema, edema, histopathological changes) and presence
of sparfloxacin in these tissues.
4.2. Materials and methods
4.2.1. Human 3D skin model
The Phenion® FT model (Henkel, Düsseldorf, Germany) is a multilayered equivalent of the
human skin. It has a diameter of 1.3 cm and consists of keratinocytes and fibroblasts derived
from the same human donor. The tissue pieces were handled according to the instructions of
the manufacturer. Immediately after arriving each specimen of the FT model was transferred
from the delivery plate into a 3.5-cm Petri dish equipped with filter paper and filled with
E v a l u a t i o n o f S p a r f l o x a c i n P h o t o t o x i c i t y w i t h M a s s S p e c t r o m e t r y I m a g i n g | 82
approximately 4–5 ml of preheated culture medium (37°C, Air Liquid Interface Medium).
Tissue pieces were then incubated overnight at 37°C, with 5% CO2 and saturated humidity.
Three concentrations of sparfloxacin were used: 1 μg/mL, 3 μg/mL and 10 μg/mL in HBSS
(Hank’s Balanced Salt solution) that were added to the Air Liquid Interface medium in order
to mimic the systemic distribution from blood to dermis and epidermis. After an overnight
incubation with sparfloxacin some of the treated tissue cultures were exposed to simulated
sun light (10 J/cm UVA, SOL500, Dr. Höhnle, Germany) during 1 hour with an intensity of 2
mW/cm2. 8 h later all tissues were processed for bioanalytical analyses. Each skin sample
was cut into two half, one was snap-frozen and the other one fixed in formalin and embedded
in paraffin.
4.2.2. Animal experiments
4.2.2.1. Animal husbandry
Female Balb/c mice aged of about 8 weeks at start of experiment purchased from Charles
River (France) were acclimatized for around one week. The experiments were performed in
conformity with the Swiss Animal Welfare Law and in accordance with internal SOPs and
guidelines for care and use of laboratory animals. Animals had ad libitum access to pelleted
standard rodent diet and tap water from the domestic supply and were kept in an
air-conditioned animal room under periodic bacteriological control, at 22°C ± 2°C with
monitored 40% - 80% humidity, a 12 hours light/dark cycle and background radio
coordinated with light hours.
E v a l u a t i o n o f S p a r f l o x a c i n P h o t o t o x i c i t y w i t h M a s s S p e c t r o m e t r y I m a g i n g | 83
4.2.2.2. Irradiation conditions for animal experiments
During irradiation mice were kept in specific cages allowing only for lateral movements and
ensuring a uniform irradiation of their backs and ears. Non-irradiated animals were kept in
their housing cages under standard room light. Six mice per group were exposed to simulated
sun light (Psorisan 900 H1 lamp; Dr. Hönle, Germany) with a main spectral output from 320
until beyond 590 nm. Typically, the applied intensity was 4.8 mW/cm2 at a distance of 50 cm.
Irradiation was normalized to a dose of 10 J/cm2 UVA. The integrated H1 filter system
attenuated the highly cytotoxic UVB range to a level which was tolerated by the animals.
This adjustment is recommended for testing oral drugs, since in such cases photosafety
assessment is mainly focusing on UVA and visible light as only these wavelengths are
penetrating sufficiently into skin (ICH S10, 2013). UVA irradiance was measured with a UV
radiometer (Gigahertz-Optik GmbH, Germany). The yearly calibration of this GLP-compliant
equipment with an externally calibrated spectroradiometer covering the full spectral range
from 250 to 800 nm was performed by opto.cal GmbH (Switzerland). The timing for
exposure to simulated sun light was based on the pharmacokinetic properties and started one
hour after dosing. Corresponding control groups treated with vehicle, not exposed to
simulated sun light, were included.
4.2.2.3. Treatment protocols
Groups of six mice were used for single-dose oral gavage administration. Two groups
remained unirradiated and were euthanized 8 hours post-treatment: one group treated with
100 mg/kg sparfloxacin in 0.5% aqueous carboxymethylcellulose (CMC) and one group
treated with vehicle alone. Four groups were treated with the test item as well but followed
E v a l u a t i o n o f S p a r f l o x a c i n P h o t o t o x i c i t y w i t h M a s s S p e c t r o m e t r y I m a g i n g | 84
by exposure to simulated sun light one hour after treatment. These mice were euthanized 1, 2,
3, 4 and 6 hours post-irradiation. Circular biopsies (0.5 cm2) from the apical area of each ear
were excised using a disposable punch, weighed as pairs on analytical scales and further
processed for histopathological and bioanalytical analyses. For each animal, one ear was
snap-frozen and the other one fixed in formalin and embedded in paraffin. Ear samples
excised twenty-four hours post-irradiation, obtain from another study, were added for
comparison.
4.2.2.4. Statistical analysis
For all statistical calculations SigmaPlot for Windows (version 11.0) was used. A One-Way-
Analysis-of-Variance was used as the statistical method (Glantz SA, 1992). A normality test
was performed to assure that the specimens were drawn from a normal population
(significance level = 0.01). The equal variance test was used to check the assumption that the
sample was drawn from populations with the same variance (significance level = 0.01). In
case of significant results of the One-Way-ANOVA, multiple comparisons were performed
with the Student-Newman-Keuls test. If the normality test and/or the equal variance test gave
p values < 0.01, a suitable transformation (log, square root) was applied; if the normality test
and/or equal variance test still gave p values < 0.01, the non-parametric Kruskal-Wallis test
was used and multiple comparisons for the ranks of the original observations were performed.
The confidence interval for the difference of the means was set to 95% (α= 0.05).
E v a l u a t i o n o f S p a r f l o x a c i n P h o t o t o x i c i t y w i t h M a s s S p e c t r o m e t r y I m a g i n g | 85
4.2.3. Mass spectrometry imaging
4.2.3.1. Preparation of tissue samples for MALDI-MSI
Frozen ear biopsies were mounted on a holder without embedding by using small amounts of
O.C.T. (Optimum Cutting Temperature Tissue-Tek, Sakura Finetek, Torrance, USA) and
sections were cut at 12 μm thickness using a cryotome (CM3050, Leica Microsystems,
Wetzlar, Germany). The sections were thaw-mounted on stainless steel carrier, carefully
avoiding contamination of the sample and plate with O.C.T. At least three sections per
sample were prepared using the above protocol. Once sectioned, the samples were stored at
−80°C until further analysis. Alternating sections for each biopsy were cut and mounted onto
glass microscope slides and subject to tissue fixation and hematoxylin and eosin staining.
Dehydration of the sections was achieved by rapidly transferring the stainless steel targets
containing the tissues from the freezer to a desiccator. After 15 min desiccation, the plates
were scanned using a flatbed scanner (HP Scanjet 6300C) with a resolution of 10 µm. The
MALDI matrix was applied to the plates as a solution of 10 mg/mL α-cyano-4-
hydroxycinnamic acid (CHCA, C8982, Sigma) in 50% acetonitrile (ACN) containing 0.1%
trifluoroacetic acid (TFA). Moxifloxacin (MFX) (Sigma, Buchs, Switzerland), another
member of the groups of fluoroquinolones, was added as internal standard in a stock solution
of 1 nmol/μL (50% ACN) to produce a final concentration in the matrix solution of 2
pmol/μL. Eight mL of matrix/MFX standard solution were applied to each plate using a TLC
sprayer (VWR, Dietikon, Switzerland) operated at 0.5 bar pressure and held at a distance of
20 cm from the plate. Approximately 30 passes were performed per plate with 30 s drying
time between cycles.
E v a l u a t i o n o f S p a r f l o x a c i n P h o t o t o x i c i t y w i t h M a s s S p e c t r o m e t r y I m a g i n g | 86
4.2.3.2. MALDI-MSI analysis
Standard solutions of sparfloxacin (Sigma, Buchs, Switzerland) and moxifloxacin were
analyzed using a FlashQuant mass spectrometer (AB Sciex, Toronto, CA) to establish a SRM
method for each substance. Instrument parameters were optimized for highest product ion
signal in both analytes. Product ion scans of the protonated precursor ions (m/z 393.2 SPX)
revealed a clear fragmentation pattern with the transition m/z 393.2 → 375.2 dominating the
spectra and which was selected for the analysis. Increasing the laser power and collision
energy resulted in a greater range of product ions produced but significantly reduced
sensitivity.
Image acquisition was achieved by using the FlashQuant 1.1 beta imaging software (AB
Sciex) and running the ND:YAG laser at 1 kHz. The instrument was operated in selected
reaction monitoring (SRM) mode monitoring the established positive fragment ions with the
laser rastering across the tissue at a continuous scan speed of 1.5 mm per second and at a line
distance of 100 μm in a serpentine pattern. This method setup resulted in a dwell time of 50
ms for each of the two transitions. Both Q1 and Q3 were set to transmit a 1 Da window
centered on the specific masses. Image acquisition windows varied in size between 1 × 1 cm
and 2 × 2 cm depending upon the dimensions of the biopsy section, and image acquisition
time was approximately 30 minutes per tissue section depending on the image area.
In-house-developed software (Stoeckli, Novartis, Switzerland) was used to convert the
standard FlashQuant data format (.wiff) into the BioMap readable Analyze 7.5 format (Mayo
Foundation, Rochester, MN). BioMap (Novartis, Basel, Switzerland) was used for data
processing and visualization. Result images were calculated by dividing the pixel intensities
of the compound by the one of the added internal standard.
E v a l u a t i o n o f S p a r f l o x a c i n P h o t o t o x i c i t y w i t h M a s s S p e c t r o m e t r y I m a g i n g | 87
4.3. Results and discussion
4.3.1. Localization and quantification of sparfloxacin in vitro
The optimized mass spectrometric imaging method allowed high signal intensities for all
sample conditions and obtained images showed a good contrast (Figure 1). The
normalization, selected by an internal standard, compensated for the differences in sample
preparation conditions and allowed a direct and absolute comparison between the image data
sets. A pronounced concentration-dependent increase of sparfloxacin concentrations was
observed from 1 μg/mL, over 3 μg/mL to 10 μg/mL in the MS images. In comparison, a
significant decrease in sparfloxacin intensity was observed at all time-points in images of
tissues irradiated with simulated sun light. While the spatial resolution of 100 μm provided
enough data points for an evaluation of the total tissue concentration, it did not allow for an
unambiguous correlation of the signal intensities to specific structures and cell types of the
tissue.
4.3.2. Localization and quantification of sparfloxacin as part of an in
vivo phototoxicity study in mice
In vehicle or sparfloxacin-treated groups no signs of inflammation were seen without
exposure to simulated sun light (Figure 2). However, following sparfloxacin treatment and
subsequent irradiation, edema, congestion and inflammatory infiltrate (granulocytes,
neutrophils) became evident confirming the concomitantly observed erythema. While groups
sacrificed at 2 hours and 4 hours after irradiation showed an acute reaction, edema and
congestion were less prominent in groups sacrificed at 6 hours and 24 hours.
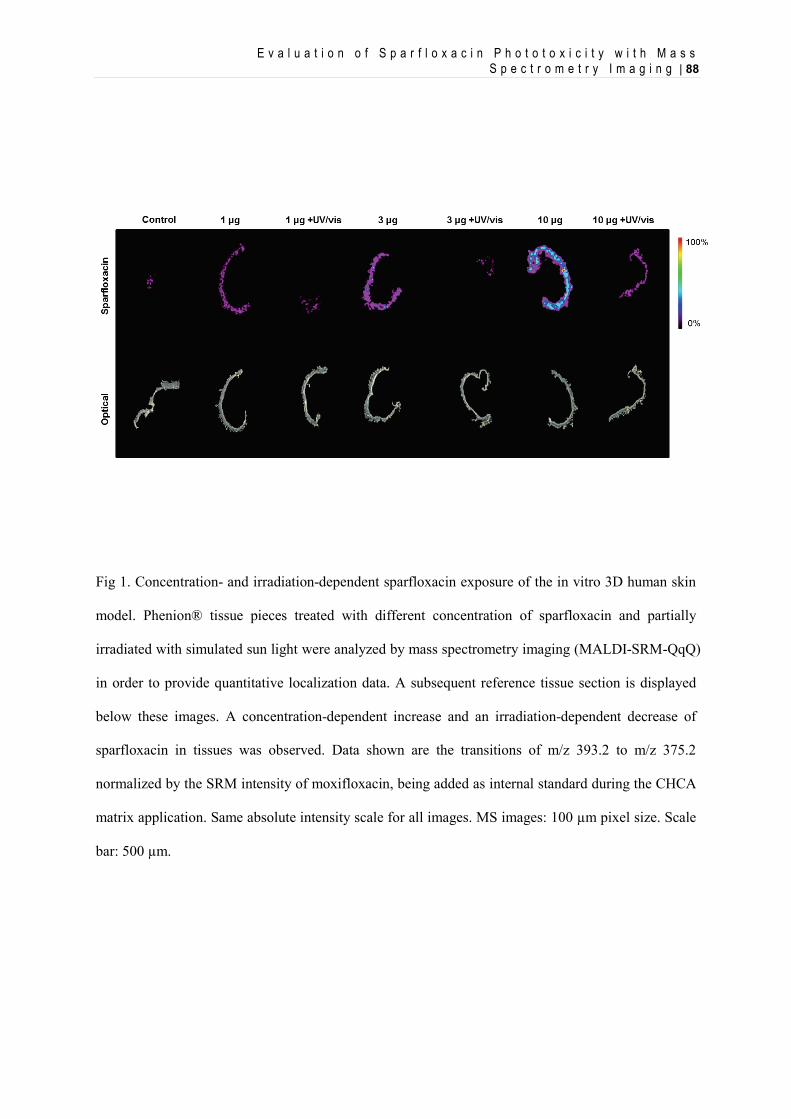
E v a l u a t i o n o f S p a r f l o x a c i n P h o t o t o x i c i t y w i t h M a s s S p e c t r o m e t r y I m a g i n g | 88
Fig 1. Concentration- and irradiation-dependent sparfloxacin exposure of the in vitro 3D human skin
model. Phenion® tissue pieces treated with different concentration of sparfloxacin and partially
irradiated with simulated sun light were analyzed by mass spectrometry imaging (MALDI-SRM-QqQ)
in order to provide quantitative localization data. A subsequent reference tissue section is displayed
below these images. A concentration-dependent increase and an irradiation-dependent decrease of
sparfloxacin in tissues was observed. Data shown are the transitions of m/z 393.2 to m/z 375.2
normalized by the SRM intensity of moxifloxacin, being added as internal standard during the CHCA
matrix application. Same absolute intensity scale for all images. MS images: 100 µm pixel size. Scale
bar: 500 µm.
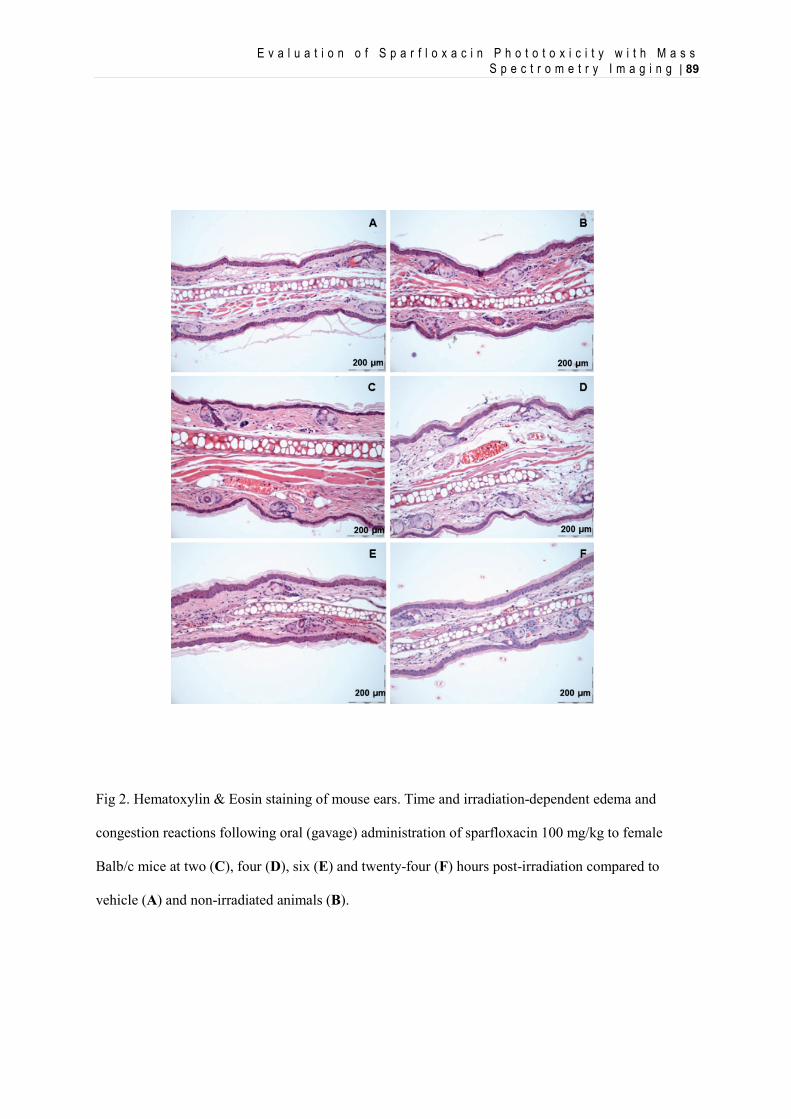
E v a l u a t i o n o f S p a r f l o x a c i n P h o t o t o x i c i t y w i t h M a s s S p e c t r o m e t r y I m a g i n g | 89
Fig 2. Hematoxylin & Eosin staining of mouse ears. Time and irradiation-dependent edema and
congestion reactions following oral (gavage) administration of sparfloxacin 100 mg/kg to female
Balb/c mice at two (C), four (D), six (E) and twenty-four (F) hours post-irradiation compared to
vehicle (A) and non-irradiated animals (B).
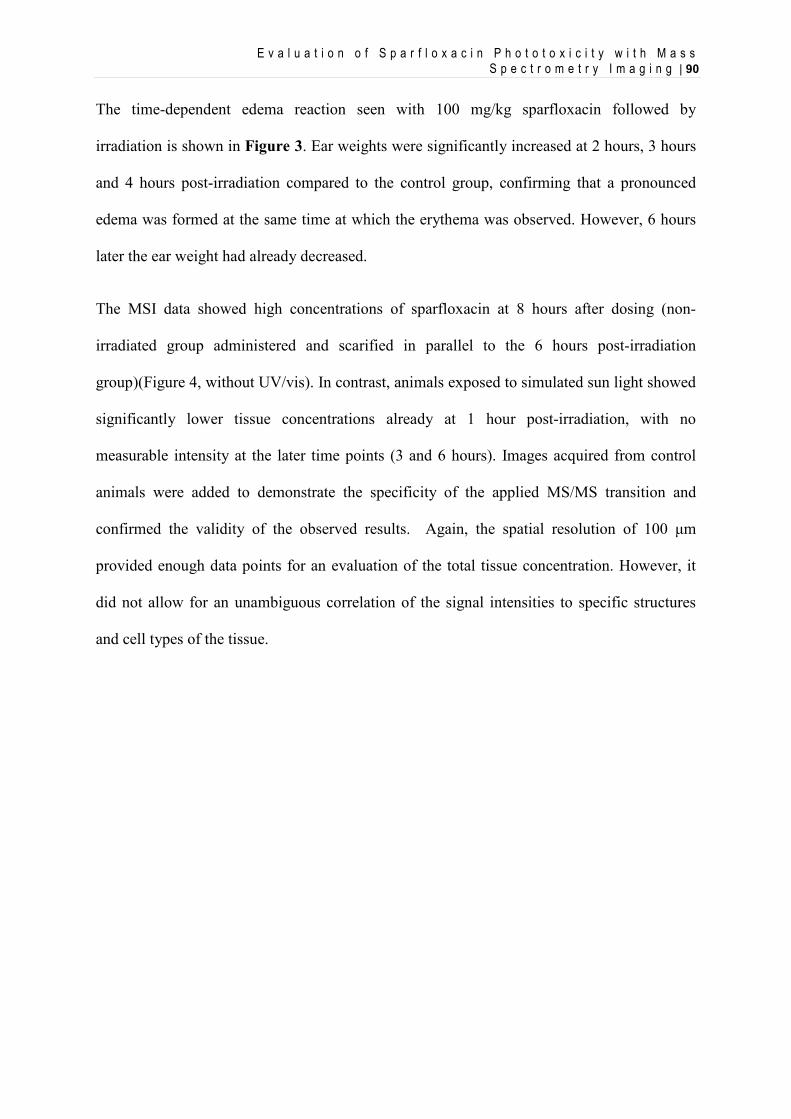
E v a l u a t i o n o f S p a r f l o x a c i n P h o t o t o x i c i t y w i t h M a s s S p e c t r o m e t r y I m a g i n g | 90
The time-dependent edema reaction seen with 100 mg/kg sparfloxacin followed by
irradiation is shown in Figure 3. Ear weights were significantly increased at 2 hours, 3 hours
and 4 hours post-irradiation compared to the control group, confirming that a pronounced
edema was formed at the same time at which the erythema was observed. However, 6 hours
later the ear weight had already decreased.
The MSI data showed high concentrations of sparfloxacin at 8 hours after dosing (non-
irradiated group administered and scarified in parallel to the 6 hours post-irradiation
group)(Figure 4, without UV/vis). In contrast, animals exposed to simulated sun light showed
significantly lower tissue concentrations already at 1 hour post-irradiation, with no
measurable intensity at the later time points (3 and 6 hours). Images acquired from control
animals were added to demonstrate the specificity of the applied MS/MS transition and
confirmed the validity of the observed results. Again, the spatial resolution of 100 μm
provided enough data points for an evaluation of the total tissue concentration. However, it
did not allow for an unambiguous correlation of the signal intensities to specific structures
and cell types of the tissue.
E v a l u a t i o n o f S p a r f l o x a c i n P h o t o t o x i c i t y w i t h M a s s S p e c t r o m e t r y I m a g i n g | 91
Fig 3. Time-dependent edema reaction in mouse ears. A significant, time-dependent increase of the
ear weights at 2 hours (20%), at 3 and 4 hours (more than 30%) post-UV/vis irradiaiton is seen, which
decreases at 6 hours.
* Sparfloxacin-treated groups (SPX, 100 mg/kg), comparison UV/vis-irradiated versus non-UV/vis -
irradiated.
Student’s T-Test (unpaired), significance levels: ** ( p < 0.01), *** (p < 0.001)
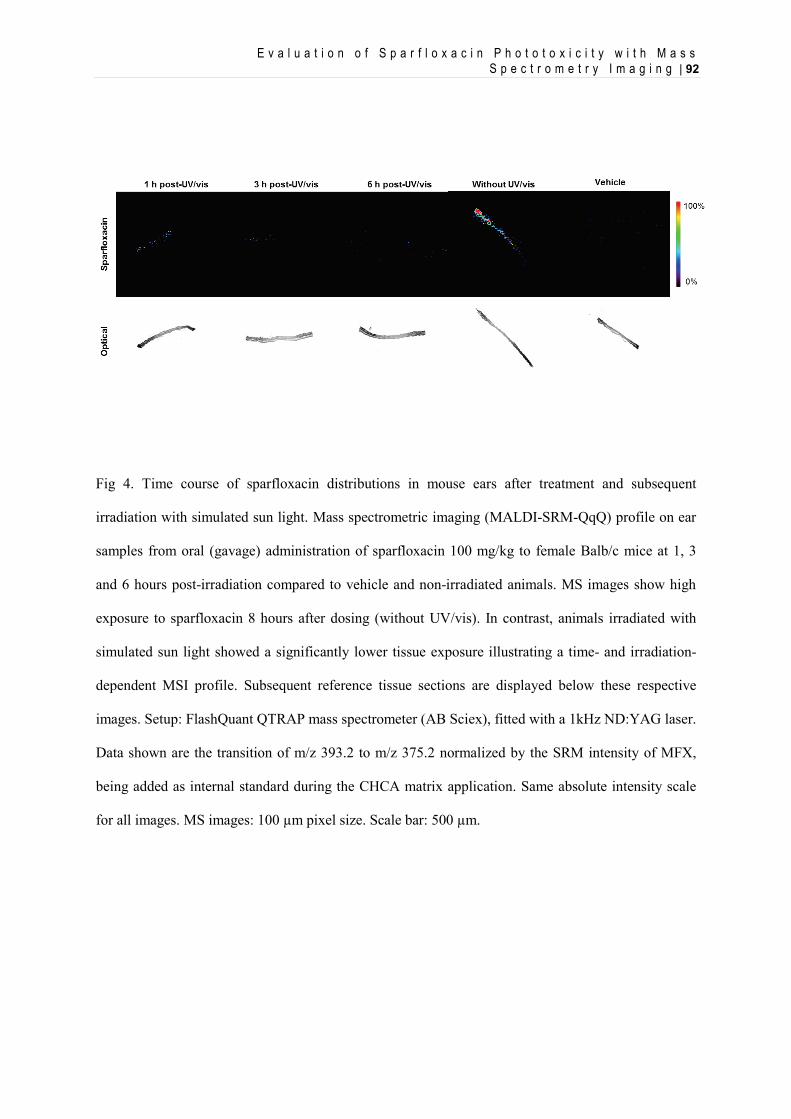
E v a l u a t i o n o f S p a r f l o x a c i n P h o t o t o x i c i t y w i t h M a s s S p e c t r o m e t r y I m a g i n g | 92
Fig 4. Time course of sparfloxacin distributions in mouse ears after treatment and subsequent
irradiation with simulated sun light. Mass spectrometric imaging (MALDI-SRM-QqQ) profile on ear
samples from oral (gavage) administration of sparfloxacin 100 mg/kg to female Balb/c mice at 1, 3
and 6 hours post-irradiation compared to vehicle and non-irradiated animals. MS images show high
exposure to sparfloxacin 8 hours after dosing (without UV/vis). In contrast, animals irradiated with
simulated sun light showed a significantly lower tissue exposure illustrating a time- and irradiation-
dependent MSI profile. Subsequent reference tissue sections are displayed below these respective
images. Setup: FlashQuant QTRAP mass spectrometer (AB Sciex), fitted with a 1kHz ND:YAG laser.
Data shown are the transition of m/z 393.2 to m/z 375.2 normalized by the SRM intensity of MFX,
being added as internal standard during the CHCA matrix application. Same absolute intensity scale
for all images. MS images: 100 µm pixel size. Scale bar: 500 µm.
E v a l u a t i o n o f S p a r f l o x a c i n P h o t o t o x i c i t y w i t h M a s s S p e c t r o m e t r y I m a g i n g | 93
4.4. Conclusion
In the context of photosafety evaluation, MSI proofed to be a suitable method for the
detection of photoreactive compounds in biological tissue samples. Using sparfloxacin as a
model compound, concentration-dependent and irradiation-dependent effects could be
observed in vitro. Furthermore, in an established in vivo phototoxicity model, time- and
irradiation dependent exposure to sparfloxacin in skin samples from mouse ears following
oral treatment were demonstrated.
Obviously, the detection of the parent compound was only the first step in an attempt to gain
a deeper understanding of the phototoxic processes. Identification of degradation products or
adducts formed with biological matrix molecules would help better understand the pathways
of light-induced photoreactivity within a cellular environment. Likewise, improved resolution
at least similar to light microscopy would allow for a direct comparison with changes seen in
histopathological evaluations. However, in both cases such improvements will depend on
further progress made on the technology level.
Acknoledgements
We thank Mr. Martin Schneider and Dr. Ulla Plappert-Helbig for their expertise and support
with the animal experiments; Dr. Hans-Joerg Martus and Dr. Willi Suter for their scientific
support (all Novartis Pharma AG).
References
Ackermann, K.; Lombardi Borgia, S.; Korting, H.C.; Mewes, K.R.; Schäfer-Korting, M. The Phenion
E v a l u a t i o n o f S p a r f l o x a c i n P h o t o t o x i c i t y w i t h M a s s S p e c t r o m e t r y I m a g i n g | 94
full-thickness skin model for percutaneous absorption testing. Skin Pharmacol Physiol. 2010, 23,
105–112
Boudon S.M., Plappert U., Odermatt A., Bauer D. 2013. Characterization of vemurafenib’s
phototoxicity in a mouse model. 2013. Toxicol. Sci. Advance Access published October 23, 2013
doi:10.1093/toxsci/kft237
Caprioli, R. M.; Farmer, T. B.; Gile, J. Molecular imaging of biological samples: localization of
peptides and proteins using MALDI-TOF MS. Anal. Chem. 1997, 69, 4751– 4760
Drucker, A.M.; Rosen, C.F. Drug-induced photosensitivity. Drug Saf. 2011, 34, 821-837.
Ferguson, J. Photosensitivity due to drugs. Photodermatol. Photoimmunol. Photomed. 2002, 18, 262-
269.
Moore, E.M. Drug-induced cutaneous photosensitivity. Drug Saf. 2002, 25, 345-372.
Pierfitte, C.; Royer, R.J.; Moore, N.; Bégaud, B. The link between sunshine and phototoxicity of
sparfloxacin. Br J Clin Pharmacol. 2000, 49(6), 609–612.
Prideaux, B.; Dartois, V.; Staab, D.; Weiner, D.M.; Goh, A.; Via, L.E.; Barry, C.E. 3rd; Stoeckli, M.
High-sensitivity MALDI-MRM-MS imaging of moxifloxacin distribution in tuberculosis-infected
rabbit lungs and granulomatous lesions. Anal Chem. 2011, 83(6), 2112-8.
Rohner, T. C.; Staab, D.; Stoeckli, M. MALDI mass spectrometric imaging of biological tissue
sections. Mech. Ageing Dev. 2005, 126, 177– 185
Stoeckli, M.; Staab, D.; Schweitzer, A. Imaging of a beta-peptide distribution in whole-body mice
sections by MALDI mass spectrometry. Int. J. Mass Spectrom. 2007, 260, 195–202
Trim, P. J.; Henson, C. M.; Avery, J. L.; McEwan, A.; Snel, M. F.; Claude, E.; Marshall, P. S.;
West, A.; Princivalle, A. P.; Clench, M. R. Matrix-assisted laser desorption/ionization-ion mobility
separation-mass spectrometry imaging of vinblastine in whole body tissue sections. Anal.
Chem. 2008, 80, 8628– 8634.
[Schuemann J., Boudon S., Loll N., Garcia D., Schaffner R., Streich J., Ulrich P., Kittel B. and Bauer
D. 2013. Integrated preclinical photosafety testing strategy for systemically applied
pharmaceuticals. Toxicology.] – Submitted
C o n c l u s i o n s a n d P e r s p e c t i v e s | 95
5. Conclusion and Perspectives
In this work, we were interested in comparing the results obtained in nonclinical models (in
vitro and in vivo experiments) with the clinical signs observed in human of well-known
photosensitizer.
The clinically phototoxic compounds sparfloxacin, enoxacin, lomefloxacin, doxycycline and
vemurafenib were reliably identified as phototoxic in the modified murine UV-LLNA in a
dose-dependent manner.
The in vivo phototoxic potential of systemically applied promethazine and ketoprofen proved
to be more difficult to identify. While promethazine did not show a phototoxic potential in
the modified murine photo-LLNA up to a dose of 100 mg/kg/day (maximum tolerated dose),
ketoprofen could only be identified based on erythema formation at the toxic dose level of
500 mg/kg/day. These results correlate well with the clinically observed difference of
ketoprofen-associated phototoxicity risks following topical vs systemic administration and
highlight the importance of a careful evaluation of the incidence and relevance of
phototoxicity seen clinically after oral administration.
Sparfloxacin and doxycycline induced moderate erythema formation within five to six hours
after the first treatment depending on additional exposure to simulated sun light. The severity
and persistence of erythema formation increased over the following two days of treatment
dose-dependently.
C o n c l u s i o n s a n d P e r s p e c t i v e s | 96
However, vemurafenib-induced erythema formation appeared only after the third treatment
and within the six hours following exposure to simulated sun light. In addition, our results
demonstrate that the phototoxic potential of vemurafenib was clearly detectable in vivo
provided that appropriate irradiation conditions were selected.
These results illustrate important lessons regarding photosafety testing.
• First, they demonstrate that the modified murine UV-LLNA, based on quantification
of skin irritation (erythema, ear biopsy weight) and auricular LN hyperplasia, is
suitable to support preclinical photosafety assessment of systemically applied drug
candidates.
• Furthermore, these results highlight the impact of carefully designed in vivo
phototoxicity studies.
o It is apparent that duration of treatment and timing of irradiation are key
parameters to ensure an appropriate sensitivity. These elements of the study
design should be supported by relevant pharmacokinetic data. The common
perception is that if a compound presents an identical pharmacokinetic profile
over several days, a single-treatment/single-irradiation design is appropriate as
it would not be affected by an accumulation of the compound into the skin.
However, vemurafenib’s case clearly shows that even for compounds without
apparent overproportional distribution to skin, a single-treatment/single-
irradiation design can be inappropriate.
C o n c l u s i o n s a n d P e r s p e c t i v e s | 97
o It is also evident that appropriate irradiation conditions are crucial. The general
use of “solar simulator” light sources covering at least the full range of UVA
and visible light should be considered state-of-the-art.
o The inclusion of three dose levels supports the establishment of NOAELs and
LOAELs. This allows the calculation of safety margin between drug exposure,
which is not associated with signs of phototoxicity in vivo, and exposure levels
in animal or men, which is considered pharmacologically relevant.
In the context of photosafety evaluation, mass spectrometric imaging (MSI) proofed to be a
suitable method for the detection of photoreactive compounds in biological tissue samples.
Using sparfloxacin as a model compound, concentration-dependent and irradiation-dependent
effects could be observed in vitro. Furthermore, in an established in vivo phototoxicity model,
time- and irradiation dependent exposure to sparfloxacin in skin samples from mouse ears
following oral treatment were demonstrated. In light of these promising results, MSI was also
applied to skin samples from the aforementioned UV-LLNA with vemurafenib and
doxycycline (data not shown). Unfortunately, the limit of detection was too low and it was
not possible to detect the compounds signal into the mouse ears samples. This illustrates the
current limits of MALDI-MSI. This approach is only applicable to molecules that are
ionizable by the MALDI process and the sensitivity therefore depends on the molecular
nature of targeted compound.
Our described MSI approach was primarily focused on the detection of the parent compound
in an attempt to gain a deeper understanding of the phototoxic processes. However, the
identification of degradation products or adducts formed with biological matrix molecules
would help better understand the pathways of light-induced photoreactivity within a cellular
C o n c l u s i o n s a n d P e r s p e c t i v e s | 98
environment. Likewise, improved resolution at least similar to light microscopy would allow
for a direct comparison with changes seen in histopathological evaluations. However,
localization and quantification of inflammation markers in skin sections collected during the
first hours after irradiation remains challenging. Thus, in both cases, MSI and histopathology,
such improvements will depend on further progress made on the technology level.
In conclusion, this work has provided critical scientific results which clearly demonstrate the
relevance of certain key elements in an integrated photosafety testing strategy. Apparently, a
better understanding towards the behavior of phototoxic drug substances on the molecular
level still remains a challenge and should deserve more efforts.