Embed Size (px)
Citation preview

Colloids and Surfaces B: Biointerfaces 37 (2004) 133–136
Characterization of the surface properties of persimmon leavesby FT-Raman spectroscopy and wicking technique
Qing Shena,b,∗, Hong-Gui Dinga, Lei Zhonga
a The Central Laboratory of Material Science and Engineering College, Donghua University,1882 W. Yan An Rd., 200051 Shanghai, China
b State Key Laboratory for Chemical Fiber and Polymer Materials, 1882 W. Yan An Rd., 200051 Shanghai, China
Received 17 May 2004; accepted 20 July 2004
Abstract
To fit the request of developing new biomaterials using persimmon leaves as raw material, this paper reported the surface free energyand related components, e.g. the Lifshitz–van der Waals and Lewis acid–base components for persimmon leaves estimated by means of the
of it wasurface freed that thet
ar-ick-d re-ewis
treeerere
ried
per-ling
column wicking technique. Considering this natural material might be varied of its properties with growing area, a characterizationinitially performed by applying the FT-Raman spectroscopy. Based on the determined results, persimmon leaves have greater senergy,γS, than cellulose though it has been found rich in this component, e.g. of about 68.28%. Moreover, it was further observepersimmon leaves have great Lewis acid–base interactions component,γAB
S , contributed by the Lewis acid component,γ+S. This suggests tha
the persimmon leaves are available to convert to new biomaterials expected forms.© 2004 Elsevier B.V. All rights reserved.
Keywords: Persimmon leaves; Surface properties; FT-Raman spectroscopy; Wicking
1. Introduction
Since persimmon leaves have been found with beneficialeffects on haemostasis, diuresis, constipation and hyperten-sion, it is observed that this kind of natural materials hasbeen broadly applied in some cases of food and medicinearea[1–6]. Due to persimmon leaves have advantages in notonly affinity with human in terms of its natural properties,but also of renewable compared to petrochemical materials,to expand their application area to fit various request, espe-cially for textile and military, is thus considerable.
In order to utilize those confirmed medical effects of per-simmon leaves, recently, a project aiming to develop this ma-terial based bio-fiber and membrane has been proposed andsupported by Chinese government. Since this requires weknow more about persimmon leaves, the aim of this work is
∗ Corresponding author. Tel.: +86 2162373311; fax: +86 2162193062.E-mail address:[email protected] (Q. Shen).
proposed initially to apply FT-Raman spectroscopy to chacterize the persimmon leaves, then using the column wing technique to characterize the surface free energy anlated components, e.g. the Lifshitz–van der Waals and Lacid–base components of persimmon leaves.
2. Experimental
2.1. Raw materials
Fresh persimmon leaves picked from a persimmonlocated at the campus of Donghua University, Shanghai, winitially prepared. After picking, all persimmon leaves wecleaned using distilled water for several times, then dusing an oven at temperature of about 90◦C for 24 h.
Since the full leaf is unable to measure its surface proties, the persimmon leaves were finally prepared by milto powders of about 200 meshes.
0927-7765/$ – see front matter © 2004 Elsevier B.V. All rights reserved.doi:10.1016/j.colsurfb.2004.07.006

134 Q. Shen et al. / Colloids and Surfaces B: Biointerfaces 37 (2004) 133–136
Table 1Surface properties of liquids employed in this work
Liquid γL (mJ/m2) γLWL (mJ/m2) γAB
L (mJ/m2) γ+L (mJ/m2) γ−
L (mJ/m2) η (cP)
Water 72.8 21.8 51.0 25.5 25.5 0.010Formamide 58.0 39.0 19.0 2.28 39.6 0.046Di-iodomethane 50.8 50.8 0 0 0 0.028Hexane 18.4 18.4 0 0 0 0.003
Data of this table were obtained from Refs.[11–12]; γL : surface tension,γLWL : Lifshitz–van der Waals component,γAB
L : Lewis acid–base interactions component,γ+
L : Lewis acidity,γ−L : Lewis basicity andη: viscosity.
2.2. FT-Raman spectroscopy
A Bruker IFS 55 FT-Raman instrument was appliedto record the spectrum of persimmon leaves from 100 to4000 cm−1. For this case, the Nd:YAG laser was set at200 mW with the wavelength of 1064 nm, and 50 scanswere accumulated and analyzed with a cosine functionbefore Fourier-transformation to give a spectral resolu-tion at 4 cm−1. The germanium-diode detector cooled to77 K by liquid nitrogen was applied with an integralpreamplifier.
Previously, the same application of FT-Raman spec-troscopy to characterize plant materials has been describedin detail[7,8].
2.3. Column wicking technique
Experimentally, a commercial measuring pipette with aninner diameter of 3 mm was employed as the column. For eachpacking, the pre-weighted persimmon leaves powder, e.g. of200 mg, were always packed with the same height to keep thepacking density constant for all columns. All measurementswere performed in a temperature of about 25± 1◦C, andeach reported value was averaged from three independentmeasurements as the same as recently we reported surfaceproperties for other materials[9,10].
ectru
As the same as literature[9,10], the probe liquids usedin this case were distilled water, analytic grade hexane, di-iodomethane and formamide. All these liquids were pur-chased from local companies in Shanghai without furtherpurification. The surface tension and its components forthese liquids were taken from Refs.[11,12] as summarizedin Table 1.
Since persimmon leaf has been known rich in cellulosecontent, e.g. of about 68%[13], a Sigma cellulose sample(C8002) was employed in this case as a reference. This reasonis because the surface free energy and related components forcellulose have been broadly reported in literature[10], so thatwe can check the validity of determined values for persimmonleaves by comparing the data of cellulose with literature.
3. Results and discussions
The FT-Raman spectrum of persimmon leaves was pre-sented inFig. 1. In terms of literature reported a numberof Raman spectra of lignocellulosics[7,8] and pharmaceuti-cal materials[14,15], it is generally known that the intensepeak located at of about 1607 cm−1 is contributed by lignindue to the CC of the coniferyl alcohol stretching vibra-tions[7,8]. In addition, the other two visible peaks located at,e.g. 1525 and 1156 cm−1, are probably ascribed to the fatty
Fig. 1. FT-Raman sp
m of persimmon leaves.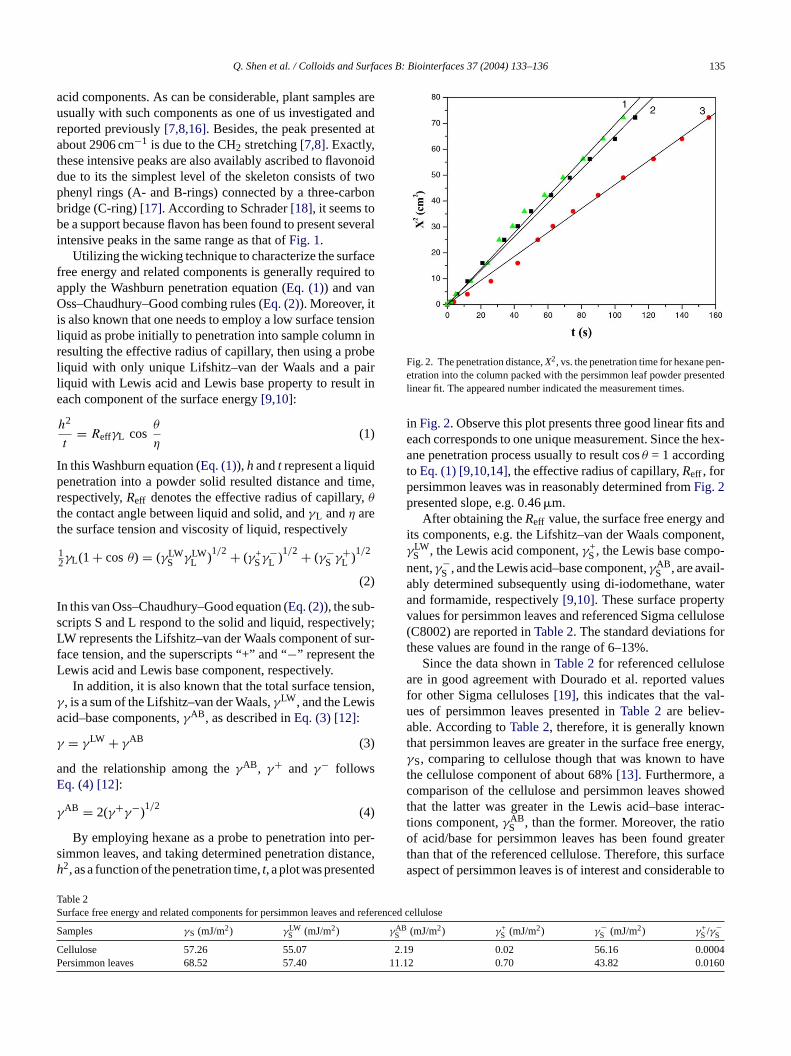
Q. Shen et al. / Colloids and Surfaces B: Biointerfaces 37 (2004) 133–136 135
acid components. As can be considerable, plant samples areusually with such components as one of us investigated andreported previously[7,8,16]. Besides, the peak presented atabout 2906 cm−1 is due to the CH2 stretching[7,8]. Exactly,these intensive peaks are also availably ascribed to flavonoiddue to its the simplest level of the skeleton consists of twophenyl rings (A- and B-rings) connected by a three-carbonbridge (C-ring)[17]. According to Schrader[18], it seems tobe a support because flavon has been found to present severalintensive peaks in the same range as that ofFig. 1.
Utilizing the wicking technique to characterize the surfacefree energy and related components is generally required toapply the Washburn penetration equation (Eq. (1)) and vanOss–Chaudhury–Good combing rules (Eq. (2)). Moreover, itis also known that one needs to employ a low surface tensionliquid as probe initially to penetration into sample column inresulting the effective radius of capillary, then using a probeliquid with only unique Lifshitz–van der Waals and a pairliquid with Lewis acid and Lewis base property to result ineach component of the surface energy[9,10]:
h2
t= ReffγL cos
θ
η(1)
In this Washburn equation (Eq. (1)), h andt represent a liquidpenetration into a powder solid resulted distance and time,
,
ely;sur-
ion,
per-nced
d refe
γABS
2.1.1
Fig. 2. The penetration distance,X2, vs. the penetration time for hexane pen-etration into the column packed with the persimmon leaf powder presentedlinear fit. The appeared number indicated the measurement times.
in Fig. 2. Observe this plot presents three good linear fits andeach corresponds to one unique measurement. Since the hex-ane penetration process usually to result cosθ = 1 accordingto Eq. (1) [9,10,14], the effective radius of capillary,Reff , forpersimmon leaves was in reasonably determined fromFig. 2presented slope, e.g. 0.46�m.
After obtaining theReff value, the surface free energy andits components, e.g. the Lifshitz–van der Waals component,γLW
S , the Lewis acid component,γ+S, the Lewis base compo-
nent,γ−S , and the Lewis acid–base component,γAB
S , are avail-ably determined subsequently using di-iodomethane, waterand formamide, respectively[9,10]. These surface propertyvalues for persimmon leaves and referenced Sigma cellulose(C8002) are reported inTable 2. The standard deviations forthese values are found in the range of 6–13%.
Since the data shown inTable 2for referenced celluloseare in good agreement with Dourado et al. reported valuesfor other Sigma celluloses[19], this indicates that the val-ues of persimmon leaves presented inTable 2are believ-able. According toTable 2, therefore, it is generally knownthat persimmon leaves are greater in the surface free energy,γS, comparing to cellulose though that was known to havethe cellulose component of about 68%[13]. Furthermore, acomparison of the cellulose and persimmon leaves showedthat the latter was greater in the Lewis acid–base interac-
AB ioeaterfacele to
respectively,Reff denotes the effective radius of capillaryθthe contact angle between liquid and solid, andγL andη arethe surface tension and viscosity of liquid, respectively
12γL(1 + cosθ) = (γLW
S γLWL )
1/2 + (γ+Sγ−
L )1/2 + (γ−
S γ+L )
1/2
(2)
In this van Oss–Chaudhury–Good equation (Eq. (2)), the sub-scripts S and L respond to the solid and liquid, respectivLW represents the Lifshitz–van der Waals component offace tension, and the superscripts “+” and “−” represent theLewis acid and Lewis base component, respectively.
In addition, it is also known that the total surface tensγ, is a sum of the Lifshitz–van der Waals,γLW, and the Lewisacid–base components,γAB, as described inEq. (3) [12]:
γ = γLW + γAB (3)
and the relationship among theγAB, γ+ and γ− followsEq. (4) [12]:
γAB = 2(γ+γ−)1/2
(4)
By employing hexane as a probe to penetration intosimmon leaves, and taking determined penetration distah2, as a function of the penetration time,t, a plot was presente
Table 2Surface free energy and related components for persimmon leaves an
Samples γS (mJ/m2) γLWS (mJ/m2)
Cellulose 57.26 55.07Persimmon leaves 68.52 57.40
,
renced cellulose
(mJ/m2) γ+S (mJ/m2) γ−
S (mJ/m2) γ+S/γ−
S
9 0.02 56.16 0.0004112 0.70 43.82 0.0160
tions component,γS , than the former. Moreover, the ratof acid/base for persimmon leaves has been found grthan that of the referenced cellulose. Therefore, this suraspect of persimmon leaves is of interest and considerab

136 Q. Shen et al. / Colloids and Surfaces B: Biointerfaces 37 (2004) 133–136
indicate this natural material to be easily separated[12]. Infact, theγAB
S value of persimmon leaves has been found alsolarger than that of literature reported other cellulose[19] andrecently we determined values for hemicellulose, e.g. xylan[20], to further suggests that we can apply persimmon leaf asa raw material to convert to other forms for developing newbiomaterials.
4. Conclusion
Using FT-Raman spectroscopy and column wicking tech-nique, the persimmon leaves are characterized of its surfaceproperties. Besides to find persimmon leaves have great sur-face free energy, its Lewis acid–base interactions componenthas been found greater than cellulose and hemicelluloses sug-gesting it to be easily separated and converting to new bio-materials expected forms.
Acknowledgements
This work was financially supported by Chinese EducationMinistry.
68.683.
[3] M. Kotani, A. Fujita, T. Tanaka, J. Jpn. Soc. Food Sci. 52 (1999)147–151.
[4] M. Kotani, M. Matsumoto, A. Fujita, S. Higa, W. Wang, M. Sue-mura, T. Kishimoto, T. Tanaka, J. Allergy Clin. Immunol. 106 (2000)159–166.
[5] M. Matsumoto, M. Kotani, A. Fujita, S. Higa, T. Kishimoto, M.Suemura, T. Tanaka, Br. J. Dermatol. 146 (2002) 221–227.
[6] T. Tanaka, S. Higa, T. Hirano, M. Kotani, M. Matsumoto, A. Fujita,I. Kawase, Curr. Med. Chem.—Anti-Inflamm. Anti-Allergy Agents2 (2003) 57–65.
[7] Q. Shen, Interfacial Characteristics of Wood and Cooking Liquor inRelation to Delignification Kinetics,̊Abo Akademi University Press,1998.
[8] Q. Shen, J.B. Rosenholm, in: D.S. Argropoulos (Ed.), Advances inLignocellulosics Characterization, TAPPI Press, 1999 (Chapter 10).
[9] Q. Shen, J.F. Hu, Q.F. Gu, X.R. Teng, Y.F. Zhu, J. Colloid Interf.Sci. 267 (2) (2003) 333–336.
[10] Q. Shen, J.F. Hu, Q.F. Gu, Chin. J. Polym. Sci. 22 (1) (2004) 33–37.[11] Q. Shen, Langmuir 16 (9) (2000) 4394–4397.[12] C.J. van Oss, M.K. Chaudhury, R.J. Good, Chem. Rev. 88 (1988)
927.[13] J.F. Hu, T.L. Zuo, H. Zhang, Q. Shen, J. Inner Mongolia Polytechn.
Univ. 21 (4) (2002) 272–275 (in Chinese).[14] J. Goral, V. Zichy, Spectrochim. Acta 46A (1990) 253–275.[15] E.A. Cutmore, P.W. Skett, Spectrochim. Acta 49A (1993) 809–
818.[16] J. Nylund, K. Sundberg, Q. Shen, J.B. Rosenholm, Colloids Surf. A
133 (1998) 261–268.[17] T. Lwashina, J. Plant Res. 113 (2000) 287–299.[18] B. Schrader, Raman/Infrared Atlas of Organic Compounds, 2nd ed.,
VCH, New York, 1977.ch-
03)
References
[1] S. Funayama, H. Hikino, Chem. Pharm. Bull. 27 (1979) 2865–28[2] K. Kameda, T. Takaku, H. Okuda, J. Nat. Prod. 50 (1987) 680–
[19] F. Dourado, F.M. Gama, E. Chibowski, M.J. Mota, Adhes. Sci. Tenol. 12 (1998) 1081.
[20] Q.F. Gu, Q. Shen, J.F. Hu, Trans. China Pulp Paper 18 (2) (2011–13 (in Chinese).