Embed Size (px)
Citation preview
Chemical banding revealed by chemical etching in a cold‐rolled
metastable stainless steel
C. Celada a,*, I. Toda‐Caraballo b, B. Kimb, D. San Martín a
aMATERALIA Research Group, Department of Physical Metallurgy, Centro Nacional de
Investigaciones Metalúrgicas (CENIM – CSIC), Av. Gregorio del Amo 8, 28040 Madrid, Spain.
bDepartment of Materials Science and Metallurgy, University of Cambridge, Pembroke Street,
Cambridge CB2 3QZ, UK.
E‐mails: [email protected]; [email protected]; [email protected]; [email protected].
* Corresponding author:
Carola A. de Celada
Department of Physical Metallurgy, CENIM‐CSIC.
Av. Gregorio del Amo, 8, 28040, Madrid, Spain.
Tel: 0034 91 553 89 00 (Ext 272)
Fax: 0034 91 534 7425
E‐mail: [email protected]
Materials Characterization 84 (2013) 142‐152
http://dx.doi.org/10.1016/j.matchar.2013.07.018
Abstract
The current work describes the metallographic characterization of the initial microstructure of
a cold rolled precipitation hardening semi‐austenitic stainless steel (12Cr‐9Ni‐4Mo‐2Cu‐1Ti, in
wt. %). The use of the Lichtenegger and Blöch (L‐B) colour etching solution has been shown to
reveal not only the phases present in the microstructure, but also the existence of chemical
banding along the rolling direction. The L‐B reagent has been found to colour the
microstructure in bands depending on what alloying elements have segregated to each band.
Two‐dimensional electron probe microanalysis (EPMA) maps have shown that Ni, Cu and Ti
segregate together in the bands, while Cr has an opposite behaviour. Mo has a mixed
segregation behaviour although much weaker than the other elements and more prompt to
segregate like Ni does. A direct comparison of light optical micrographs with the EPMA maps of
the same area of the microstructure has enable to establish a direct relationship between the
alloying element band concentration and the resulting etching colour contrast obtained with
the L‐B reagent. Thermodynamic calculations predict that solidification in this steel takes place
with ferrite as the primary phase. Equilibrium partitioning coefficient calculations seem to
support the observed segregation patterns.
Keywords
Austenitic stainless steel; segregation; colour etching; chemical banding; EPMA measurements.
1.Introduction
Microstructural banding occurs quite commonly in high‐strength high‐alloyed steels [1,2]. Its
presence has been attributed to the segregation of alloying elements during solidification. In
this process, alloying elements are rejected from δ‐ferrite dendrites, leading to a high solute
content in the interdendritic regions. In subsequent forming operations, such as extrusion or
rolling, areas in the microstructure exhibiting segregation align along the material flow
direction in the form of bands, resulting in the so‐called chemical banding. Band width and
pattern vary with the degree of inhomogeneity and the mechanical processing history [3,4].
This inhomogeneous solute distribution might give raise to a microstructural banding during
solid‐solid phase transformations [5]. In this respect Verhoeven et al. [6] have written an
extensive review concerning microsegregation induced banding phenomena in steels and have
described the characteristics of banding present in different types of steels.
The segregation of alloying elements can produce different etching responses, which can lead
to the disclosure of regions of different composition. To the author’s knowledge, one of the
first to reveal the presence of microsegregation was Stead [6]. His Cu based etchants (Stead’s
reagents), are extremely effective at revealing the relative phosphorous concentration in steels
or phosphorous segregation to eutectoid cells in gray cast iron [6,7]. In the same sense, a large
number of etchants that reveal chemical banding/segregation have been reported afterwards
[5‐8]. It is worthwhile to point out the difference between etchants that indirectly reveal
chemical banding, as the bands consist of different phases resulting from a previous
microsegregation [5,6]; and etchants which vary the coloration according to the alloying
element content in monophasic microstructures [7,8], as has been investigated in this study.
In high alloyed maraging steels it has been shown that the microsegregation of alloying
elements can be removed or slightly reduced by annealing for several hours at high
austenitization temperature [1]. This heat treatment procedure is also a standard practice in
low alloy steels to reduce the chemical banding observed in, for example, carbon‐manganese
steels [9]. The temperatures and times needed to chemically homogenize the microstructure
depend on the element that appears segregated, the high temperature matrix phase
(austenite, martensite, ferrite) and steel composition. Chemically banded structures and their
evolution with homogenization treatments have been studied by means of electron probe
microanalysis (EPMA) [5,10]. In general, this technique has been proven very useful to
investigate the composition of different phases in steels and thus help in the study phase
transformations or assess the quality of steel products [11‐15].
The maraging stainless steel under study in this work was developed in the mid‐nighties as a
promising alloy for very demanding applications such as for surgical needles [16]. Although due
to the excellent combination of mechanical properties of this type of steels it could be
potentially attractive for other applications [17,18]. Since then, several investigations have
been published to obtain a deeper physical understanding of its unique properties. In the
metastable austenitic annealed state (), it transforms to martensite (α’) phase either under
the application of stresses/strains or when subjected to cryogenic treatments [19]. In addition,
it has been shown recently that this transformation (’) can be accelerated by applying
external magnetic fields [20‐22]. After its transformation to martensite, the optimum
mechanical properties are obtained by precipitation hardening of nano‐intermetallic phases
[23]. For this investigation, this steel has been received as cold‐rolled sheets which contain an
almost fully martensitic microstructure. The research described in this manuscript is part of a
wider investigation concerning the reaustinization (martensite to austenite transformation) of
cold‐rolled sheets of this metastable stainless steel and the achievement of sub‐micrometer
size austenitic microstructures with improved mechanical properties. Using this approach, very
interesting mechanical properties have been obtained in similar steels [24, 25]. Chemical
banding has been observed in the initial cold‐rolled martensitic microstructure of this steel.
Previous research has shown that the presence of chemical banding affects phase
transformations and properties of steels [10, 26]. Thus, it should be expected that it will also
have a prominent influence on the nucleation and growth of austenite during the
reaustinization process. For this reason the phases present in the initial microstructure and the
chemical banding observed in the as‐received microstructure have been thoroughly
characterized by light optical microscopy (LOM), scanning electron microscopy (SEM), EPMA
and X‐ray diffraction (XRD). Furthermore, an attempt was made to eliminate or minimize this
chemical banding by applying high temperature heat treatments. However, it was not the
intention of this paper to provide a detail investigation on the influence of high temperature
heat treatments on the chemical banding detected in the initial microstructure. Results
corresponding to a heat treatment performed at 1100 ºC for 18 hours are described and have
been characterized using some of the experimental techniques also used to characterize the
as‐received microstructure. Higher temperatures have been avoided as the delta ferrite
formation has been detected. It should be added that the application of these heat treatments
transforms the initial martensitic microstructure to austenite and makes this high temperature
phase so unstable that it quickly transforms back to martensite isothermally after cooling
down to room temperature [27].
The results of this characterization show that a direct relationship can be established between
the chemical banding characterized by EPMA and the etching contrast revealed by chemical
etching using Lichtenegger‐Blöch (L‐B) reagent. The application of this chemical etchant to
other martensitic stainless steels could be a fast procedure to reveal the presence of chemical
banding.
2. Materials and Methods
Steel samples have been received in the form of cold‐rolled sheets with a thickness of 0.45 mm
approximately. These sheets have been obtained after a process of continuous casting
followed by hot‐rolling and cold‐rolling until the target thickness (0.45 mm) is obtained. The
application of heavy cold‐rolling not only causes the transformation of the as‐cast metastable
austenite into martensite, but also the severe deformation of the strained induced martensite.
As it will be shown later on, a small volume fraction of retained austenite and chi‐phase (χ)
precipitates (<1 µm) have been found in the microstructure.
Due to its importance for this work, several methods have been used to determine the
chemical composition of the considered steel. An accurate quantitative determination of the
main alloying elements has been done using different techniques: the Ni content has been
obtained by gravimetric analysis, the Cr content by volumetric analysis, and the Mo, Cu, Ti and
Al contents have been determined by atomic absorption spectrometry (VARIAN, SpectrAA 220
FS). On the other hand, a semi‐quantitative analysis of Si and Mn has been done by using a
"Bruker" Wavelength dispersive X‐ray fluorescence spectrometer (WDXRF). The chemical
composition of the steel determined by quantitative and semi‐quantitative techniques is
shown in Table 1.
With the aim of studying which phases are present in the initial microstructure as well as
potential microsegregation problems, the metallographic characterization has been carried out
on the cross section (perpendicular to the rolling direction) of the steel sheets. Steel specimens
have been ground and polished using standard metallographic preparation procedures,
finishing with 1 μm diamond paste. For XRD and SEM inspection, samples were finalized using
a colloidal silica solution. Subsequently, for SEM and LOM observation the microstructure has
been etched with three different chemical solutions whose composition is shown in Table 2.
The microstructure was inspected using one optical microscope (Nikon Epiphot 200) and two
scanning electron microscopes (a FEG‐SEM Hitachi S4800 and a FEG‐SEM JEOL J8M6500).
Phase identification has been performed by using a Siemens D5000 X‐ray diffractometer,
which operates with Co Kα‐radiation. Diffraction patterns have been recorded on the cross
section and on the surface along the rolling direction. In order to have a large enough material
surface to inspect the cross section (thickness of 0.45 mm) up to ten samples were mounted
together.
The microsegregation of alloying elements (Cr, Ni, Mo, Cu and Ti) has been investigated by
means of EPMA. These measurements have been performed using a JEOL JXA 8900R
microprobe with a wavelength dispersive spectrometer (WDS) at the ICTS National Centre for
Electron Microscopy (CNME), located at the Complutense University of Madrid [28]. The
homogenization heat treatments were performed to find out their effectiveness on reducing
or eliminating the banded structure. This heat treatment was carried out using the high
precision furnace of a high resolution dilatometer (Adamel Lhomargy DT1000). Samples of 12
mm in height and 4 mm in width were heated at 1100 ºC for 18 hours in a vacuum atmosphere
of 10‐1 mbar. Two‐dimensional (2D) EPMA maps have been recorded in as‐received and heat
treated samples using a step size of 1 μm over an area of 450 x 200 μm2, which gives
qualitative information about the local concentrations of the elements analyzed. Steel samples
have been prepared for EPMA in the same way as for LOM observation. Optical micrographs
were also taken of the areas studied with EPMA for comparison.
3. Results
3.1. X‐ray Diffraction
Fig. 1a and 1c show X‐ray diffraction patterns undertaken on the surfaces perpendicular to the
rolling and to the normal directions of the as‐received steel sheets, respectively. Fig. 1b and
1d highlight a specific angle range of Fig. 1a and 1c where positions of specific χ‐phase
diffraction peaks have been pointed out by arrows. These patterns show that the main phase
present in the cold‐rolled as‐received microstructure is martensite. As it would be expected,
the martensite phase shows a very strong preferential texture induced by the severe cold‐
rolling: (110) in the cross section and (211) in the longitudinal section. There is also a small
amount of χ‐phase precipitates and retained austenite. The χ‐phase is a hard and brittle
intermetallic phase whose basic composition is Fe36Cr12Mo10, although it usually contains other
elements like Ti or Ni [29‐31]. Peaks associated with austenite have only been detected in
sample sections perpendicular to the normal direction (Fig. 1c and 1d). This could be explained
because that section analysed contained a larger amount of austenite compared to the bulk of
the material (Fig. 1b and 1d). Since the peaks corresponding to the austenite have not been
detected in Fig. 1a, and because the detection limit of XRD measurements can be regarded as
around ~0.02‐0.03, it could be concluded that the volume fraction of austenite in this cold‐
rolled material is below this amount (0.02‐0.03). The presence of a strong texture in the
material could also make it more difficult to detect the austenite peak in the transversal
section.
3.2. Scanning electron and light optical microscopy
Fig. 2 shows a set of secondary electron SEM micrographs and an optical micrograph of the as‐
received microstructure. Fig. 2a displays the microstructure after electrolytic etching for 10
seconds at 15 V dc with a 10 % oxalic acid solution. This etching method reveals second phases
and leaves the martensitic matrix basically unetched. The big, cubic shaped particles are
titanium nitride (TiN) precipitates. Titanium has a high affinity for nitrogen, as well as for
carbon, and thus it binds the residual nitrogen and/or carbon present in the steel leading to
the formation of both, nitrides TiN and carbo‐nitrides Ti(CN) [32]. On the other hand, the
smaller and brighter particles are χ‐phase. As can be observed in Fig. 2a, a number of holes are
present in the microstructure because some χ‐phase precipitates have been partially
consumed/extracted from the matrix. The formation of χ‐phase precipitates results in a
decrease in the Cr content around them, which gives rise to an extremely localized corrosion in
the course of the electrolytic etching. The microstructure that displays Fig. 2b has been etched
with L‐B etching solution (Table 2). Although most chemicals, when dissolved in water,
generate heat and produce an exothermic reaction, ammonium bifluoride absorbs heat, so the
reaction is endothermic. If the distilled water is at room temperature, the solution gets colder,
and the ammonium bifluoride will not dissolve. Consequently, one must heat the water before
dissolving the ammonium bifluoride. This etchant is generally used at approximately 25 to 30
ºC, rather than at room temperature [33,34]. However, it has been found that when this
etching solution is used hot, around 60 – 80 ºC, more features of the microstructure are
revealed in this kind of stainless steels [29]. On the other hand, when using ammonium
bifluoride (NH4F·HF), one should take in account that in contact with water it will decompose
to ammonium fluoride (NH4F) and hydrofluoric acid (HF). The HF content of the resulting
solution makes it very corrosive, toxic and hazardous. Therefore, this solution must be handled
with care.
After etching with L‐B for 10 seconds at 60 ºC (Fig. 2b), χ‐phase precipitates are made visible
and appear as elongated or rounded white particles (Fig. 2c). Apart from χ‐phase precipitates,
retained austenite and δ‐ferrite stringers, as identified by SEM‐EDX, have been highlighted in
this latter picture.
The volume fraction of these phases has been estimated by using the point counting method
[35], in more than 10 SEM representative micrographs. The results show a volume fraction of
around 0.01 both for the δ‐ferrite phase and retained austenite, and around 0.02 for the χ‐
phase. It should be bared in mind that these numbers might be slightly underestimating the
real volume fraction as smaller particles below 50‐100 nm are not considered in the estimation
of the χ‐phase. The identification of the phases has been done by SEM‐EDX. The recognition of
the χ‐phase is rather straightforward, since the content of Mo in the overwhelming majority of
precipitates is higher than 8 wt. %. The detection of the retained austenite and δ‐ferrite phases
has been based on the content of Cr and Ni. The following results have been obtained for
retained austenite: (11.2 ± 0.7) wt. % of Ni and (11.4 ± 0.4) wt. % of Cr; for δ‐ferrite: (6.1 ± 0.8)
wt. % of Ni and (13.1 ± 0.5) wt. % of Cr; and for the martensitic matrix: (8.8 ± 0.6) wt. % of Ni
and (11.9 ± 0.6) wt. % of Cr.
Fig. 2d displays an optical micrograph where the microstructure has been revealed by
electrolytic etching with NaOH (10 %) at 15 V dc for 10 seconds. After etching, δ‐ferrite
stringers are clearly revealed, appearing as the black‐etching phase. The small black spots, that
can also be distinguished, are attributed to the χ‐phase. As can be observed, TiN is etched in
light yellow and the matrix remains unetched.
Fig. 3 shows an optical micrograph of the complete cross section of the as‐received material. In
this case the sample has been etched with L‐B solution at 60 ºC for 30 seconds. As can be
observed, χ‐phase precipitates and titanium nitrides remain white, while the martensitic
matrix is etched in different colours from yellow and light‐brown to dark‐brown and dark‐blue.
3.3. Electron Probe Microanalysis (EPMA)
EPMA maps for Cr, Ni, Mo, Cu and Ti are shown in Fig. 4b‐f. They have been recorded over the
same area of 450 x 200 μm2 that shows the optical micrograph in Fig. 3. However, in order to
avoid some undesirable edge effects, the maps have been trimmed up to 447 x 173 μm2 by
using the program ImageJ [36]. Each EPMA map contains the concentration of each element by
means of an intensity parameter that can be easily processed to represent the content of each
element per recorded pixel. This computation is under the assumption the analysed area has
the same average composition as the steel (Table 1), which is reasonable because no
significant compositional variations have been observed on a surface along the rolling
direction.
Fig. 4a represents the optical micrograph shown in Fig. 3 but transformed to brown scale.
There is a clear correlation between the brighter bands of the optical image and the bands
with higher content of Ni, Cu and Ti, while low concentration of Cr corresponds to darker
bands in the optical image. That means that the L‐B reagent is sensitive to the segregation of
elements like Ni, Cu, Ti or Cr. However from these results it is not possible to disclose which
influences most the etching response.
The presence of intermetallic precipitates in the steel may mask compositional variations of
the matrix, as these will appear as very large concentration peaks in the maps. The scale of
titanium map (Fig. 4c) is performed to display such compositional variation. It has to be borne
in mind that, stoichiometrically, the calculated Ti concentration in TiN is much higher (77.37
wt. %) than the average chemical composition of the steel (1.35 wt. %). For this reason, in
order to disclose the titanium segregation behaviour, in the EPMA map the maximum
threshold value for this element has been set to 2.5 wt. %. TiN precipitates appear thereby as
dark‐red cubic phases. In the other concentration maps, the presence of a TiN causes the
opposite: very low or null concentration values of the corresponding alloying element.
Therefore, to highlight the underlying segregation behavior in the Ni, Cr, Mo or Cu maps, the
minimum concentration value was raised from zero to a higher value. This value was chosen
for each map with the aim of minimizing the masking influence of TiN particles only, but
always keeping it certainly below the minimum concentration value associated to the
segregation pattern. Choosing this value was easy as zero concentration values related to TiN
particles appear clearly differentiated in these maps and distinguishable from the segregation
pattern. For this reason TiN particles appear as dark‐blue cubic phases in Fig. 4b and 4d‐f.
Regarding the concentration maps for chromium and molybdenum, the presence of fine
particles (<1 µm) of χ‐phase (Fe36Cr12Mo10) in the microstructure may also influence peak
concentration values found in the maps. According to the stoichiometry of χ‐phase, the
concentration of Mo (27.7 wt. %) and Cr (17.4 wt. %) is expected to be much higher than their
average matrix content (4.05 and 12.00 wt. %, respectively). However, and contrary to the TiN
precipitates (size ~3‐10 µm), the size of χ‐phase precipitates is smaller than the interaction
volume excited by the beam (spatial resolution 1‐2 µm). This means that the microanalysis
spot covers at the same time matrix and χ‐phase precipitates. Thus, maximum concentration
values of Cr and Mo in the maps due to the presence of these precipitates are lower than it
could be expected.
The results shown in Fig. 4 demonstrate that there is a clear chemical banding of Cr, Ni, Cu,
and Ti along the thickness of the steel sheets. These results also show that Ni, Cu and Ti
segregated in a similar fashion, while Cr has an opposite behaviour. Molybdenum shows a
weaker segregation pattern than these other elements and slightly similar to Ni, Cu or Ti.
Although this is not clearly visible in the maps from Fig. 4, it can be easily concluded from the
results shown in Fig. 5. In this figure, compositional variations of Ni, Cu, Mo and Cr are
compared with intensity variations observed in the optical micrograph after etching with L‐B
solution. These line scans represent variations measured along the white dashed line drawn in
Fig 4a. In the concentration maps a line scan going through the same path has been
considered. All intensity and concentration data points were normalized by dividing each value
by the mean value in addition to a reduction of noise by a curve smoothing. The curve
smoothing was done by using the five‐point moving average, disclosing the underlying trend of
the data and leaving out noise or other fine scale structures, such as sharp maximum and
minimum. It has been found that Ni, Cu and Mo follow the same trend than the intensity of
the optical micrograph, while Cr trend is opposite. Moreover, this latter alloying element
shows a less pronounced segregation pattern than the others. For each maximum or minimum
of Cr there is a minimum or maximum of Ni, Cu, Mo and LOM intensity, respectively. It is
surprising how in good agreement the trends of Ni, Cu (and Mo to a lesser extend) are with
respect to the intensities of the optical micrograph.
Several heat treatments were performed with the aim of eliminating or reducing the chemical
banding observed in the initial microstructure. The main concerned of these heat treatments
was to avoid the formation of ‐ferrite, which has been reported to nucleate at 1175 ºC after
short annealing times [27]. Thermodynamic calculations performed with ThermoCalc software
[37] have shown that above 1020 ºC ‐ferrite forms under equilibrium conditions in this steel.
However, this temperature is too low to expect diffusion of alloying elements to be fast
enough to reach the homogenization of the microstructure within reasonable holding times.
The experiments carried out by the authors, but not discussed in this work, showed that ‐
ferrite is formed at 1150 ºC before any homogenization of the microstructure takes places,
while at 1100 ºC it starts forming after 24 hours. For this reason the annealing time was
reduced down to 18 hours. Fig. 6 shows EPMA maps of the main alloying elements for the
cross section of a sample, which was heat treated at 1100 ºC for 18 hours. Although the heat
treatments were carried out under vacuum conditions (10‐1 mbar), holding the sample at high
temperature for long times has slightly damaged the sample surfaces. Due to this slight
modification of the microstructure caused by the heat treatment, the borders of these maps
(~60 µm of each side) have been cropped. To avoid the influence of TiN precipitates on
disclosing properly the microsegregation, the minimum cut‐off values have been set so as to
disclose the segregation behaviour of the elements, as it was done in Fig. 4. As expected, the χ‐
phase precipitates have been dissolved since Mo contents higher than 8 wt. % were not
detected (Fig. 7). After 18 hours of heat treatment the chemical banding has been substantially
reduced. Locally (~1‐10 µm), chemical element distribution has been significantly
homogenized and most micro‐bands have disappeared; however some big macro‐segregation
bands (~100‐200 µm in width) remain present and are especially evident for the Cr, Ni and Cu
maps.
4.Discussion
4.1.ColouretchingandElectronProbeMicroanalysis.
4.1.1.RevealingsegregationbyColouretching
Colour metallographic etchants react with the specimen surface to form what appears as
stable films or tints. Contrary to standard chemical acid etchants, where the corrosion
products produced during etching are dissolved into the etchant and phase boundaries are
generally the only features revealed, the surface is, generally, not physically altered. Common
tint etchants used for steels are aqueous solutions of sodium metabisulfite (Na2S2O5) or
potassium metabisulfite (K2S2O5) and/or sodium thiosulfate (Na2S2O3∙5H2O). In these solutions
metabisulfite (S2O52‐) and the thiosulfate (S2O3
2‐) ions are the active ingredients. In aqueous or
acidic solutions, in contrast to a metallic surface, these ions decompose into sulphur dioxide
(SO2), hydrogen sulphide (H2S), sulphur, and hydrogen. The SO2 depassivates surfaces,
particularly stainless steel surfaces, promoting film formation. The H2S provides the sulphur ion
(S2‐) that creates a sulphide film on the steel surface when ions of iron, nickel, or cobalt are
present [34,38]. The colours observed by LOM depend on the thickness of the non‐metallic
film formed as a result of the chemical reaction between the steel specimen and the reagent.
These also depend on the etching conditions and crystallographic orientation of the particular
phase [39]. Several colour etching solution used in stainless steels have been developed in the
last decades; the most popular one is probably Behara and variations to this etchant [8,34,40];
but others like Murakami, L‐B or Groesbeck’s etching solutions have been found also useful to
differentiate phases such as ferrite, austenite, sigma phase or carbides in this type of steels
[34]. The L‐B colour etching solution has been frequently used in duplex stainless steels to
differentiate δ‐ferrite from austenite. Some of the authors have used it in the past to
differentiate martensite, austenite and the χ‐phase in the stainless steel investigated, in
annealed condition [29]. In their seminal work [8], Lichtenegger and Blöch studied the
usefulness of Behara etching solution and variations to the composition of this etchant. Their
results seem to show that increasing the content of potassium metabisulphite and/or changing
the hydrochloric acid by ammonium diflouride (NH4FHF) helps revealing chemical banding in
austenitic steels. They proposed a reagent, become to be known as L‐B etching solution, which
was able to differentiate clearly ferrite from austenite and also chemical segregation within
austenite in austenitic‐ferritic welded materials. Besides, Di Schino et al. [4] found that, in low‐
Ni austenitic stainless steels, the L‐B reagent etches yellow the Ni rich austenite and blue the
Ni poor austenite. After etching the steel under investigation in this work with the hot L‐B
colour etching solution (Fig. 3), it has been clearly observed that the martensitic matrix
exhibits a similar etching contrast than the austenite described by Di Schino et al. [4].
Martensite is etched in different shades of brown, from yellow and light‐brown to dark‐brown
or dark‐blue, and different intensity variations as well. The comparison of the optical
micrograph (Fig. 3) with the EPMA maps (Fig. 4) establishes a clear relationship between the
content of Ni, Cu, Mo and Ti in solid solution and the colour and brightness resulting after
etching. Alloying elements Ni, Cu, Mo and Ti segregate together, whereas the Cr has an
opposite behaviour. Bands enriched in Ni are coloured in bright yellow, whereas those
depleted in Ni (consequently enriched in Cr) are coloured dark‐brown or dark‐blue. In any
case, it can be concluded that the higher the Ni content the brighter the etching. As the Ni
content decreases, the brightness of the etching decreases as well, so that the darkest bands
correspond to the lowest Ni contents. This effect is clearly noticeable in the bands of the
centre of the sample section.
In addition to the tint etchant, many authors find electrolytic etching the easiest and most
effective way of phase identification in stainless steels. The process is rather simple; the
specimen becomes the anode and the cathode consists of a non‐dissolving material such a
stainless steel or pure iron. A simple battery with a direct current is applied at room
temperature to activate the etching process. Thus, metal ions are conducted away from the
anode into the electrolyte solution, that is, the etching solution. A 10 % aqueous oxalic acid
solution is widely used to reveal carbides, second phases and grain structures in austenitic
stainless steels. If it is present, this etch will also outline δ‐ferrite [38,41], although in our
investigation it has been more useful the use of a 10 % solution of NaOH. This later reagent is
more commonly used to disclose uniquely the δ‐ferrite phase in duplex stainless steels [39].
This electrolytic etchant can also help revealing phases such as the sigma (σ) and χ‐phase [42],
as it has been show in this work in Fig. 2d.
4.1.2.Effectofhomogenizationonchemicalbanding
Fig. 7 shows four charts, in which compositional variations before and after the
homogenization treatment are compared for the main alloying elements. Fig. 7 has been
performed following the same procedure as for obtaining Fig. 5. As it was discussed previously,
the sample exhibits not only a local chemical banding, but also a big macro‐segregation of
about 150 – 200 nm. Fig. 7 reveals that, after a heat treatment at 1100 ºC for 18 hours, the
local chemical banding has been substantially reduced; however, the macro‐segregation
persists. This macro‐segregation is especially noticeable in Ni, Cu and Cr. In the case of Mo, the
macro‐segregation is less evident. On the other hand, possible maximum peaks related to the
χ‐phase precipitates have also disappeared, since at 1100 ºC the temperature is high enough to
dissolve the χ‐phase precipitates completely.
4.2.Solidificationmode
It is well known that the presence of chemical banding originates from the solidification
process and subsequent processing involved in the manufacturing of the steel. For austenitic
stainless steels, the solidification path followed by the melt during cooling has been related in
the past to Ni equivalent (Nieq) and Cr equivalent (Creq) of the steel, which are used to simplify
a multi‐composition system into the Fe‐Cr‐Ni ternary system [4,15,26]. Depending on the ratio
of Ni equivalent an Cr equivalent (Creq/Nieq), the solidification modes of austenitic stainless
steels can be divided into the following four types, namely austenitic (A mode), austenitic –
ferritic (AF mode), ferritic – austenitic (FA mode) and ferritic solidification (F mode) [15,26]:
A mode: → → ; Creq/Nieq < 1.25;
AF mode: → → → → ; 1.25 < Creq/Nieq < 1.48;
FA mode: → → → → ; 1.48 < Creq/Nieq < 1.95;

F mode: → → → ; Creq/Nieq > 1.95.
Ma et al. [26] use the following equations for estimating Nieq and Creq:
Ni %Ni 30 %C 30 %N 0.5 %Mn (1)
Cr %Cr %Mo 1.5 %Si 0.5 %Nb (2)
With equations (1) and (2), Creq and Nieq have been calculated for the steel under investigation
in this work, resulting 16.75 wt. % and 9.85 wt. %, respectively; and Creq/Nieq as 1.70. So, the
solidification mode of the steel falls into FA mode. This solidification mode is divided in two
stages: the primary δ‐ferrite precipitation stage and the three‐phase reaction stage. At the
primary δ‐ferrite precipitation stage, δ‐ferrite dendrites form directly from the melt. As the
solidification goes on, it reaches the three‐phase reaction stage when eutectic colonies appear
among the primary δ‐ferrite dendrites [26]. Thermodynamic calculations carried out with
ThermoCalc software [37], using TCFE6 (version 6.2) database, predict also that solidification
would develop forming first of all δ‐ferrite at 1437 ºC and, later on, austenite at 1397 ºC.
Guo et al. [15] studied the solidification process in a commercial austenitic stainless steel type
316, which is also a metastable stainless steel. This alloy solidifies under mode FA in a similar
way as the stainless steel under investigation in this work. During the solidification of the alloy
through δ‐ferrite, Guo et al. calculated that the equilibrium partitioning coefficients Ni and Cr
would be lower and larger than unity, respectively; Ni would tend to partition to the
untransformed melt while the amount of Cr would increase in δ‐ferrite. This would be
expected as it is well known that Cr and Ni stabilize ferrite and austenite phases respectively.
In the same sense, the partitioning coefficient of Mo is predicted as lower than unity for the
316 alloy, which would imply that Mo, as for Ni, during the formation of δ‐ferrite would
partition to the melt and both these elements would appear segregated similarly after
solidification at room temperature. Subsequently, if the sample is not quenched, the δ‐ferrite
would transform to metaestable austenite, but some vermicular δ‐ferrite would be likely
retained. Their predictions were in good agreement with the experimental results. Table 3
shows equilibrium partitioning coefficients taken from the work by Guo et al. considering δ‐
ferrite as the primary phase. Similar calculations have been undertaken in this work using
ThermoCalc for alloy 316 and also for the alloy investigated in this work (and given in Table 3).
For alloy 316, good agreement between both calculations is found for Ni and Cr, but not for
Mo. The discrepancy between these calculations is not clear but could be due to the use of
different thermodynamic databases.
Equilibrium partitioning coefficient calculations for the alloy investigated in this work (Table 3)
predict a strong partitioning of Ni, Cu and Ti to the melt during the formation of δ‐ferrite, while
Cr and Mo would show an opposite but much weaker behaviour. These predictions would
explain the segregation pattern results shown in Fig. 4‐5 except for Mo. This element shows a
weak segregation behaviour but more similar to Ni, Cu or Ti than for Cr (Fig. 5). The lack of
reliable thermodynamic data in this range of molybdenum compositions in novel high alloyed
steels could be the origin of the discrepancies found between experiments and calculations. In
addition, one should also bear in mind that experimental results are generally far from
thermodynamic equilibrium conditions. Despite of the discrepancies and limitations of these
calculations, they agree reasonable well with the experimental observations.
Finally, some δ‐ferrite has been observed retained at room temperature in this alloy (Fig. 2),
feature that has been observed also in the scientific literature for similar alloys like 316 [26].
All these observations would corroborate that, as for alloy 316 used in this discussion for
comparison, solidification would take place in this steel through de FA mode.
5. Conclusions
1. The initial microstructure of a cold rolled precipitation hardening semi‐austenitic stainless
steel has been characterized in this work. The metallographic characterization has been carried
out by using different chemical and electrolytic etching solutions. The use of the Lichtenegger
and Blöch (L‐B) colour etching solution has been shown to reveal not only the phases present
in the microstructure, but also the existence of chemical banding along the rolling direction.
The L‐B reagent has been found to colour the microstructure in bands depending on what
alloying elements have been segregated to each band.
2. Two‐dimensional electron probe microanalysis (EPMA) maps have shown that Ni, Cu and Ti
segregate together in the bands, while Cr has an opposite behaviour. Mo has a mixed
segregation behaviour but more prompt to segregate like Ni does. On the other hand, EPMA
has also revealed that, in addition to the local micro‐chemical banding (lateral spacing of 1‐10
µm), there is also a macro‐segregation (100‐200 µm).
3. A comparison of the light optical micrographs with the EPMA maps has enable to establish
a direct relationship between the alloying element band concentration, especially Ni content,
and the resulting etching colour contrast obtained with the L‐B reagent.
4. Homogenization heat treatment at 1100 ºC for 18 h has substantially reduced the banded
structure. However, this treatment does not seem to affect much the macro‐segregation.
5. Thermodynamic calculations predict that solidification in this steel takes place with ferrite
as the primary phase (Ferritic‐Austenitic mode). Equilibrium partitioning coefficient
calculations seem to support the observed segregation patterns.
6. Acknowledgements
Authors are grateful to Centro Nacional de Microscopía Electrónica (CNME), located at
Complutense University of Madrid, for the provision of laboratory facilities and to Alfredo
Fernández Larios for the technical support. C. Celada and D. San Martín would like to
acknowledge the financial support from the Ministerio de Economía y Competitividad (project
No. MAT2010‐19522). C. Celada is also very grateful to the Consejo Superior de Investigaciones
Científicas (CSIC) in the form of a JAE‐predoc grant under the program “Junta para la
Amplianción de Estudios”, co‐funded by the European Social Fund. Dr. Niels H. van Dijk from
TUDelft (The Netherlands) is gratefully acknowledged for fruitful discussions.
7. References
[1] Ahmed M, Salam I, Hashmi FH, Khan AQ. Influence of banded structure on the mechanical
properties of a high‐strength maraging steel. JMEPEG 1997; 6:165‐171.
[2] Salmon Cox PH, Reisdorf BG, Pellissier GE. The origin and significance of banding in 18Ni
(250) Maraging Steel. Trans AIME 1967; 239:1809‐1817.
[3] Scheller PR, Flesch R, and Bleck W. Solidification Morphology and Microstructure Properties
at Increased Cooling Rates for 18‐8 Cr‐Ni Stainless Steel. Adv Eng Mater 1999; 1:209‐214.
[4] Di Schino A, Mecozzi MG, Barteri M, Kenny JM. Solidification mode and residual ferrite in
low‐Ni austenitic stainless steels. J Mater Sci 2000; 35:375‐380.
[5] Offerman SE, van Dijk NH, Rekveldt MTh, Sietsma J, van der Zwaag S. Ferrite/pearlite band
formation in hot rolled médium carbon steel. Mater Sci Tech 2002; 18: 297‐303.
[6] Verhoeven JD. A review of microsegregation induced banding phenomena in steels. J Mater
Eng Perform 2000; 9: 286‐296.
[7] Radzikowska JM. Effect of specimen preparation on evaluation of cast iron microstructures.
Mater Charact 2005; 54:287‐304.
[8] Lichtenegger P, Blöch R. Colour Etching of High Alloy Steels. Pract Metallogr 1975; 12: 567‐
73.
[9] Xu W, Rivera‐diaz‐del‐Castillo PEJ, van der Zwaag S. Ferrite/Pearlite Band Prevention in Dual
Phase and TRIP steels: model development. ISIJ Inter 2005;45:380‐387.
[10] Stauffer AC, Koss DA, and McKirgan JB. Microstructural Banding and Failure of a Stainless
Steel. Metal Mater Trans A 2004;35:1317‐1324.
[11] Santofimia MJ, Kwakernaak C, Sloof WG, Zhao L, Sietsma J. Experimental study of the
distribution of alloying elements after the formation of epitaxial ferrite upon cooling in a low‐
carbon steel. Mater Charact 2010; 61:937‐942.
[12] Potgieter JH, Cortie MB. Determination of the Microstructure and Alloy Element
Distribution in Experimental Duplex Stainless Steels. Mater Charact 1991; 26:155‐165.
[13] Perricone MJ, Dupont JN, Anderson TD, Robino CV, Michael JR. An Investigation of the
Massive Transformation from Ferrite to Austenite in Laser‐Welded Mo‐Bearing Stainless
Steels. Metall Mater Trans A 2011; 42A:700‐716.
[14] Ray A, Dhua SK, Jha S. Electron‐Probe Microanalysis: Some Applications in the Assessment
of Steel Product Quality. X‐Ray Spectrom 1999; 28:41‐50.
[15] Guo JQ, Tsukamoto S, Kimura T, Nakae H. Nucleation Process Control of Undercooled
Stainless Steel by External Nucleation Seed. Acta Mater 1999; 47:3767‐3778.
[16] Liu P, Stigenberg AH, Nilsson J‐O. Isothermally Formed Quasicrystalline Precipitates Used
For Strengthening in a New Maraging Stainless Steel. Scripta Metall Mater 1994;31:249‐254.
[17] Liu P. Relationships between Microstructure and Properties of Stainless Steels—A Few
Working Examples. Mater Char 2000; 44:413‐424.
[18] Eskandari M, Najafizadeh A, Kermanpur A, and Karimi M. Potential application of
nanocrystalline 301 austenitic stainless steel in lightweight vehicle structures. Mater Design
2009; 30:3869‐3872.
[19] Post J, Nolles H, Datta K, Geijselaers HJM. Experimental determination of the constitutive
behaviour of a metastable austenitic stainless steel. Mater Sci Eng A 2008; 498: 179‐190.
[20] San Martin D, van Dijk NH, Jimenez‐Melero E, Kampert E, Zeitler U, van der Zwaag S. Real‐
time martensitic transformation kinetics in maraging steel under high magnetic fields. Mater
Sci Eng A 2010; 527: 5241‐5245.
[21] San Martin D, Aarts KWP, Rivera‐Díaz‐del‐Castillo PEJ, van Dijk NH, Brück E, van der Zwaag
S. Isothermal martensitic transformation in a 12Cr‐9Ni‐4Mo‐2Cu stainless steel in applied
magnetic fields. J Magn Magn Mater 2008; 320: 1722‐1728.
[22] San Martin D, Jiménez‐Melero E, Duffy JA, Honkimäki V, van der Zwaag S, van Dijk NH.
Real‐time synchrotron X‐ray diffraction study on the isothermal martensite transformation of
maraging steel in high magnetic fields. J Appl Cryst 2012; 45:748‐757.
[23] Hättestrand M, Nilsson J‐O, Stiller K, Liu P, and Andersson M. Precipitation hardening in a
12%Cr‐9%Ni‐4%Mo‐2%Cu stainless steel. Acta Mater 2004; 52: 1023‐1037.
[24] Moallemi M, Najafizadeh A, Kermanpur A, Rezaee A. Effect of reversion annealing on the
formation of nano/ultrafine grained structure in 201 austenitic stainless steel. Mater Sci Eng A
2011;530:378–381.
[25] Kumar BR, Sharma S, Mahato B. Formation of ultrafine grained microstructure in the
austenitic stainless steel and its impact on tensile properties. Mater Sci Eng A 2011;528:2209–
2216.
[26] Ma JC, Yang YS, Tong WH, Fang Y, Yu Y, Hu ZQ. Microstructural evolution in AISI 304
stainless steel during directional solidification and subsequent solid‐state transformation.
Mater Sci Eng A 2007;444:64–68.
[27] San Martín D, García‐Mateo C. Promoting Isothermal Martensite Formation by High
Temperature Heat Treatments in a Precipitation Hardening Austenitic Stainless Steel. Solid
State Phenom 2011;172‐174:166‐171.
[28] http://www.cnme.es/
[29] San Martin D, Rivera Diaz del Castillo PEJ, Peekstok E, van der Zwaag S. A new etching
route for revealing the austenite grain boundaries in an 11.4% Cr precipitation hardening semi‐
austenitic stainless steel. Mater Charact 2007; 58: 455‐460.
[30] Xu W, San Martin D, Rivera Díaz del Castillo PEJ, van der Zwaag S. Modelling and
characterization of chi‐phase grain boundary precipitation during aging of Fe‐Cr‐Ni‐Mo
stainless steel. Mater Sci Eng A 2007; 467: 24‐32.
[31] Kasper JS. The ordering of atoms in the chi‐phase of the iron‐chromium‐molybdenum
system. Acta Metall 1954; 2:456‐461.
[32] Folkhard E, Rabensteiner E. Welding Metallurgy of Stainless Steel. New York: Springer‐
Verlag; 1988.
[33] Bastien PG. The mechanism of formation of banded structures. J Iron Steel Inst 1957; 187:
281‐91.
[34] Vander Voort GF. Color Metallography. Metallography and Microstructures. ASM
Handbook, Volume 9. 2004: 493‐512.
[35] Standard Test Method for Determining Volume Fraction by Systematic Manual Point
Count, ASTM E562 – 11 (2011).
[36] ImageJ: Image Processing and Analysis in Java (http://rsb.info.nih.gov/ij/).
[37] ThermoCalc Software AB, KTH (Royal Institute of Technology), Stockholm, Sweden.
[38] Bramfitt BL, Benscoter AO. Metallographer’s Guide: Practices and Procedures for Irons
and Steels. Metals Park, OH, ASM International; 2002, p. 234‐239.
[39] Van der Voort GF. Metallography and Microstructures. ASM International, McGraw‐Hill
Inc.; 2004.
[40] Behara E. Metallographic Reagents Based on Sulfide Films. Praktische Metallographie
1970; 7:242‐248.
[41] Van der Voort GF. Metallography: principles and practice. ASM International, McGraw‐Hill
Inc.; 1994.
[42] Michalska J, Sozanska M. Qualitative and quantitative analysis of σ and χ phases in 2205
duplex stainless steel. Mater Charact 2006; 56: 355‐362.
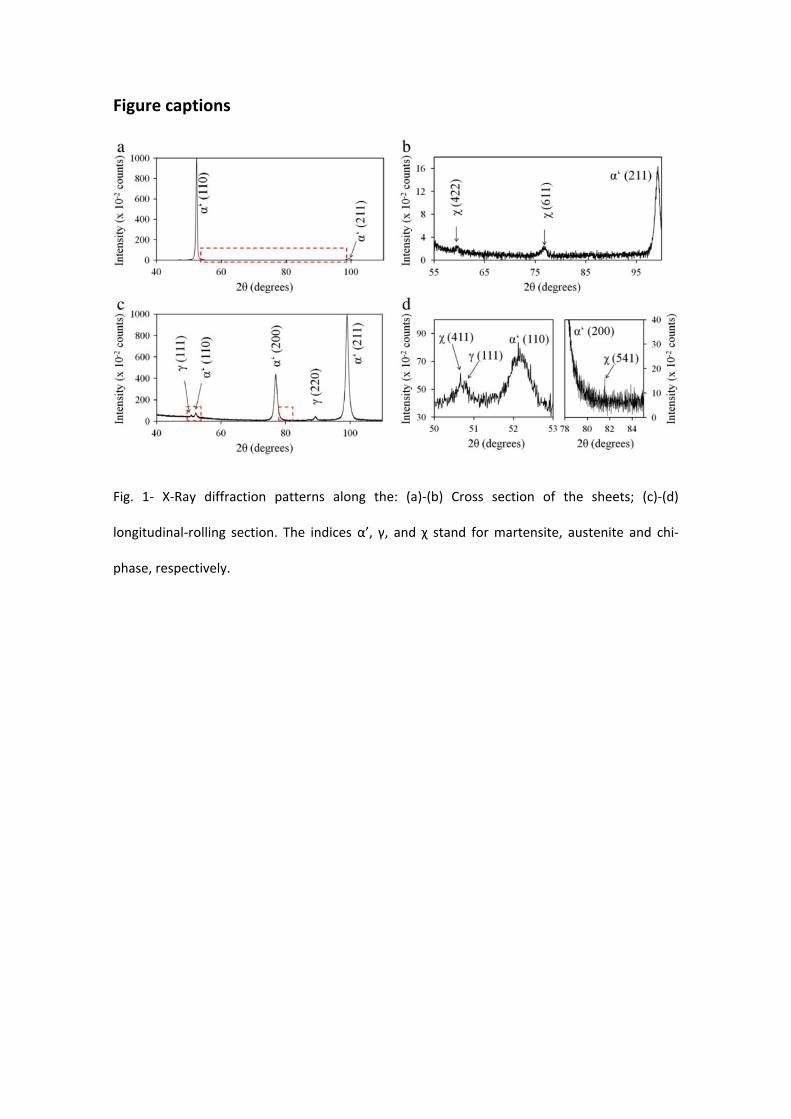
Figure captions
Fig. 1‐ X‐Ray diffraction patterns along the: (a)‐(b) Cross section of the sheets; (c)‐(d)
longitudinal‐rolling section. The indices α’, γ, and χ stand for martensite, austenite and chi‐
phase, respectively.
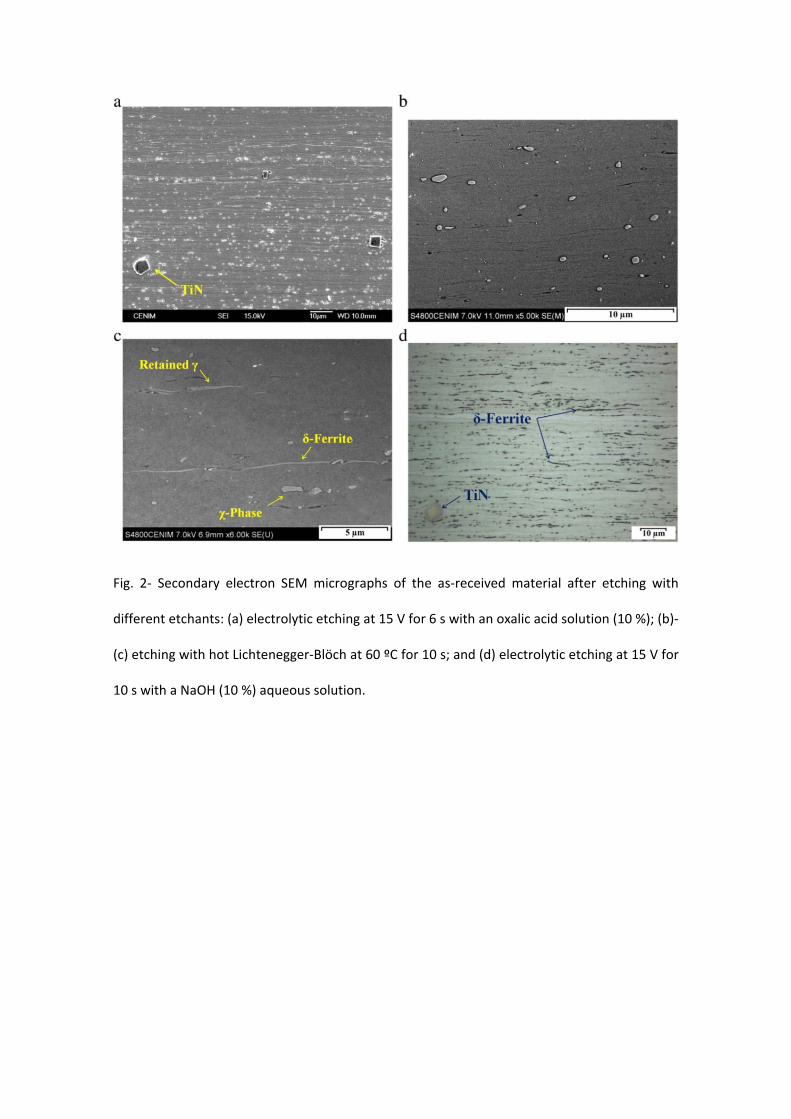
Fig. 2‐ Secondary electron SEM micrographs of the as‐received material after etching with
different etchants: (a) electrolytic etching at 15 V for 6 s with an oxalic acid solution (10 %); (b)‐
(c) etching with hot Lichtenegger‐Blöch at 60 ºC for 10 s; and (d) electrolytic etching at 15 V for
10 s with a NaOH (10 %) aqueous solution.
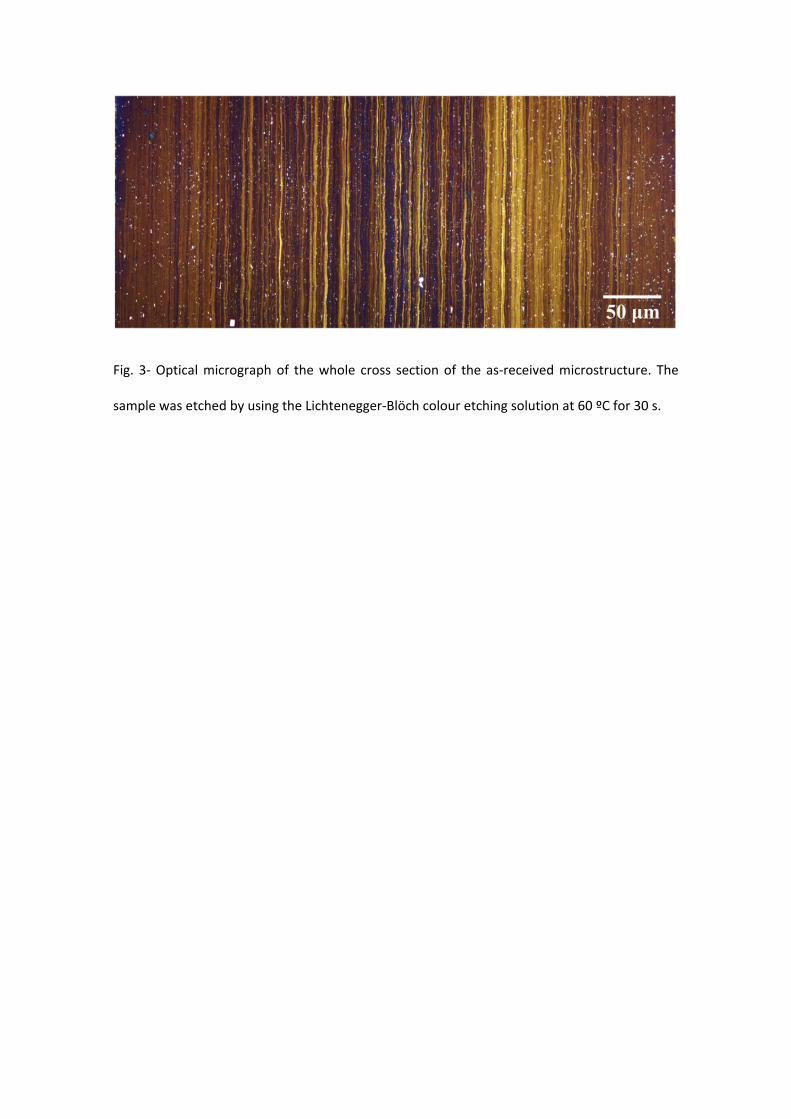
Fig. 3‐ Optical micrograph of the whole cross section of the as‐received microstructure. The
sample was etched by using the Lichtenegger‐Blöch colour etching solution at 60 ºC for 30 s.
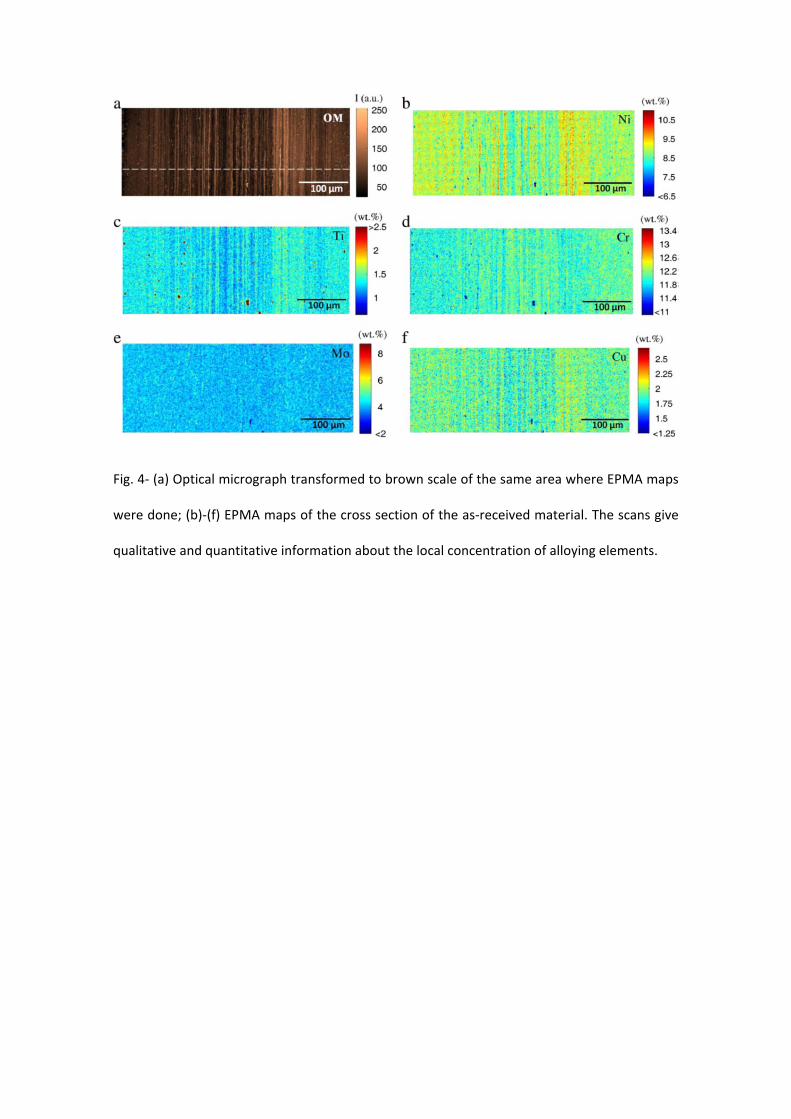
Fig. 4‐ (a) Optical micrograph transformed to brown scale of the same area where EPMA maps
were done; (b)‐(f) EPMA maps of the cross section of the as‐received material. The scans give
qualitative and quantitative information about the local concentration of alloying elements.
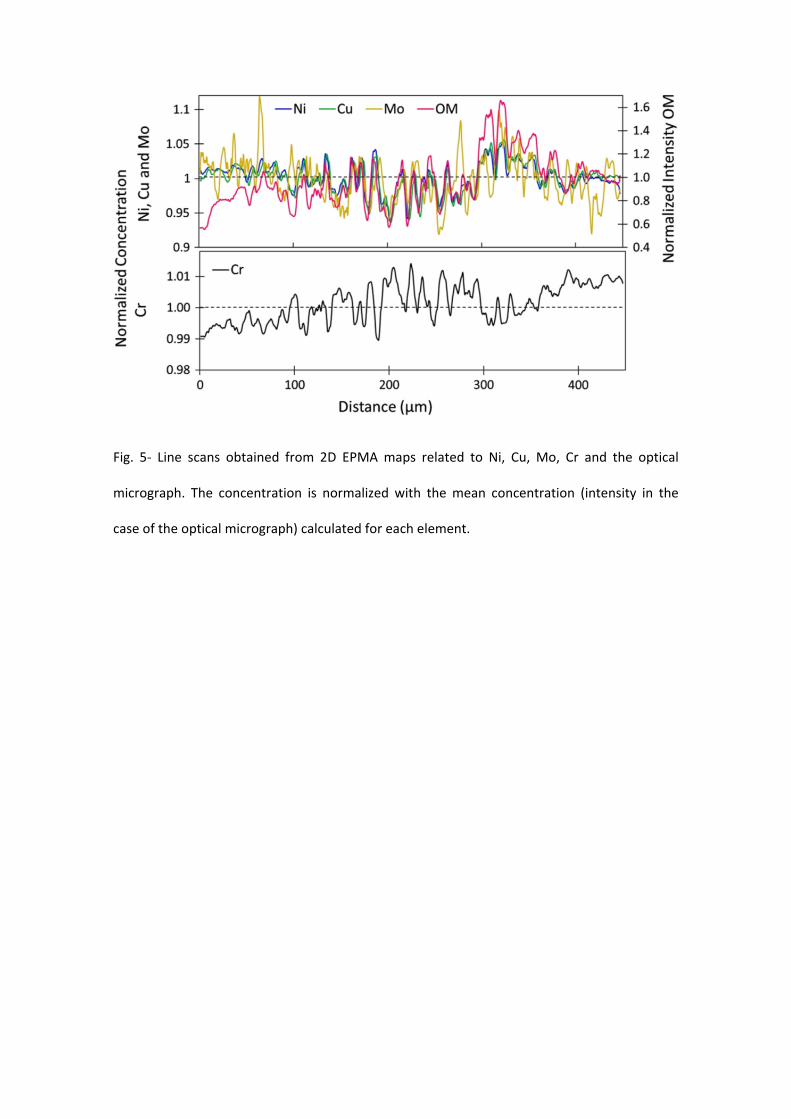
Fig. 5‐ Line scans obtained from 2D EPMA maps related to Ni, Cu, Mo, Cr and the optical
micrograph. The concentration is normalized with the mean concentration (intensity in the
case of the optical micrograph) calculated for each element.
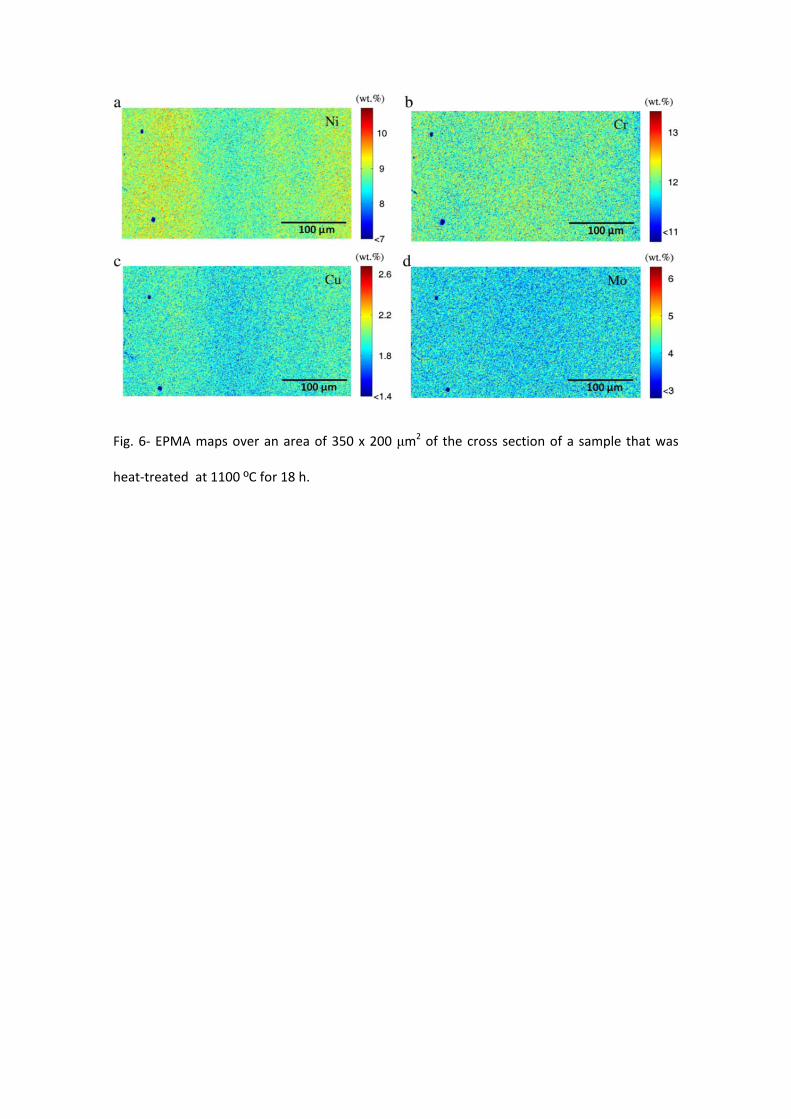
Fig. 6‐ EPMA maps over an area of 350 x 200 μm2 of the cross section of a sample that was
heat‐treated at 1100 ºC for 18 h.
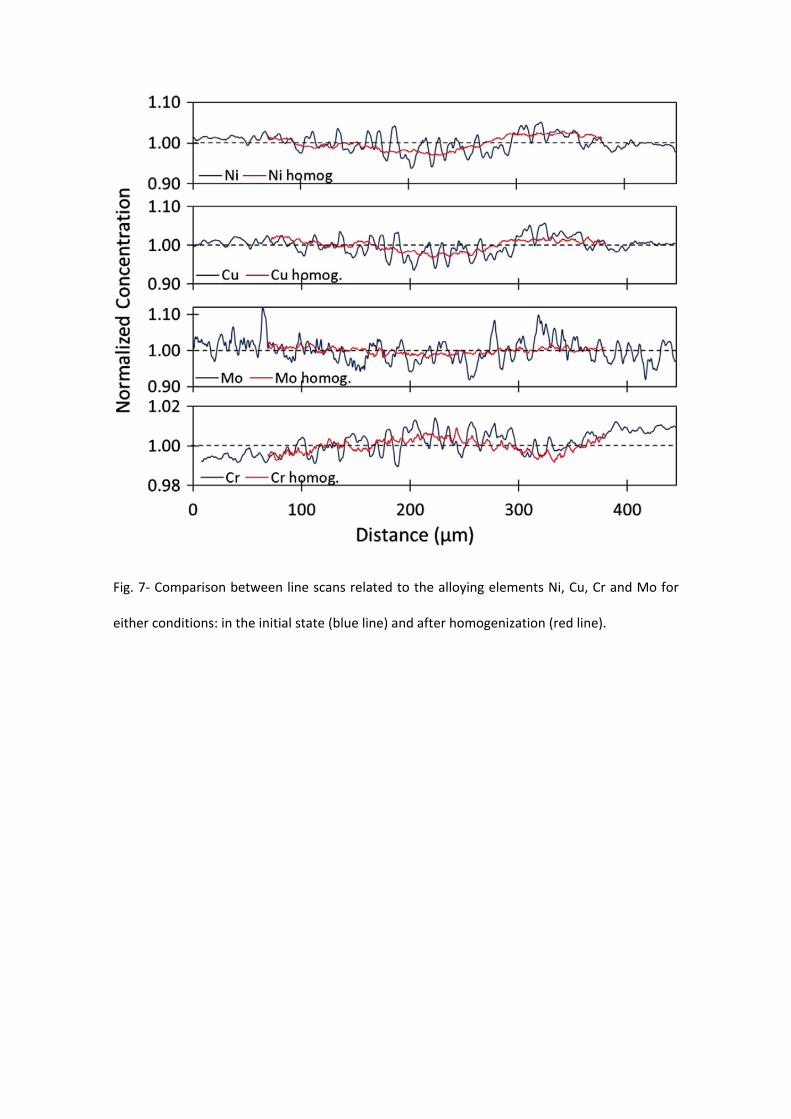
Fig. 7‐ Comparison between line scans related to the alloying elements Ni, Cu, Cr and Mo for
either conditions: in the initial state (blue line) and after homogenization (red line).
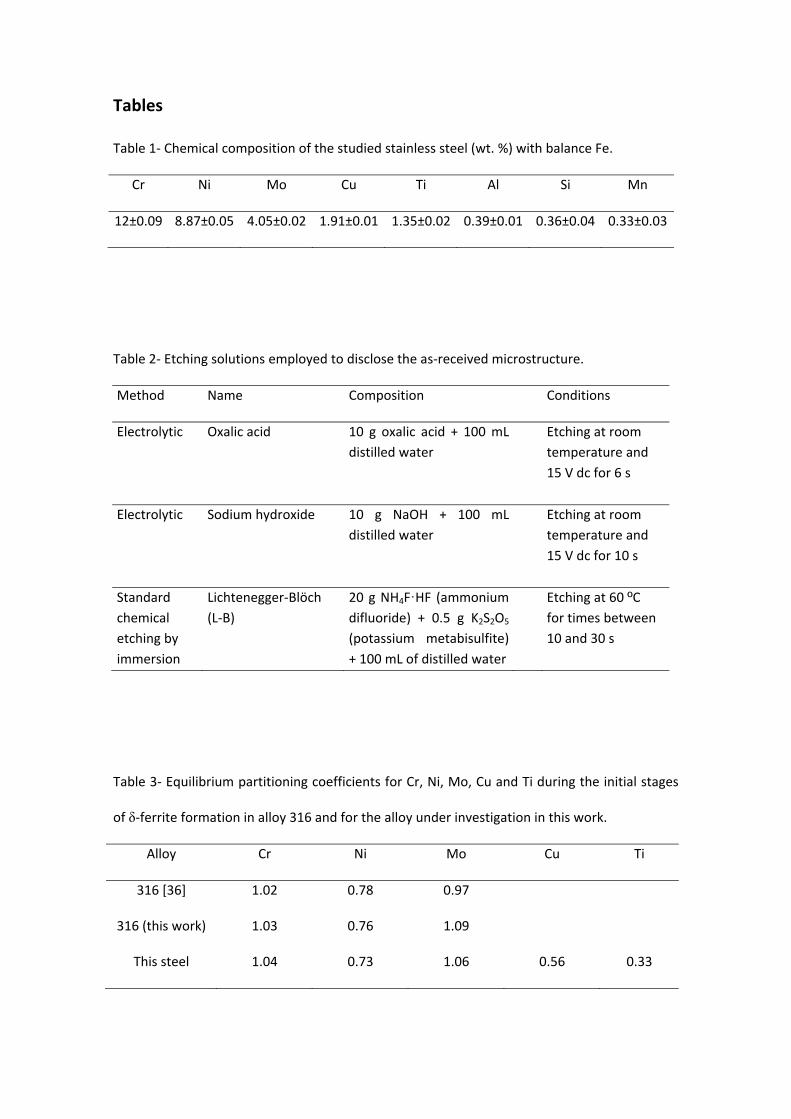
Tables
Table 1‐ Chemical composition of the studied stainless steel (wt. %) with balance Fe.
Cr Ni Mo Cu Ti Al Si Mn
12±0.09 8.87±0.05 4.05±0.02 1.91±0.01 1.35±0.02 0.39±0.01 0.36±0.04 0.33±0.03
Table 2‐ Etching solutions employed to disclose the as‐received microstructure.
Method Name Composition Conditions
Electrolytic Oxalic acid 10 g oxalic acid + 100 mL
distilled water
Etching at room
temperature and
15 V dc for 6 s
Electrolytic Sodium hydroxide 10 g NaOH + 100 mL
distilled water
Etching at room
temperature and
15 V dc for 10 s
Standard
chemical
etching by
immersion
Lichtenegger‐Blöch
(L‐B)
20 g NH4F·HF (ammonium
difluoride) + 0.5 g K2S2O5
(potassium metabisulfite)
+ 100 mL of distilled water
Etching at 60 ºC
for times between
10 and 30 s
Table 3‐ Equilibrium partitioning coefficients for Cr, Ni, Mo, Cu and Ti during the initial stages
of δ‐ferrite formation in alloy 316 and for the alloy under investigation in this work.
Alloy Cr Ni Mo Cu Ti
316 [36] 1.02 0.78 0.97
316 (this work) 1.03 0.76 1.09
This steel 1.04 0.73 1.06 0.56 0.33


![Sample Handling in Nanoscale Chemistry Erik Litbornkth.diva-portal.org/smash/get/diva2:8717/FULLTEXT01.pdflimited to etching procedures in mono-crystalline silicon [16]. The etching](https://img.pdfslide.tips/doc/110x75/60fc079965783a6a0162aba7/sample-handling-in-nanoscale-chemistry-erik-8717fulltext01pdf-limited-to-etching.jpg)