Embed Size (px)
Citation preview

NGU Rapport 2008.092
Chemical composition of black shale from four locations, greater Oslo area, Norway


4
TABLE OF CONTENTS 1. INTRODUCTION…………………………………………………………………………7 2. ANALYTICAL METHODS………………………………………………………………7
2.1 Sample origin 2.2 Whole rock geochemical analysis 2.3 Data assessment and presentation
3. RESULTS……………………..…………………………………………………………....9
3.1 Main elements 3.2 Trace elements
4. DISCUSSION…………………………………..…………………………………………11
4.1 Main elements 4.2 Trace elements
5. CONCLUSIONS………………………………………………………………………….12 6. REFERENCES……………………………………………………………………………12 APPENDIX 1: FIGURES…………………………………………………...………………13 Figure1: Sampling locations for black shale. Downtown Oslo located near top edge. (Map
source: http://earth.google.com). Figure 2: Ternary plot of Na2O+K2O vs. MgO+Fe2O3 vs. Al2O3, by XRF. Sum contents in
wt% for the 2+2+1 species first normalized to 1.00, then individual proportions calculated.
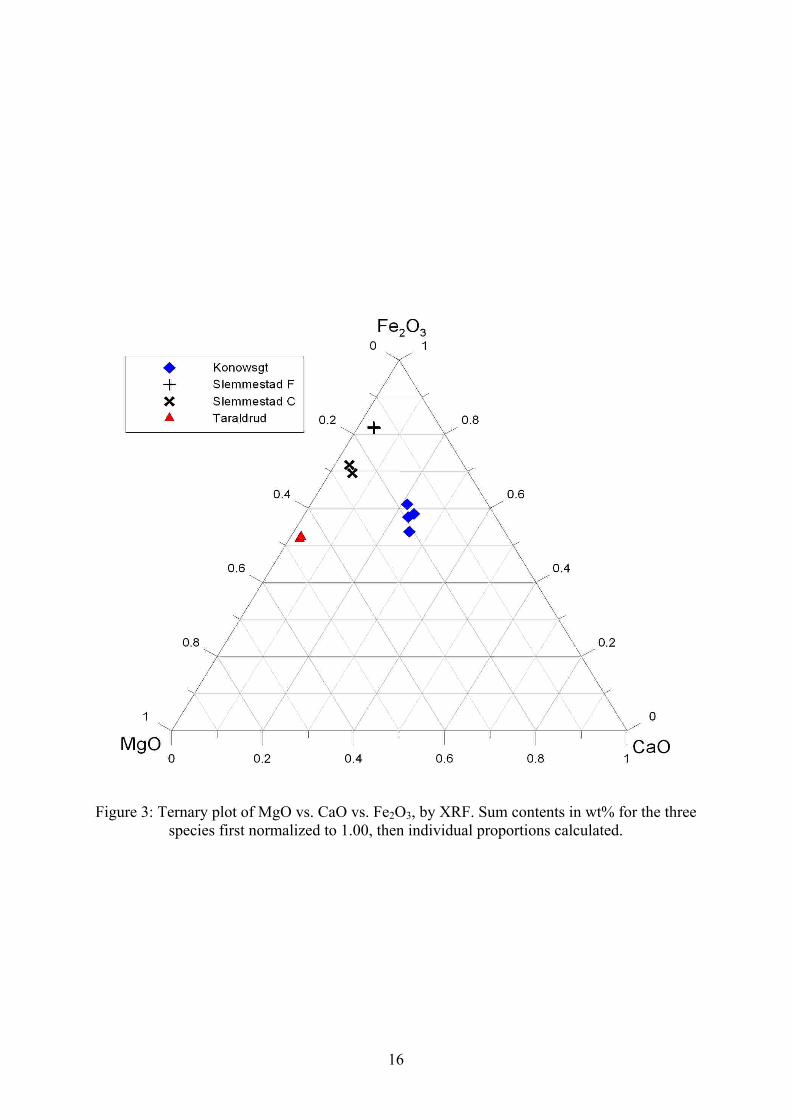
Figure 3: Ternary plot of MgO vs. CaO vs. Fe2O3, by XRF. Sum contents in wt% for the
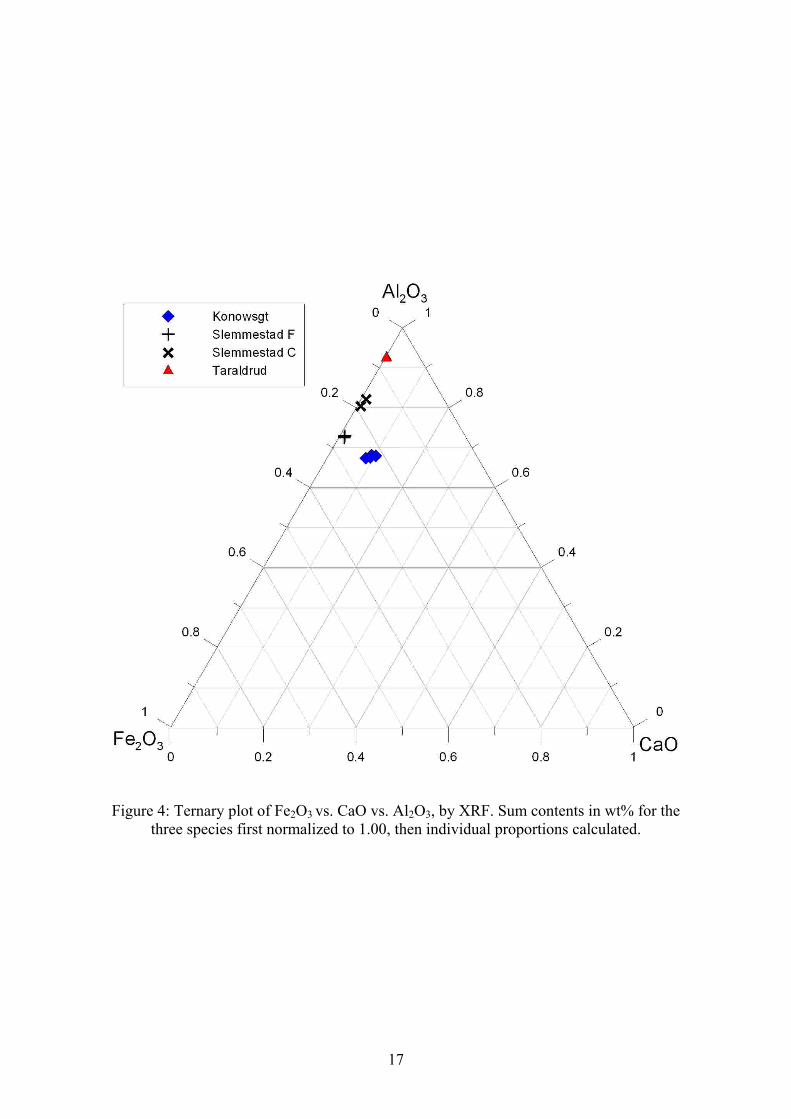
2+2+1 species first normalized to 1.00, then individual proportions calculated. Figure 4: Ternary plot of Fe2O3 vs. CaO vs. Al2O3, by XRF. Sum contents in wt% for the
2+2+1 species first normalized to 1.00, then individual proportions calculated. Figure 5: Scattergraph of metallic and lithophile trace elements in black shale from
Konowsgate, plotted in alfabethical order. ICP-AES after acid extraction, values in ppm.
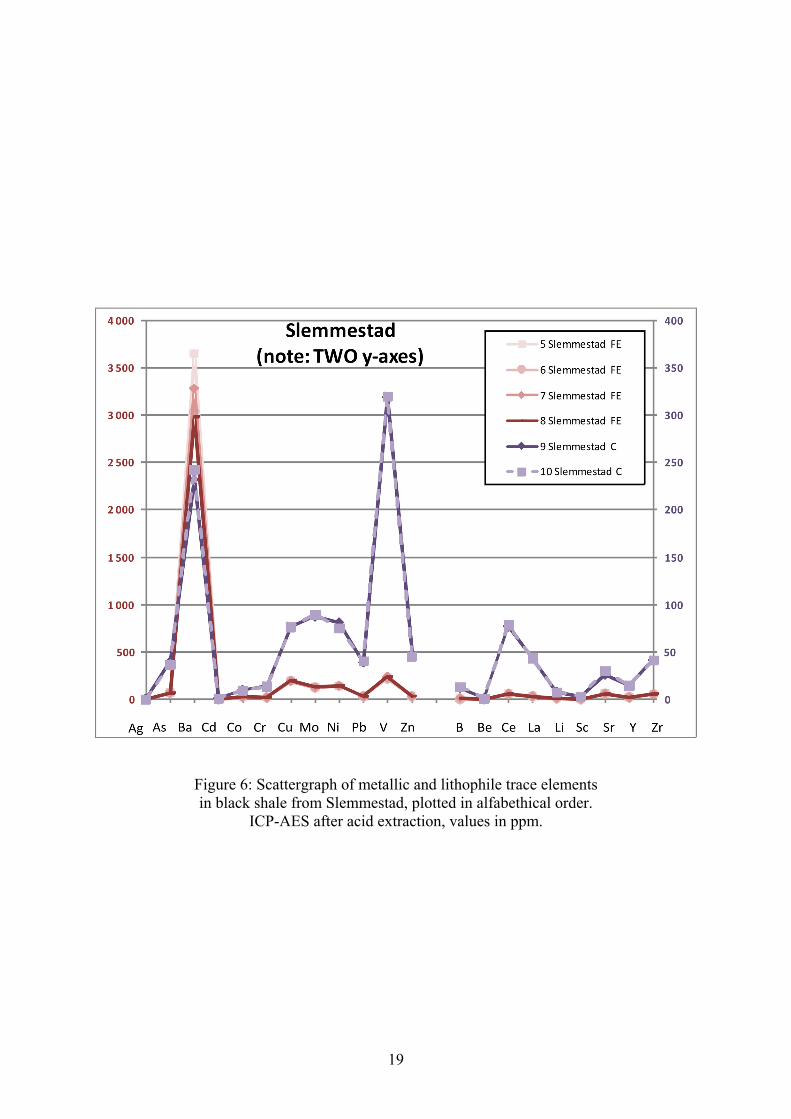
Figure 6: Scattergraph of metallic and lithophile trace elements in black shale from
Slemmestad, plotted in alfabethical order. ICP-AES after acid extraction, values in ppm.

5
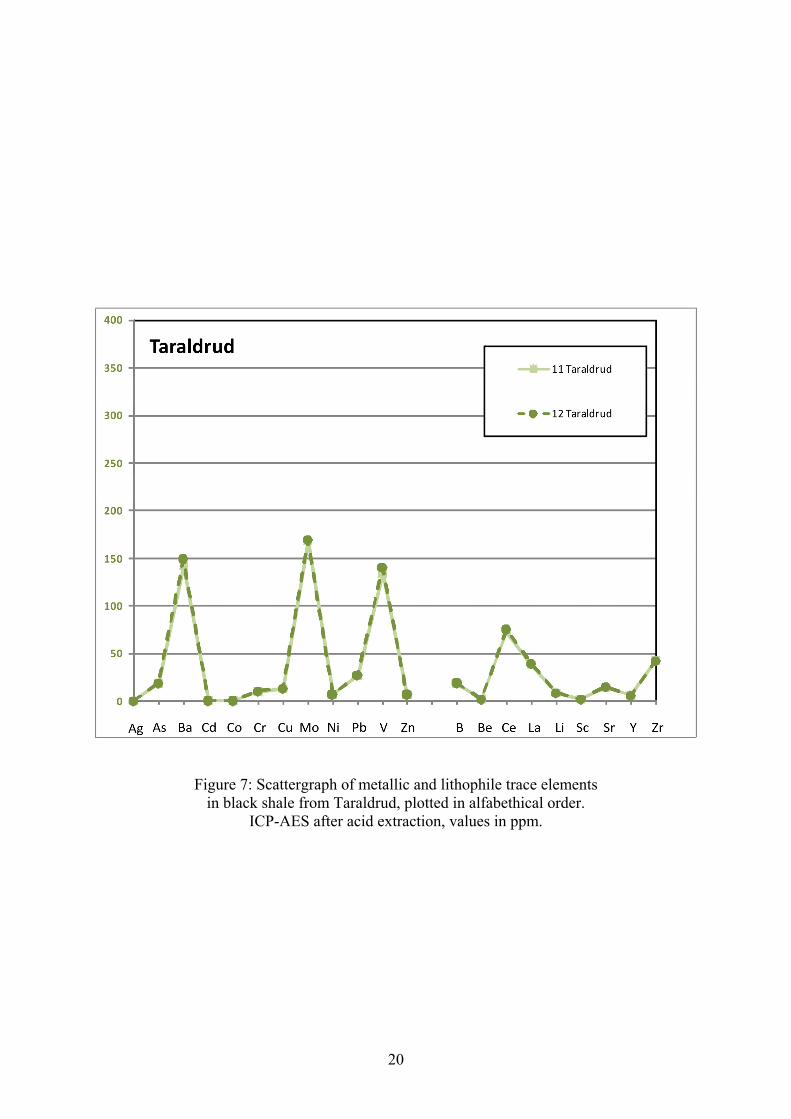
Figure 7: Scattergraph of metallic and lithophile trace elements in black shale from Taraldrud, plotted in alfabethical order. ICP-AES after acid extraction, values in ppm.
Figure 8: Ternary plot of Mo vs. V vs. As, by ICP-AES after selective acid digestion. Sum
contents in ppm for the three species first normalized to 1.00, then individual proportions calculated.
Figure 9: Ternary plot of Ni vs. V vs. Cr, by ICP-AES after selective acid digestion.Sum
contents in ppm for the three species first normalized to 1.00, then individual proportions calculated.
Figure 10: Ternary plot of Zn vs. Cu vs. Pb, by ICP-AES after selective acid digestion. Sum
contents in ppm for the three species first normalized to 1.00, then individual proportions calculated.
Figure 11: Ternary plot of Mn vs. Ba vs. Sr, by ICP-AES after selective acid digestion. Sum
contents in ppm for the three species first normalized to 1.00, then individual proportions calculated.
APPENDIX 2: TABLES…………………………………………………………………….25 Table 1: Conversion factors for recalculation of element to oxide weight percentages. Table 2: Main elements in wt%, in whole rock by XRF and by ICP-AES after selective acid
digestion. Ignition loss LOI determined in conjunction with XRF. Total-S determined in separate procedure with Leco. Recovery of contents by ICP-AES relative to XRF calculated in % (dimensionless). Further explanation in text.
Table 3: Trace elements in ppm by ICP-AES after selective acid digestion. Coefficient of
variation CoV calculated as percentage of STDEV relative to AVG. Further explanation in text.
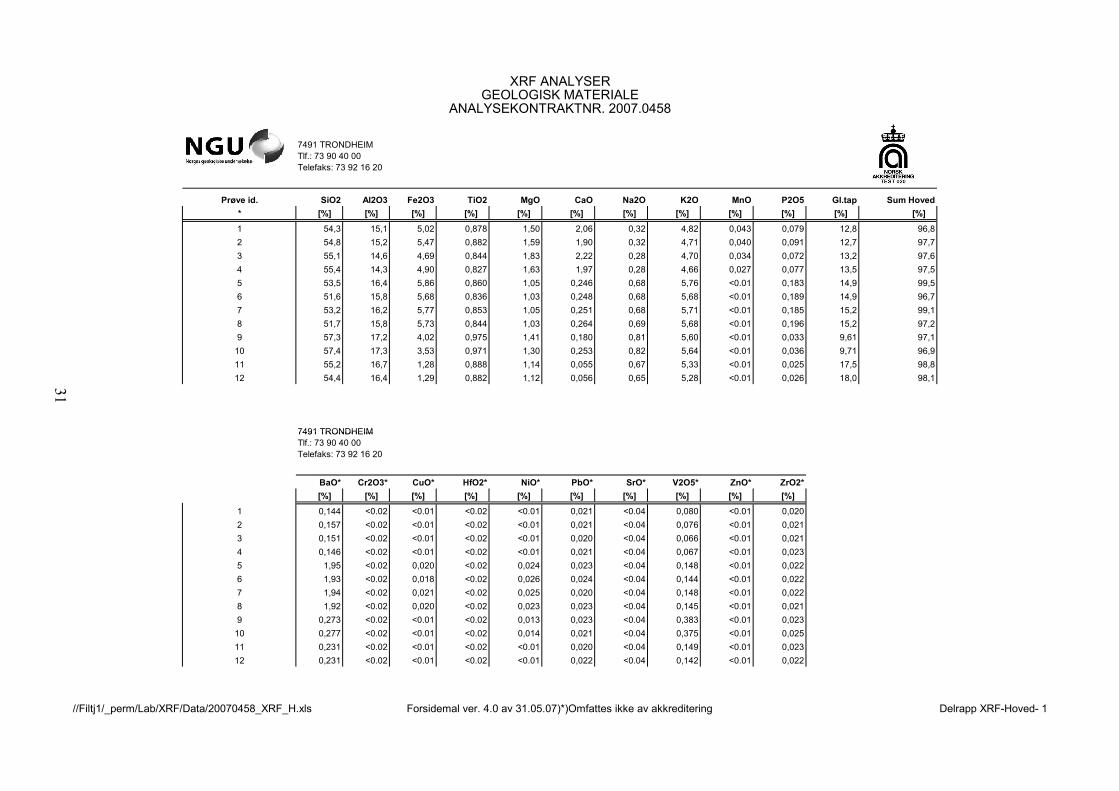
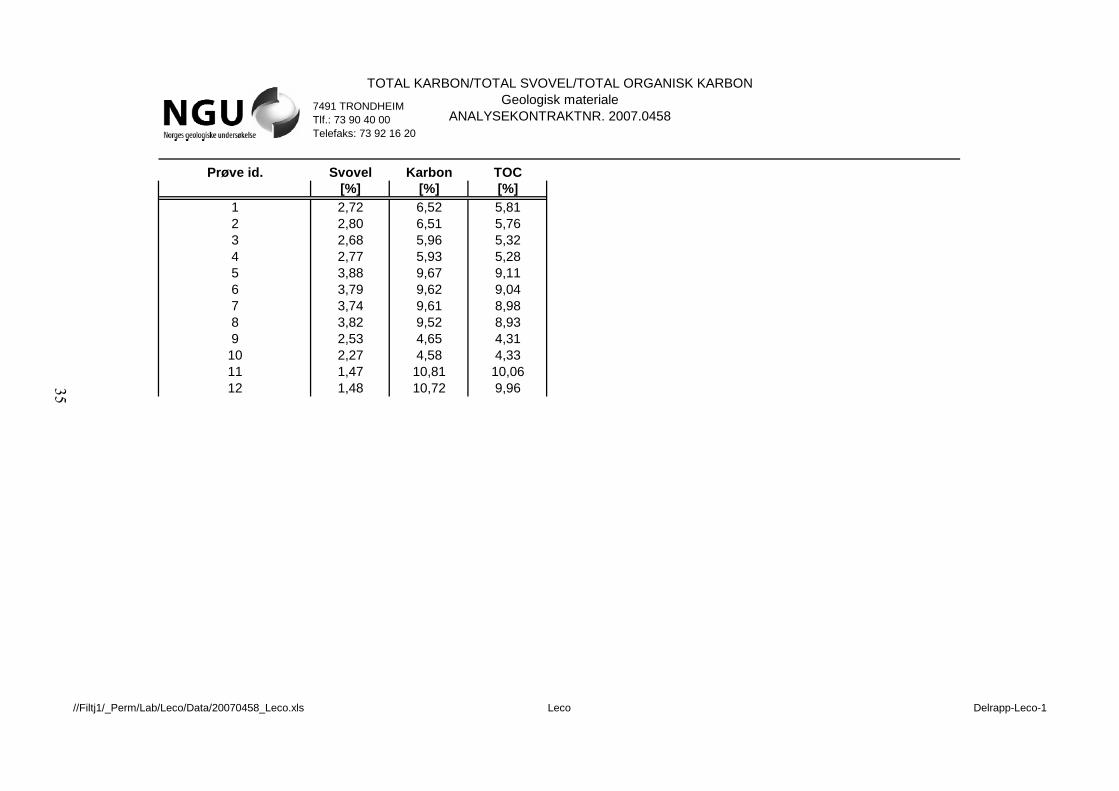
APPENDIX 3: ORIGINAL DATA…………………………………………………………29 NGU Analytical reports 2007.0458 for respectively: • main elements by XRF in whole rock, including ignition loss LOI at 1 000°C • trace elements by ICP after selective acid digestion • total-C/total-S/total organic carbon (TOC) by Leco upon ignition • ignition loss at 480°C

6

7
1. INTRODUCTION The composition of black shale may vary locally, both regarding mineral content and geochemical whole-rock composition. Ordovician black shale from three different localities in and around Oslo has been assessed previously using impregnation-fluorescence petrography on thin sections. Results from that study are presented in NGU report 2007.080 (Broekmans & Sæther 2007). The current report presents results from whole-rock geochemical assessment of the same black shale materials. Samples have been analysed for main and trace elements by XRF, LOI, Leco for total-S and total-C, and ICP-AES. 2. ANALYTICAL METHODS 2.1 Sample origin The samples of black shale were collected at two localities within the black shale formation, knowingly at Konowsgate 6-8 (Oslo municipality) from black shale tailings of local origin, and at Heimansåsen at Slemmestad (Røyken municipality), where black shale was sampled in-situ (two separate sampling sites labelled C and FE). The third site is a permanent pile of black shale tailings from a construction site in Akersgata (downtown Oslo), deposited on Precambrian basement rocks at Taraldrud/Ski municipality). The sample locations are shown in Figure 1. All samples analysed in this report were collected from the surface. The representativeness of the collected samples might also be a problem with respect to content of potentially toxic trace components and geotechnical stability over time in contact with groundwater or concrete foundations. The representativeness of the samples with respect to content of chemical elements is addressed in this report. 2.2 Whole rock geochemical analysis The Ordovician black shales of the Oslo area consist of very fine grained material with a typical grain size below 50 µm. The material is typically very fragile and easily disintegrates into a particulate material with 5-50 mm fragments. Whole rock geochemical analysis to assess the main and trace element composition of these black shales requires a suite of supplementary analytical methods. Details on sample preparation and instrumentation used are given below. Adequate amounts of random black shale fragments were initially comminuted in a ceramic mortar and pestle to pass a 2 mm mesh sieve, then homogenized and split to ~35g fill an agate-lined vibratory disc-mill for final pulverization. Powdered bulk material was fused at 1 000 ̊C in excess Li-tetra borate (Li2B4O7) in a platinum crucible conform with the so-called 'Claisse'-method. Weight loss after fusion was recorded as loss on ignition (LOI-1000), and includes both organic (org-C), inorganic carbon (inorg-C; ie. carbonates) as well as water regardless of speciation. The resulting fusion glass tablet was analyzed by XRF for the oxides Na2O, K2O, MgO, CaO, MnO, Al2O3, total-Fe2O3, TiO2, SiO2, and P2O5. In addition, trace element oxides BaO, Cr2O3, CuO, HfO2, NiO, PbO, SrO, V2O5, ZnO, and ZrO2 were analyzed in the same procedure.
8
Operating conditions of the PANalytical Axios Minerals® instrument were set at 50 kV and 50 mA, using a Rh target. In a separate procedure, bulk-LOI was determined gravimetrically by weighing before and after ignition at 480 ̊C. Organic carbon (org-C) present in the sample oxidizes to CO2 and loosely bonded water (eg. hydrate, zeolite, clay) evaporates. Obtained values include all of these species and are reported as single values under LOI-480. Sulfur (total-S), organic carbon (org-C), and organic plus inorganic carbon (total-C) contents were determined by Leco® on separate aliquots. The sample material is heated in an oxidizing atmosphere until 1 450 °C, and the released volatiles are measured spectroscopically in the evading gases. All element species from XRF are presented as oxides. Sulfur is present in the sample material in various sulfides whereas oxidized sulfur only occurs in very minor amounts in sulfates. Thus, sulfur is tabulated as S. Trace elements by XRF as listed above are not further considered for main element analysis. Lower limits of detection are specified per species analyzed in Appendix 1. Raw and un-normalized cumulative sum totals of individual whole-rock analyses (XRF + LOI-1000 + Leco) are typically within 100.0 ± 1.00 wt%. Total iron content is reported as Fe2O3-total. A separate amount of powder was dissolved in excess 7N HNO3 by autoclaving in a microwave oven. Subsequently, the solution was evaporated and redissolved in dilute nitric acid. The final solution was then introduced into the ICP-AES instrument. Concentrated nitric acid at 7N strength is a strong and oxidizing acid that readily dissolves many minerals, including sulfides and carbonates. In contrast, silicate minerals are incongruently dissolved essentially leaving a (alumino-) silicate framework, whereas quartz dissolves hardly at all. Main element concentrations also analyzed by XRF (Na, K, Mg, Ca, Mn, Al, Fe, Ti, Si and P; see above) were recalculated from the content of oxides using the factors in Table 1 below to facilitate direct comparison between XRF and ICP-AES analytical methods. Additional trace elements by ICP-AES (Ag, As, Ba, Cd, Co, Cr, Cu, Mo, Ni, Pb, V, Zn, and B, Be, Ce, La, Li, Sc, Sr, Y, Zr) are presented ‘as is’, in parts per million (ppm=mg/kg). An appropriate number of official and in-house standards was inserted with all analytical procedures. Blind duplicates were inserted throughout the entire sample series, and were pulverized and digested from separate splits. 2.3 Data assessment and presentation Data have been collated in a spreadsheet using entirely standard Microsoft Office Excel® software, 2007 edition. Triangular plots were produced using Rock Works Grapher® software (by Øystein Nordgulen at NGU). Main element oxide contents from whole-rock analysis by XRF are presented in wt%. Oxide content data are supplemented with volatile contents determined as LOI-1000, whereas total-C and total-S from Leco is already included in the ignition loss. Cumulative sum totals are within 100 ± 1.00 wt%, with only two exceptions, Slemmestad 5 and 7.

9
Main element oxides by XRF are compared with data on the same elements by ICP-AES. Triangular/ternary plots present the relative position of individual samples for the species in each corner. To that purpose, the sum of the species presented in the plot are cumulated per sample and taken as 100 %. Subsequently, the relative proportion of each species is calculated per sample (i.e. 0.0-1.0) as indicated along each side of the triangular plot, determining the sample's position plotted in the triangle. 3. RESULTS 3.1 Main elements Results from whole rock analysis of main elements by ICP-AES, XRF, loss on ignition at 1 000°C (LOI) and total-S and total-C by Leco are presented in Table 2. Data are arranged per sample and are given in wt% per component oxide. The first column (“ICP”) gives data by ICP-AES after partial digestion in excess acid. Thus, the non-dissolved residue is excluded from the analysis, which is why cumulative sum totals ("CUM SUM") have not been calculated. The second column (“XRF”) lists data on the same oxides as determined by XRF after bulk digestion in excess flux, supplied with data from LOI and Leco. Total-C was measured by Leco but is already included in LOI through thermal decomposition of carbonate present. Total-S is present in sulfides finely dispersed throughout the rock and is hence presented as S, not as oxide. Cumulative sum totals including XRF, LOI and total-S have been calculated and are well within 100.0±1.0wt%, with only two exceptions (Slemmestad 5 and 7). The third column (“% ICP/XRF”) lists the recovery in percent (dimensionless) of partial digestion in acid by ICP-AES, relative to whole rock by XRF. Values over 100% recovery may be due to calculation artifacts (‘rounding off’, especially important with low values to begin with; compare e.g. Konowsgate 1 and 2), and essentially represent the same analytical values. The summary table on the lower right gives calculated values for average (AVG), standard deviation (STDEV) and coefficient of variation (CoV) in percent (rounded off to the next nearest integer) of the recovery rates for all samples. A low standard deviation indicates that absolute variation between samples from the same locality are small, whereas the coefficient of variation CoV indicates whether such variation is relatively large or small. In general, there is consistency in the oxide content of duplicates and samples from the same localities. However, the content of Fe varies a lot among the Slemmestad samples, whereas the Ca content varies among samples from Konowsgate. Data from Table 2 are collated graphically in Figures 2, 3, and 4. Each locality is presented by a different marker (see legend). The triangular plot in Figure 2 shows total alkalis as Na2O+K2O, versus MgO+Fe2O3 on the lower right, versus Al2O3 on top. The four different localities seem to define a short trend towards a composition richer in MgO+Fe2O3, but are still quite close to each other.

10
The triangular plot in Figure 3 shows MgO versus CaO on the lower right, versus total iron as Fe2O3 on top. Here, three locations plot along the MgO-Fe2O3 edge, the fourth (Konowsgate) is clearly richer in CaO and plots more towards the center of the triangle. This reflects significant differences with respect to content of carbonates and sulfides (presumably the main host for Fe) in the samples. Samples from Konowsgate and Taraldrud forms two different clusters separate from the Slemmestad F and C samples; samples from Konowsgate are highest in CaO and the Taraldrud samples are highest in MgO. Slemmestad samples are highest in Fe2O3, probably from sulfide minerals, possibly also organics. The triangular plot in Figure 4 shows total iron as Fe2O3 versus CaO at lower right, versus Al2O3 on top. Once more, three locations plot along the Fe2O3-Al2O3 edge, the fourth (Konowsgate) is again higher in CaO. This is essentially the same view as Figure 3. 3.2 Trace elements Trace elements contents determined by ICP-AES are collated in Table 3. Data are arranged in two groups: predominantly chalcophile elements (Ag, As, Ba, Cd, Co, Cr, Cu, Mo, Ni, Pb, V, and Zn, upper part), and lithophile elements (B, Be, Ce, La, Li, Sc, Sr, Y and Zr, lower part). All data are reported in ppm (mg/kg). Maximum and minimum contents are indicated in two rows directly under the actual data. Under these, calculated values for average (AVG), standard deviation (STDEV) and coefficient of variation (CoV) are given in separate rows. Values lower than 2× the lower limit of detection (LLD) are indicated with <[2×LLD]. Data from Table 3 are plotted as scattergraphs in Figures 5, 6, and 7. While these have no geochemical significance, they do serve as a kind of fingerprint to differentiate between sample locations. Element species are plotted along the horizontal axis in alphabetical order grouped as chalcophile/lithophile, and concentrations are plotted along the vertical axis, in ppm. For all trace element species reported here, the LLD essentially plots on the horizontal axis. All vertical axes present the same scale 0-400 ppm for easy 1:1 comparison. However, Figure 6 has a second vertical axis from 0-4 000 ppm to fit the Slemmestad-FE samples. The data for Slemmestad C are again plotted on a secondary axis of standard 0-400 ppm length. Figure 5 shows the trace element scatter patterns from Konowsgate, with highest peaks for Ba, Cu, Ce, and Sr. Figure 6 from Slemmestad shows a Ba peak too, but for the Slemmestad-FE samples, this peak is ~20× as high as for all other samples analyzed in this report. Rather than a peak at Cu, there is a bulge for Cu-Mo-Ni in both Slemmestad-FE and Slemmestad-C (note different axes!), and again a peak for V, Ce, and to a lesser extent for Sr (note axis scales!). Figure 7 from Taraldrud again shows scatter peaks for Ba, Mo, V, Ce and Zr. Sr is still elevated yet considerably lower than in the two previous figures, whereas also B is elevated. Summarizing the above, each sample location does indeed have a different fingerprint as illustrated by the very different scattergrams.

11
The ternary plot in Figure 8 shows Mo versus V at right versus As on top. All sample locations plot comparatively far from each other, including Slemmestad-FE and Slemmestad-C. The ternary plot in Figure 9 shows Ni versus V at right versus Cr on top. All sample locations plot along the Ni-Cr edge, and Konowsgate nearly coincides with Slemmestad-FE. The ternary plot in Figure 10 shows Zn versus Cu at right versus Pb on top. All sample locations plot comparatively far from each other, especially Slemmestad FE and C. Finally, the ternary plot in Figure 11 shows Mn versus Ba at right versus Sr on top. All sample locations plot close to the Ba corner, only Konowsgate plots more towards Mn and again far from Sr. 4. DISCUSSION 4.1 Main elements The two samples from Taraldrud (Table 2, lower right) seem to be fairly homogeneous with respect to content of all of the main elements showing low standard deviation and coefficient of variation. The samples from Konowsgate and Slemmestad show the largest standard deviation with respect to the content of CaO and Fe2O3. The coefficient of variation is largest in samples from Slemmestad for all elements except CaO and Fe2O3. This reflects significant differences with respect to content of carbonates and sulfides (presumably the main host for Fe) in the samples. Fe is presented as total-Fe2O3, whereas this type of sample material is known to contain some pyrite and other sulfides. This overestimates the wt% of Fe2O3 by a certain, unknown, but rather small amount as this includes excess O of the Fe that occurs bonded to S. This artifact will be greatest in the sample containing most S, notably Slemmestad 5-8, of which 5 and 7 have the largest cumulative sum total (see above). By plotting the results of the main element-oxides in the ternary diagrams (Fig. 2, 3, and 4) it seems like most of the separation is in the MgO-CaO-Fe2O3-space.Thus the difference in content of main elements associated with silicates is less than the variation in carbonates and in Fe derived from sulfides in these twelve samples of black shale. 4.2 Trace elements The data in Table 3 show values below detection limit for Ag in all samples analyzed and close to or under the detection limit for B. The reproducibility of all other elements is withn 5-10% except for Ba. The concentrations for some elements in the alum shales analyzed (e.g. Ba, Cu, Ni, and Zn) vary up to one whole order of magnitude. This reflects how the respective elements are bound to shale minerals and the mineralogical composition of a given alum shale horizon.

12
The clustering of samples from the same locations in the ternary diagrams seem to be best separated in Mo- V-As-, Zn- Cu-Pb-, and Mn-Ba-Sr-space (Figs. 8, 10 and 11). Separation is less distinct in Ni-V-Cr-space (Fig. 9). 5. CONCLUSIONS Chemical analysis of main, minor and trace elements of twelve Ordovician black (alum-) shale samples collected in the greater Oslo area quantifies the variation between samples at the same localities. The samples collected at each of the localities are significantly different with respect to many elements analyzed. The variation is largest with respect to the content of FeO and CaO at one location (Slemmestad). This is high-lighted by the use of scatter diagrams. Further mineralogical assessment requires x-ray diffraction analysis and microscopic studies. By plotting the data in triangular diagrams, a classification method used in classifying metamorphosed shales, the samples fall into distinct categories. Some of the plots presented differentiate the samples better than others, and these can be recommended used in classifying shale samples from different building sites. 6. REFERENCES Broekmans. M. A. T. M. and Sæther, O. M. 2007. Impregnation-fluorescence petrography of
black shale from the greater Oslo area. NGU-report 2007.080, 21 p. Weast, R. C. (1987; editor): Handbook of chemistry and physics. Section B: The elements and
inorganic compounds. 68th edition. CRC Press, Boca Raton, FL 33431: B68-146.

13
APPENDIX 1: FIGURES

14
Figure 1: Sampling locations for black shale. Downtown Oslo located near top edge. (source: http://earth.google.com)

15
Figure 2: Ternary plot of Na2O+K2O vs. MgO+Fe2O3 vs. Al2O3, by XRF. Sum contents in wt% for the 2+2+1 species first normalized to 1.00, then individual proportions calculated.
16
Figure 3: Ternary plot of MgO vs. CaO vs. Fe2O3, by XRF. Sum contents in wt% for the three species first normalized to 1.00, then individual proportions calculated.
17
Figure 4: Ternary plot of Fe2O3 vs. CaO vs. Al2O3, by XRF. Sum contents in wt% for the three species first normalized to 1.00, then individual proportions calculated.

18
Figure 5: Scattergraph of metallic and lithophile trace elements in black shale from Konowsgate, plotted in alfabethical order.
ICP-AES after acid extraction, values in ppm.
19
Figure 6: Scattergraph of metallic and lithophile trace elements in black shale from Slemmestad, plotted in alfabethical order.
ICP-AES after acid extraction, values in ppm.
20
Figure 7: Scattergraph of metallic and lithophile trace elements in black shale from Taraldrud, plotted in alfabethical order.
ICP-AES after acid extraction, values in ppm.

21
Figure 8: Ternary plot of Mo vs. V vs. As, by ICP-AES after selective acid digestion. Sum contents in ppm for the three species first normalized to 1.00,
then individual proportions calculated.

22
Figure 9: Ternary plot of Ni vs. V vs. Cr, by ICP-AES after selective acid digestion. Sum contents in ppm for the three species first normalized to 1.00,
then individual proportions calculated.

23
Figure 10: Ternary plot of Zn vs. Cu vs. Pb, by ICP-AES after selective acid digestion. Sum contents in ppm for the three species first normalized to 1.00,
then individual proportions calculated.

24
Figure 11: ternary plot of Mn vs. Ba vs. Sr, by ICP-AES after selective acid digestion. Sum contents in ppm for the three species first normalized to 1.00,
then individual proportions calculated.

25
APPENDIX 2: TABLES

26
Table 1: Conversion factors for recalculation of element to oxide weight percentages.
element oxide factor Na Na2O 1.3480 K K2O 1.2047
Mg MgO 1.6581 Ca CaO 1.3992 Mn MnO 0.3265 Fe* Fe2O3 1.4297 Al Al2O3 1.8894 Si SiO2 2.1391 Ti TiO2 1.6683 P P2O5 2.2916
C** CO2 3.6641 *: to represent total iron content as Fe2O3-total **: for recalculation of [total-organic]-C to CO2

ICP
XRF
% IC
P/XR
FIC
PXR
F%
ICP/
XRF
ICP
XRF
% IC
P/XR
FIC
PXR
F%
ICP/
XRF
ICP
XRF
% IC
P/XR
FIC
PXR
F%
ICP/
XRF
Sam
pleL
abel
Kon
owsg
t. 20
0703
20S
1K
onow
sgt.
2007
0321
S1
Kon
owsg
t. 20
0703
22S
2K
onow
sgt.
2007
0323
S2
Sam
ple#
unit
note
s1
23
4S
iO2
wt%
0,10
54,3
00
0,07
54,8
00
0,09
55,1
00
0,07
55,4
00
Al2
O3
wt%
1,50
15,1
010
1,68
15,2
011
1,50
14,6
010
1,52
14,3
011
Fe2O
3-to
tal
wt%
4,36
5,02
874,
365,
4780
4,70
4,69
100
4,37
4,90
89Ti
O2
wt%
0,01
0,88
10,
010,
881
0,01
0,84
10,
010,
831
MgO
wt%
0,54
1,50
360,
661,
5942
0,97
1,83
530,
821,
6350
CaO
wt%
1,89
2,06
921,
821,
9096
2,56
2,22
115
2,21
1,97
112
Na2
Ow
t%0,
070,
3222
0,06
0,32
190,
070,
2825
0,07
0,28
25K
2Ow
t%0,
484,
8210
0,53
4,71
110,
544,
7011
0,54
4,66
12M
nOw
t%0,
040,
0493
0,04
0,04
100
0,03
0,03
880,
030,
0311
1P
2O5
wt%
0,07
0,08
890,
070,
0977
0,08
0,07
111
0,08
0,08
104
SU
M T
OTA
Lw
t%9,
0684
,12
9,29
85,0
010
,54
84,3
79,
7184
,07
S-to
tal
wt%
Leco
2,72
2,80
2,68
2,77
LOI1
000
wt%
12,8
012
,70
13,2
013
,50
CU
M S
UM
wt%
99,6
410
0,50
100,
2510
0,34
Sam
pleL
abel
Sle
mm
esta
dFE
2007
0320
S1
Sle
mm
esta
dFE
2007
0320
S2
Sle
mm
esta
dFE
2007
0320
S3
Sle
mm
esta
dFE
2007
0320
S4
Sle
mm
esta
dC20
0703
20S
1S
lem
mes
tadC
2007
0321
S1
Sam
ple#
unit
note
s5
67
89
10S
iO2
wt%
0,06
53,5
00
0,11
51,6
00
0,06
53,2
00
0,06
51,7
00
0,10
57,3
00
0,09
57,4
00
Al2
O3
wt%
2,15
16,4
013
1,98
15,8
013
3,98
16,2
025
2,21
15,8
014
1,60
17,2
09
1,62
17,3
09
Fe2O
3-to
tal
wt%
5,15
5,86
885,
105,
6890
4,99
5,77
864,
995,
7387
3,23
4,02
802,
793,
5379
TiO
2w
t%0,
020,
862
0,01
0,84
20,
010,
852
0,01
0,84
20,
010,
981
0,01
0,97
1M
gOw
t%0,
351,
0534
0,35
1,03
340,
351,
0533
0,35
1,03
340,
241,
4117
0,24
1,30
18C
aOw
t%0,
270,
2511
00,
290,
2511
50,
260,
2510
40,
260,
2698
0,20
0,18
111
0,25
0,25
99N
a2O
wt%
0,08
0,68
120,
080,
6812
0,08
0,68
120,
080,
6912
0,06
0,81
70,
070,
829
K2O
wt%
0,72
5,76
130,
665,
6812
1,45
5,71
250,
735,
6813
0,57
5,60
100,
595,
6410
MnO
wt%
0,01
<0.0
10,
01<0
.01
0,01
<0.0
10,
01<0
.01
0,01
<0.0
10,
01<0
.01
P2O
5w
t%0
170
1893
018
019
950
330
1917
80
160
2082
002
003
610
020
0456
Table 2: Main elements in wt%, in whole rock by XRF and by ICP-AEdetermined in conjunction with XRF. Total-S determined in separate pAES relative to XRF calculated in % (dimensionless). Further explana
P2O
5w
t%0,
170,
1893
0,18
0,19
950,
330,
1917
80,
160,
2082
0,02
0,03
610,
020,
0456
SU
M T
OTA
Lw
t%8,
9884
,54
8,76
81,7
411
11,5
283
,90
148,
8681
,93
116,
0387
,53
75,
6887
,25
7
S-to
tal
wt%
Leco
3,88
3,79
3,74
3,82
2,54
2,27
LOI1
000
wt%
14,9
014
,90
15,2
015
,20
9,61
9,71
CU
M S
UM
wt%
103,
3210
0,43
102,
8410
0,95
99,6
899
,23
Sam
pleL
abel
Tara
ldru
d200
7032
0S0
Tara
ldru
d200
7032
1S0
AV
GS
TDE
VC
oVA
VG
STD
EV
CoV
AV
GS
TDE
VC
oVS
ampl
e#un
itno
tes
1112
SiO
2w
t%0,
0955
,20
00,
1154
,40
00
024
00
280
014
Al2
O3
wt%
1,56
16,7
09
1,60
16,4
010
100
514
641
100
3Fe
2O3-
tota
lw
t%0,
561,
2844
0,58
1,29
4589
810
854
544
12
TiO
2w
t%0,
010,
891
0,01
0,88
11
08
10
321
04
MgO
wt%
0,23
1,14
200,
241,
1221
458
1828
829
211
3C
aOw
t%0,
070,
0611
80,
070,
0612
910
412
1110
67
612
48
6N
a2O
wt%
0,07
0,67
100,
070,
6511
233
1310
219
101
9K
2Ow
t%0,
475,
339
0,48
5,28
911
17
146
429
02
MnO
wt%
0,01
<0.0
10,
01<0
.01
9810
10P
2O5
wt%
0,02
0,03
800,
020,
0377
9515
1694
4447
782
3S
UM
TO
TAL
wt%
3,08
81,2
94
3,19
80,1
04
S-to
tal
wt%
Leco
1,47
1,48
LOI1
000
wt%
17,5
018
,00
CU
M S
UM
wt%
100,
2699
,59
Kon
owsg
ate
ICP
/XR
F w
t%S
lem
mes
tad
ICP
/XR
F w
t%Ta
rald
rud
ICP
/XR
F w
t%
belo
w L
LDbe
low
LLD
ES after selective acid digestion. Ignition loss LOI procedure with Leco. Recovery of contents by ICP-ation in text.
27

Sam
ple#
Ag*
As
Ba
Cd*
Co
Cr
Cu
Mo
Ni
Pb
VZn
unit
ppm
ppm
ppm
ppm
ppm
ppm
ppm
ppm
ppm
ppm
ppm
ppm
LLD
in p
pm2,
002,
001,
000,
100,
100,
200,
500,
501,
001,
001,
001,
00
1K
onow
sgt.
2007
0320
S1
<438
,813
31,
017
,58,
198
,539
,140
,020
,946
,676
,82
Kon
owsg
t. 20
0703
21S
1<4
40,5
180
0,7
16,7
9,2
91,2
43,3
40,1
21,0
54,3
58,2
3K
onow
sgt.
2007
0322
S2
<450
,116
30,
712
,49,
276
,945
,129
,622
,453
,855
,14
Kon
owsg
t. 20
0703
23S
2<4
48,0
155
0,7
11,9
8,9
84,5
40,7
29,8
22,9
51,2
57,2
5S
lem
mes
tadF
E20
0703
20S
1<4
69,1
3650
1,1
23,4
19,8
197,
012
8,0
141,
030
,323
6,0
36,5
6S
lem
mes
tadF
E20
0703
20S
2<4
69,1
3040
1,2
23,7
18,5
194,
012
6,0
142,
030
,022
0,0
31,9
7S
lem
mes
tadF
E20
0703
20S
3<4
67,0
3280
1,2
23,2
19,6
191,
012
6,0
141,
029
,023
4,0
31,4
8S
lem
mes
tadF
E20
0703
20S
4<4
69,1
2990
1,1
24,1
19,1
201,
012
9,0
145,
028
,323
3,0
33,0
9S
lem
mes
tadC
2007
0320
S1
<439
,923
21,
19,
614
,075
,887
,481
,338
,931
9,0
47,4
10S
lem
mes
tadC
2007
0321
S1
<436
,624
31,
19,
113
,676
,589
,575
,240
,632
0,0
45,0
11Ta
rald
rud2
0070
320S
1<4
18,1
142
0,2
0,4
9,7
12,9
168,
06,
526
,113
4,0
6,2
12Ta
rald
rud2
0070
321S
1<4
18,5
149
0,2
0,4
10,0
12,7
169,
06,
727
,014
0,0
6,8
MIN
in p
pm0
18,1
133
0,2
0,4
8,1
12,7
39,1
6,5
20,9
46,6
6,2
MA
Xin
ppm
069
,136
501,
224
,119
,820
1,0
169,
014
5,0
40,6
320,
076
,8
AV
Gin
ppm
<447
,111
960,
914
,413
,310
9,3
99,3
73,2
28,1
170,
240
,5S
TDE
V0
18,6
1518
0,3
8,6
4,8
69,3
48,7
55,6
6,4
103,
620
,7C
oVin
%-
39,4
127
40,9
59,6
35,8
63,4
49,1
76,0
22,7
60,9
51,3
Sam
ple#
BB
eC
eLa
LiS
cS
rY
Zrun
itpp
mpp
mpp
mpp
mpp
mpp
mpp
mpp
mpp
m
Table 3: Trace elements in ppm by ICP-AES after selective accalculated as percentage of STDEV relative to AVG. Further e
unit
ppm
ppm
ppm
ppm
ppm
ppm
ppm
ppm
ppm
LLD
in p
pm5,
000,
202,
001,
001,
000,
101,
000,
101,
00
1K
onow
sgt.
2007
0320
S1
<10
1,1
75,3
39,0
5,3
2,9
108,
014
,036
,12
Kon
owsg
t. 20
0703
21S
1<1
01,
175
,739
,75,
73,
487
,814
,137
,63
Kon
owsg
t. 20
0703
22S
2<1
01,
071
,438
,14,
84,
387
,312
,934
,84
Kon
owsg
t. 20
0703
23S
2<1
00,
974
,438
,65,
13,
677
,612
,234
,15
Sle
mm
esta
dFE
2007
0320
S1
14,2
1,8
59,3
33,1
12,7
3,9
60,1
20,0
54,8
6S
lem
mes
tadF
E20
0703
20S
2<1
01,
857
,132
,012
,13,
758
,920
,954
,17
Sle
mm
esta
dFE
2007
0320
S3
12,8
1,8
57,5
31,7
12,3
3,8
59,2
19,8
53,7
8S
lem
mes
tadF
E20
0703
20S
412
,71,
857
,531
,612
,33,
961
,220
,654
,89
Sle
mm
esta
dC20
0703
20S
111
,61,
076
,943
,37,
52,
625
,614
,241
,310
Sle
mm
esta
dC20
0703
21S
113
,01,
078
,443
,57,
62,
730
,314
,541
,311
Tara
ldru
d200
7032
0S1
17,7
1,5
72,7
38,0
8,2
1,7
13,9
5,8
42,5
12Ta
rald
rud2
0070
321S
118
,91,
575
,339
,28,
11,
814
,95,
841
,8
MIN
in p
pm11
,60,
957
,131
,64,
81,
713
,95,
834
,1M
AX
in p
pm18
,91,
878
,443
,512
,74,
310
8,0
20,9
54,8
AV
Gin
ppm
14,4
1,4
69,3
37,3
8,5
3,2
57,1
14,6
43,9
STD
EV
2,8
0,4
8,6
4,3
3,1
0,8
30,5
5,2
8,2
CoV
in %
19,3
27,2
12,5
11,4
36,4
26,4
53,5
35,6
18,6
cid digestion. Coefficient of variation CoV explanation in text.
28
APPENDIX 3: ORIGINAL DATA
29

XRF ANALYSERGEOLOGISK MATERIALE
ANALYSEKONTRAKTNR. 2007.0458
4.2 g Li2B4O7 + 0.6 g prøve smeltet til glassplate
Analyseprogram : HOVEDELEMENT INSTRUMENT TYPE : PANalytical Axios 4 kW x-ray spectrometer (Rh-røntgenrør)Analysene er utført på glødete prøver (v/1000 °C) Analyse-data er regnet tilbake fra glødet- til mottatt-prøve
NEDRE BESTEMMELSESGRENSER FOR HOVEDELEMENTER angitt i % SiO2 Al2O3 Fe2O3 TiO2 MgO CaO Na2O K2O MnO P2O5
0,5 0,02 0,01 0,01 0,04 0,01 0,1 0,01 0,01 0,01
BaO* Cr2O3* CuO* HfO2* NiO* PbO* SrO* V2O5* ZnO* ZrO2*
0,025 0,02 0,01 0,02 0,01 0,01 0,04 0,02 0,01 0,02
*) Omfattes ikke av akkreditering
ANALYSEUSIKKERHET : Analyseusikkerheten er beregnet fra regresjonsanalyse av internasjonale standarder, hvor det er benyttet en veid regresjonsmodell. Usikkerheten er gitt ved: [1] men dog aldri < 1 % relativ
hvor C i er den rapporterte konsentrasjon i %, K Element er gitt for de enkelte element i tabellen nedenfor
Element SiO2 Al2O3 Fe2O3 TiO2 MgO CaO K2O Na2O MnO P2O5 BaO* Cr2O3* CuO* HfO2* NiO* PbO* SrO* V2O5* ZnO* ZrO2*
½ 0 09 0 04 0 06 0 02 0 08 0 06 0 04 0 07 0 01 0 02
7491 TRONDHEIM Tlf.: 73 90 40 00Telefaks: 73 92 16 20
USIKKERHET K [%] = 0.1+ C Element i± ⋅
KELEMENT / %½ 0,09 0,04 0,06 0,02 0,08 0,06 0,04 0,07 0,01 0,02
De oppgitte usikkerhetene er for 1σ nivå (68% konfidensnivå), ved å multiplisere usikkerheten med 2 oppnås et 95% konfidensnivå.
EKSEMPELDet er rapportert et analyseresultat på 20.0% (dvs. C i =20.0 %) for Al 2 O 3 . Denne konsentrasjonen samt K-verdien fra tabellen over innsatt i likn.[1] gir:
Et konfidensintervall på 68%-nivå vil da bli: 20.0 ± 0.2 %, og konfidensintervallet på 95%-nivå: 20.0 ± 0.4 %
PRESISJON : Det kjøres rutinemessig kontrollprøver, som føres i kontrolldiagram (X-diagram). Disse kan forevises om ønskelig.
ANTALL PRØVER: 12
ANMERKNINGER: Ingen
Rapporten må ikke gjengis i utdrag uten skriftlig godkjenning fra NGU-Lab.Ferdig analysert 13.feb.08 Bjørn Nilsen
Dato Operatør
USIKKERHET K [%] = 0.1+ C Element i± ⋅
[%]2.02004.0USIKKERHET +0.1 = =⋅±
//Filtj1/_perm/Lab/XRF//Data/20070458_XRF_MainElements.xls Forsidemal ver. 4.0 av 31.05.07)*)Omfattes ikke av akkreditering Delrapp XRF-Hoved- 1
30
XRF ANALYSERGEOLOGISK MATERIALE
ANALYSEKONTRAKTNR. 2007.0458
Prøve id. SiO2 Al2O3 Fe2O3 TiO2 MgO CaO Na2O K2O MnO P2O5 Gl.tap Sum Hoved* [%] [%] [%] [%] [%] [%] [%] [%] [%] [%] [%] [%]
1 54,3 15,1 5,02 0,878 1,50 2,06 0,32 4,82 0,043 0,079 12,8 96,82 54,8 15,2 5,47 0,882 1,59 1,90 0,32 4,71 0,040 0,091 12,7 97,73 55,1 14,6 4,69 0,844 1,83 2,22 0,28 4,70 0,034 0,072 13,2 97,64 55,4 14,3 4,90 0,827 1,63 1,97 0,28 4,66 0,027 0,077 13,5 97,55 53,5 16,4 5,86 0,860 1,05 0,246 0,68 5,76 <0.01 0,183 14,9 99,56 51,6 15,8 5,68 0,836 1,03 0,248 0,68 5,68 <0.01 0,189 14,9 96,77 53,2 16,2 5,77 0,853 1,05 0,251 0,68 5,71 <0.01 0,185 15,2 99,18 51,7 15,8 5,73 0,844 1,03 0,264 0,69 5,68 <0.01 0,196 15,2 97,29 57,3 17,2 4,02 0,975 1,41 0,180 0,81 5,60 <0.01 0,033 9,61 97,1
10 57,4 17,3 3,53 0,971 1,30 0,253 0,82 5,64 <0.01 0,036 9,71 96,911 55,2 16,7 1,28 0,888 1,14 0,055 0,67 5,33 <0.01 0,025 17,5 98,812 54,4 16,4 1,29 0,882 1,12 0,056 0,65 5,28 <0.01 0,026 18,0 98,1
7491 TRONDHEIM Tlf.: 73 90 40 00Telefaks: 73 92 16 20
7491 TRONDHEIM
BaO* Cr2O3* CuO* HfO2* NiO* PbO* SrO* V2O5* ZnO* ZrO2*[%] [%] [%] [%] [%] [%] [%] [%] [%] [%]
1 0,144 <0.02 <0.01 <0.02 <0.01 0,021 <0.04 0,080 <0.01 0,0202 0,157 <0.02 <0.01 <0.02 <0.01 0,021 <0.04 0,076 <0.01 0,0213 0,151 <0.02 <0.01 <0.02 <0.01 0,020 <0.04 0,066 <0.01 0,0214 0,146 <0.02 <0.01 <0.02 <0.01 0,021 <0.04 0,067 <0.01 0,0235 1,95 <0.02 0,020 <0.02 0,024 0,023 <0.04 0,148 <0.01 0,0226 1,93 <0.02 0,018 <0.02 0,026 0,024 <0.04 0,144 <0.01 0,0227 1,94 <0.02 0,021 <0.02 0,025 0,020 <0.04 0,148 <0.01 0,0228 1,92 <0.02 0,020 <0.02 0,023 0,023 <0.04 0,145 <0.01 0,0219 0,273 <0.02 <0.01 <0.02 0,013 0,023 <0.04 0,383 <0.01 0,023
10 0,277 <0.02 <0.01 <0.02 0,014 0,021 <0.04 0,375 <0.01 0,02511 0,231 <0.02 <0.01 <0.02 <0.01 0,020 <0.04 0,149 <0.01 0,02312 0,231 <0.02 <0.01 <0.02 <0.01 0,022 <0.04 0,142 <0.01 0,022
7491 TRONDHEIM Tlf.: 73 90 40 00Telefaks: 73 92 16 20
//Filtj1/_perm/Lab/XRF/Data/20070458_XRF_H.xls Forsidemal ver. 4.0 av 31.05.07)*)Omfattes ikke av akkreditering Delrapp XRF-Hoved- 1
31
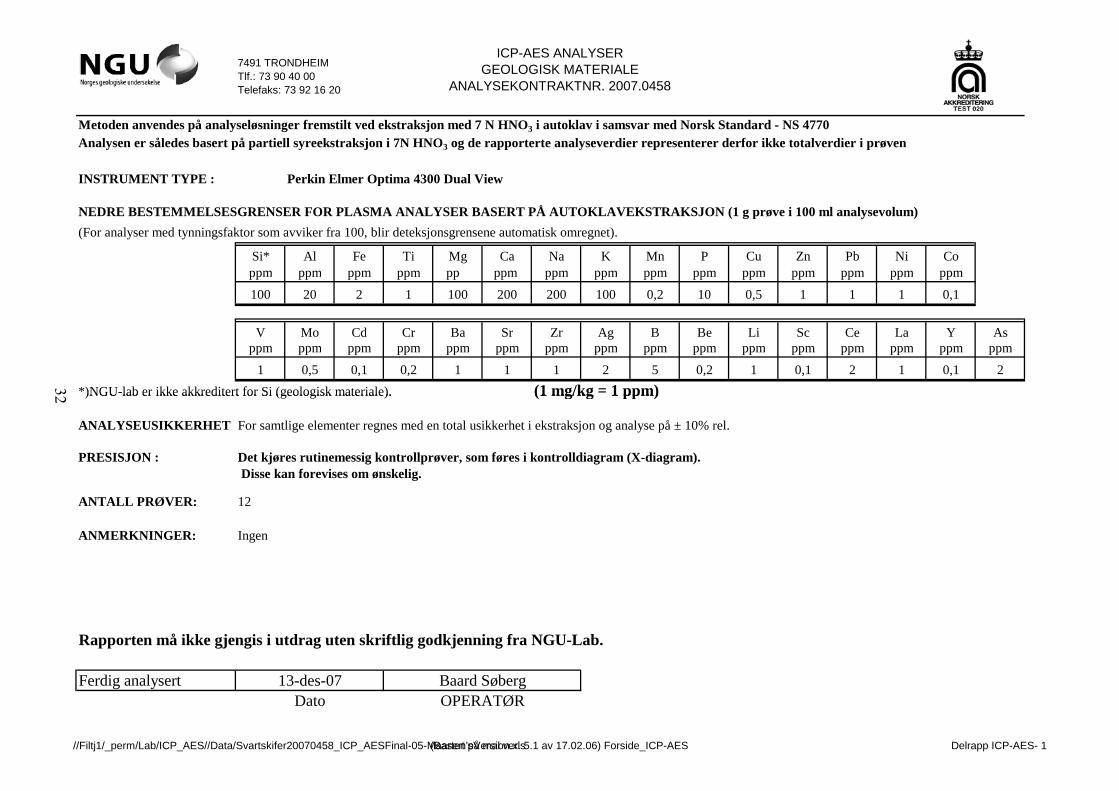
ICP-AES ANALYSERGEOLOGISK MATERIALE
ANALYSEKONTRAKTNR. 2007.0458
Metoden anvendes på analyseløsninger fremstilt ved ekstraksjon med 7 N HNO3 i autoklav i samsvar med Norsk Standard - NS 4770Analysen er således basert på partiell syreekstraksjon i 7N HNO3 og de rapporterte analyseverdier representerer derfor ikke totalverdier i prøven
INSTRUMENT TYPE : Perkin Elmer Optima 4300 Dual View
NEDRE BESTEMMELSESGRENSER FOR PLASMA ANALYSER BASERT PÅ AUTOKLAVEKSTRAKSJON (1 g prøve i 100 ml analysevolum)(For analyser med tynningsfaktor som avviker fra 100, blir deteksjonsgrensene automatisk omregnet).
Si* Al Fe Ti Mg Ca Na K Mn P Cu Zn Pb Ni Coppm ppm ppm ppm pp ppm ppm ppm ppm ppm ppm ppm ppm ppm ppm
100 20 2 1 100 200 200 100 0,2 10 0,5 1 1 1 0,1
V Mo Cd Cr Ba Sr Zr Ag B Be Li Sc Ce La Y Asppm ppm ppm ppm ppm ppm ppm ppm ppm ppm ppm ppm ppm ppm ppm ppm
1 0,5 0,1 0,2 1 1 1 2 5 0,2 1 0,1 2 1 0,1 2*)NGU-lab er ikke akkreditert for Si (geologisk materiale). (1 mg/kg = 1 ppm)
7491 TRONDHEIM Tlf.: 73 90 40 00Telefaks: 73 92 16 20
)NGU lab er ikke akkreditert for Si (geologisk materiale). (1 mg/kg 1 ppm)
ANALYSEUSIKKERHET For samtlige elementer regnes med en total usikkerhet i ekstraksjon og analyse på ± 10% rel.
PRESISJON : Det kjøres rutinemessig kontrollprøver, som føres i kontrolldiagram (X-diagram). Disse kan forevises om ønskelig.
ANTALL PRØVER: 12
ANMERKNINGER: Ingen
Rapporten må ikke gjengis i utdrag uten skriftlig godkjenning fra NGU-Lab.
Ferdig analysert Baard SøbergOPERATØR
13-des-07Dato
//Filtj1/_perm/Lab/ICP_AES//Data/Svartskifer20070458_ICP_AESFinal-05-Maarten'sVersion.xls(Basert på mal ver. 5.1 av 17.02.06) Forside_ICP-AES Delrapp ICP-AES- 1
32

7491 TRONDHEIM
Si Al Fe Ti Mg Ca Na K Mn P Cu Zn Pb Ni Co[mg/kg] [mg/kg] [mg/kg] [mg/kg] [mg/kg] [mg/kg] [mg/kg] [mg/kg] [mg/kg] [mg/kg] [mg/kg] [mg/kg] [mg/kg] [mg/kg] [mg/kg]
Konowsgt. 20070320S1 488 7920 30500 38,3 3230 13500 544 3960 298 310 98,5 76,8 20,9 40,0 17,5Konowsgt. 20070321S1 308 8910 30500 42,7 3980 13000 429 4400 309 320 91,2 58,2 21,0 40,1 16,7
Tlf.: 73 90 40 00Telefaks: 73 92 16 20
Konowsgt. 20070322S2 413 7920 32900 44,2 5840 18300 499 4510 279 370 76,9 55,1 22,4 29,6 12,4Konowsgt. 20070323S2 306 8040 30600 41,4 4950 15800 532 4450 229 347 84,5 57,2 22,9 29,8 11,9
SlemmestadFE20070320S1 271 11400 36000 92,3 2140 1930 579 5960 60,9 743 197 36,5 30,3 141 23,4SlemmestadFE20070320S2 498 10500 35700 82,9 2100 2040 613 5490 57,7 779 194 31,9 30,0 142 23,7SlemmestadFE20070320S3 275 11700 34900 87,4 2120 1870 615 6020 57,4 718 191 31,4 29,0 141 23,2SlemmestadFE20070320S4 427 11700 35400 81,6 2150 1930 568 6040 58,4 746 201 33,0 28,3 145 24,1
SlemmestadC20070320S1 461 8480 22600 47,4 1440 1420 471 4730 39,7 98 75,8 47,4 38,9 81,3 9,61SlemmestadC20070321S1 403 8590 19500 48,7 1450 1770 495 4890 35,4 109 76,5 45,0 40,6 75,2 9,05
Taraldrud20070320S1 418 8280 3900 56,4 1400 465 516 3920 11,2 69 12,9 6,2 26,1 6,5 0,42Taraldrud20070321S1 505 8470 4050 59,4 1420 516 502 3980 11,3 72 12,7 6,8 27,0 6,7 0,44
7491 TRONDHEIM
V Mo Cd Cr Ba Sr Zr Ag B Be Li Sc Ce La Y As[mg/kg] [mg/kg] [mg/kg] [mg/kg] [mg/kg] [mg/kg] [mg/kg] [mg/kg] [mg/kg] [mg/kg] [mg/kg] [mg/kg] [mg/kg] [mg/kg] [mg/kg] [mg/kg]
Konowsgt. 20070320S1 46,6 39,1 0,96 8,05 133 108 36,1 <4 <10 1,13 5,3 2,91 75,3 39,0 14,0 38,8Konowsgt. 20070321S1 54,3 43,3 0,70 9,22 180 87,8 37,6 <4 <10 1,12 5,7 3,40 75,7 39,7 14,1 40,5
Tlf.: 73 90 40 00Telefaks: 73 92 16 20
Konowsgt. 20070322S2 53,8 45,1 0,68 9,15 163 87,3 34,8 <4 <10 0,95 4,8 4,30 71,4 38,1 12,9 50,1Konowsgt. 20070323S2 51,2 40,7 0,67 8,87 155 77,6 34,1 <4 <10 0,93 5,1 3,59 74,4 38,6 12,2 48,0
SlemmestadFE20070320S1 236 128 1,11 19,8 3650 60,1 54,8 <4 14,2 1,83 12,7 3,86 59,3 33,1 20,0 69,1SlemmestadFE20070320S2 220 126 1,19 18,5 3040 58,9 54,1 <4 <10 1,76 12,1 3,70 57,1 32,0 20,9 69,1SlemmestadFE20070320S3 234 126 1,18 19,6 3280 59,2 53,7 <4 12,8 1,82 12,3 3,79 57,5 31,7 19,8 67,0SlemmestadFE20070320S4 233 129 1,10 19,1 2990 61,2 54,8 <4 12,7 1,83 12,3 3,88 57,5 31,6 20,6 69,1
SlemmestadC20070320S1 319 87,4 1,13 14,0 232 25,6 41,3 <4 11,6 1,03 7,5 2,62 76,9 43,3 14,2 39,9, , , , , , , , , , , , ,SlemmestadC20070321S1 320 89,5 1,05 13,6 243 30,3 41,3 <4 13,0 1,04 7,6 2,70 78,4 43,5 14,5 36,6
Taraldrud20070320S1 134 168 0,22 9,67 142 13,9 42,5 <4 17,7 1,50 8,2 1,73 72,7 38,0 5,83 18,1Taraldrud20070321S1 140 169 0,24 9,97 149 14,9 41,8 <4 18,9 1,49 8,1 1,76 75,3 39,2 5,76 18,5
33

TOTAL KARBON/TOTAL SVOVEL/TOTAL ORGANISK KARBONGeologisk materiale
ANALYSEKONTRAKTNR. 2007.0458
BESTEMMELSE AV TOTAL KARBON(TC) / TOTAL SVOVEL(TS) / TOTAL ORGANISK KARBON (TOC) (LECO OVN)
INSTRUMENT TYPE : Leco SC-444
I) TOTAL KARBON (TC) Analyse usikkerhet0,07 Usikkerhet
± 0.07 %±15% rel.
II) TOTAL SVOVEL (TS) Analyse usikkerhet0,01 Usikkerhet
±30% rel.±20% rel.
III) TOTAL ORGANISK KARBON (TOC) Analyse usikkerhet0,1 Usikkerhet
±25% rel
Måleområdet / %0.07-0.5
>0.5
Måleområdet / %0 1-3 0
Nedre bestemmelses grense [% S]:
Nedre bestemmelses grense [% TOC]:
Måleområdet / % 0.01-3.0
>3.0
7491 TRONDHEIM Tlf.: 73 90 40 00 Telefaks: 73 92 16 20
Nedre bestemmelses grense [% C]:
±25% rel.±20% rel.
Det er her oppgitt usikkerhet med dekningsfaktor 2 (jfr. 2 standard avvik), noe som da korsponderer med et konfidensintervall på 95 %
PRESISJON : Det kjøres rutinemessig kontrollprøver, som føres i kontrolldiagram (X-diagram). Disse kan forevises om ønskelig.
ANTALL PRØVER: 12
ANMERKNINGER: Ingen
Rapporten må ikke gjengis i utdrag uten skriftlig godkjenning fra NGU-Lab.
Ferdig analysert 14. jan. 2008Dato
Anne NordtømmeOPERATØR
0.1-3.0 >3.0
//Filtj1/_perm/Lab/Leco/Data/20070458_Leco.xls Forside_Leco ver.3.0 Sist Endret 9.1.08 Delrapp-Leco-1
34
TOTAL KARBON/TOTAL SVOVEL/TOTAL ORGANISK KARBONGeologisk materiale
ANALYSEKONTRAKTNR. 2007.0458
Prøve id. Svovel Karbon TOC[%] [%] [%]
1 2,72 6,52 5,812 2,80 6,51 5,763 2,68 5,96 5,324 2,77 5,93 5,285 3,88 9,67 9,116 3,79 9,62 9,047 3,74 9,61 8,988 3,82 9,52 8,939 2,53 4,65 4,3110 2,27 4,58 4,3311 1,47 10,81 10,0612 1,48 10,72 9,96
7491 TRONDHEIM Tlf.: 73 90 40 00Telefaks: 73 92 16 20
//Filtj1/_Perm/Lab/Leco/Data/20070458_Leco.xls Leco Delrapp-Leco-1
35

Bestemmelse av Glødetap ved 480°CGeologisk materiale
ANALYSEKONTRAKTNR. 2007.0458
OPPDRAGSGIVER: Ola M Sæther NGU PROSJEKT : 319000
ANTALL PRØVER: 12
PRØVETYPE : Humus
GLØDETAP 1 (Temperatur: 480°C i 20 timer)Beregninger
A: Innvekt prøve B: Vekt av prøve+digel C: Vekt av digel+prøve etter varming ΔX G1 :Vekttap (Glødetap) Y G1: %Vekttap (%Glødetap)
Analyseusikkerhet : 8 % rel. (1 σ-nivå)
7491 TRONDHEIM Tlf.: 73 90 40 00 Telefaks: 73 92 16 20
Δ ΔX B C Y B CA
XAG G
G1 1
1100 100= − ⇒ = − • = •
y ( )
ANMERKNINGER: 480°C i 20 timer
Rapporten må ikke gjengis i utdrag uten skriftlig godkjenning fra NGU-Lab.
Ferdig analysert 28. feb. 2008Dato
Frank BergeOPERATØR
Δ ΔX B C Y B CA
XAG G
G1 1
1100 100= − ⇒ = − • = •
//Filtj1/_Perm/Lab/Kjemi/Glødetap/Data/20070458_gltap480.xls Forside_gltap480 Delrapp_Glødetap side 1
36

Bestemmelse av Glødetap ved 480°CGeologisk materiale
ANALYSEKONTRAKTNR. 2007.0458
Prøve navn Vekt Skål Vekt prøve(A) Vekt digel+prøve(B) Vekt etter 480°C(C) Gl.tap[g] [g] [g] [g[ [%]
1 2,1754 5,043 7,2184 6,6922 10,42 2,1835 5,040 7,2231 6,6916 10,53 2,1883 5,070 7,2583 6,7683 9,74 2,1785 5,040 7,2185 6,7058 10,25 2,1652 5,101 7,2658 6,5834 13,46 2,1674 5,065 7,2327 6,5522 13,47 2,1762 5,084 7,2599 6,5813 13,38 2,1817 5,094 7,2758 6,5946 13,49 2,1781 5,052 7,2302 6,8092 8,3
10 2,1697 5,105 7,2745 6,8537 8,211 2,1700 5,116 7,2862 6,5029 15,312 2 1709 5 055 7 2255 6 4514 15 3
7491 TRONDHEIM Tlf.: 73 90 40 00Telefaks: 73 92 16 20
12 2,1709 5,055 7,2255 6,4514 15,3
//Filtj1/_Perm/Lab/Kjemi/Glødetap/Data/20070458_gltap480.xls Glødetap Delrapp_Glødetap side 1
37