Embed Size (px)
Citation preview
Innocenti Working Papers
No. 94
CHILD POVERTY IN ENGLISH-SPEAKING COUNTRIES
John Micklewright*
June 2003
* Professor of Social Statistics, University of Southampton ([email protected])
Acknowledgements This paper was written for the conference ‘Les Enfant Pauvres en France’, Paris, 21 March 2003, jointly organized by CERC, CGP, CNAF and DREES. I am grateful to Tony Atkinson, Jonathan Bradshaw, Dave Maré and Brian Nolan for help in various ways. Copyright UNICEF, 2003
Cover design: Miller, Craig and Cocking, Oxfordshire – UK
Printed on recycled paper by: Tipografia Giuntina, Florence, Italy
ISSN: 1014-7837 Readers citing this document are asked to use the following form of words: Micklewright, John (2003), ‘Child Poverty in English-Speaking Countries’. Innocenti Working Paper No. 94. Florence: UNICEF Innocenti Research Centre.
UNICEF INNOCENTI RESEARCH CENTRE
The UNICEF Innocenti Research Centre in Florence, Italy, was established in 1988 to strengthen the research capability of the United Nations Children's Fund (UNICEF) and to support its advocacy for children worldwide. The Centre (formally known as the International Child Development Centre) helps to identify and research current and future areas of UNICEF's work. Its prime objectives are to improve international understanding of issues relating to children's rights and to help facilitate the full implementation of the United Nations Convention on the Rights of the Child in both industrialized and developing countries.
The Centre's publications are contributions to a global debate on child rights issues and include a wide range of opinions. For that reason, the Centre may produce publications that do not necessarily reflect UNICEF policies or approaches on some topics. The views expressed are those of the authors and are published by the Centre in order to stimulate further dialogue on child rights.
The Centre collaborates with its host institution in Florence, the Istituto degli Innocenti, in selected areas of work. Core funding for the Centre is provided by the Government of Italy, while financial support for specific projects is also provided by other governments, international institutions and private sources, including UNICEF National Committees.
The opinions expressed in this paper are those of the author and do not necessarily reflect the policies or views of UNICEF.
1
Abstract This paper considers child poverty in rich English-speaking countries – the US, Canada, Australia, New Zealand, the UK, and Ireland. Do all these countries really stand out from other OECD countries for their levels of child poverty, as is sometimes assumed? And what policies have they adopted to address the problem? ‘Poverty’ is interpreted broadly and hence the available cross-national evidence on educational disadvantage and teenage births is considered alongside that on low household income. Likewise, discussion of policy initiatives ranges across a number of areas of government activity.
1. Introduction
My brief from the organisers of this conference is to consider why the issue of poor children is seen as important in English-speaking countries and the extent to which the issue is taken into account in the design of social policy.
Why should child poverty be seen as important in any country? First, there is a natural concern for any vulnerable group in the population. But poverty among children has particular resonance due to innate feelings of protection towards the young and assumptions of their blamelessness for the situation in which they find themselves. Second, a reduction in child poverty may have instrumental value in improving societal well-being in various ways. Corak (2001) makes an analogy with low inflation or balanced budgets – means to an end rather than goals for their own sake. Poverty among children diverts resources that could be used elsewhere, reduces the stock of human capital, and creates a variety of social problems from which all people suffer.
In considering the issue of child poverty in the English-speaking countries, the first thing to deal with is the extent of the problem. How much poverty among children is there in these countries – the US, Canada, Australia, New Zealand, the UK, and Ireland – and how does the situation compare with that elsewhere? If the English-speaking countries have higher child poverty rates than other countries then heightened concern over poor children would be a natural response. This is the subject of Section 2. ‘Poverty’ is interpreted broadly and not just as low income, although the latter gets more attention than other dimensions of well-being in much of the paper.
A lot of the concern over child poverty – whether for distributional or instrumental reasons – centres on the implications that disadvantage during childhood has for an individual’s education, health and other outcomes including future employment and earnings. This is the second issue in the paper, dealt with in Section 3. What is the evidence from the English-speaking countries? I focus in particular on the US and the UK, where the necessary longitudinal survey data have been heavily investigated.
The paper then turns to the design of policy. As a prelude to considering policies in individual countries, Section 4 looks briefly at how government social expenditures on families in English-speaking countries compare with
2
those elsewhere. Section 5 then considers policies in four countries: the US, where poverty among children appears more or less accepted, the UK, where ‘ending child poverty’ has moved high up the domestic policy agenda, and Ireland and New Zealand, where emphasis on childhood disadvantage has recently increased in the policy debate.1 Section 6 concludes.
2. Child Well-Being: English-Speaking Countries vs. Continental Europe
Most people know that the US has a bad record on child poverty – defined in the narrow sense of low income – and some people will be familiar with the UK record, also weak in recent years (although now improving as we will see later). But what about Canada, Australia, New Zealand and Ireland? And how do the English-speaking countries as a group compare with others elsewhere in the OECD?
The first column of Table 1 shows the percentage of children in each English-speaking country living in households classified as poor on the basis of their income. The poverty line is a conventional relative one – half the national median income – and household incomes are adjusted with a conventional equivalence scale to take account of differences in household needs (the square root of the number of people in the household). The figures refer in general to the mid/late-1990s and the great majority come from the Luxembourg Income Study database (see Appendix).
Over one in five children in the US are classified as poor and between one in six and one in eight in the other English-speaking countries. The average rate for all six is getting on for double that for Continental Europe. Rates for individual countries in the latter group display considerable variation but only that for Italy (20 per cent) is within the range of the Anglophone values. With this single exception, there is complete separation between the two groups – higher poverty English-speaking countries and lower poverty Continental European countries.
Is the higher child poverty of the Anglophone countries merely a reflection of higher overall poverty? Or do children fare particularly badly relative to the rest of the population in countries where English is spoken?
It is certainly true that child poverty is high where overall poverty is high.2 But it is also the case that children fare particularly badly in the English-speaking countries. On average, the child poverty rate in these countries is 1 I should acknowledge my neglect of Canada in particular, where there is a rich seam of evidence
on childhood disadvantage and, over the years, considerable policy interest. For example, Corak (2001) reports the Canadian government’s pledge in 1989 to eliminate poverty among children by 2000 and it would have been interesting to have chosen this pledge and the subsequent history (both poverty levels and policies, or their lack) as a case study. 2 Given the definition of poverty as low income relative to the national average, both child and
overall poverty rates are highly correlated with the degree of income inequality.
3
nearly 1¼ times higher than the overall rate measured in the same way, while in the Continental European countries the two rates are on average the same.3 However, this may be a function less of being an English-speaking society and more of being a high poverty country, for the higher poverty Continental European countries share the same feature.
Table 1: Child well-being – English-speaking countries vs. Continental Europe
Income-poverty
(per cent children in households below
half national median income)
Teenage births
(per 1,000 women aged 15-19)
Relative educational disadvantage
(OECD rank)
USA 21.9 52.1 21
Canada 16.3 20.2 4
Ireland 16.8 18.7 13
UK 15.4 30.8 16
New Zealand 13.1 29.8 23
Australia 12.6 18.4 15
English-speaking average
16.0 28.3 15.3
Continental Europe 9.0 10.4 11.9
France 7.9 9.3 5
Sources: Col. 1: Luxembourg Income Study LIS Key Figures (http://www.lisproject.org/), UNICEF (2000, Figure 1) and Ballantyne et al. (2003, NB provisional figures) with income in all cases equivalised by the square root of household size; col 2: UNICEF (2001, Figure 1); col 3: UNICEF (2002, Figure 4: ranks not values). The figures for Continental Europe are unweighted averages of figures for a different number of EU countries (plus Norway) in each column: 13 for poverty, 14 for teen births and 12 for education. Ranking on relative educational disadvantage is on the basis of the average rank for the difference in achievement scores between the 5th and 50th percentiles in five tests of maths, science and reading in the 1995 and 1999 TIMSS and 2000 PISA surveys.
Focusing on poverty defined as low income therefore, the English-speaking countries would be justified in taking poverty among children especially seriously. They have higher child poverty rates than elsewhere and children appear worse off than the population as a whole – and more so than in other countries.4 3 See the Appendix for details of these calculations. The relationship in France mirrors the average
for Continental Europe – the overall rate in the year concerned, 1995, was 8.0 per cent, compared with the rate for children of 7.9 per cent. 4 The differential between child and overall poverty rates in any country should be keenly sensitive
to the choice of equivalence scale to account for differences in household size. Children will come lower down the income distribution the less the allowance that is made for scale economies. But the ‘root N’ scale used in Table 1 (which approximates to the OECD scale of 1.0+0.7*other adults
4
But we need to look also at other dimensions of child well-being. Restricting the focus to low income alone would be too limited. Much recent emphasis in Europe has been placed on ‘social exclusion’, both in academic debate on living standards and in the policy arena.5 This throws the net very wide over the possible aspects of children’s welfare that could be considered. But ‘poverty’ itself can also be defined in very broad terms. For example, the definition of the poor adopted by the EU back in 1984 was of those with ‘resources (material, cultural and social) [that] are so limited as to exclude them from the minimum acceptable way of life in the Member States in which they live’ (Eurostat, 2000: 11). Whatever the point of departure – social exclusion or a wide definition of poverty – there is a great deal that could be considered.
Columns 2 and 3 of Table 1 look at the English-speaking countries’ record on just two other aspects of child well-being – teenage births and education.6 I consider these in particular since they not only affect current child and teenager well-being (e.g. decent schooling is a consumption good in economic terms) but are important too for outcomes in future life, the subject of the next section. In both cases the table draws on the programme of cross-national comparison of child well-being in OECD countries that I worked on with colleagues while at UNICEF Innocenti Research Centre, Florence.
On teenage births, the English-speaking countries again stand out, and even more so than is the case with income-poverty. The Anglophone average of almost three times that of Continental Europe is driven up by the outlier of the US. But even if the US rate were the same as that of North-American neighbour, Canada, the average across the six countries would come down only to 23, over double Continental Europe’s 10.4. A teenage birth rate of 30 per 1,000, as in the UK, means that more than one in seven young women arrive at the age of 20 already having had a child.7 Among the continental European countries, only Portugal (21 per 1,000) is found within the English-speaking range – again there is almost complete separation of the two groups.
On education, the picture is much less clear-cut. Table 1 focuses not on traditional measures of attainment – for example the highest level of
+0.5*children) has a considerable degree of scale economies built into it and the conclusion about the position of children in English-speaking countries relative to other countries should be reasonably robust to choice of scale. 5 By contrast, the concept of social exclusion is absent from any discussion of living standards in
the US (Micklewright 2002). 6 Kitty Stewart and I have looked at differences and trends in a variety of dimensions of child
welfare across the EU (Micklewright and Stewart 1999). The website of the US Federal Interagency Forum on Child and Family Statistics, http://www.childstats.gov, contains a wide range of international comparisons and the agency’s annual report, America’s Children; Key National Indicators of Well-Being (available from the same website) provides an excellent example of presentation of statistics on children and young people at the national level with a clear brief analysis of them. 7 Assuming that no teenager has more than one child.
5
schooling reached – but on achievement, what a person actually knows as demonstrated in a test of their ability in a particular subject or a test of their ‘functional literacy’. Such tests are not without their problems, especially when conducted in a cross-national setting with all the attendant problems of linguistic and cultural differences.8 But they have the advantage of focusing on learning rather than mere time spent in the classroom, and in a way that at least attempts cross-national comparability (which seems impossible to achieve with any measure based on national qualifications).9
Column 3 shows each country’s rank in a comparison of 24 OECD countries’ records in five tests of maths, science and reading conducted among 14 and 15year-olds in the IEA’s TIMSS and the OECD’s PISA assessments. Countries are ranked on their average record on ‘relative’ educational disadvantage in these tests, measured as the gap in achievement scores between the weakest students in any country and those at the national average. Countries with a lower rank (implying a higher number in the table) are those with a larger gap between the learning achievement at the bottom and the middle of the distribution. These are the countries with a worse record than others in restricting the length of the lower tail of the distribution of achievement and where exclusion of children from the national norms is greatest.
The English-speaking countries score slightly worse as a group than Continental Europe but there is not much in it – an average of little more than 3 ranks. The US is clearly a poor performer once more, and so is New Zealand, but Canada does very well. However, the relative measure of disadvantage is not the only one of interest. An alternative is an ‘absolute’ one, the percentage of children in each country who fail to reach a benchmark level of achievement that is common to all countries. On this basis, the Anglophone countries actually do considerably better than Continental Europe on average (mean ranks of 8.8 and 15.8 respectively; UNICEF 2002, Figure 1). USA still comes relatively low but Australia and Canada rank better than any Continental European country except Finland.10
The focus on ranks hides any information on levels. Suffice to say that few if any countries could be happy with their level of either relative or absolute disadvantage. For example, the difference in maths scores among 14 year-olds in New Zealand between a low-performing child and a child with average performance is about five times the difference in average scores between 13 and 14 year-old children, indicating a long lower tail of achievement. But even in the best performing countries that differential is 8 See for example the discussion in Blum et al. (2001) on France’s experience of the OECD
International Adult Literacy Survey. (France withdrew from the survey before the results were published.) 9 See UNICEF (2002, Box 3) on the association between achievement and attainment in the EU,
including the dubious nature of the UK figures for attainment in recent Eurostat data. 10
France comes 12th in this ranking on absolute disadvantage.
6
about 3½ (UNICEF 2002: 12). Educational disadvantage seems high everywhere.
3. Childhood Disadvantage and Outcomes for Children
What does evidence from English-speaking countries show about the impact of poverty during childhood on outcomes in terms of education, health, employment and income in adult life, and other aspects of well-being?
Most of this evidence is necessarily drawn from longitudinal surveys that follow children as they grow up and then move into adulthood. Two main types of survey have been used: general household panels that follow a random sample of households for successive years, and studies of birth cohorts that trace a group of children born around the same time. Where available the data naturally have attracted social science researchers to try to uncover the links between disadvantage during childhood and outcomes for children.
That research has been most abundant in the US, where the Panel Study of Income Dynamics (PSID) in particular has long been the subject of attention. The PSID started in 1968 and its more than 30 years of annual data provide a very rich source of information for the investigation of different stages of childhood and their links with later adult outcomes. Considerable work has also been done in the UK. Until recently this concentrated on data from cohorts of births in 1958 and 1970. But work on outcomes for poor children has also now become possible with the British Household Panel Study (BHPS) which began in 1991.11
Longitudinal survey data in some of the other English-speaking countries are in much smaller supply. However, there have been several important recent initiatives. General household panels started in Australia in 2001 and in New Zealand in 2002. Panel data have been collected in Ireland as part of the European Community Household Panel and in 2002 the Irish government decided to start a large cohort study of new-born and eight year-old children.12
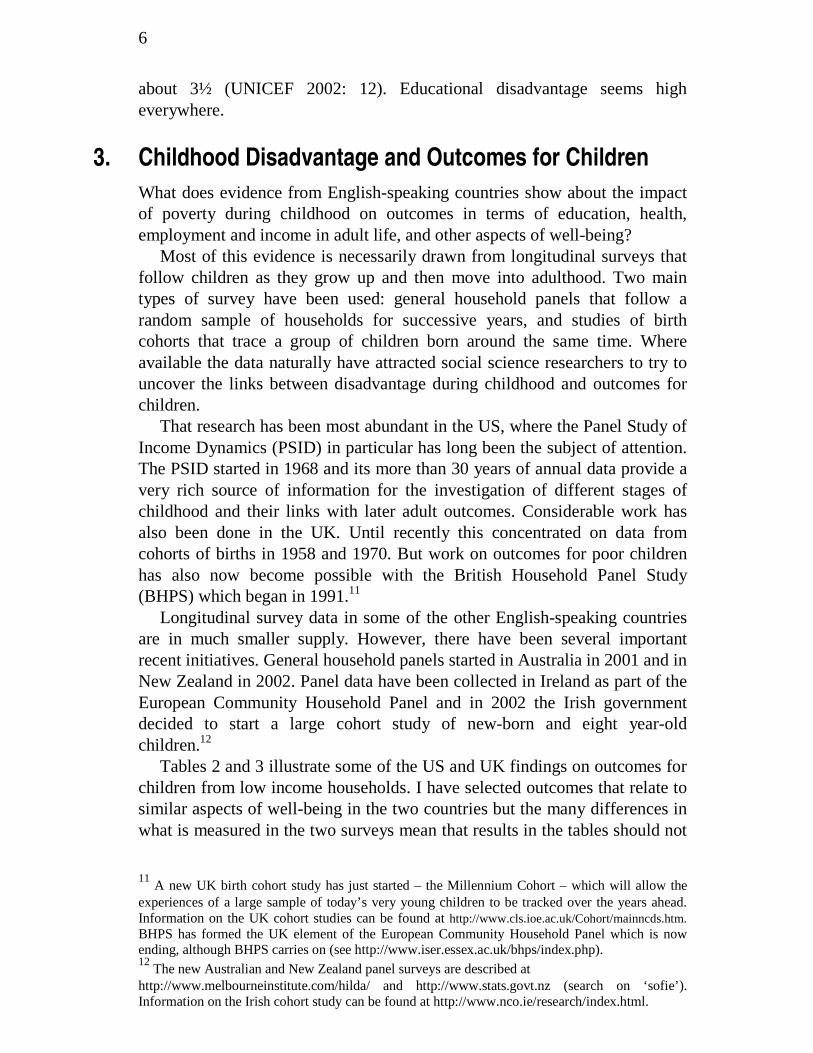
Tables 2 and 3 illustrate some of the US and UK findings on outcomes for children from low income households. I have selected outcomes that relate to similar aspects of well-being in the two countries but the many differences in what is measured in the two surveys mean that results in the tables should not
11
A new UK birth cohort study has just started – the Millennium Cohort – which will allow the experiences of a large sample of today’s very young children to be tracked over the years ahead. Information on the UK cohort studies can be found at http://www.cls.ioe.ac.uk/Cohort/mainncds.htm. BHPS has formed the UK element of the European Community Household Panel which is now ending, although BHPS carries on (see http://www.iser.essex.ac.uk/bhps/index.php). 12
The new Australian and New Zealand panel surveys are described at http://www.melbourneinstitute.com/hilda/ and http://www.stats.govt.nz (search on ‘sofie’). Information on the Irish cohort study can be found at http://www.nco.ie/research/index.html.
7
be compared in detail. That said, they illustrate one obvious broad similarity: in both countries children in low income households during childhood have markedly less favourable outcomes in teenage or early adult life.
Table 2. Childhood poverty and later outcomes: the US
Parents’ income quintile when child aged 14
Poorest Middle (3rd) Richest
Teenagers who drop out of high school (%) 34.1 15.9 6.5
Girls who become teenage mothers (%) 40.0 18.3 4.9
Young men’s average annual earnings (1992 US$)
16,772 23,306 26,168
Source: Mayer (1997: Table 3.1), PSID data.
These patterns in the data should come as no surprise. As noted by Susan Mayer in an extensive review of the literature on the influence of parental income on child outcomes:
“Parental income is positively correlated with virtually every dimension of child well-being that social scientists measure, and this is true in every country for which we have data. The children of rich parents are healthier, better behaved, happier and better educated during their childhood and wealthier when they have grown up than are children from poor families.” (Mayer 2002: 30)
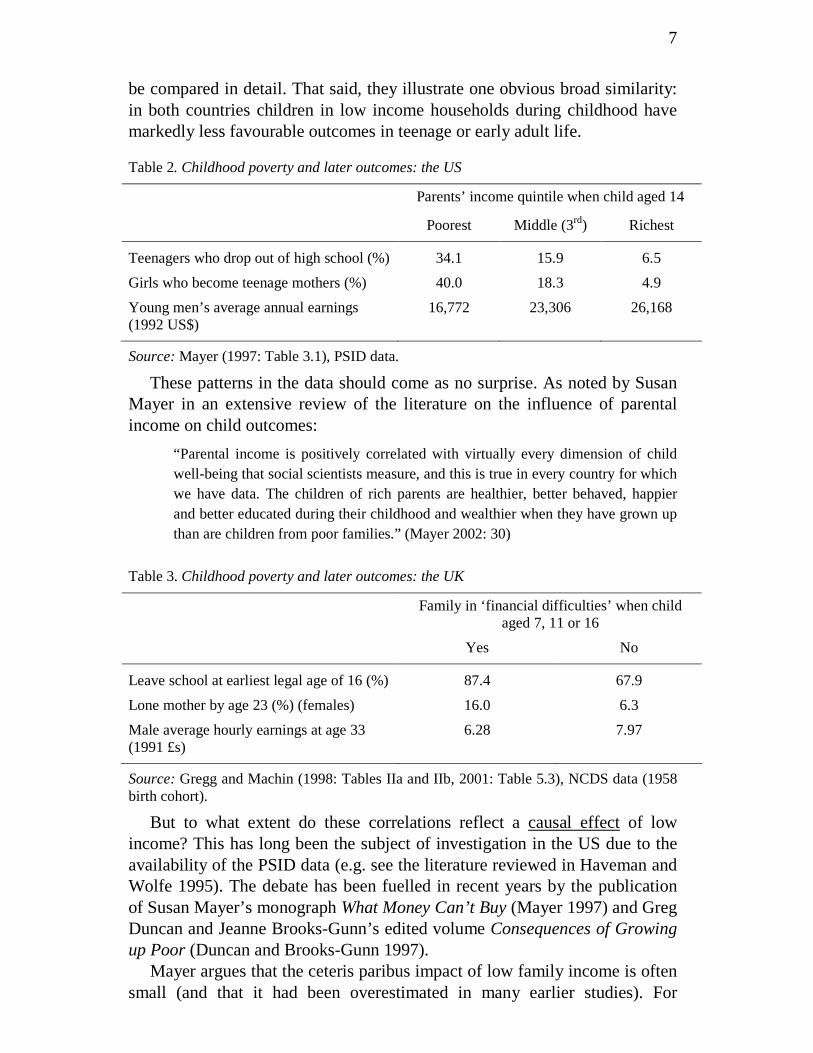
Table 3. Childhood poverty and later outcomes: the UK
Family in ‘financial difficulties’ when child aged 7, 11 or 16
Yes No
Leave school at earliest legal age of 16 (%) 87.4 67.9
Lone mother by age 23 (%) (females) 16.0 6.3
Male average hourly earnings at age 33 (1991 £s)
6.28 7.97
Source: Gregg and Machin (1998: Tables IIa and IIb, 2001: Table 5.3), NCDS data (1958 birth cohort).
But to what extent do these correlations reflect a causal effect of low income? This has long been the subject of investigation in the US due to the availability of the PSID data (e.g. see the literature reviewed in Haveman and Wolfe 1995). The debate has been fuelled in recent years by the publication of Susan Mayer’s monograph What Money Can’t Buy (Mayer 1997) and Greg Duncan and Jeanne Brooks-Gunn’s edited volume Consequences of Growing up Poor (Duncan and Brooks-Gunn 1997).
Mayer argues that the ceteris paribus impact of low family income is often small (and that it had been overestimated in many earlier studies). For
8
example, she estimates that a doubling of income of the poorest fifth of families would reduce the high school drop-out rate in Table 2 among these families by only 6 per cent points and the proportion of girls who had a child in their teens by only a quarter (Mayer 1997: 144-5). In her 2002 review, Mayer concludes that ‘when family background effects are controlled for…. the residual effects [of parental income] are generally small to modest on most outcomes’ (p6). Results from the UK also display these smaller ‘residual effects’. Ermisch et al. (2001) find no significant direct impact of poverty on the probability of staying on at school after the minimum leaving age when controlling for other factors.13 Gregg and Machin (2001) conclude that the reduction in male earnings at age 33 associated with financial difficulty during childhood is halved when allowance is made for the impact of parents’ education and the child’s own characteristics at age 7 (including early learning).14
One would expect the impact of prolonged poverty during childhood to be larger than that of a short spell of low income and Mayer argues in her 2002 review that this is confirmed by almost all research that looks at the issue. The longer a family stays poor the harder it is to sustain expenditures through debt and savings on a range of goods and services which are important to children’s development. This provides one motivation for studies that simply look at the length of time that children spend in poverty without linking it to the impact on current or future outcomes. About two-thirds of children in the bottom fifth of the income distribution in one year are still there the next year in the US, the UK, Ireland and New Zealand (Bradbury et al. 2001 Table 4.4, Ballantyne et al. 2003 Table 8.4).15 Six per cent of all children in the UK and nine per cent in the US were in the bottom fifth in five consecutive years.
If low income per se is not the only factor to blame for the outcomes for poor children, then what is?
The other dimensions of childhood deprivation touched on in Section 2 are one possibility. Poorly educated children do worse in later life. This is hardly surprising as far as income in adulthood is concerned – it is the clear prediction from the voluminous economic literature on the returns to schooling. The causal impact of additional schooling is certainly debated but few would deny that a substantial part of the simple correlation between low levels of education and low adult income reflects causality – certainly if the
13
Although they find it does reduce success in public exams at age 16. See also Micklewright (1989) who uses the 1958 birth cohort data to look at the effect of income on the school leaving probability, with and without controls for ability. 14
There is some evidence too that the impact of low income may vary with the stage of childhood. See Ermisch et al. (2001) on the UK and Mayer (2002) for a review of evidence from the US. 15
Definition of poverty in all countries as in Table 1.
9
measure of education is based as in Table 1 on what people know rather than just time spent in school.16
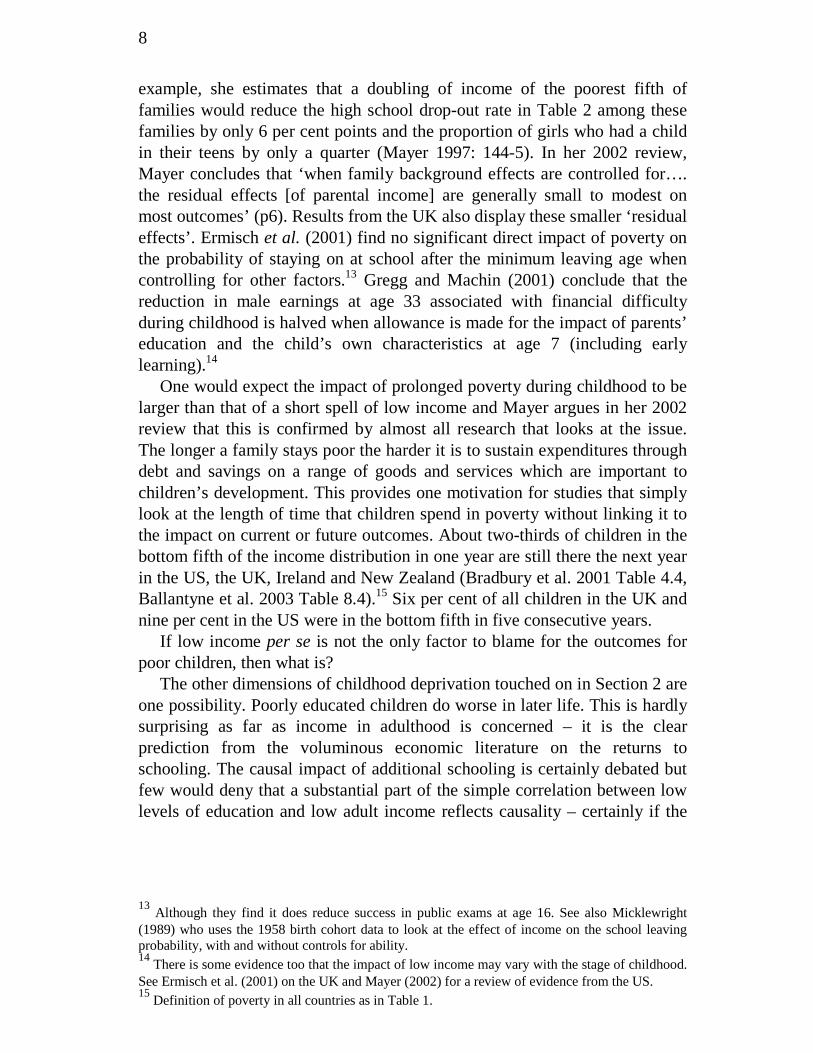
Table 4 shows the association of teenage motherhood with later life outcomes, comparing the situation in the UK and Ireland with the average for continental European countries. In both these English-speaking countries (especially in the UK), former teen mothers are markedly more likely than women who first gave birth in their 20s not to be in work and to be in the bottom fifth of the income distribution. But the figures for the continental European countries are also striking. Teenage motherhood is much less common here, as noted in Section 2, but it is still the case that former teen mothers in Continental Europe fare much less well on average in later life – for example they are twice as likely to be in the bottom fifth of the income distribution. The figures display considerable variation from country to country – the table shows the situation in France to be very similar to that in the UK where the teen birth rate is three times higher – but the differences are always in the same direction.
Table 4: Teenage motherhood and later outcomes
Not in work (%)
In poorest fifth of household income (%)
Age when first child born Age when first child born
15-19 20-29 difference 15-19 20-29 difference
UK 61 37 +24 53 23 +30
Ireland 69 51 +18 41 23 +18
Continental EU
53 39 +14 40 19 +21
France 61 35 +26 51 18 +33
Source: Berthould and Robson (2001, Appendix 1). ECHP data. Income equivalised with the OECD scale. The table shows the situation when women were interviewed in ECHP, on average 8 years after their first child was born.
The associations in Table 4, like those for low income in Tables 2 and 3, may in part reflect a causal relationship. But they also reflect the fact that teenagers who become mothers are different from other teenagers. The causal impact of becoming a mother while a teenager on later life outcomes is likely to be a lot less than the association shown in Table 4.
The extent of the causality running from low income, teen motherhood or some other dimension of child well-being to future outcomes clearly matters a great deal for the design of policy. For example, will greater income transfers 16
Blau and Kahn (2001) find that an increase in test scores equal to half of the international standard deviation in the International Adult Literacy Survey was associated with a 22 per cent increase in earnings in Canada and a 26 per cent increase in the USA (results without controls for levels of educational attainment).
10
to families in poverty have much effect on outcomes for children or will they just increase current living standards of the poor (a reasonable goal in itself but a different goal)? However, given an appropriate political climate, I think that the simple correlations of the type in Tables 2 to 4 are powerful in their own right. They can generate concern among policy makers over the fate of poor children and can help move child poverty up the policy agenda. The same is true for figures on the length of time children stay poor. Simply establishing the facts, irrespective of the outcomes, may stimulate interest in child poverty as a policy issue. The dynamic view of poverty, with its emphasis on movements in and out of low income, also has implications for design of anti-poverty policy, as will be made clear in Section 5.
4. Expenditures on Families: Cross-National Pictures
This section provides some background to my discussion of policy in individual countries by looking at summary measures of the degree of generosity of government social expenditures towards families. As in Section 2, the focus is on broad cross-national comparisons, on seeing how the situation in English-speaking countries lines up against that elsewhere.17
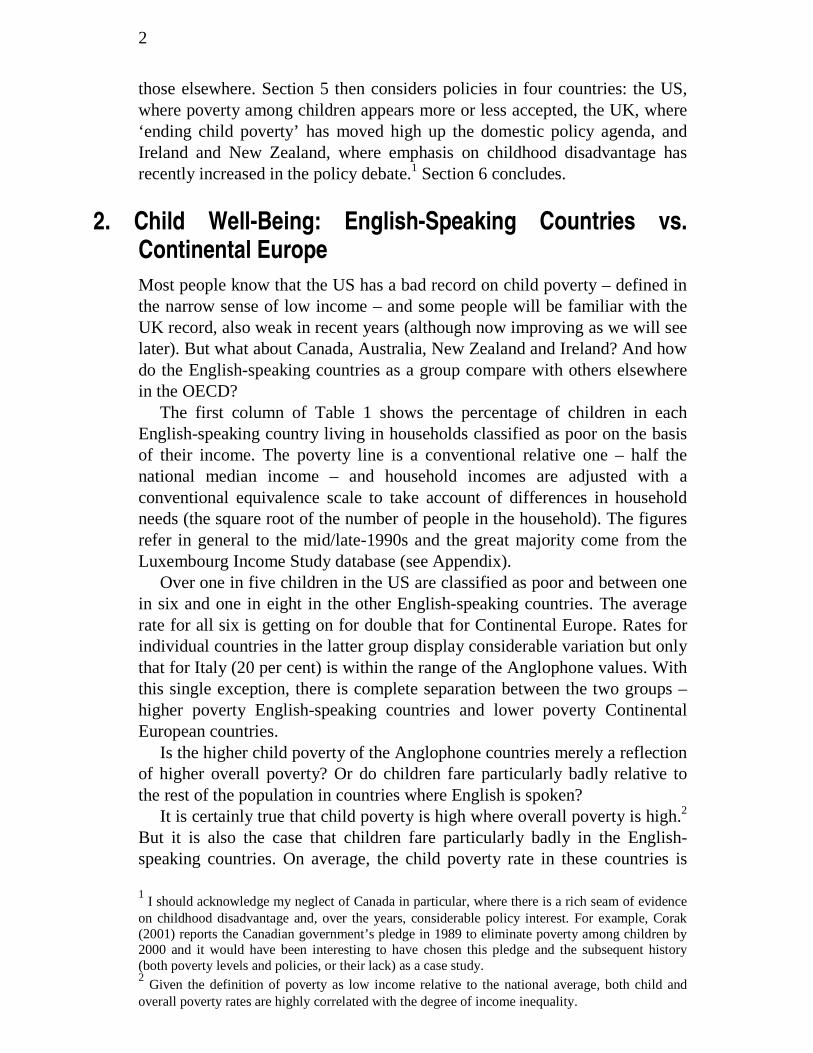
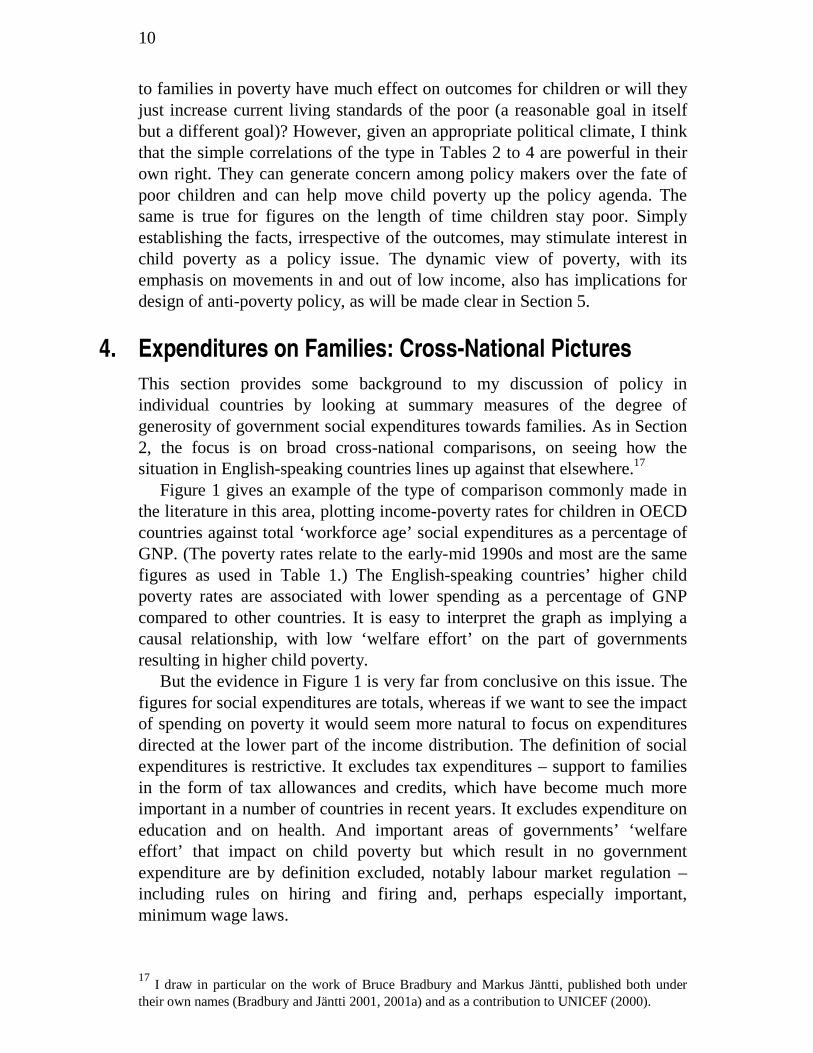
Figure 1 gives an example of the type of comparison commonly made in the literature in this area, plotting income-poverty rates for children in OECD countries against total ‘workforce age’ social expenditures as a percentage of GNP. (The poverty rates relate to the early-mid 1990s and most are the same figures as used in Table 1.) The English-speaking countries’ higher child poverty rates are associated with lower spending as a percentage of GNP compared to other countries. It is easy to interpret the graph as implying a causal relationship, with low ‘welfare effort’ on the part of governments resulting in higher child poverty.
But the evidence in Figure 1 is very far from conclusive on this issue. The figures for social expenditures are totals, whereas if we want to see the impact of spending on poverty it would seem more natural to focus on expenditures directed at the lower part of the income distribution. The definition of social expenditures is restrictive. It excludes tax expenditures – support to families in the form of tax allowances and credits, which have become much more important in a number of countries in recent years. It excludes expenditure on education and on health. And important areas of governments’ ‘welfare effort’ that impact on child poverty but which result in no government expenditure are by definition excluded, notably labour market regulation – including rules on hiring and firing and, perhaps especially important, minimum wage laws.
17
I draw in particular on the work of Bruce Bradbury and Markus Jäntti, published both under their own names (Bradbury and Jäntti 2001, 2001a) and as a contribution to UNICEF (2000).
11
Figure 1: Child poverty and workforce age social expenditures
Source: UNICEF (2000, Figure 10). Workforce age social expenditures exclude education and health (and refer to 1995).
Some of these objections can be dealt with, thus refining the analysis (although none of the refinements are without problems). One route that has been followed by various authors is to look at how income-poverty rates in household survey data are altered by the application of the tax and benefit system (e.g. UNICEF 2000, Figure 9). This has the advantage of accounting for tax allowances and credits and of summarising the direct impact of the tax and benefit system on each household. But the apparent ‘market income’ poverty rates prior to the application of the tax and benefit system do not reflect the impact of the government on the market outcomes – as in minimum wage law or childcare subsidies – as well as being a counter-factual that would never occur in the absence of the tax and transfer system. (Both demand and supply of labour would be different if there were no taxes and transfers.) Another route would be to bring the education and health expenditures into the definition of social expenditures.18
18
In 1999, public expenditure on education (primary, secondary and post-secondary non-tertiary) as a per cent of GDP averaged exactly the same in the six English-speaking countries and continental Europe (continental EU plus Norway): 3.6 per cent. (OECD, Education at a Glance 2002, Table B2.1b). And public health expenditure was almost the same: 5.9 per cent and 6.1 per cent of GDP respectively (OECD, Health Data 2002, Table 12). France comes above average on both counts – 4.1 per cent of GDP on education (defined as above) and 7.1 per cent on health.
U SA
ITAU K
IR ECAN
AUSGRE
SPAJPNGER
FRA N LD
DENLUX
BEL FIN
NOR
SWE
0
5
10
15
20
25
0 5 10 15 20 25
soc ial ex penditures (% of GNP)
ch
ild p
ov
ert
y (
%)
12
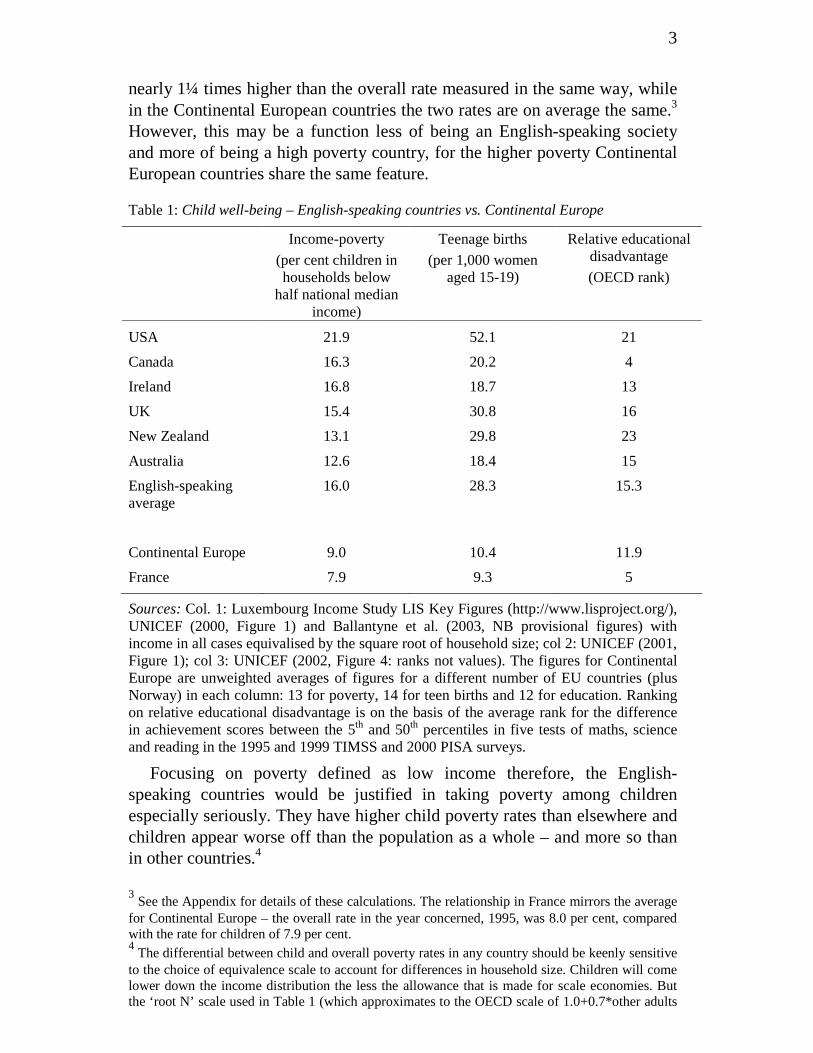
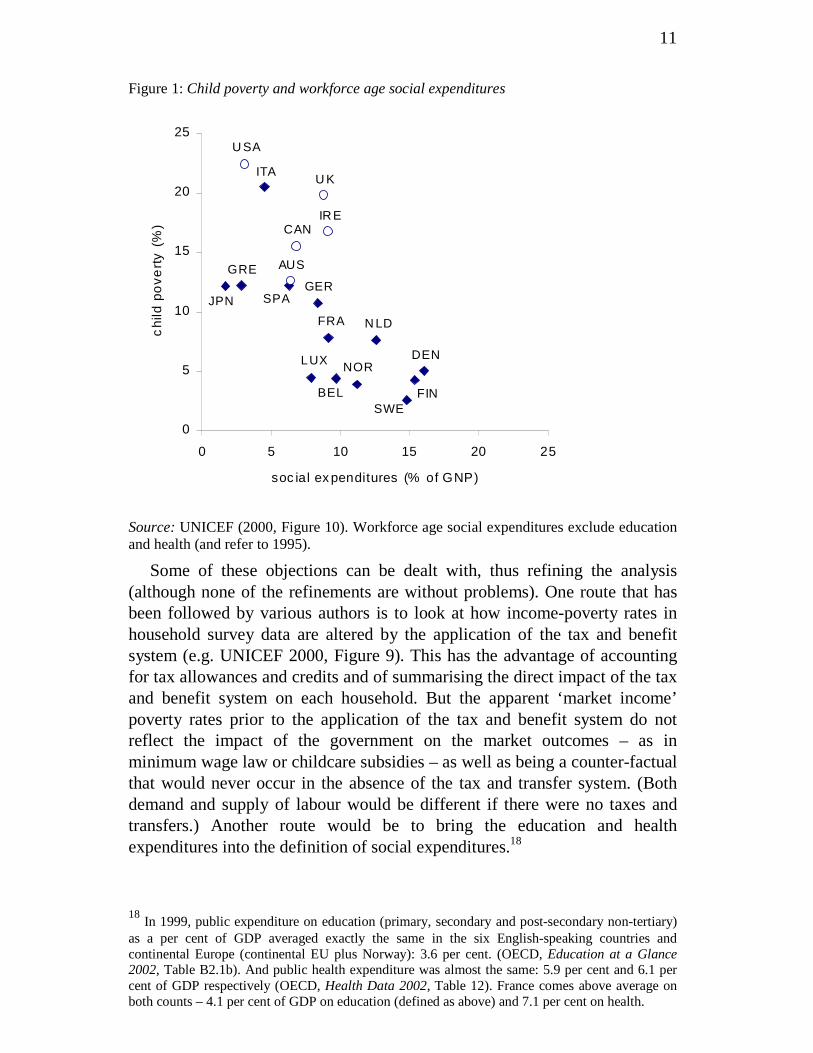
Figure 2 draws on a recent attempt to measure a broad package of family benefits in 22 countries for hypothetical families. The full package includes cash benefits, the impact of the tax system, support for housing expenditures, and the net costs (after allowance for free school meals, reimbursement of health expenditures etc.) to families of their children’s education and health (assuming for example one visit to the dentist per year). The set of calculations I have chosen for the graph refer to families with one earner on half average earnings, i.e. to families well down in the earnings distribution. The situation shown is that in July 2001. The figures therefore reflect a number of recent policy developments in the English-speaking countries (and elsewhere too), unlike those for social expenditures in Figure 1 which refer to 1995.
Figure 2: The family benefit package for families on half-average earnings
Source: Bradshaw and Finch (2002, Table G.6).
The horizontal axis shows the estimated value of the family benefits ‘package’ taking into account only explicit family benefits (both universal and income-tested) and the tax system. The vertical axis shows the value of the full package, taking into account housing support and the other elements listed above. On both axes the value of the package is shown as a percentage of national average earnings.
GRE
SPA
SWE
NLD
POR
DEN
FRA
LUX
GER
BEL
FIN
ITA
CAN
NOR
NZ
OST
AUS
USAUK
IRE
-5
0
5
10
15
20
25
0 5 10 15 20 25 30
cash and tax benefits (% of average earnings).
tota
l fam
ily b
enef
it pa
ckag
e (%
of a
vg. e
arni
ngs)
13
The picture of differences across the industrialized nations may come as a surprise, and appears to contrast with that in Figure 1. In terms of support through cash benefits and the tax system – the horizontal axis – the English-speaking countries occupy six of the top eight places and all of the top four. The USA, a country that is usually seen as very ungenerous towards those on low incomes, comes as high as third in this generosity league. The position changes somewhat when other elements of the package are taken into account on the vertical axis. New Zealand and Canada drop back considerably but the other four English-speaking countries are still in the top seven.
But two points need to be borne in mind when sizing up these results. First, the hypothetical families behind the calculations in Figure 2 are not representative of all those on low incomes. For example, they refer to families with someone in work. In fact, calculations of the package for a hypothetical family on social assistance still show most of the English-speaking countries in quite a favourable light although the US falls back sharply in the rankings, emphasising the contrasting levels of support to those in and out of work in this country.19
Second, generosity in Figure 2 is measured as the value of a benefit package in relation to average earnings. If generosity in these terms is higher where earnings inequality is higher – where low earners are further behind the average than elsewhere – then the greater generosity may be insufficient to prevent higher poverty (defined in relative income terms).
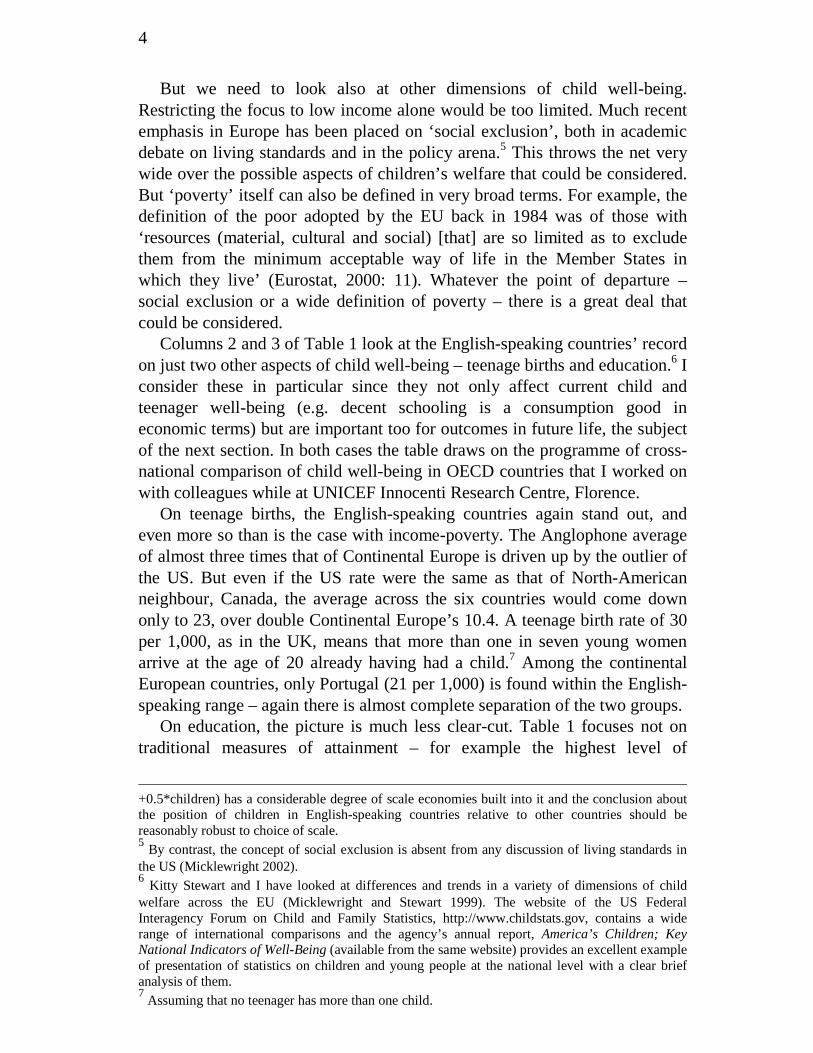
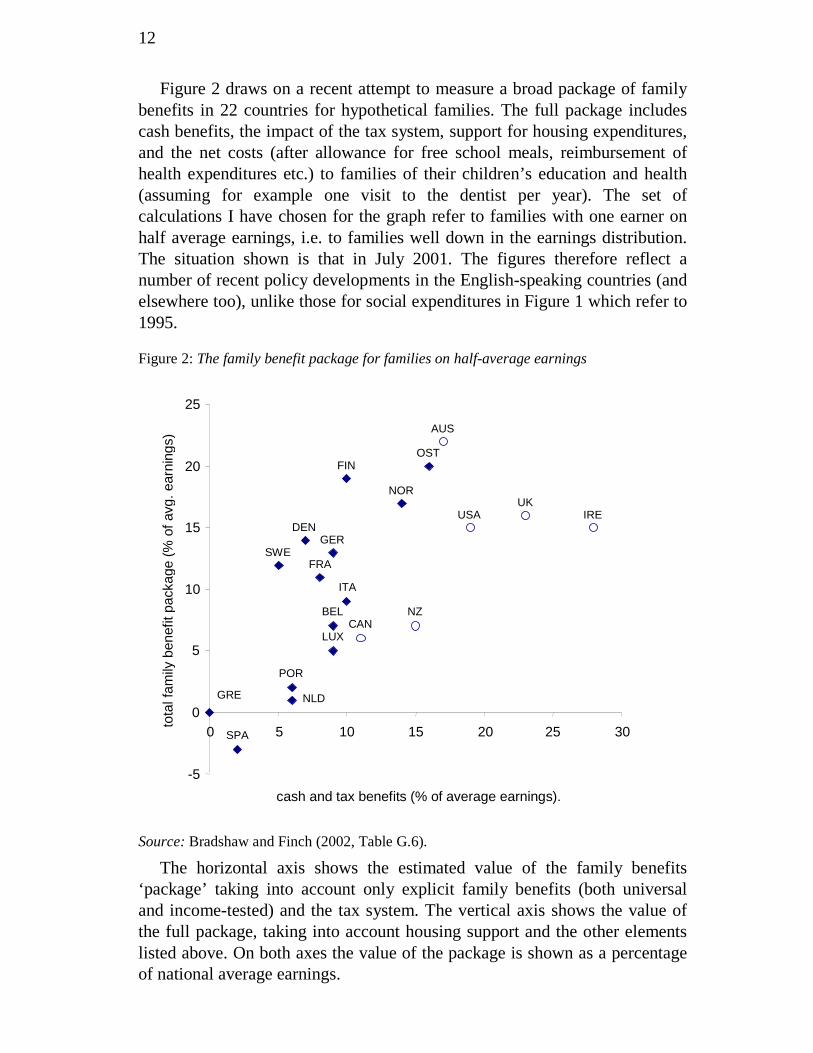
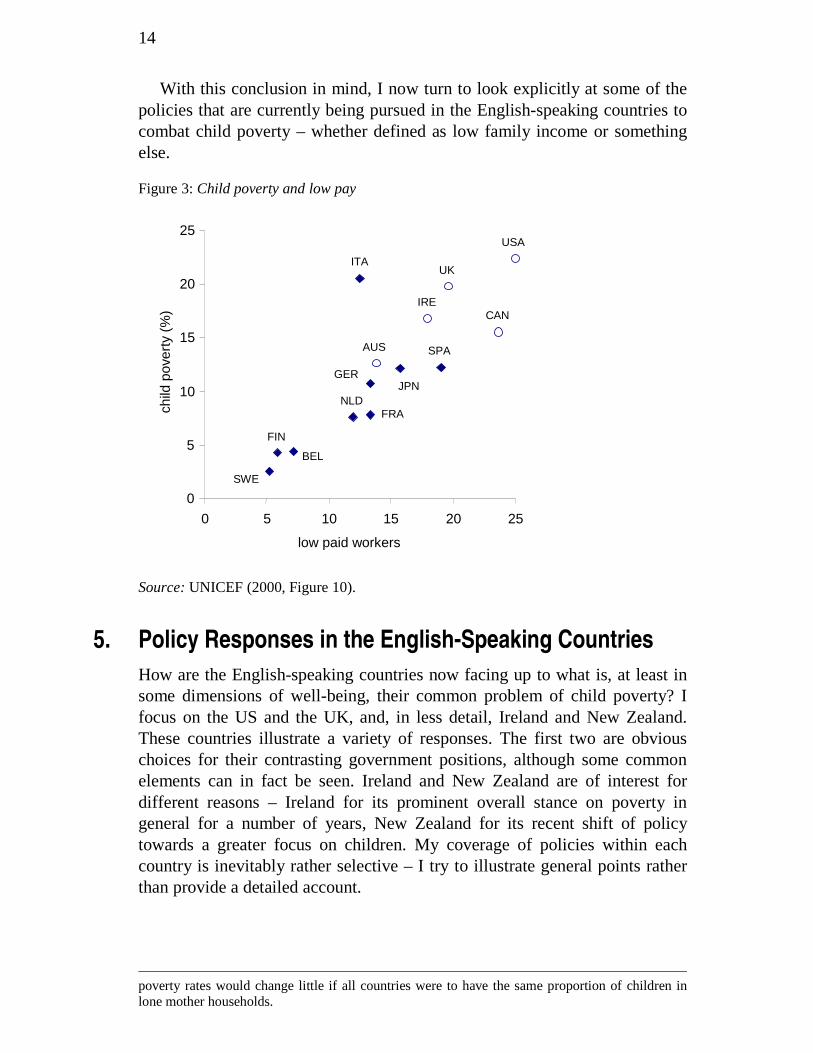
Figure 3 sheds some light on this, comparing child poverty rates with the percentage of full-time workers on low pay, taken as earnings beneath two-thirds of the national median. The English-speaking countries do indeed have much higher than average low pay rates, reflecting their wider distributions of earnings.
Which gives a better guide to the source of the English-speaking countries’ higher child poverty, Figure 1 or Figure 3? Should we be pointing the finger at low social expenditures or at the labour market incomes of those at the bottom of the income distribution, whether affected by low pay or lack of work? Having carefully analysed the composition of incomes of low-income families in industrialized countries, Bradbury and Jäntti come down in favour of the latter:
“We find that market incomes play a larger role than state transfers in accounting for the cross-national diversity of outcomes for disadvantaged children. The English-speaking countries other than the USA, for example, actually provide quite substantial income transfers to their most needy children. The living standards of these children, however, remain relatively low because of low labour-market incomes” (Bradbury and Jäntti 2001: 88).20
19
Bradshaw and Finch (2002, Table G.4). 20
One canard that Bradbury and Jäntti lay to rest is that the differences in child poverty across countries are due to differences in the prevalence of lone motherhood. They show that overall child
14
With this conclusion in mind, I now turn to look explicitly at some of the policies that are currently being pursued in the English-speaking countries to combat child poverty – whether defined as low family income or something else.
Figure 3: Child poverty and low pay
Source: UNICEF (2000, Figure 10).
5. Policy Responses in the English-Speaking Countries
How are the English-speaking countries now facing up to what is, at least in some dimensions of well-being, their common problem of child poverty? I focus on the US and the UK, and, in less detail, Ireland and New Zealand. These countries illustrate a variety of responses. The first two are obvious choices for their contrasting government positions, although some common elements can in fact be seen. Ireland and New Zealand are of interest for different reasons – Ireland for its prominent overall stance on poverty in general for a number of years, New Zealand for its recent shift of policy towards a greater focus on children. My coverage of policies within each country is inevitably rather selective – I try to illustrate general points rather than provide a detailed account.
poverty rates would change little if all countries were to have the same proportion of children in lone mother households.
USA
ITAUK
IRECAN
AUS SPA
JPNGER
FRANLD
BEL
FIN
SWE
0
5
10
15
20
25
0 5 10 15 20 25
low paid workers(%)
child
pov
erty
(%
)
15
� The US The US has long had a high rate of income-poverty among children compared to other OECD countries when poverty is measured with the same ‘relative’ definition in each country, as in Table 1. And the official US poverty rate for children, using the Census Bureau’s ‘absolute’ poverty line, has exceeded 15 per cent in almost every year since calculations were first made in the 1960s (and has reached 20 per cent in 14 of the last 20 years).21 Other indicators of childhood deprivation persistently show America in a poor light, as illustrated in Section 2. Although the rhetoric of government legislation might sometimes suggest otherwise (as in the No Child Left Behind Act of 2001, which was concerned with education), reducing child poverty does not seem a key part of federal government policy.
Danziger (2003) argues that in this respect the American people get the policies that they wish to see. Opinion poll evidence shows that Americans have a lower aversion to poverty than Europeans and less desire for redistributive policies that reduce income inequality. While on average 71 per cent of people in seven EU countries in a 1999 survey agreed with the statement that it is the responsibility of government to reduce differences in incomes, this was true of only 35 per cent of Americans (Redmond et al. 2002, Table 5).22
This determines the form of policies to combat child poverty in the US, especially policy with respect to low family income which I focus on here. In particular, there is an emphasis on the responsibility of parents to improve their own lot and that of their families, with work being the way to do it. For example, the website of the Administration for Children and Families, the part of the Department of Health and Human Services responsible for federal programmes that promote the well-being of children, notes as the first priority in its mission statement that its programmes aim to achieve ‘families and individuals empowered to increase their own economic independence and productivity’.23
The 1996 Personal Responsibility and Work Opportunity Reconciliation Act, passed into law with a high degree of bi-partisan support, has been the principal element of US anti-poverty policy in recent years – although reducing poverty was not an explicit aim of the legislation (Blank 2002: 1142). This is ‘welfare reform’, a radical change in federally-mandated means-tested assistance for families. The best known elements of the changes
21
See http://www.census.gov/hhes/poverty/histpov/hstpov3.html. US Census Bureau, Poverty in the United States: 2001, Table A-2, http://www.census.gov/prod/2002pubs/p60-219.pdf 22
These results are based on the International Social Survey Programme. The UK is one of the seven EU countries included and the figure here was 69 per cent. Interestingly, the other three English-speaking countries in the survey come between the EU average and the US – Canada, Australia and New Zealand are all at just under 50 per cent. 23
http://www.acf.dhhs.gov/acf_about.html#mission
16
are limits to the length of time support can be received, the obligation to work in return for benefit (not necessarily immediate), and the devolution to the States of enormous freedom in design and operation of their welfare schemes. Indeed, the combination of this hand-over and the existing powers in many areas of life possessed by the States means that arguably it makes little sense to talk of ‘the government policy’ towards child poverty in the US – it is the policies of 50 governments that need to be assessed.
A less well-known aspect of welfare reform, at least outside the US, is that along with the stick applied to those out of work there have been sizeable carrots offered to those taking jobs. An earned income tax credit has been a key element and this helps explain the high level of support to a parent on low earnings shown for the US in Figure 2. Expanded funding for childcare is also an important part of the reforms.24
The drive for reform was clearly influenced by the evidence on the dynamics of poverty referred to in Section 3 and, perhaps even more important, by evidence on the dynamics of benefit receipt. Increasing awareness of the existence of long periods on benefit and long spells of poverty has provoked policy makers to ‘think longitudinally’. This has changed the view of the appropriate policy response from one of providing more income to the current poor to one of how to move people out of poverty – or at least off benefit – and how to prevent them entering in the first place (Aber and Ellwood 2001).
Changes in the number of families on welfare have been dramatic, down by more than half over 1996-2002, from about 4.5 million to little more than 2 million.25 More disadvantaged parents do appear to be working. In particular, the single mother employment rate rose by 10 percentage points over 1994-99. However, jobs that welfare recipients exit to may be short-term and and/or pay wages that are insufficient to lift families out of poverty, especially when childcare costs are taken into account. The official child poverty rate fell by four percentage points over 1996-2001, meaning that about 2.5 million children were removed from poverty. But how much of this was due to welfare reform and how much to a booming economy in most of the period is unclear. The impact on dimensions of children’s well-being other than their families’ incomes, such as their health, is also unclear.26
If family incomes were not to have risen much as a result of the reforms does this mean that the policy would have failed? Not if the main purpose has been simply one of shifting families off means-tested benefit and into jobs so as to change attitudes towards both support from the state and work. Welfare 24
Ellwood (2000) provides a good account of the extent of the in-work incentives and Blank (2002) reviews the now extensive literature on the effects of welfare reform on the numbers of recipients, labour supply and poverty. I draw on some of her findings in the text. 25
http://www.acf.hhs.gov/news/stats/newstat2.shtml 26
Blank (2002) briefly reviews some evidence on this, including the detailed analysis by Duncan and Chase-Lansdale (2001) who consider inter alia the impact on children of different ages.
17
reform, the federal administration argues, has ‘shattered the culture of dependency that the old welfare program created and replaced it with a new spirit of independence that will benefit families for generations for come’.27 Viewed in this way, child poverty is reduced in the long-term by the creation of a better work ethic among poor parents and the transmission of that ethic to their children through the example of seeing their parents work.
Policy changes along exactly the same lines in Europe and other OECD countries seem very unlikely. In part this is due to greater preferences for redistribution to the poor, in part to the different institutional settings, different labour markets and different demography. But we may learn from some aspects of the US experience. First, the dynamic perspective on both the problem of income-poverty and the policy response. Second, the need for work-based solutions to provide incentives to take work and to enable work to be taken e.g. via subsidised childcare. Third, the necessity of adequate consideration for the fate of those who cannot work or who cannot find work. Fourth, a need to collect appropriate data to evaluate the impact of policy reform and the use of a variety of methods of doing so, areas in which the US can be said to lead the field.
� The UK In contrast to the US, a reduction in child poverty has been an explicit aim of the Labour government’s domestic policy agenda in the UK in recent years. In fact, the commitment is not just to reduction – it is to elimination. Prime Minister Blair has vowed to end child poverty within 20 years (Blair 1999) and ‘halving child poverty within a decade, and eliminating it in a generation’ is now an official policy objective.28 The importance of this task within the government’s priorities is illustrated by the prominent role taken by Chancellor of the Exchequer Brown, who has famously labelled child poverty ‘a scar on the nation’s soul’. Reducing child poverty is not something to be left just for the ‘social’ ministries.
Although an emphasis on child poverty is notable, it forms only part of an anti-poverty strategy that has been developed by the Labour government since taking power from the Conservatives in 1997. Poverty had not been a policy concern for a long time (even the term ‘poverty’ was avoided by the Conservative administrations of the previous 18 years). Nevertheless, children are very high on the agenda and are frequently the chosen entry-point into the debate on the extent or impact of disadvantage in the opening paragraphs of
27
Department of Health and Human Services Secretary Tommy Thompson, 13 February 2003 (http://www.acf.dhhs.gov/news/press/2003/release_021303.html). Danziger (2003) cites 2001 opinion poll evidence that shows three-quarters of Americans who know there has been a change in legislation believe that people who leave the welfare rolls are still poor. 28
For example, this is second of four key objectives of the Department of Work and Pensions, (http://www.dwp.gov.uk/aboutus/index.htm#objectives).
18
government reports. International comparisons of income-poverty of the type in Table 1 are regularly referred to by the government to illustrate the situation it ‘inherited’. The large rise in income-poverty among children since Labour had previously been in power is also often noted – child poverty measured as in Table 1 was only 9 per cent in 1979 but had risen to 20 per cent by 1995.29
Not surprisingly therefore, children are prominently mentioned in the government’s presentation of the reasons for its anti-poverty strategy (Department of Work and Pensions 2002: 5). This stresses both the instrumental and the distributive aims noted in Section 1, and cites associations between childhood disadvantage and future outcomes of the sort described in Section 3.
Income-poverty, whether among children or the population as a whole, is far from being the exclusive focus. The stress is on disadvantage in all its facets – income, education, health, neighbourhood etc. Both ‘poverty’ and ‘social exclusion’ are used to label that disadvantage, at times interchangeably. (The same statistics seem to be treated as measures of poverty in one government report and of exclusion in another.) An annual report on poverty and social exclusion, Opportunity for All defines the government’s view of the problem, the evidence for its importance, the policies being put in place to confront the situation, and progress achieved on a range of indicators.30 There are separate indicators for children and young people, people of working age, the elderly, and communities. The topics covered by the children and young people’s indicators include income-poverty, conceptions among girls aged under 18, educational qualifications at various ages, truancy, infant mortality, serious injuries, smoking, and child protection registrations.
As a result, the policy responses to child poverty range across many different areas of government activity. There are programmes to reduce teenage pregnancy, to improve schools (especially in disadvantaged areas), to extend pre-school education (the aim is provision for all three year olds by mid-2004), to reduce juvenile crime and so on. Much new research has been commissioned on the nature of childhood disadvantage and on possible solutions.31 There is now a Cabinet committee on children and young people's services, a Minister for Young People, and a Children and Young People's Unit aimed at co-ordinating policies across different government
29
Source as for Table 1. 30
Opportunity for All is published by the Department for Work and Pensions. The fourth report from September 2002 is available from http://www.dwp.gov.uk/publications/dwp/2002/oppal-fourth/index.htm. 31
For example, see recent Department of Work and Pensions research reports (http://www.dwp.gov.uk/asd/asd5/rrs-index.html) and other work referenced in the annual poverty report.
19
departments.32 An overall Strategy for Children and Young People is in the making.
Among the many goals, a reduction of income-poverty among children remains a key preoccupation. To be fair, this is probably due to a belief that it is vital to the success of the whole enterprise – that low income in childhood does have a sizeable casual impact on child and later adult outcomes. But it is also the case that a large reduction in the number of children in low income households will remain the criterion on which success or failure to combat child poverty will be judged by many people.33 Key features of policy here have included the introduction of a national minimum wage for the first time in the UK, increases in child benefits, and the introduction of child tax credits, and help (but not compulsion) to lone parents to find work (including a large expansion in childcare funding). As Figure 2 shows, the UK was second only to Ireland in 2001 in the level of support given via the tax and transfer system to a hypothetical family on half average earnings.
As these changes suggest, policy on income-poverty among families has a clear emphasis on promoting work. The aim is ‘to provide people with a “hand-up” not a “hand-out”… we are creating an active welfare state focused on giving people the opportunities they need to support themselves, principally through work’ (Blair 1999: 17-18). This is very similar to the declared aims of US anti-poverty policy. The American experience, including the emphasis on poverty dynamics, has undoubtedly had some influence. But the support for those not in work in the UK remains much stronger for the time-being. For example there is still no time-limiting of income-tested benefits.
And the impact so far? In many areas of policy it is still too early to tell. The annual poverty report gives year on year changes in each indicator of child and young people’s well-being but it will be some time before it is clear whether lasting reductions in levels of disadvantage have been achieved, and even longer before any evidence on future outcomes can be seen.
The clearest evidence concerns income-poverty. Tax-benefit model simulations with representative samples of household survey data show that policy measures taken between 1996/7 and 2003/4 will have resulted in over a million fewer children being below a conventional relative income poverty line than would otherwise have been the case (Piachaud and Sutherland 2002). This seems a major success, implying a reduction in the child poverty rate of about one-third. But it is a ceteris paribus calculation, while in reality other things do change. These include the poverty threshold, which rises as 32
See http://www.cypu.gov.uk/corporate/index.cfm. 33
It is worth noting that an official definition of ‘child poverty’ is currently under consideration – see Measuring Child Poverty: A Consultation Document and Preliminary Conclusions: Measuring Child Poverty Consultation (http://www.dwp.gov.uk/consultations/consult/2003/childpov). It seems possible that this may result in a measure that differs from the standard-income poverty one that the official target of elimination has been interpreted as applying to.
20
median incomes rise. Piachaud and Sutherland conclude that if the government is to remain on track to halve child poverty by 2010 then substantial further policy measures or rises in employment will be needed. And as in their earlier work, specifically focused on the position of children (Piachaud and Sutherland 2000), they point to the limitations of a strategy based on work-based solutions and to the effect of holding benefit levels for those without work well below the poverty threshold.
� Ireland Policies to reduce child poverty in Ireland form part of the country’s National Anti-Poverty Strategy (NAPS), launched in 1997 as a response to the 1995 UN World Summit for Social Development. NAPS has already survived a change of government and thus seems a well-established part of Irish life.
The original focus of NAPS was the reduction of poverty through a lowering of unemployment, which had reached disturbingly high levels. Income poverty among children was implicitly targeted through this focus, unemployment striking hard at families with children. Nolan (2001) shows there to have been a large rise in income poverty among children from the mid-1970s, as in the UK. But as unemployment receded during the Irish boom of the second half of the 1990s, children came to occupy a more explicit position in the Strategy.
Poverty in the NAPS has always been defined in broad terms. The official wording is similar to the 1984 EU definition noted in Section 2, and much wider than a focus on low income alone.34 And as in the UK, social exclusion is seen as the near neighbour of poverty – the first sentence of the NAPS refers to tackling both. As a result, Ireland has been well placed in the preparation of the National Action Plan for poverty and social inclusion (NAPincl) that all EU members now produce as part of the open-method of coordination in the social field following the 2000 European Council in Lisbon. Children are listed prominently as a ‘vulnerable group’ in both the revised NAPS and the NAPincl.
The revised NAPS, produced in 2002, contains several explicit targets for the well-being of children and young people for the five years to 2007.35 These range across different dimensions of living standards and include a reduction in the number of children who are ‘consistently poor’ below 2 per cent, a reduction by 10 per cent in the gap in low birth weight rates between the lowest and highest socio-economic groups, and a reduction in early school-leaving so that the percentage of those completing upper secondary
34
The NAPS definition is that ‘people are living in poverty if their income and resources (material, cultural and social) are so inadequate as to preclude them from having a standard of living which is regarded as acceptable by Irish society generally’. 35
Nolan (2001a) writes persuasively from the Irish experience on the value of setting explicit targets for poverty reduction.
21
school will rise to 90 per cent. A separate ‘consistent poverty’ target for children is a novelty in the revised NAPS as the first Strategy did not single children out in this way (although the same 2 per cent target is set for the whole population). ‘Consistent poverty’ is defined in the NAPS as being a household that has low income and which suffers an enforced absence of basic items considered essential by most people. (The 2 per cent goal may seem dramatic given the Irish figure in Table 1 but child poverty on the ‘consistent’ definition was already only 8 per cent in 2000.)
How is all this to be achieved? Policies include substantial increases in recent years in universal child benefit (by a factor of about 2½).36 Some of this came after the June 2001 date for the information in Figure 2, which shows Ireland to have had the most generous package of cash and tax benefits for a hypothetical low earner at that time. Continued emphasis on supporting childcare will help promote female employment – another explicit revised NAPS target – and hence family incomes. The 1998 Commission on the Family had noted the almost complete lack of public funding in Ireland of pre-school childcare.37 A National Children’s Strategy, introduced in 2002 (and Ireland’s first), provides a coordinating framework, with goals shaped by the language and aspirations of the UN Convention on the Rights of the Child. The new longitudinal survey of Irish children mentioned in Section 3 is one concrete product of the Strategy. Among the questions that could be asked about these policy initiatives is whether the money is there to fund them with the ending of the Irish economic boom.
� New Zealand The recent history of policy towards child poverty in New Zealand bears some similarities with that in the UK. Until recently, the issue of poor children was nowhere on the policy agenda. In the mid-1980s, the country had embarked on a radical programme of both macro and microeconomic reform. The reforms were dubbed ‘Rogernomics’ after Labour Finance Minister Roger Douglas who started the process and they were continued in the 1990s by the right-of-centre National Party. Such were the extent and speed of the changes, including widespread deregulation and privatisation, that the reforms attracted the attention of the international financial institutions as a possible model for both developed and developing countries (e.g. Bale and Dale 1998). The gap between rich and poor widened and income-poverty among children on the definition now used in New Zealand statistics more than doubled from 16 per cent in 1987/8 to 35 per cent in
36
I am grateful to Brian Nolan for this information. 37
Ireland has one of the lowest rates of enrolment of 3 year-olds in pre-schools in the OECD, around 5 per cent compared with France’s 100 per cent. However, the proportion of 0-3 year olds who use daycare facilities is almost 40 per cent, exceeding the figure in France (OECD 2001: Charts A9.1 and A9.2, 1998/99 data).
22
1992/3, falling back to 29 per cent in 1997/8 (Ministry of Social Development 2001: Table EC3.1).
In 1997, the Committee on the Rights of the Child, which oversees compliance with the UN Convention on the Rights of the Child, expressed concern that the reform process had squeezed budgetary resources available to support children and their families. It also recommended that the New Zealand government undertake a study of the impact on children of the reform process (Blaiklock et al. 2002).
Such a report was never produced, but in the meantime the policy agenda went through a sea-change. Both the Labour-Alliance government entering power in 1999 and its successor have paid much greater attention to children and to social issues. (The UK Labour government’s policies in these areas is said to be an important influence.) Concern with well-being in the population as a whole is illustrated by the institution of an annual Social Report to monitor trends in different aspects of living standards (with a commitment also to use international comparisons) and to help identify areas where action is needed (Ministry of Social Development 2001).
Attention to the situation of children has been crystallised in a strategy, ‘The Agenda for Children’, launched in June 2002 after a long period of consultation. This ambitious document is in part a vision of what life for children should be like in New Zealand, in part a set of principles to guide policy making towards children, and in part a programme of action. The Agenda addresses explicitly the issue of ‘Why focus on children and why now?’, arguing inter alia that ‘the well-being of children matters to us all. How well they do affects how we as a society do’.38
Although no target date is set or precise definition of poverty chosen, the Agenda notes the government’s intention to ‘end child poverty’, a central plank in the strategy. Measures to address low family incomes include changes to employment law and increases in minimum wages, improved access to childcare, paid parental leave and measures to smooth the transition from benefit receipt to work. But the Agenda addresses many aspects of child well-being other than family incomes, including health, education, teenage pregnancy and child abuse. As with the Irish National Children’s Strategy, aspects of the Agenda’s conception of childhood and the place of children in society seem heavily influenced by the UN Convention on the Rights of the Child.
The Agenda also makes clear that New Zealand’s knowledge base for action on childhood disadvantage is inadequate. New research is to be undertaken across a range of topics, including on the issues of family income dynamics and the impact of childhood poverty discussed in Section 3. (The 2002 review by Susan Mayer of the impact of parental income on child outcomes that I cite there was a report commissioned by the New Zealand 38
The Agenda is available at http://www.msd.govt.nz/agendaforchildren/public-report/index.html.
23
government.) The new household panel survey noted in Section 3 will be one resource to be drawn on in time. The Agenda also signals the government’s intention to consider a new longitudinal study focussed on children.
6. Conclusions
My conclusions are as follows. • The English-speaking countries have notably higher rates of income-
poverty among children than have Continental European countries on average. The same is true for teenage births. In terms of the scale of the problem measured in this simple way there is ample justification for the English-speaking countries to take child poverty especially seriously.
• Several countries have benefited from longitudinal survey evidence that shows how long children stay in poverty and the association between childhood poverty and later life outcomes (although there is debate on the extent to which these associations reflect causal links). In the right political climate, this evidence helps generate concern among policy makers over the fate of poor children, re-enforcing motivation for tackling child poverty both from a distributional perspective and for instrumental reasons.
• Countries that have had less of such data are busy collecting it now (Australia, New Zealand and Ireland).
• Cross-national evidence shows that most English-speaking countries have comparatively generous benefits for low-income families and that their higher rates of income-poverty among children are typically caused by lower labour market incomes at the bottom of the income distribution, not lower state transfers.
• A key element in the current US solution to income-poverty among children is to force families off income-tested benefit and to encourage and ease them into work. Other countries are also embracing the latter part of this solution but much less so the former (which in part aims to end a perceived ‘benefit dependency’ culture). The experience of both the US and the UK in recent years illustrates the limitations to work-based solutions to family income-poverty, underlining the role that benefits for those not employed should continue to play.
• The UK, Ireland and New Zealand all experienced large rises in poverty among children over the last two decades and all have explicitly committed themselves to tackling the problem, even so far as ‘eliminating’ child poverty. The UK has achieved significant reductions in the last few years but may have difficulty staying on track.
• All three of these countries view child poverty and disadvantage in very broad terms, with low income as only one dimension. Policy to confront
24
child poverty is therefore being developed along various different fronts and involves several different government departments.
• All three have recently instituted (or are finalising) wide-ranging ‘strategies’ for children intended both to help focus and co-ordinate policies to combat childhood disadvantage and to underline the prominence of children on the policy agenda. The Irish and New Zealand strategies have a strong human rights influence, reflecting the principles of the UN Convention on the Rights of the Child.
My final comment follows on from this last conclusion. One of the UN Convention’s principles is that children ‘should be heard’ – their views on issues that affect them should be known. This seems to me to fit well with the growing concern to collect evidence on the well-being of individuals within households and on the intra-household allocation of resources (Lundberg et al. 1997, Cantillon et al. 2003). Children’s opinions of their situation may both help increase policy-makers’ concern over child poverty (a number of government reports referred to in this paper cite children’s views) and may help indicate particular spheres of children’s lives where action is most needed (e.g. Daly and Leonard 2002, Ridge 2002).
25
Appendix: Sources of Income-Poverty Data The child poverty rates used in the first column of Table 1 are the most recent I could find that were available on a comparable basis for all countries (a poverty line of half-median income with the square root of household size used as an equivalence scale). The majority come from the Luxembourg Income Study LIS Key Figures (accessed from the LIS website on 11 June 2003). This was the source for three of the English-speaking countries (USA, UK and Canada with the data referring to 2000, 1999 and 1998 respectively). More recent rates than those in the LIS Key Figures were available from UNICEF (2000) for Ireland (1997) and Australia (1996-7). New Zealand is not in the LIS and was not covered by UNICEF (2000); I am grateful to Dave Maré for making available the estimate of child poverty in New Zealand (in 1997) on the same basis as the other countries that is in Ballantyne et al. (2003). The rates for the Continental European countries are all from the LIS Key Figures with the exception of that for Greece (not present in the LIS) which comes from UNICEF (2000). The average ratios of child to total poverty rates cited in the text used total poverty rates from the same sources and years, calculated on a comparable basis. In the cases of Ireland and Australia the most recent LIS rates for both child and total poverty were used (referring to 1996 and 1994 respectively) since the sources used for the child rates in Table 1 did not provide the total rates as well. The average ratio for the English-speaking countries is 1.22 and for the Continental European countries 1.1.
26
References Aber, L. and Ellwood, D. (2001), ‘Thinking About Children in Time’, in Bradbury,
B., Jenkins, S. J., and Micklewright, J. (eds.), The Dynamics of Child Poverty in Industrialised Countries. Cambridge: Cambridge University Press.
Bale, M. and Dale, T. (1998), ‘Public Sector Reform in New Zealand and its Relevance to Developing Countries’, The World Bank Research Observer. Washington, D.C.: The World Bank, Washington.
Ballantyne, S., Chapple, S., Maré, D., and Timmins, J. (2003), ‘Movements into and out of Child Poverty in New Zealand: Results from the Linked Income Supplement’. Wellington, NZ: Ministry of Social Policy. Mimeo.
Berthould, R. and Robson, K. (2001), ‘The Outcomes of Teenage Motherhood in Europe’, Innocenti Working Paper 86. Florence: UNICEF Innocenti Research Centre.
Blaiklock, A.J., Kiro, C.A., Belgrave, M., Low, W., Davenport, E. and Hassall, I.B. (2002), ‘When the Invisible Hand Rocks the Cradle: New Zealand Children in a Time of Change’, Innocenti Working Paper 93. Florence: UNICEF Innocenti Research Centre.
Blair, T. (1999), ‘Beveridge Revisited: a Welfare State for the 21st Century’, in Walker, R. (ed.), Ending Child Poverty. Bristol: The Policy Press.
Blank, R. (2002), ‘Evaluating Welfare Reform in the United States’, Journal of Economic Literature, December.
Blau, F. and Kahn, L. (2001) ‘Do Cognitive Test Scores Explain Higher US Wage Inequality?’ NBER Working Paper 8210.
Blum, A, Goldstein, H. and Guerin-Pace, F. (2001), ‘An Analysis of International Comparisons of Adult Literacy’, Assessment in Education, Vol. 8, No. 2.
Bradbury, B. and Jäntti, M. (2001), ‘Child Poverty Across 25 Countries’ in Bradbury, B., Jenkins, S. J., and Micklewright, J. (eds.), The Dynamics of Child Poverty in Industrialised Countries, Cambridge: Cambridge University Press.
Bradbury, B. and Jäntti, M. (2001a), ‘Child Poverty Across the Industrialised World: Evidence from the Luxembourg Income Study’ in Vleminckx, K. and Smeeding, T.M. (eds.) Child Well-Being, Child Poverty and Child Policy in Modern Nations. Bristol: The Policy Press.
Bradbury, B., Jenkins, S. J., and Micklewright, J. (eds.) (2001), The Dynamics of Child Poverty in Industrialised Countries. Cambridge: Cambridge University Press.
Bradshaw, J. and Finch, N. (2002), A Comparison of Child Benefit Packages in 22 Countries, UK Department for Work and Pensions Research Report 174. http://www.dwp.gov.uk/asd/asd5/rrs-index.html
27
Cantillon, S, Gannon, B. and Nolan, B. (2003), The Allocation of Resources Within Households: Learning from Non-Monetary Indicators. Dublin: ESRI. Mimeo.
Corak, M. (2001) ‘Are the Kids All Right? Intergenerational Mobility and Child Well-being in Canada’, in Banting, K., Sharpe, A., and St. Hilaire, F. (eds), The Review of Economic Performance and Social Progress, The Longest Decade; Canada in the 1990s. Montreal: McGill-Queen's Press, and Statistics Canada. Analytical Studies Branch research paper 171 http://www.statcan.ca/english/research/11F0019MIE/11F0019MIE2001171.pdf
Daly, M. and Leonard, M. (2002), Against All Odds: Family Life on a Low Income in Ireland. Dublin: Combat Poverty Agency.
Danziger, S. (2003), ‘After Welfare Reform and An Economic Boom: Why is Child Poverty So Much Higher in the US Than in Europe?’, in Bradshaw, J. (ed.), Children and Social Security. Aldershot, UK: Ashgate.
Department for Work and Pensions (2002), Opportunity for All, Fourth Annual Report, Cm 5598. London: The Stationery Office.
Duncan, G.J. and Brooks-Gunn, J. (eds.), 1997, Consequences of Growing up Poor, New York: Russell Sage Foundation.
Duncan, G. and Chase-Lansdale, L. (2001), ‘Welfare Reform and Child Well-Being’, Northwestern University/University of Chicago Joint Center for Poverty Research, Working Paper17. http://www.jcpr.org/wpfiles/duncan_lansdale_childwellbeing.pdf
Ellwood, D.T. (2000), ‘Anti-Poverty Policy for Families in the Next Century: From Welfare to Work – and Worries’, Journal of Economic Perspectives, 14(1):187-98.
Ermisch, J., Francesconi, M. and Pevalin, D. (2001), Outcomes for Children of Poverty, Department for Work and Pensions Research Report 158, http://www.dwp.gov.uk/asd/asd5/rrs-index.html
Eurostat (2000), European Social Statistics: Income, Poverty and Social Exclusion, Luxembourg: Office for Official Publications of the European Communities.
Gregg, P. and Machin, S. (1998), ‘Child Development and Success or Failure in the Youth Labour Market’, Centre for Economic Performance Discussion Paper 397. London: London School of Economics.
Gregg, P. and Machin, S., (2001), ‘Childhood Experiences, Educational Attainment and Adult Labour Market Performance’ in Vleminckx, K. and Smeeding, T. (eds.) Child Well-Being, Child Poverty and Child Policy in Modern Nations. Bristol: The Policy Press.
Haveman, R. and Wolfe, B. (1995), ‘The Determinants of Children’s Attainments: A Review of Methods and Findings’, Journal of Economic Literature, 33(4):1829-78.
Lundberg, S.J., Pollak, R.A. and Wales, T.J. (1997), ‘Do Husbands and Wives Pool Their Resources?’, Journal of Human Resources, 32: 463–80.
28
Mayer, S. (1997), What Income Can’t Buy: Family Income and Children’s Life Chances. Cambridge, MA: Harvard University Press.
Mayer, S. (2002), Parental Income and Children’s Outcomes, Ministry of Social Development, Wellington, NZ. http://www.msd.govt.nz/publications/docs/raisingchildreninnz.pdf.
Micklewright, J. (1989), ‘Choice at Sixteen’, Economica, February.
Micklewright, J. (2002), ‘Social Exclusion and Children: A European View for a US Debate’, Innocenti Working Paper 90. Florence: UNICEF Innocenti Research Centre.
Micklewright, J. and Stewart, K. (1999) ‘Is the Well-Being of Children Converging in the European Union?’, Economic Journal, November.
Ministry of Social Development (2001), The Social Report 2001, Wellington, New Zealand. http://www.msp.govt.nz/publications/social-report.html.
Nolan, B., (2001), ‘The Evolution of Child Poverty in Ireland’, in Vleminckx, K. and Smeeding, T.M. (eds.) Child Well-Being, Child Poverty and Child Policy in Modern Nations. Bristol: The Policy Press.
Nolan, B. (2001a), ‘Measuring and Targeting Poverty: the Irish Example’, in Indicators of Progress: A Discussion of Approaches to Monitor the Government’s Strategy to Tackle Poverty and Social Exclusion, Centre for the Analysis of Social Exclusion, CASEreport 13, London: London School of Economics.
OECD (2001), Society at a Glance. Paris: OECD.
Piachaud, D. and Sutherland, H. (2000), ‘How Effective is the British Government’s Attempt to Reduce Child Poverty?’, Innocenti Working Paper 77. Florence: UNICEF Innocenti Research Centre.
Piachaud, D. and Sutherland, H. (2002), ‘Changing Poverty Post-1997’, CASEpaper 63, Centre for Analysis of Social Exclusion. London: London School of Economics.
Redmond, G., Schnepf, S., and Suhrcke, M. (2002), ‘Attitudes to Inequality After Ten Years of Transition’, Innocenti Working Paper 88. Florence: UNICEF Innocenti Research Centre.
Ridge, T. (2002), Childhood Poverty and Social Exclusion: From a Child’s Perspective. Bristol: The Policy Press.
UNICEF (2000) A League Table of Child Poverty in Rich Nations, Innocenti Report Card 1. Florence: UNICEF Innocenti Research Centre. www.unicef-icdc.org/publications/pdf/repcard1e.pdf; NB. French version: / repcard1f. pdf
UNICEF (2001) A League Table of Teenage Births in Rich Nations, Innocenti Report Card 3. Florence: UNICEF Innocenti Research Centre. www.unicef-icdc.org/publications/pdf/repcard3e.pdf
UNICEF (2002), A League Table of Educational Disadvantage in Rich Nations, Innocenti Report Card 4. Florence: UNICEF Innocenti Research Centre. www.unicef-icdc.org/publications/pdf/repcard4e.pdf
29
Economic and Social Policy Series The papers in the series (ISSN 1014-7837) are all available in English. Papers EPS 63 onwards are available for download as .pdf files from the IRC web site (http://www.unicef-icdc.org). Individual copies are available from: Distribution Unit, UNICEF-IRC, Piazza SS. Annunziata 12, 50122 Florence, Italy (e-mail [email protected] - Fax +39 055-24-48-17).
EPS 1 Economic Decline and Child Survival: The Plight of Latin America in the Eighties. Teresa Albanez, Eduardo Bustelo, Giovanni Andrea Cornia and Eva Jespersen. (March 1989).
EPS 2 Child Poverty and Deprivation in Industrialized Countries: Recent Trends and Policy Options. Giovanni Andrea Cornia. (March 1990). Also available in French and Spanish.
EPS 3 Education, Skills and Industrial Development in the Structural Transformation of Africa. Sanjaya Lall. (July 1990).
EPS 4 Rural Differentiation, Poverty and Agricultural Crisis in Sub-Saharan Africa: Toward An Appropriate Policy Response. Giovanni Andrea Cornia and Richard Strickland. (July 1990).
EPS 5 Increased Aid Flows and Human Resource Development in Africa. Paul Mosley. (August 1990).
EPS 6 Child Poverty and Deprivation in Italy: 1950 to the Present. Chiara Saraceno. (September 1990). Also available in Italian.
EPS 7 Toward Structural Transformation with a Human Focus: The Economic Programmes and Policies of Zambia in the 1980s. Venkatesh Seshamani. (October 1990).
EPS 8 Child Poverty and Deprivation in the UK. Jonathan Bradshaw. (October 1990).
EPS 9 Adjustment Policies in Tanzania, 1981-1989: The Impact on Growth, Structure and Human Welfare. Jumanne H. Wagao. (October 1990).
EPS10 The Causes and Consequences of Child Poverty in the United States. Sheldon Danziger and Jonathan Stern. (November 1990).
EPS 11 The Fiscal System, Adjustment and the Poor. Giovanni Andrea Cornia and Frances Stewart. (November 1990).
EPS 12 The Health Sector and Social Policy Reform in the Philippines since 1985. Wilfredo G. Nuqui. (January 1991).
EPS 13 The Impact of Economic Crisis and Adjustment on Health Care in Mexico. Carlos Cruz Rivero, Rafael Lozano Ascencio and Julio Querol Vinagre. (February 1991).
EPS 14 Structural Adjustment, Growth and Welfare: The Case of Niger, 1982-1989. Kiari Liman-Tinguiri. (March 1991).
EPS 15 The Impact of Self-Imposed Adjustment: The Case of Burkina Faso, 1983-1989. Kimseyinga Savadogo and Claude Wetta. (April 1991).
30
EPS 16 Liberalization for Development: Zimbabwe’s Adjustment without the Fund. Robert Davies, David Sanders and Timothy Shaw. (May 1991).
EPS 17 Fiscal Shock, Wage Compression and Structural Reform: Mexican Adjustment and Educational Policy in the 1980s. Fernando Valerio. (June 1991).
EPS 18 Patterns of Government Expenditure in Developing Countries during the 1980s: The Impact on Social Services. Beth Ebel. (July 1991).
EPS 19 Ecuador: Crisis, Adjustment and Social Policy in the 1980s. The Ecuadorian Centre of Social Research. (August 1991).
EPS 20 Government Expenditures for Children and Their Families in Advanced Industrialized Countries, 1960-85. Sheila B. Kamerman and Alfred J. Kahn. (September 1991).
EPS 21 Is Adjustment Conducive to Long-term Development?: The Case of Africa in the 1980s. Giovanni Andrea Cornia. (October 1991).
EPS 22 Children in the Welfare State: Current Problems and Prospects in Sweden. Sven E. Olsson and Roland Spånt. (December 1991).
EPS 23 Eradicating Child Malnutrition: Thailand’s Health, Nutrition and Poverty Alleviation Policy in the 1980s. Thienchay Kiranandana and Kraisid Tontisirin. (January 1992).
EPS 24 Child Welfare and the Socialist Experiment: Social and Economic Trends in the USSR, 1950-90. Alexandr Riazantsev, Sándor Sipos and Oleg Labetsky. (February 1992).
EPS 25 Improving Nutrition in Tanzania in the 1980s: The Iringa Experience. Olivia Yambi and Raphael Mlolwa. (March 1992).
EPS 26 Growth, Income Distribution and Household Welfare in the Industrialized Countries since the First Oil Shock. Andrea Boltho. (April 1992).
EPS 27 Trends in the Structure and Stability of the Family from 1950 to the Present: The Impact on Child Welfare. Chiara Saraceno. (May 1992).
EPS 28 Child Poverty and Deprivation in Portugal: A National Case Study. Manuela Silva. (June 1992).
EPS 29 Poverty Measurement in Central and Eastern Europe before the Transition to the Market Economy. Sándor Sipos. (July 1992).
EPS 30 The Economics of Disarmament: Prospects, Problems and Policies for the Disarmament Dividend. Saadet Deger. (August 1992).
EPS 31 External Debt, Fiscal Drainage and Child Welfare: Trends and Policy Proposals. Stephany Griffith-Jones. (September 1992).
EPS 32 Social Policy and Child Poverty: Hungary since 1945. Júlia Szalai. (October 1992).
EPS 33 The Distributive Impact of Fiscal and Labour Market Policies: Chile’s 1990-91 Reforms. Mariana Schkolnik. (November 1992).
EPS 34 Changes in Health Care Financing and Health Status: The Case of China in the 1980s. Yu Dezhi. (December 1992).
31
EPS 35 Decentralization and Community Participation for Improving Access to Basic Services: An Empirical Approach. Housainou Taal. (January 1993).
EPS 36 Two Errors of Targeting. Giovanni Andrea Cornia and Frances Stewart. (March 1993).
EPS 37 Education and the Market: Which Parts of the Neoliberal Solution are Correct? Christopher Colclough. (July 1993).
EPS 38 Policy and Capital Market Constraints to the African Green Revolution: A Study of Maize and Sorghum Yields in Kenya, Malawi and Zimbabwe, 1960-91. Paul Mosley. (December 1993).
EPS 39 Tax Reforms and Equity in Latin America: A Review of the 1980s and Proposals for the 1990s. Ricardo Carciofi and Oscar Cetrángolo. (January 1994).
EPS 40 Macroeconomic Policy, Poverty Alleviation and Long-term Development: Latin America in the 1990s. Giovanni Andrea Cornia. (February 1994).
EPS 41 Réformes Fiscales, Génération de Ressources et Equité en Afrique Subsaharienne durant les Années 1980. Kiari Liman-Tinguiri. (March 1994).
EPS 42 Tax Reform and Equity in Asia: The Experience of the 1980s. Andrea Manuelli. (April 1994).
EPS 43 Family Support Policies in Transitional Economies: Challenges and Constraints. Gáspár Fajth. (August 1994).
EPS 44 Income Distribution, Poverty and Welfare in Transitional Economies: A Comparison between Eastern Europe and China. Giovanni Andrea Cornia. (October 1994).
EPS 45 Death in Transition: The Rise in the Death Rate in Russia since 1992. Jacob Nell and Kitty Stewart. (December 1994).
EPS 46 Child Well-being in Japan: The High Cost of Economic Success. Martha N. Ozawa and Shigemi Kono. (March 1995).
EPS 47 Ugly Facts and Fancy Theories: Children and Youth during the Transition. Giovanni Andrea Cornia. (April 1995).
EPS 48 East Joins West: Child Welfare and Market Reforms in the “Special Case” of the Former GDR. Bernhard Nauck and Magdalena Joos. (June 1995).
EPS 49 The Demographic Impact of Sudden Impoverishment: Eastern Europe during the 1989-94 Transition. Giovanni Andrea Cornia and Renato Paniccià. (July 1995).
EPS 50 Market Reforms and Social Welfare in the Czech Republic: A True Success Story? Miroslav Hiršl, Ji�í Rusnok and Martin Fassmann. (August 1995).
EPS 51 The Winding Road to the Market: Transition and the Situation of Children in Bulgaria. Theodora Ivanova Noncheva. (August 1995).
EPS 52 Child Institutionalization and Child Protection in Central and Eastern Europe. Mary Anne Burke. (September 1995).
32
EPS 53 Economic Transition in the Baltics: Independence, Market Reforms and Child Well-being in Lithuania. Romas Lazutka and Zita Sniukstiene. (September 1995).
EPS 54 Economic Reforms and Family Well-being in Belarus: Caught between Legacies and Prospects. Galina I. Gasyuk and Antonina P. Morova. (December 1995).
EPS 55 The Transition in Georgia: From Collapse to Optimism. Teimuraz Gogishvili, Joseph Gogodze and Amiran Tsakadze. (September 1996).
EPS 56 Children at Risk in Romania: Problems Old and New. Elena Zamfir and C�t�lin Zamfir. (September 1996).
EPS 57 Children in Difficult Circumstances in Poland. Stanislawa Golinowska, Bo�ena Balcerzak-Paradowska, Bo�ena Kołaczek and Dorota Głogosz. (December 1996).
EPS 58 The Implications of Exhausting Unemployment Insurance Entitlement in Hungary. John Micklewright and Gyula Nagy. (September 1997).
EPS 59 Are Intergovernmental Transfers in Russia Equalizing? Kitty Stewart. (September 1997).
EPS 60 Marital Splits and Income Changes: Evidence for Britain. Sarah Jarvis and Stephen P. Jenkins. (September 1997).
EPS 61 Decentralization: A Survey from a Child Welfare Perspective. Jeni Klugman. (September 1997).
EPS 62 Living Standards and Public Policy in Central Asia: What Can Be Learned from Child Anthropometry? Suraiya Ismail and John Micklewright. (November 1997).
EPS 63 Targeting Social Assistance in a Transition Economy: The Mahallas in Uzbekistan. Aline Coudouel, Sheila Marnie and John Micklewright. (August 1998).
EPS 64 Income Inequality and Mobility in Hungary, 1992-96. Péter Galasi, (August 1998).
EPS 65 Accounting for the Family: The Treatment of Marriage and Children in European Income Tax Systems. Cathal O’Donoghue and Holly Sutherland. (September 1998).
EPS 66 Child Poverty in Spain: What Can Be Said? Olga Cantó-Sánchez and Magda Mercader-Prats. (September 1998).
EPS 67 The Education of Children with Special Needs: Barriers and Opportunities in Central and Eastern Europe. Mel Ainscow and Memmenasha Haile-Giorgis. (September 1998).
EPS 68 EMU, Macroeconomics and Children. A.B. Atkinson. (December 1998).
EPS 69 Is Child Welfare Converging in the European Union? John Micklewright and Kitty Stewart. (May 1999).
EPS 70 Income Distribution, Economic Systems and Transition. John Flemming and John Micklewright. (May 1999).
33
EPS 71 Child Poverty across Industrialized Nations. Bruce Bradbury and Markus Jäntti. (September 1999).
EPS 72 Regional Monitoring of Child and Family Well-Being: UNICEF’s MONEE Project in CEE and the CIS in a Comparative Perspective. Gáspár Fajth (January 2000).
EPS 73 Macroeconomics and Data on Children. John Micklewright. (January 2000). Available as a .pdf file only from http://www.unicef-icdc.org
EPS 74 Education, Inequality and Transition. John Micklewright (January 2000). Available as a .pdf file only from http://www.unicef-icdc.org
EPS 75 Child Well-Being in the EU – and Enlargement to the East. John Micklewright and Kitty Stewart. (February 2000).
IWP 76 From Security to Uncertainty: The Impact of Economic Change on Child Welfare in Central Asia. Jane Falkingham. (May 2000).
IWP 77 How Effective is the British Government’s Attempt to Reduce Child Poverty? David Piachaud and Holly Sutherland. (June 2000).
IWP 78 Child Poverty Dynamics in Seven Nations. Bruce Bradbury, Stephen Jenkins and John Micklewright. (June 2000).
IWP 79 What is the Effect of Child Labour on Learning Achievement? Evidence from Ghana. Christopher Heady (October 2000).
IWP 80 Integrating Economic and Social Policy: Good Practices from High-Achieving Countries. Santosh Mehrotra (October 2000).
IWP 81 The Impact of the Indonesian Financial Crisis on Children: An Analysis Using the 100 Villages Data. Lisa A. Cameron (December 2000).
IWP 82 An Analysis of the Role of Social Safety Net Scholarship in Reducing School Drop-Out During the Indonesian Economic Crisis. Lisa A. Cameron (December 2000).
IWP 83 The Family-in-Focus Approach: Developing Policy-Oriented Monitoring and Analysis of Human Development in Indonesia. Friedhelm Betke (January 2001).
IWP 84 Children in Bulgaria – Growing Impoverishment and Unequal Opportunities. Gantcheva, Roumiana and Alexandre Kolev (January 2001).
IWP 85 The Rhetoric of International Development Targets and the Reality of Official Development Assistance. Santosh Mehrotra (June 2001).
IWP 86 The Outcomes of Teenage Motherhood in Europe. Richard Berthoud and Karen Robson (July 2001).
IWP 87 Is EFA Affordable? Estimating the Global Minimum Cost of Education for All. Enrique Delamonica, Santosh Mehrotra and Jan Vandemoortele (August 2001). Available as a .pdf file only from http://www.unicef-icdc.org
IWP 88 Attitudes to Inequality after Ten Years of Transition. Gerry Redmond, Sylke Viola Schnepf and Marc Suhrcke (September 2001). Available as a .pdf file only from http://www.unicef-icdc.org
34
IWP 89 Preferences for Inequality: East vs. West. Marc Suhrcke (October 2001).
IWP 90 Social Exclusion and Children: A European View for a US Debate. John Micklewright (February 2002).
IWP 91 Poverty in the Transition: Social Expenditures and the Working-Age Poor. Jeni Klugman, John Micklewright and Gerry Redmond (March 2002).
IWP 92 A Sorting Hat That Fails? The Transition from Primary to Secondary School in Germany. Sylke Viola Schnepf (July 2002).
IWP 93 When the Invisible Hand Rocks the Cradle: New Zealand Children in a Time of Change. Alison J. Blaiklock, Cynthia A. Kiro, Michael Belgrave, Will Low, Eileen Davenport, Ian B. Hassall. (July 2002).
IWP 94 Child Poverty in English-Speaking Countries. John Micklewright. (June 2003).
IWP 95 How High is Infant Mortality in Poor CIS Countries? Nadya Aleshina and Gerry Redmond. (July 2003).
IWP96 The Subterranean Child Labour Force: Subcontracted Home Based Manufacuring in Asia. Santosh Mehrotra and Mario Biggeri.
IWP 97 Social Protection in the Informal Economy: Home Based Women Woprkers and Outsourced Manufacturing in Asia. Santosh Mehrotra and Mario Biggeri.
#