Embed Size (px)
Citation preview
Chinese Coal Supply and Demand Outlook for 2010
Chinese Coal Supply and Demand Trends for 2011
David Fang
May 2011China Coal Transport and Distribution Association
PDF 文件使用 "pdfFactory Pro" 试用版本创建 ÿ赠æ www.fineprint.cn
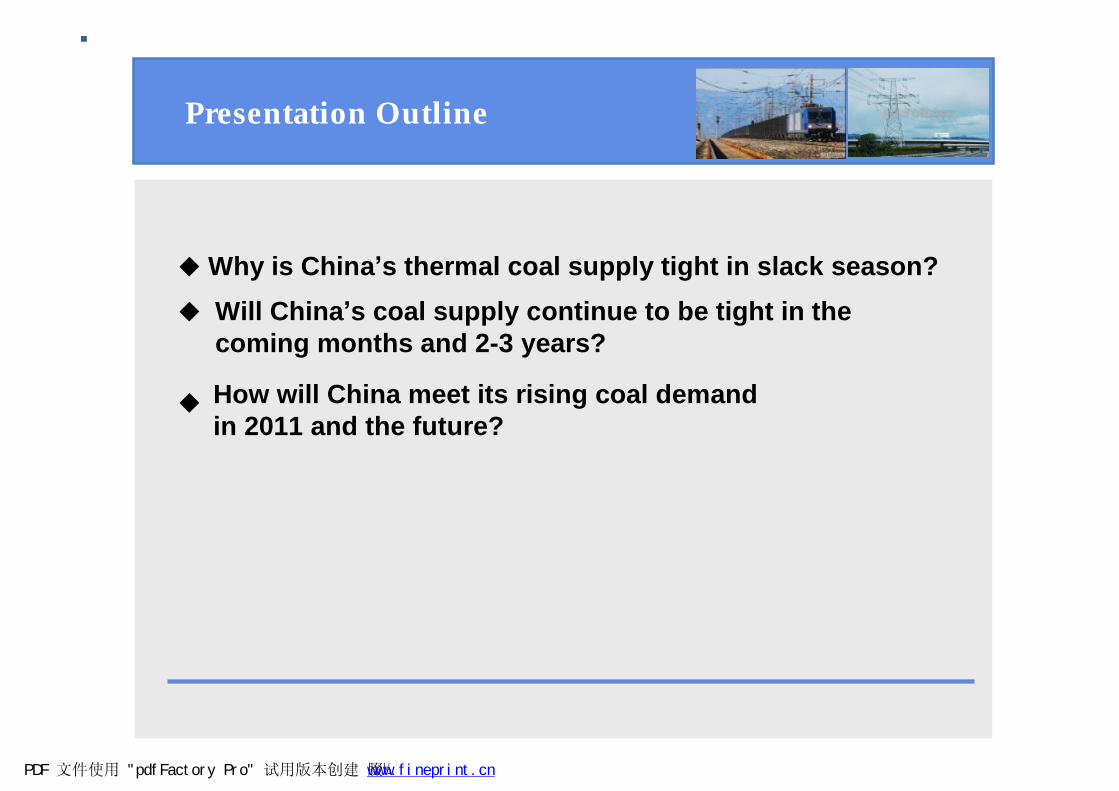
Presentation Outline
◆Why is China’s thermal coal supply tight in slack season?◆
◆
Will China’s coal supply continue to be tight in the coming months and 2-3 years?
How will China meet its rising coal demand in 2011 and the future?
PDF 文件使用 "pdfFactory Pro" 试用版本创建 腏½ www.fineprint.cn
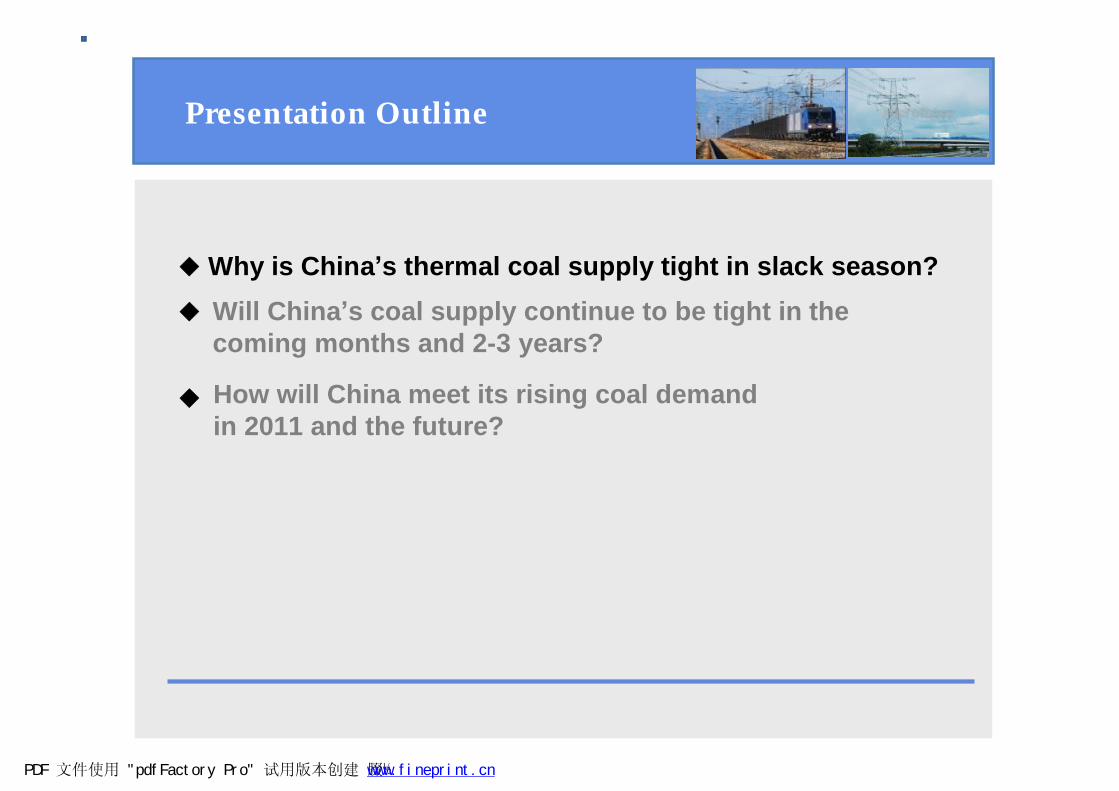
Presentation Outline
◆Why is China’s thermal coal supply tight in slack season?◆
◆
Will China’s coal supply continue to be tight in the coming months and 2-3 years?
How will China meet its rising coal demand in 2011 and the future?
PDF 文件使用 "pdfFactory Pro" 试用版本创建 腏½ www.fineprint.cn

China’s coal production on a steady rise
Raw coal production rose 8.3 pct YoY to 790 million tons (SAWS) in Q1, with Shanxi province contributing 183.9 million tons, up 15.1 pct YoY, and Inner Mongolia 195.6 million tons, up 19.3 pct YoY.
PDF 文件使用 "pdfFactory Pro" 试用版本创建 腏½ www.fineprint.cn
Coal shipments by rail and sea rising sharply
Coal shipments by rail rose 12.6 pct YoY to 553 million tons in Q1, coal shipments from ports surged 30.5 pct YoY to 156 million tons.
PDF 文件使用 "pdfFactory Pro" 试用版本创建 腏½ www.fineprint.cn
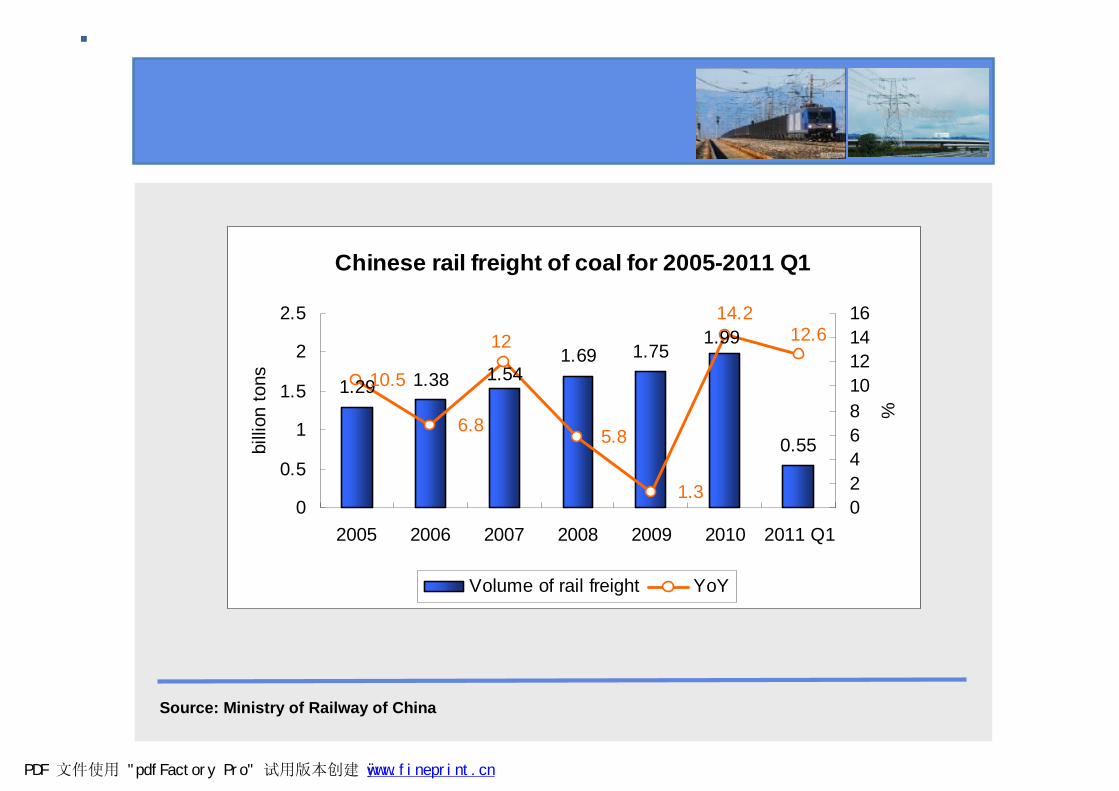
Chinese rail freight of coal for 2005-2011 Q1
1.29 1.381.69 1.75
0.55
1.54
1.99
10.5
1.3
6.8 5.8
14.212 12.6
0
0.5
1
1.5
2
2.5
2005 2006 2007 2008 2009 2010 2011 Q1
billi
on to
ns
0246810121416
%
Volume of rail freight YoY
Source: Ministry of Railway of China
PDF 文件使用 "pdfFactory Pro" 试用版本创建 ÿ www.fineprint.cn
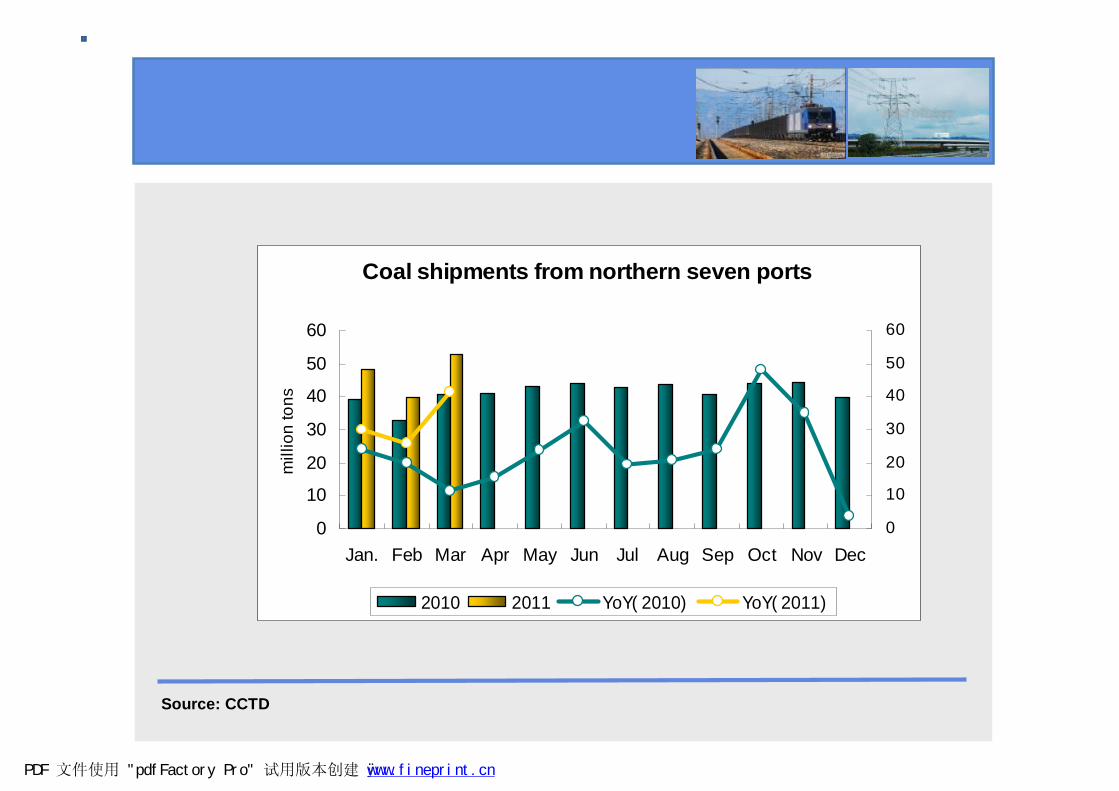
Coal shipments from northern seven ports
0
10
20
30
40
50
60
Jan. Feb Mar Apr May Jun Jul Aug Sep Oct Nov Dec
mill
ion
tons
0
10
20
30
40
50
60
2010 2011 YoY(2010) YoY(2011)
Source: CCTD
PDF 文件使用 "pdfFactory Pro" 试用版本创建 ÿ www.fineprint.cn
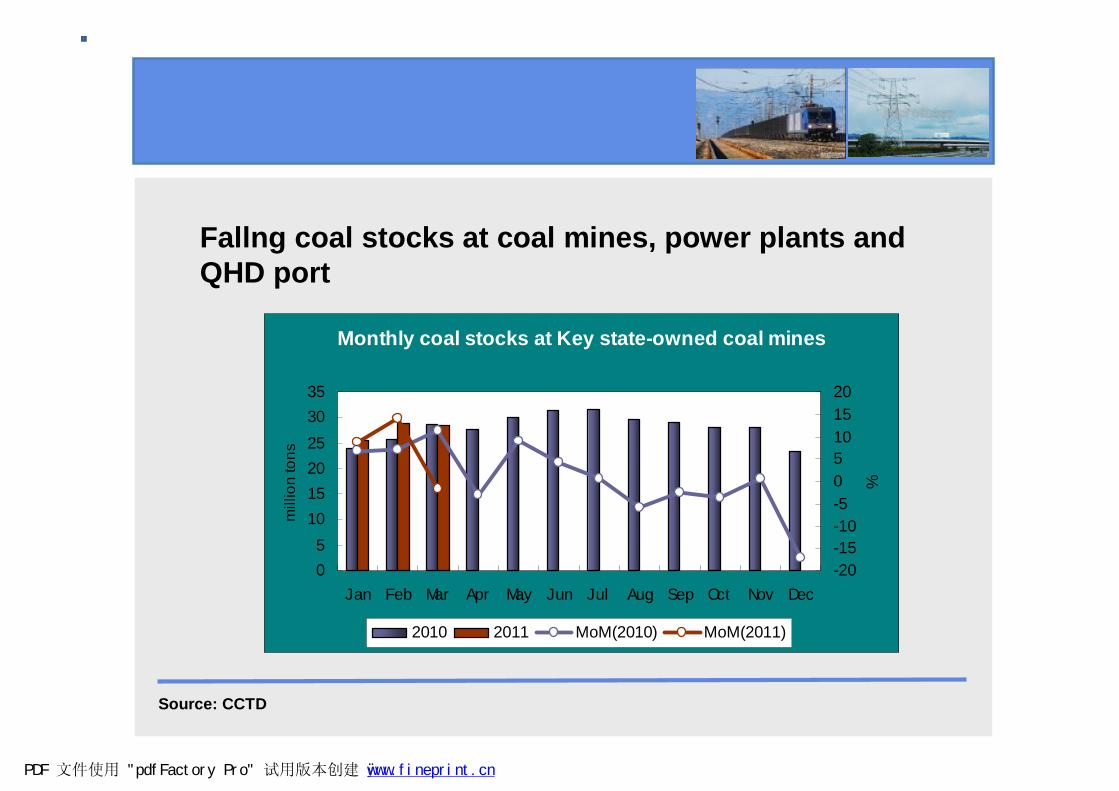
Fallng coal stocks at coal mines, power plants and QHD port
Monthly coal stocks at Key state-owned coal mines
05
101520253035
Jan Feb Mar Apr May Jun Jul Aug Sep Oct Nov Dec
mill
ion
tons
-20-15-10-505101520
%
2010 2011 MoM(2010) MoM(2011)
Source: CCTD
PDF 文件使用 "pdfFactory Pro" 试用版本创建 ÿ www.fineprint.cn
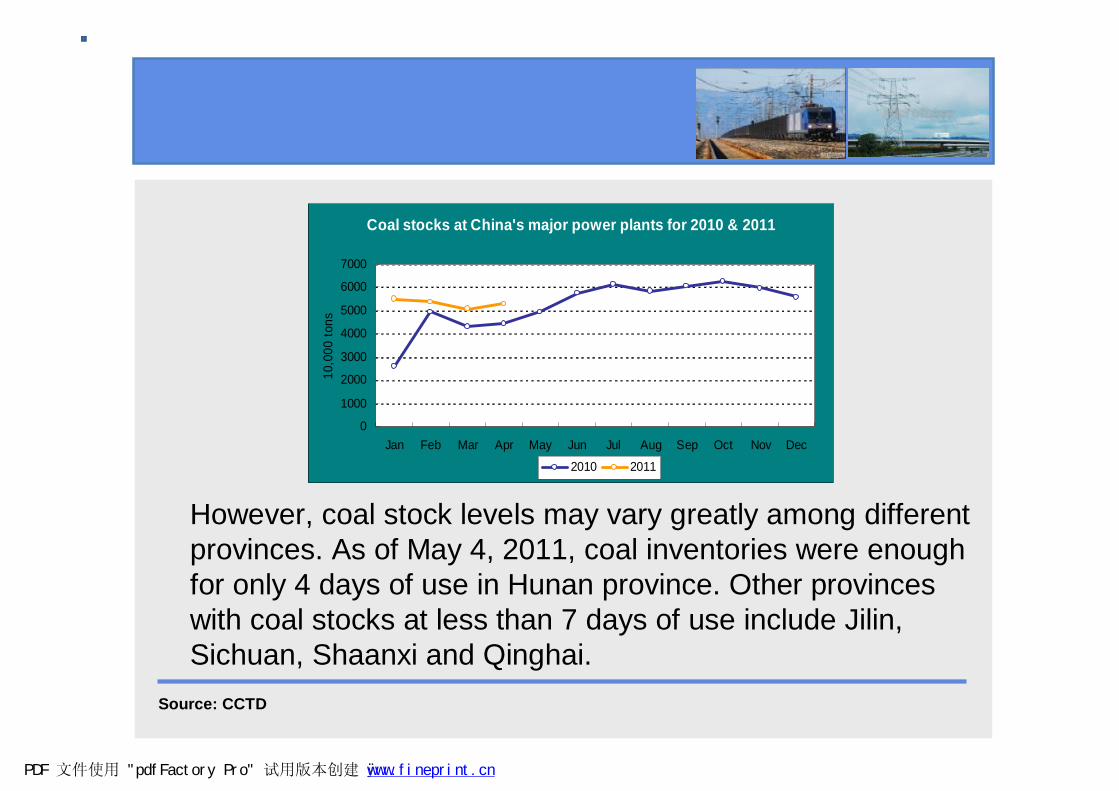
Coal stocks at China's major power plants for 2010 & 2011
0
1000
2000
3000
4000
5000
6000
7000
Jan Feb Mar Apr May Jun Jul Aug Sep Oct Nov Dec
10,0
00 to
ns
2010 2011
Source: CCTD
However, coal stock levels may vary greatly among different provinces. As of May 4, 2011, coal inventories were enough for only 4 days of use in Hunan province. Other provinces with coal stocks at less than 7 days of use include Jilin, Sichuan, Shaanxi and Qinghai.
PDF 文件使用 "pdfFactory Pro" 试用版本创建 ÿ www.fineprint.cn
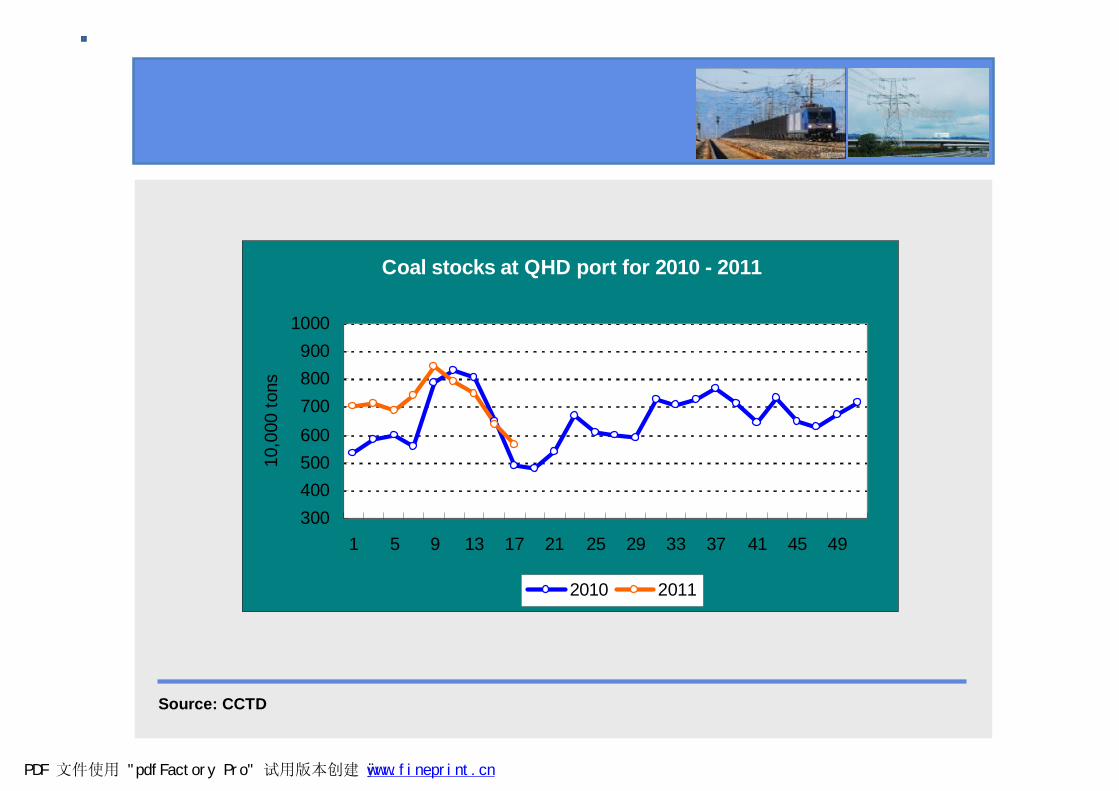
Coal stocks at QHD port for 2010 - 2011
300400500600700800900
1000
1 5 9 13 17 21 25 29 33 37 41 45 49
10,0
00 to
ns
2010 2011
Source: CCTD
PDF 文件使用 "pdfFactory Pro" 试用版本创建 ÿ www.fineprint.cn
Stronger-than-expected demand tightening domestic thermal coal supply in traditionally slack season
Strongly rebounding heavy industries are boosting electric power consumption after the government has loosened the energy conservation and emission cut campaign.
Electric power consumption rose 12.7 pct in Q1, and 13.41 pct in March. Heavy industries represented around 60 pct of national total power consumption, staged a 12.29 pct YoY growth.
PDF 文件使用 "pdfFactory Pro" 试用版本创建 腏½ www.fineprint.cn
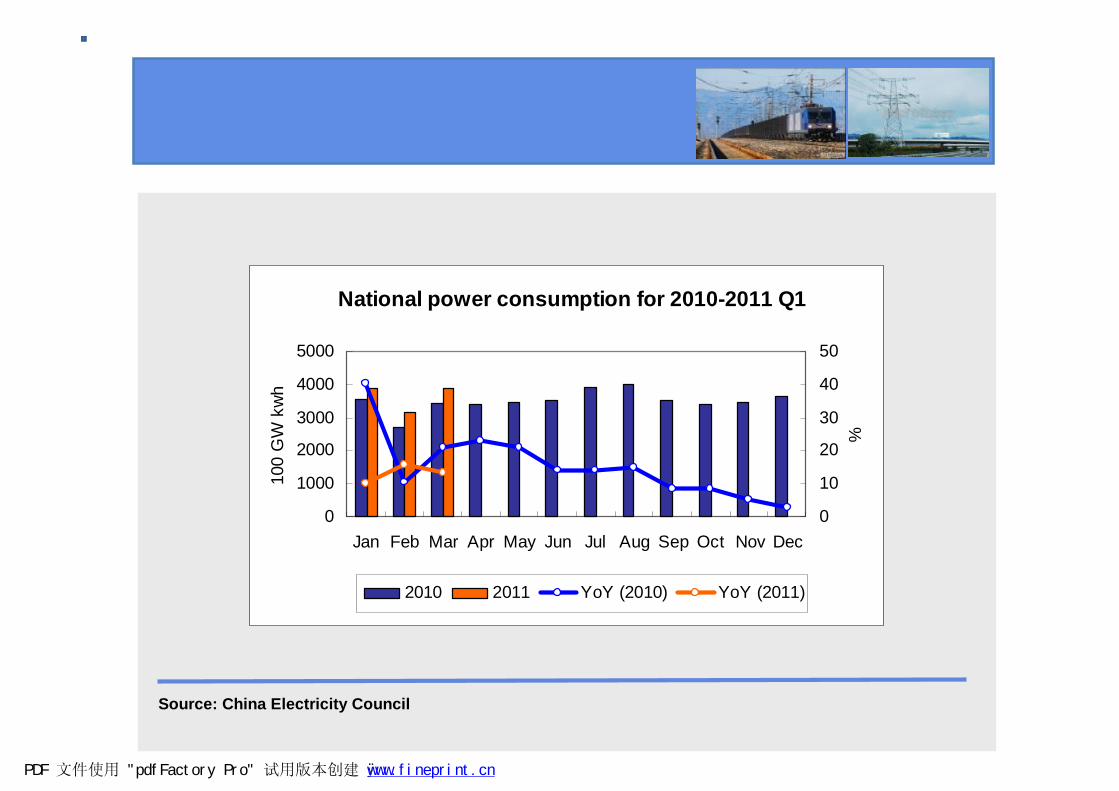
Source: China Electricity Council
National power consumption for 2010-2011 Q1
0
1000
2000
3000
4000
5000
Jan Feb Mar Apr May Jun Jul Aug Sep Oct Nov Dec
100
GW
kw
h
0
10
20
30
40
50
%
2010 2011 YoY (2010) YoY (2011)
PDF 文件使用 "pdfFactory Pro" 试用版本创建 ÿ www.fineprint.cn
China electricity council
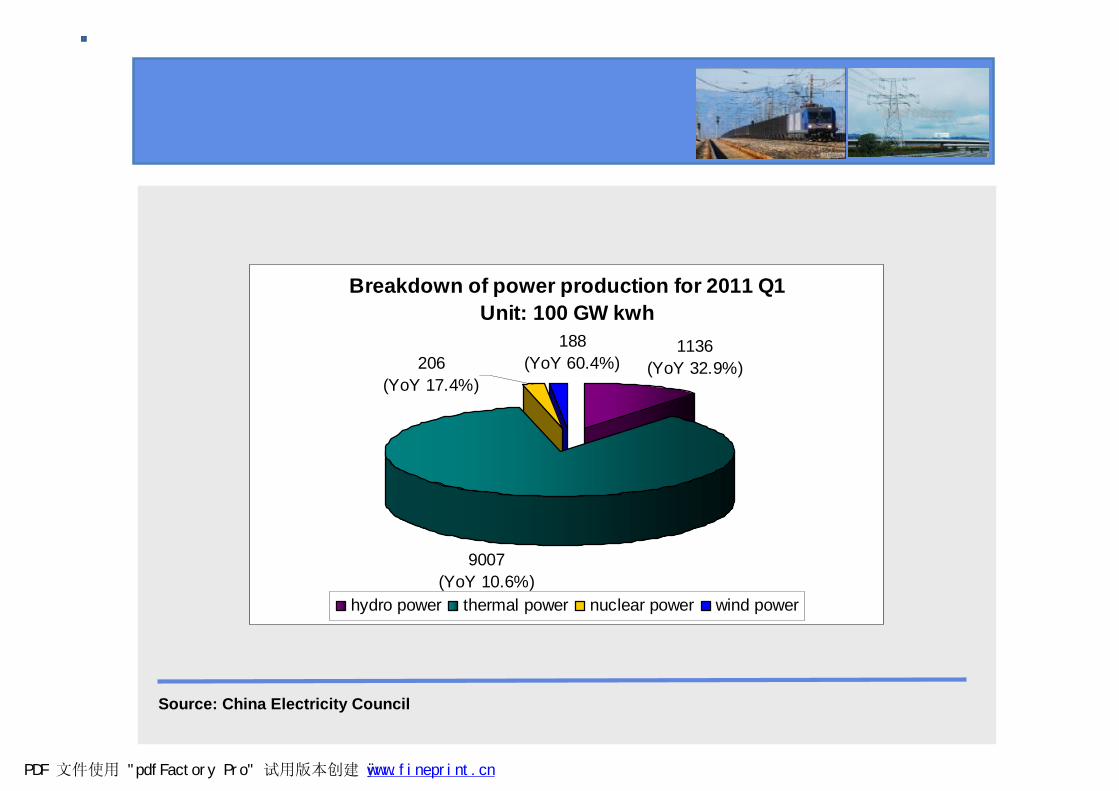
Breakdown of power production for 2011 Q1Unit: 100 GW kwh
1136(YoY 32.9%)
188(YoY 60.4%)
9007(YoY 10.6%)
206(YoY 17.4%)
hydro power thermal power nuclear power wind power
Source: China Electricity Council
PDF 文件使用 "pdfFactory Pro" 试用版本创建 ÿ www.fineprint.cn
Thermal coal consumption for power production rose 9.9 pct YoY to 322 million tons (NDRC).
Supply tightness is boosting domestic thermal coal prices, leaving the benchmark seaborne price (5500 kcal/kg, NAR) at a two-year high of 805-820 yuan/ton FOB QHD in early May after peaking in 2008. We forecast that seaborne coal prices may not rise more than 10 pct this year as inflation control is the top priority for the government.
PDF 文件使用 "pdfFactory Pro" 试用版本创建 腏½ www.fineprint.cn
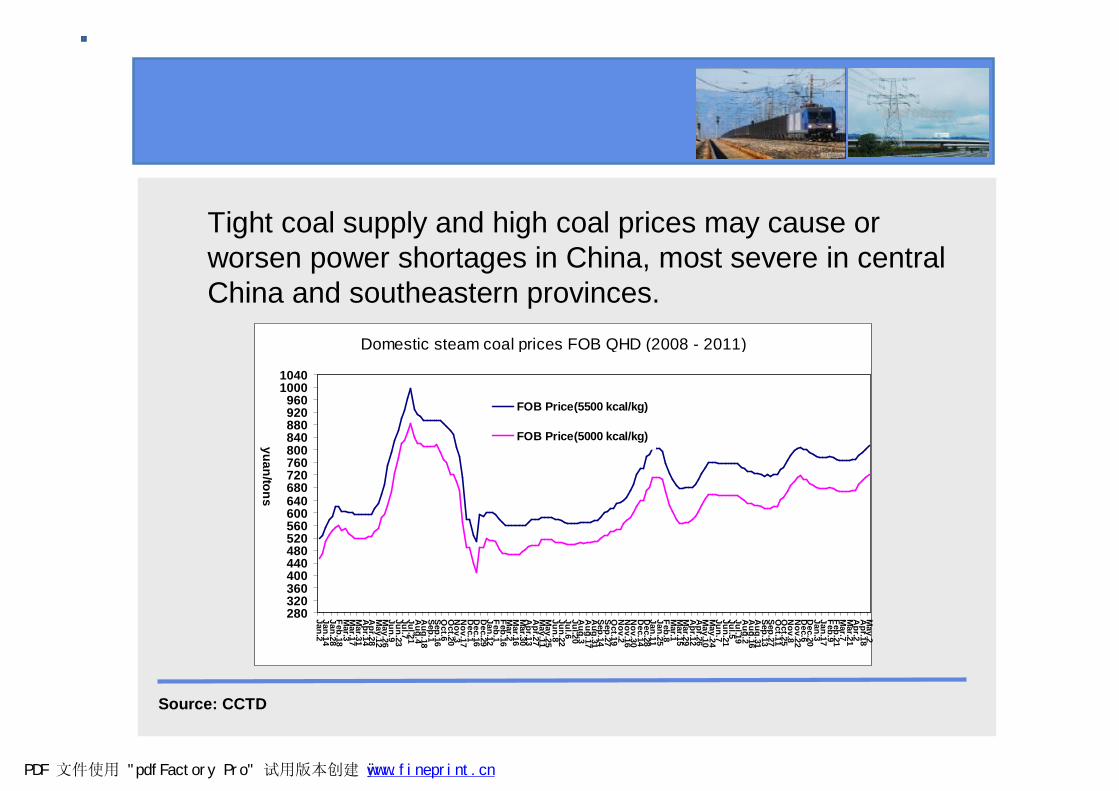
Tight coal supply and high coal prices may cause or worsen power shortages in China, most severe in central China and southeastern provinces.
280320360400440480520560600640680720760800840880920960
10001040
Jan.2Jan.14Jan.28Feb.18M
ar.3M
ar.17M
ar.31A
pr.14A
pr.28M
ay.12M
ay.26Jun.9Jun.23Jul.7Jul.21A
ug.4A
ug.18Sep.1Sep.16O
ct.6O
ct.20N
ov.3N
ov.17D
ec.1D
ec.16D
ec.29Jan.12Feb.1Feb.16M
ar.2M
ar.16M
ar.30A
pr.13A
pr.27M
ay.11M
ay.25Jun.8Jun.22Jul.6Jul.20A
ug.3A
ug.17A
ug.31Sep.14Sep.27O
ct.19N
ov.2N
ov.16N
ov.30D
ec.14D
ec.28Jan.11Jan.25Feb.8M
ar.1M
ar.15M
ar.29A
pr.12A
pr.26M
ay.10M
ay.24Jun.7Jun.21Jul.5Jul.19A
ug.2A
ug.16A
ug.31Sep.13Sep.27O
ct.11O
ct.25N
ov.8N
ov.22D
ec.6D
ec.20Jan.3Jan.17Feb.9Feb.21M
ar.7M
ar.21A
pr.2A
pr.18M
ay.2
FOB Price(5500 kcal/kg)
FOB Price(5000 kcal/kg)
Domestic steam coal prices FOB QHD (2008 - 2011)
yuan/tons
Source: CCTD
PDF 文件使用 "pdfFactory Pro" 试用版本创建 ÿ www.fineprint.cn
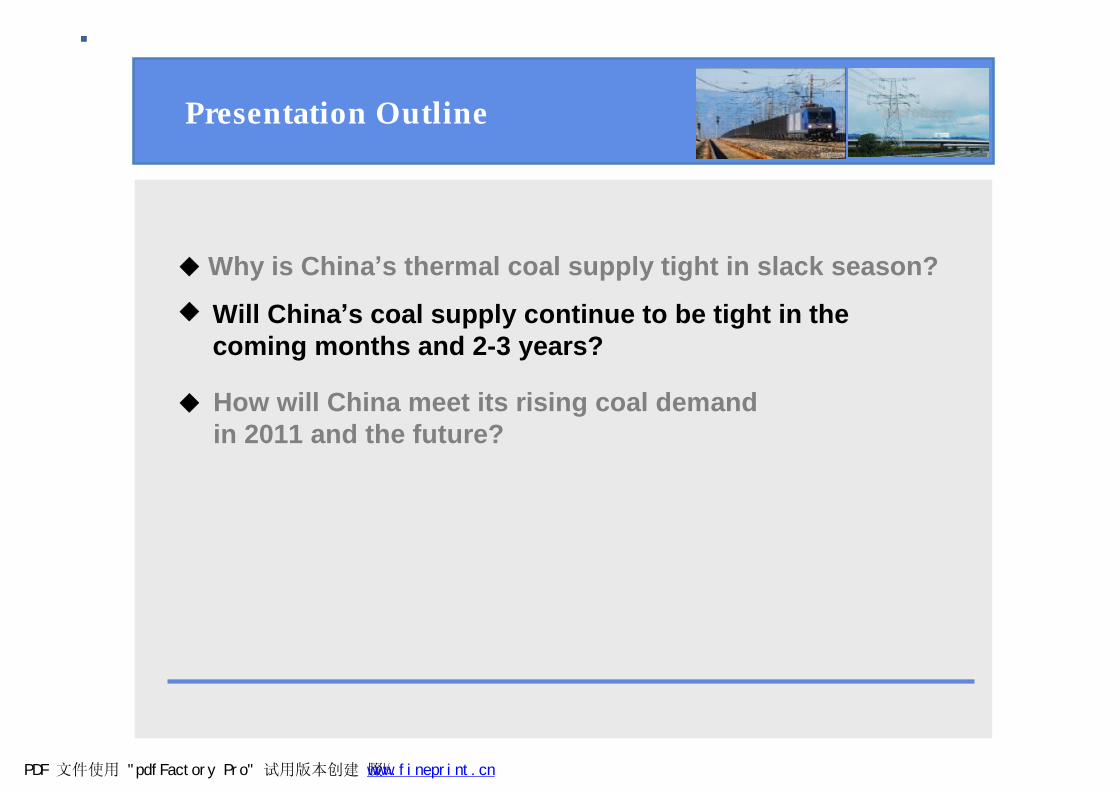
Presentation Outline
◆Why is China’s thermal coal supply tight in slack season?◆
◆
Will China’s coal supply continue to be tight in the coming months and 2-3 years?
How will China meet its rising coal demand in 2011 and the future?
PDF 文件使用 "pdfFactory Pro" 试用版本创建 腏½ www.fineprint.cn
China’s coal supply is mostly constrained by intensified nation-wide coal mine consolidation campaign and rail infrastructure bottlenecks.
The new round of mine consolidation campaign started with two of top four coal-provinces: Shanxi in 2009, Henan in 2010. The campaign is spread to other leading producers this year, including Shaanxi, Inner Mongolia, Heilongjiang, Shandong, Guizhou.
PDF 文件使用 "pdfFactory Pro" 试用版本创建 腏½ www.fineprint.cn
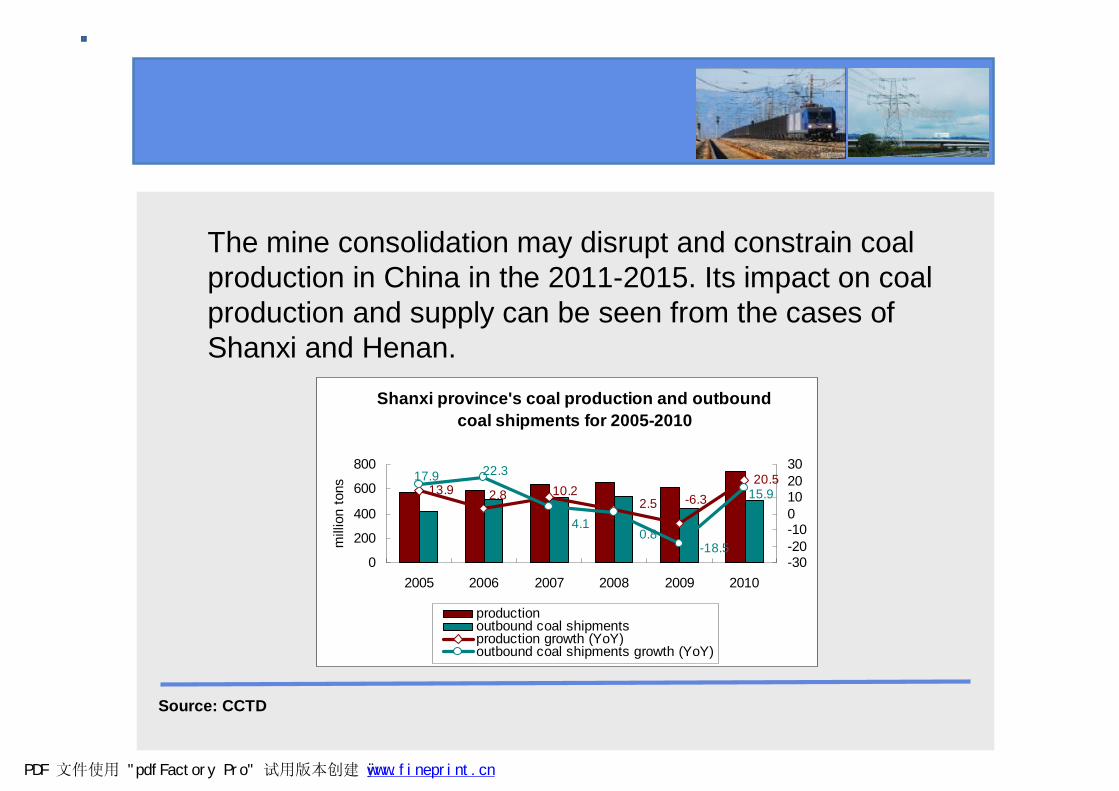
The mine consolidation may disrupt and constrain coal production in China in the 2011-2015. Its impact on coal production and supply can be seen from the cases of Shanxi and Henan.
Shanxi province's coal production and outboundcoal shipments for 2005-2010
13.920.5
2.8 10.22.5 -6.3 15.9
-18.50.8
4.1
17.9 22.3
0
200
400
600
800
2005 2006 2007 2008 2009 2010
mill
ion
tons
-30-20-100102030
productionoutbound coal shipmentsproduction growth (YoY)outbound coal shipments growth (YoY)
Source: CCTD
PDF 文件使用 "pdfFactory Pro" 试用版本创建 ÿ www.fineprint.cn
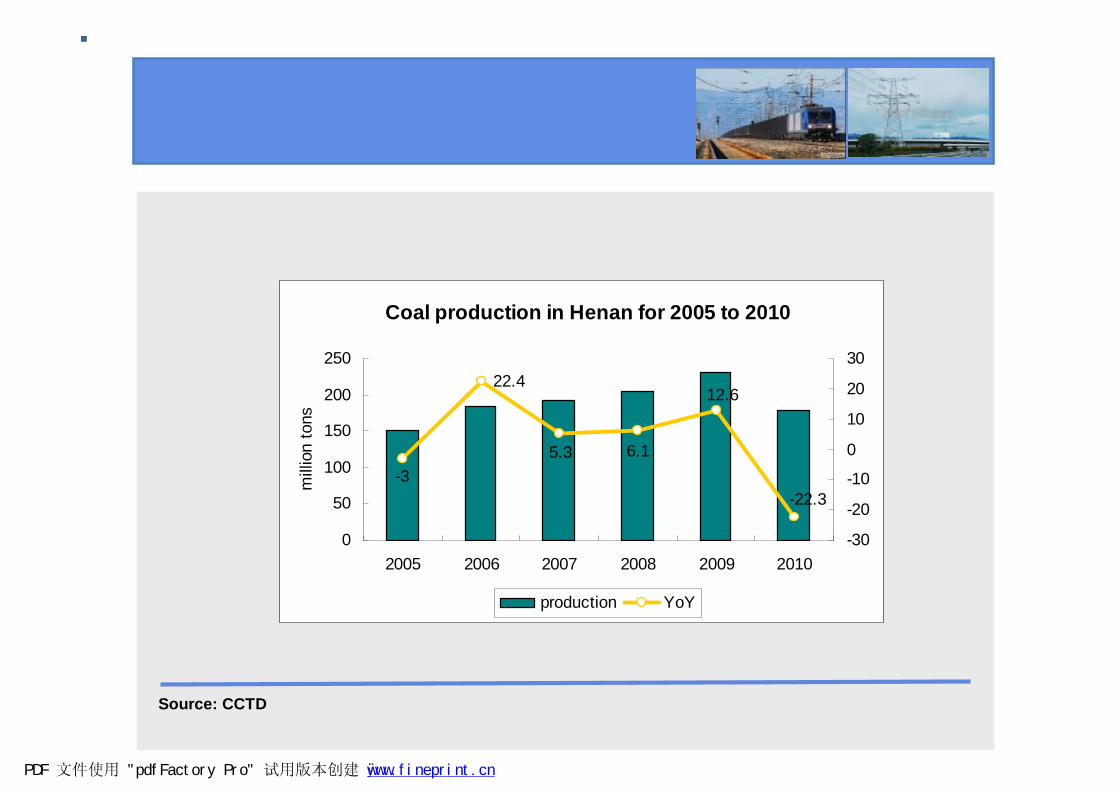
Coal production in Henan for 2005 to 2010
22.4
-35.3 6.1
12.6
-22.3
0
50
100
150
200
250
2005 2006 2007 2008 2009 2010
mill
ion
tons
-30
-20
-10
0
10
20
30
production YoY
Source: CCTD
PDF 文件使用 "pdfFactory Pro" 试用版本创建 ÿ www.fineprint.cn
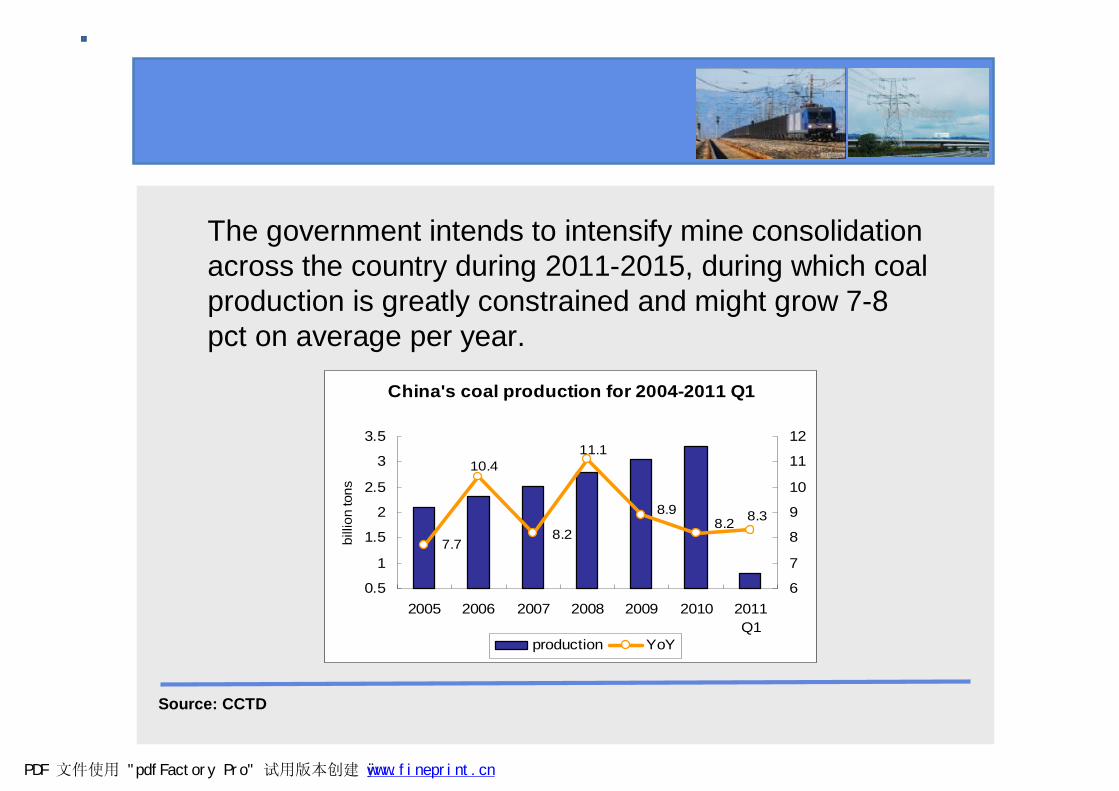
The government intends to intensify mine consolidation across the country during 2011-2015, during which coal production is greatly constrained and might grow 7-8 pct on average per year.
China's coal production for 2004-2011 Q1
10.4
8.2
11.1
8.98.2 8.3
7.7
0.5
1
1.5
2
2.5
3
3.5
2005 2006 2007 2008 2009 2010 2011Q1
billi
on to
ns
6
7
8
9
10
11
12
production YoY
Source: CCTD
PDF 文件使用 "pdfFactory Pro" 试用版本创建 ÿ www.fineprint.cn
Source: NBS
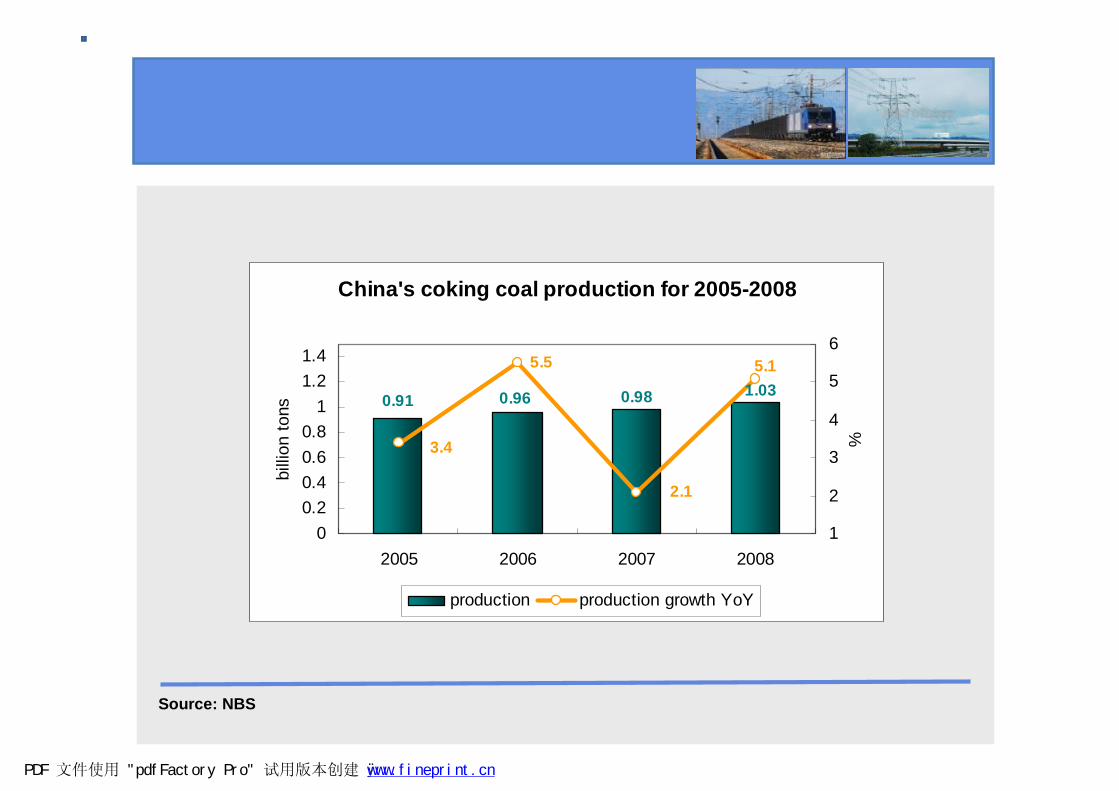
China's coking coal production for 2005-2008
0.91 1.030.980.96
5.5
3.4
2.1
5.1
00.20.40.60.8
11.21.4
2005 2006 2007 2008
billi
on to
ns
1
2
3
4
5
6
%
production production growth YoY
PDF 文件使用 "pdfFactory Pro" 试用版本创建 ÿ www.fineprint.cn
The economic restructuring, energy conservation and emission cut may tend to slow down coal demand growth in China, but time frame might be uncertain, while it is certain that rail infrastructure may continue to bottleneck coal transportation in the coming 2-3 years.
PDF 文件使用 "pdfFactory Pro" 试用版本创建 腏½ www.fineprint.cn
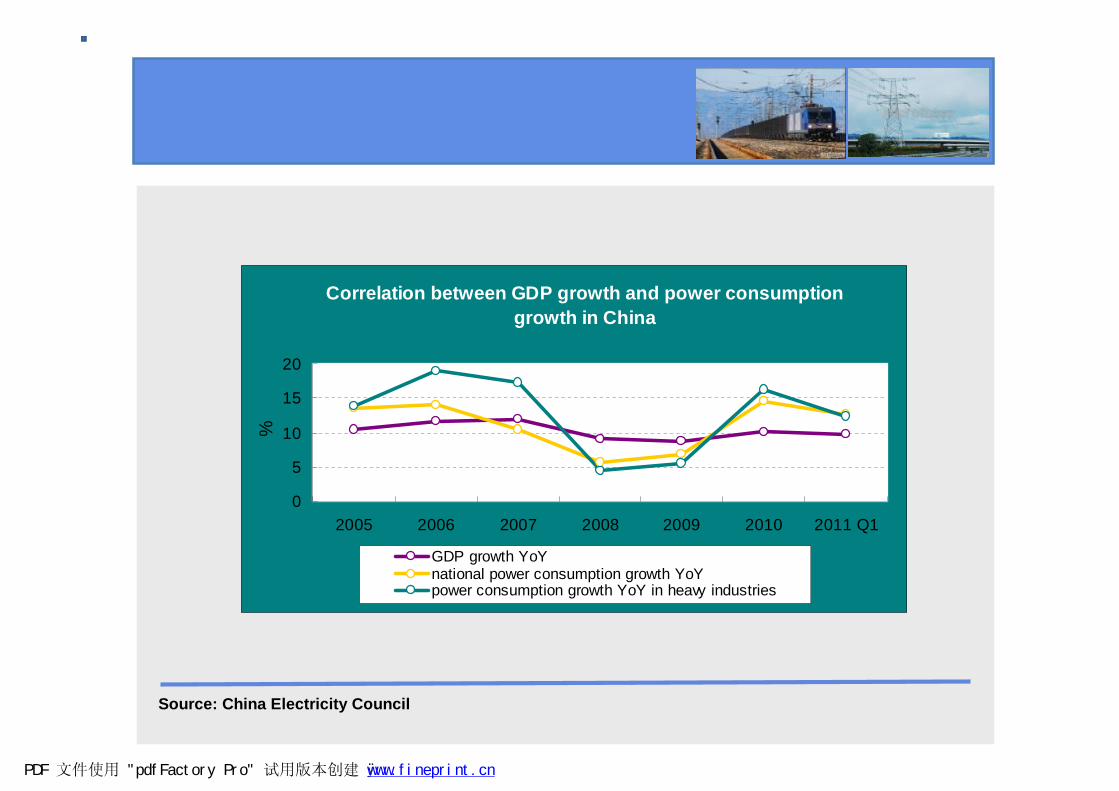
Source: China Electricity Council
Correlation between GDP growth and power consumptiongrowth in China
0
5
10
15
20
2005 2006 2007 2008 2009 2010 2011 Q1
%
GDP growth YoYnational power consumption growth YoYpower consumption growth YoY in heavy industries
PDF 文件使用 "pdfFactory Pro" 试用版本创建 ÿ www.fineprint.cn
If China’s reliance on energy-intensive industries is not changed greatly, leaving coal demand strong, domestic coal supply may tend to be tight later this year and in the coming 2-3 years when rail infrastructure bottlenecks continue to exist. Coal import might be critical to fill the domestic supply gap.
PDF 文件使用 "pdfFactory Pro" 试用版本创建 腏½ www.fineprint.cn
Presentation Outline
◆Why is China’s thermal coal supply tight in slack season?◆
◆
Will China’s coal supply continue to be tight in the coming months and 2-3 years?
How will China meet its rising coal demand in 2011 and the future?
PDF 文件使用 "pdfFactory Pro" 试用版本创建 腏½ www.fineprint.cn
It is critical to manage the demand side, with constraint of energy-intensive industries, power rationing, power tariff hike in the short term, shift to renewable energy such as hydropower, wind power and nuclear power in the medium and long term.
PDF 文件使用 "pdfFactory Pro" 试用版本创建 腏½ www.fineprint.cn
China may increase coal imports in the coming summer season, we forecast that China’s coal imports may grow moderately in 2011, due to higher overseas prices.
PDF 文件使用 "pdfFactory Pro" 试用版本创建 腏½ www.fineprint.cn
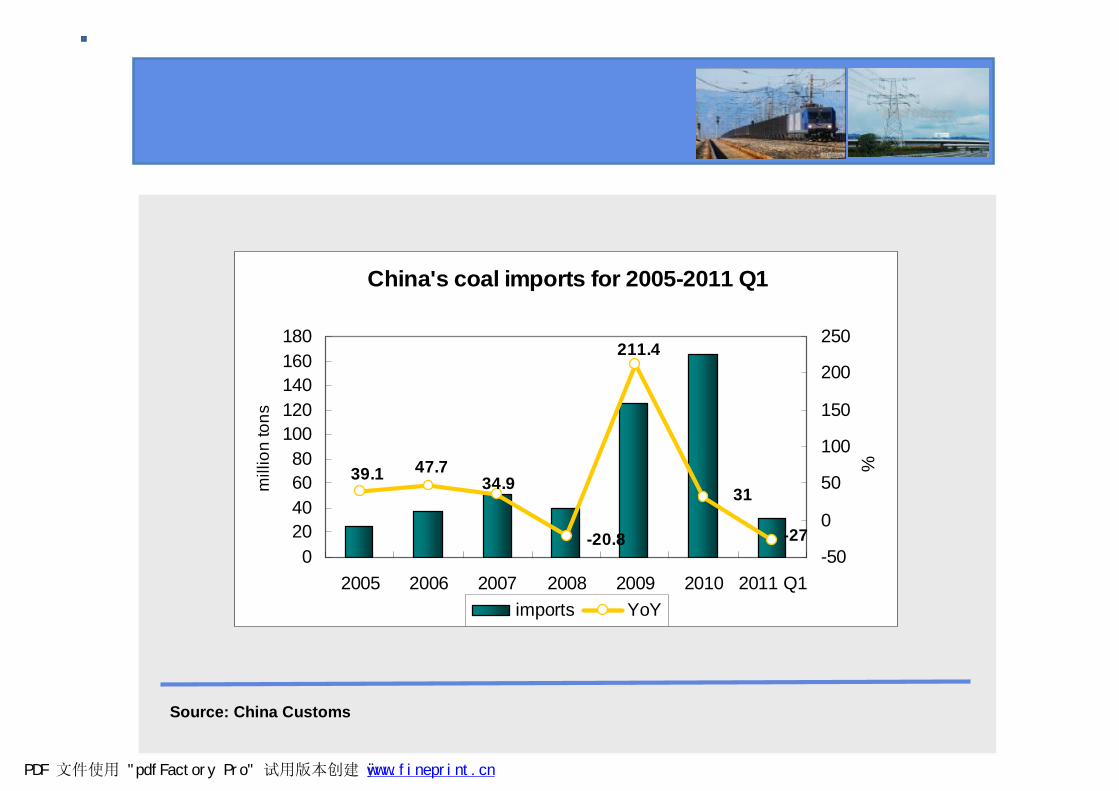
China's coal imports for 2005-2011 Q1
-27
31
211.4
-20.8
34.947.739.1
020406080
100120140160180
2005 2006 2007 2008 2009 2010 2011 Q1
mill
ion
tons
-50
0
50
100
150
200
250
%
imports YoY
Source: China Customs
PDF 文件使用 "pdfFactory Pro" 试用版本创建 ÿ www.fineprint.cn
China has taken a series measures to improve domestic coal supply. The coal mine consolidation campaign is being intensified to make coal production more stable and flexible. Coal resources development is shifting to northwestern China from eastern and central China where coal resources are being depleted.
PDF 文件使用 "pdfFactory Pro" 试用版本创建 腏½ www.fineprint.cn
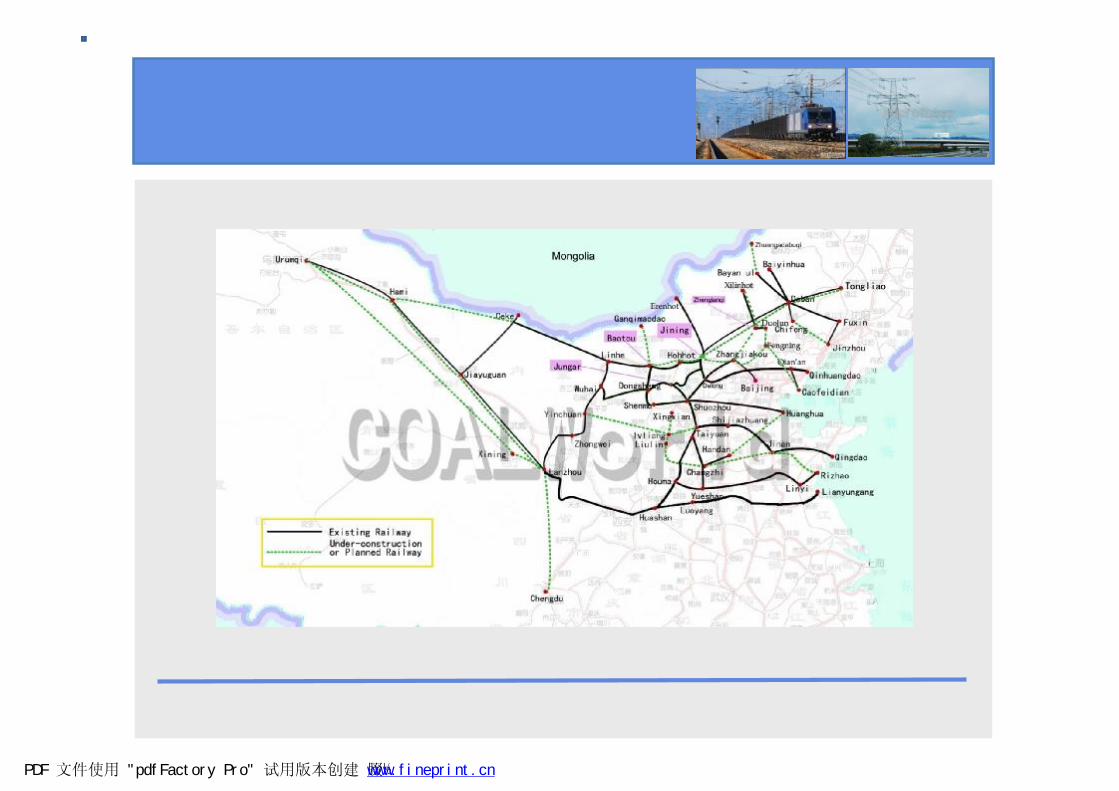
Coal transportation will be improved by expanding the capacity of existing railways and building new west-to-east railways to connect major coal producing provinces with eastern ports. It is expected that the rail bottlenecks will be basically removed in 2015, when China’s total rail freight of coal may grow 1.0 billions or so from 1.99 billion tons in 2010 to 2.99 billion tons by 2015.
PDF 文件使用 "pdfFactory Pro" 试用版本创建 腏½ www.fineprint.cn
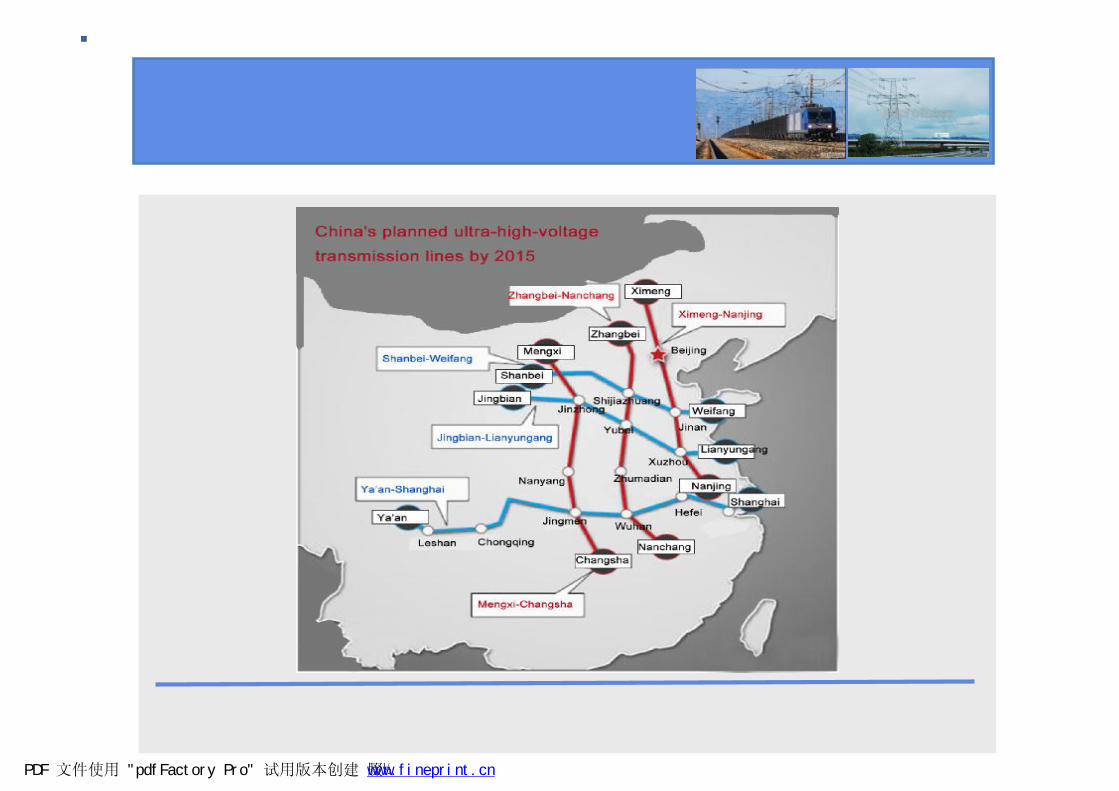
China plans to invest 500 billion yuan in ultra-high-voltage power transmission lines by 2015 to transmit power from the west to the east, from the north to the south by building more mine-mouth power stations.
PDF 文件使用 "pdfFactory Pro" 试用版本创建 腏½ www.fineprint.cn
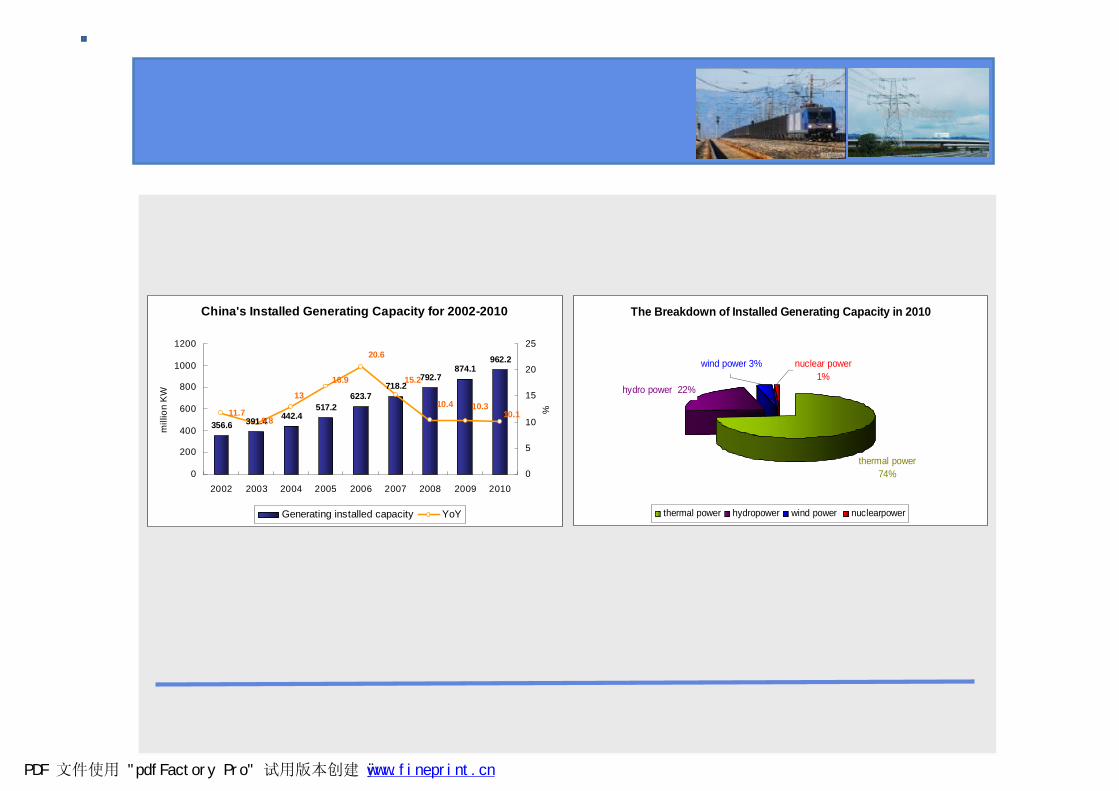
China's Installed Generating Capacity for 2002-2010
356.6 391.4 442.4517.2
623.7718.2
792.7874.1
962.2
11.7
13
9.8
16.9
20.6
15.2
10.4 10.310.1
0
200
400
600
800
1000
1200
2002 2003 2004 2005 2006 2007 2008 2009 2010
mill
ion
KW
0
5
10
15
20
25
%
Generating installed capacity YoY
The Breakdown of Installed Generating Capacity in 2010
thermal power74%
hydro power 22%
nuclear power1%
wind power 3%
thermal power hydropower wind power nuclearpower
PDF 文件使用 "pdfFactory Pro" 试用版本创建 ÿ www.fineprint.cn
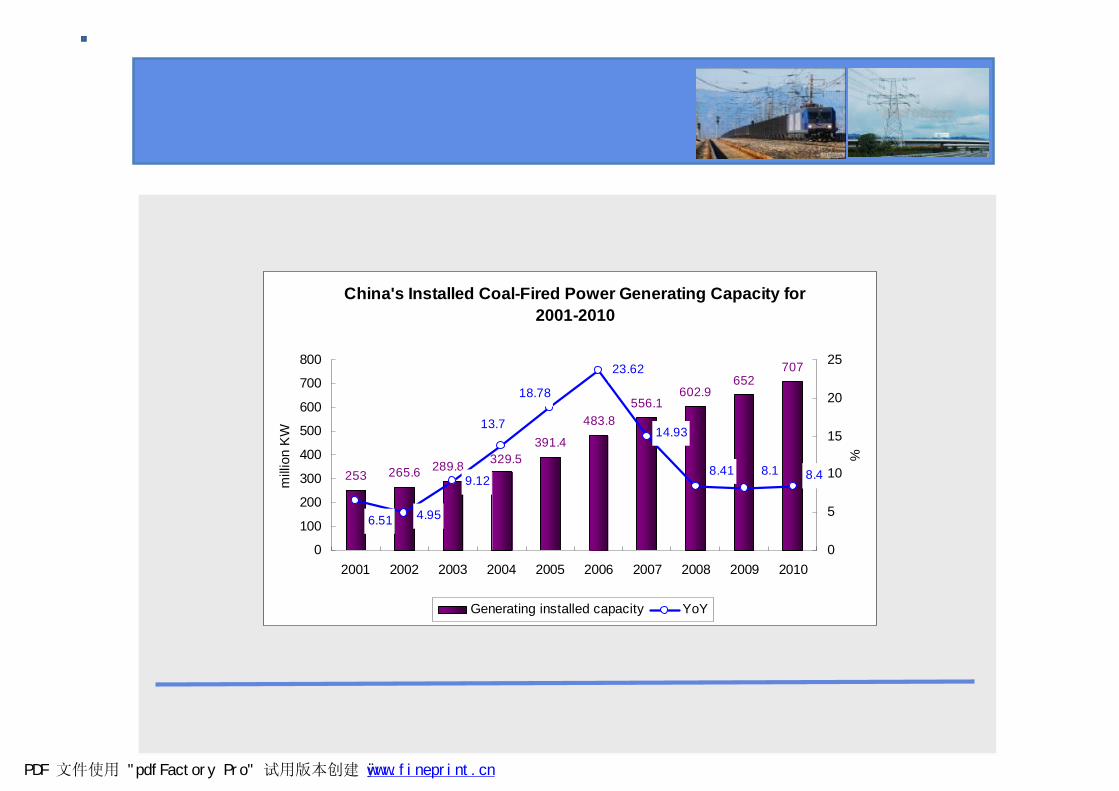
China's Installed Coal-Fired Power Generating Capacity for2001-2010
253 265.6
391.4
483.8556.1
602.9652
707
329.5289.8
14.93
23.62
8.48.18.41
18.78
13.7
9.12
4.956.51
0
100
200
300
400
500
600
700
800
2001 2002 2003 2004 2005 2006 2007 2008 2009 2010
mill
ion
KW
0
5
10
15
20
25
%
Generating installed capacity YoY
PDF 文件使用 "pdfFactory Pro" 试用版本创建 ÿ www.fineprint.cn