Embed Size (px)
Citation preview

1
CHONG SING HOLDINGS FINTECH GROUP LIMITED中新控股科技集團有限公司
(Incorporated in the Cayman Islands with limited liability)
(Stock Code: 8207)
ANNOUNCEMENT OF ANNUAL RESULTSFOR THE YEAR ENDED 31 DECEMBER 2018
CHARACTERISTICS OF GEM OF THE STOCK EXCHANGE OF HONG KONG LIMITED (THE “STOCK EXCHANGE” AND “GEM”, RESPECTIVELY)
GEM has been positioned as a market designed to accommodate small and mid-sized companies to which a higher investment risk may be attached than other companies listed on the Stock Exchange. Prospective investors should be aware of the potential risks of investing in such companies and should make the decision to invest only after due and careful consideration.
Given that the companies listed on GEM are generally small and mid-sized companies, there is a risk that securities traded on GEM may be more susceptible to high market volatility than securities traded on the Main Board of the Stock Exchange and no assurance is given that there will be a liquid market in the securities traded on GEM.
Hong Kong Exchanges and Clearing Limited and the Stock Exchange take no responsibility for the contents of this announcement, make no representation as to its accuracy or completeness and expressly disclaim any liability whatsoever for any loss howsoever arising from or in reliance upon the whole or any part of the contents of this announcement.
This announcement, for which the directors of Chong Sing Holdings FinTech Group Limited (the “Company” and the “Directors”, respectively) collectively and individually accept full responsibility, includes particulars given in compliance with the Rules Governing the Listing of Securities on GEM (the “GEM Listing Rules”) for the purposes of giving information with regard to the Company. The Directors, having made all reasonable enquiries, confirm that to the best of their knowledge and belief, the information contained in this announcement is accurate and complete in all material respects and not misleading or deceptive, and there are no other matters the omission of which would make any statement herein or this announcement misleading.
2
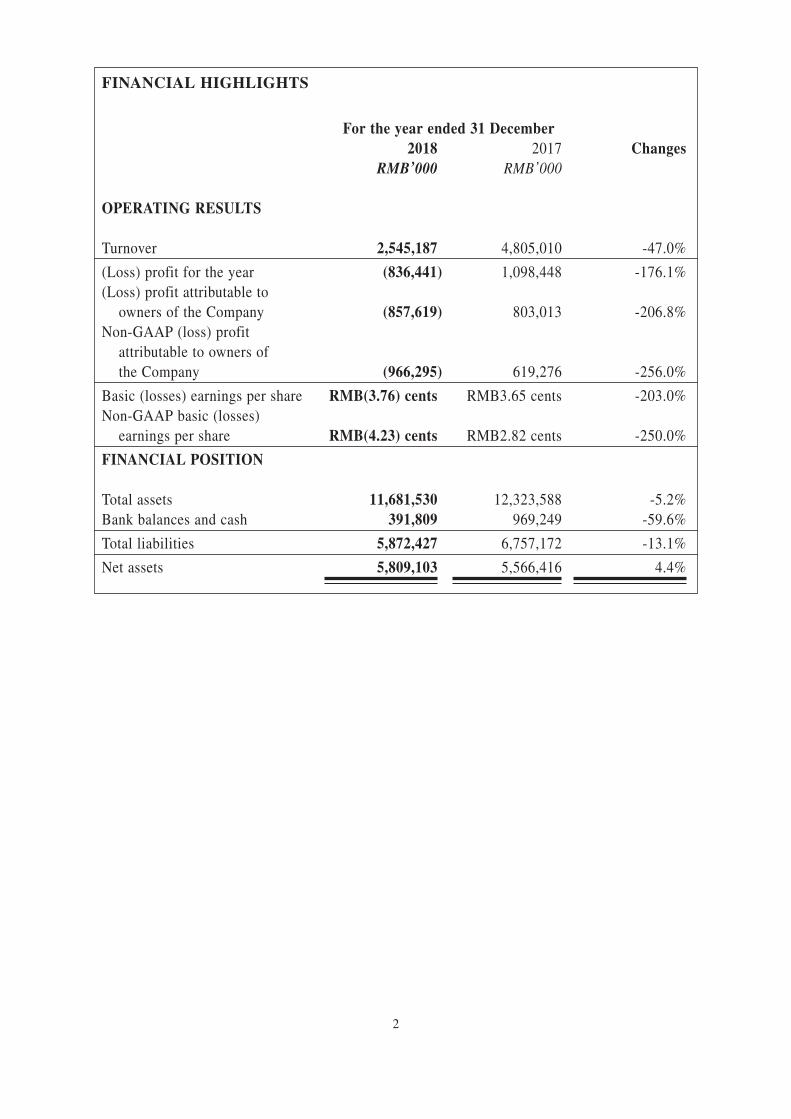
FINANCIAL HIGHLIGHTS
For the year ended 31 December2018 2017 Changes
RMB’000 RMB’000
OPERATING RESULTS
Turnover 2,545,187 4,805,010 -47.0%
(Loss) profit for the year (836,441) 1,098,448 -176.1%
(Loss) profit attributable to
owners of the Company (857,619) 803,013 -206.8%
Non-GAAP (loss) profit
attributable to owners of
the Company (966,295) 619,276 -256.0%
Basic (losses) earnings per share RMB(3.76) cents RMB3.65 cents -203.0%
Non-GAAP basic (losses)
earnings per share RMB(4.23) cents RMB2.82 cents -250.0%
FINANCIAL POSITION
Total assets 11,681,530 12,323,588 -5.2%
Bank balances and cash 391,809 969,249 -59.6%
Total liabilities 5,872,427 6,757,172 -13.1%
Net assets 5,809,103 5,566,416 4.4%

3
BUSINESS REVIEW
Industry Trends
The FinTech industry in the PRC has experienced the major reshuffle in 2018, and
“compliance” has become the main theme of development for the industry. The
implementation of various regulatory measures and acceleration in the industry
compliance have contributed to the industry consolidation, which in turn is beneficial
to the leading platforms. With the development of the industry and advancement in
technologies on big data and artificial intelligence, intelligent risk control has gradually
emerged within the industry. This has enhanced business efficiency and reduced platform
risks. The introduction of regulatory policies was conducive to the healthy development
of the industry. The FinTech industry will maintain fast and healthy development in
compliance with laws under the governance and protection of regulatory authorities.
By leveraging on its comprehensive business qualifications and risk management
capabilities, the FinTech platforms of the Company and its subsidiaries (the “Group”)
have received affirmation and recognition from the regulatory authorities (such as
the People’s Bank of China) and industry associations (such as the National Internet
Finance Association of China). In 2018, we have focused on the development of
payment and technology-enabled lending business and risk management, and have
leveraged our technical expertise and business optimisation experience with our
Southeast Asian operations. By the end of 2018, the number of total registered users of
the Group reached more than 84 million, representing a year-on-year growth of 15%.
The Group recorded a total transaction volume of more than RMB4,100 billion in 2018,
representing a year-on-year growth of 60%. With our ever-growing FinTech service
ecosystem, the Group will continue to maintain and consolidate its market leading
position.
Operational Review
Third party payment
Our wholly-owned subsidiary UCF Pay Limited (“UCF Pay”) has dedicated to be
a domestic leading service platform of internet financial transaction, and to provide
customers with integrated solutions for online + offline payment featuring “secure,
convenient, speedy” service. The total transaction volume of UCF Pay in 2018 reached
around RMB675.2 billion, representing a year-on-year growth of approximately 7%.
As of the end of 2018, the number of UCF Pay’s accumulated active users reached
5.32 million. UCF Pay’s current business include: basic payment service and featured
industry solutions including bank custody for online lending, direct banking, industry
chain finance, cloud-based online lending platform and electronic wallet.

4
Shanghai Jifu Xinxi Jishu Fuwu Co. Ltd(上海即富信息技術服務有限公司)(“Shanghai Jifu”), our mobile point of sale (“POS”) provider which is 35% owned
by the Group, recorded a total transaction volume of RMB3,430.2 billion in 2018,
representing a year-on-year growth of approximately 84%. The accumulated number of
registered users reached 20.08 million as of the end of December 2018. Shanghai Jifu
has been focusing on the promotion of DianPOS(點刷)/MPOS and Point POS(點POS)business and has received positive market feedbacks, resulting in the substantial
growth in both transaction volume and number of new registered users.
Since March 2018, K & R International Limited (“K&R International”) has adopted
effective strategies to improve its performance under the guidance of the Group’s
management. Besides developing new payment products and service platforms to satisfy
the needs of customers and optimize their experiences, K&R International has also
strived to improve its products and services and has cooperated with corporate clients
and business partners in different sectors. Meanwhile, K&R International has been
officially connected to the Faster Payment System (FPS) which was launched by the
Hong Kong Monetary Authority in September 2018, and has enabled the free flow of
funds with commercial banks in Hong Kong.
Amigo Technologies Joint Stock Company (“Amigo Technologies”) (in which the
Group holds a 51% interest), our payment services provider in Vietnam, recorded
a total transaction volume of VND204 trillion in 2018, representing a year-on-year
growth of around 27%. In 2018, Amigo Technologies’ total number of transactions was
approximately 194 million, representing a year-on-year growth of approximately 40%.
The growth rate was largely driven by COD (cash-on-delivery) services.
Online investment and technology-enabled lending
As of the end of December 2018, Weshare, our consumer finance platform, had
approximately 28 million accumulated registered users, and accumulated transaction
volume of RMB10.6 billion in 2018. Weshare focused on instant microcredit, and
reassessed previous credit users. It has been providing quality customers with large
amount in installments and consumer finance services as well as has launched Weshare
e-loan(掌e貸)and Weshare Buy(掌buy優選商城). Meanwhile, Weshare has
upgraded its financial cloud platform, with the launch of the new generation of big
data-driven “Ru Lai risk management(如來風控)” to deliver integrated technology
for internet credit. Based on its solid presence in the domestic market, Weshare has
expanded its business to the Southeast Asia region and Russia by constructing localised
online platform with a view to provide local users with internet financial services.

5
OUTLOOK AND STRATEGIES FOR 2019
Third party payment
In 2019, UCF Pay will focus on: 1) the compliance work in relation to customers,
business and systems; 2) active corporation with regulatory institutions to conduct
various checks and relevant compliance requirements; 3) constantly enhancing the
reliability of key technical systems; and 4) increasing the processing capacities of the
payment business to provide better and more compliant payment solutions. In addition,
UCF Pay will cooperate with companies engaged in smart cities to provide payment
solutions and integrate travel, education, tourism, medical and other resources across
various industries into city systems and services. This will improve resource utilization,
optimize city management and services and the living quality of citizens.
As for the export of FinTech solutions, UCF Pay will continue to support financial
institutions such as domestic small and medium-sized banks and small loan companies,
maintain and improve custody solutions for online loans of banks, and actively expand
bank fund custody business for platform-based enterprises in e-commerce, logistics and
merchandising industries. Meanwhile, UCF Pay will leverage advanced technologies,
including artificial intelligence, big data and cloud computing, and improve solutions
for financial industries such as direct banking, smart credit risk control system and
cloud platform for online lending. As for the cross-border RMB payment business, UCF
Pay will continue to intensify the development in vertical sectors, and focus on three
market segments, namely cross-border e-commerce, travelling tickets and boarder trade.
This will further optimize the business model of cross-border RMB payment, enrich
product functions and improve its performance. Since UCF Pay’s expansion into the
international markets, it has already established the presence in Southeast Asia and will
continue to offer products to meet the local demand. Meanwhile, it also plans to expand
the mobile payment market in the Middle East with preliminary focus on Saudi Arabia.
Shanghai Jifu will focus on promoting smart POS, which provides convenient and
integrated payment services, the core advantages for Shanghai Jifu. The company plans
to capture its growth potential in payment market and explore customers’ financial needs
to offer comprehensive financial services for small and micro businesses. The transition
from the payment segment to the financial sector will transform the business from
payment to “payment+”.

6
In 2019, K&R International will focus on:
1) e-wallet account products. To meet customers’ demands for mobile payment
service, the company plans to launch the first virtual product to help expand the
use cases supported by the prepaid card of Global Payment(環球通), and to
prepare for future mobile payment offerings;
2) issuance of theme based prepaid cards. It plans to issue theme based prepaid cards
including health, food and travel in the second half of 2019. Theme based prepaid
cards will be used to provide quality services such as discounts and priority
services to targeted customer groups;
3) expansion of sales channels & optimisation of top-up channels; and
4) export of FinTech capabilities on stored value facilities. By adopting Open
Application Programming Interface (API) model based on Soft Development
Kit (SDK), K&R International will actively expand to serve platform-based
enterprises such as large e-commerce companies, telecommunication operators
and innovation-driven catering content providers. Leveraging Electronic Know
Your Customer (EKYC) products dedicated to artificial intelligence and effective
anti-money laundering mechanism, FinTech on stored value facilities will be
exported to enhance customer loyalty. The product line of K&R International will
be expanded from Business to Consumer (B2C) model to Business to Business to
Consumer (B2B2C) model.
As part of the alliance with Vietnam Post, Amigo Technologies has been developing a
consumer finance module on top of the current Paypost financial platform with Vietnam
Post based on big data technology. We target to launch the product in the second quarter
of this year with features such as credit scoring, loan disbursement via branches and
mobile wallet.
Online investment and technology-enabled lending
Weshare will establish a five-in-one product and business system containing “instant
microcredit, large amount of installments, Weshare Buy, cloud Software as a Service
(SaaS) platform and traffic distribution platform” to invigorate traditional financial
services and connect to a new consumption ecosystem. Weshare will further strengthen
its capabilities in inclusive finance serving the public, open platform, efficient value
delivery, data-driven operation, and consumer financing. In terms of the business
development, Weshare will pivot on Weshare Buy to promote the integration of the
internet credit and scenario consumption, establish online scenario operation model
and serve users directly to improve their experience. Weshare will continue to deliver
its technology capabilities in Weshare cloud platform and cooperate with high quality
partners to jointly create consumer finance products. Those products will provide
corporate customers with multiple core value services covering data, technology, risk
control and asset management and deepen multi-sectors collaboration. Moreover,
Weshare will further expand its global presence and continue to export FinTech to the
world. It will keep strengthening the development of artificial intelligence application
and blockchain technology in the credit facilitation and reporting areas, gradually build
itself into an industrial router and create an industrial ecosphere for its value realisation.

7
MANAGEMENT DISCUSSION AND ANALYSIS
Revenues
For the year ended 31 December 2018, the Group reported revenues of approximately
RMB2,545.2 million, a decrease of 47% year-on-year. The decrease was primarily
attributable to the decrease in revenue from online investment and technology-enabled
lending services, due to a decrease in transaction volume on our key online consumer
lending platform, Weshare, offsetting a growth in revenue from blockchain services
during the year ended 31 December 2018. The following table sets forth the Group’s
revenues by segment of business for the years ended 31 December 2017 and 2018.
For the year ended 31 December2018 2017
RMB’000% of total revenues RMB’000
% of total revenues
Traditional loans and financing 554,960 21.8 557,093 11.6
Third party payment service 360,433 14.2 338,950 7.0
Online investment and technology-
enabled lending service 959,723 37.7 3,334,003 69.4
Blockchain services 420,341 16.5 289,063 6.0
Others 249,730 9.8 285,901 6.0
Total 2,545,187 100.0 4,805,010 100.0
Traditional loans and financing income
Traditional loans and financing income mainly includes interest income, financial
consultancy service income and gain on transfer of right on interest on loan receivable,
which were derived from the Group’s loan financing services including entrusted
loans, pawn loans and other loans secured with assets or guarantees. It generated
approximately 21.8% of the Group’s total revenues and recorded a decrease of
approximately 0.38% to approximately RMB555.0 million for the year ended 31
December 2018. The traditional loans and financing income slightly decreased due to
a decrease in the gain on transfer of rights on interest on loan receivables, offsetting an
increase in the average size of our loan portfolio during the year ended 31 December
2018.

8
Third party payment service income
The third party payment business, which included the provision of online payment
transactions, payment system consultancy and related services of UCF Pay and payment
transaction service of Amigo Technologies as well as K&R International, generated
revenues of approximately RMB360.4 million for the year ended 31 December 2018, an
increase of approximately 6.3% year-on-year. It represented approximately 14.2% of the
Group’s total revenues, of which UCF Pay, Amigo Technologies and K&R International
reported revenue of approximately RMB345.9 million, RMB12.7 million and RMB1.8
million, respectively. The increase reflected a significant growth in total transaction
volume on our core third party payment platform UCF Pay to RMB675.2 billion for the
year ended 31 December 2018, an increase of 7% year-on-year.
Online investment and technology-enabled lending service income
Our online investment and technology-enabled lending service income mainly includes
income generated by our 48%-owned online consumer lending platform Weshare. For
the year ended 31 December 2018, the Group’s online investment and technology-
enabled lending service business recorded revenues of approximately RMB959.7
million, representing a decrease of approximately 71.2% year-on-year. It represented
approximately 37.7% of the Group’s total revenues, of which Weshare reported revenues
of approximately RMB923.4 million. The decrease in the business segments revenue
was mainly due to a decrease in transaction volumes across the online consumer lending
platform Weshare.
Blockchain services
Blockchain segment contributed approximately RMB420.3 million of revenue to
the Group for the year ended 31 December 2018. It was primarily generated from
the blockchain transaction verification services from the Group’s industrial-level
datacenters.
Others
Others included social gaming service income, exhibition service income and IT solution
income generated by our 51%-owned subsidiary Shenzhen Qiyuan Tianxia Technology
Company Limited*(深圳起源天下科技有限公司)(“Qiyuan”), 51%-owned subsidiary
Glory Metro Holdings Limited (“Glory Metro”) and our 51%-owned subsidiary
Amigo Technologies, respectively. The social gaming business, exhibition business and
IT solution business contributed approximately RMB9.9 million, RMB40.8 million
and RMB199.0 million of revenue to the Group, respectively for the year ended 31
December 2018.
* The English translation of the Chinese names or words is for information purpose only and shall
not be regarded as the official English translation of such Chinese names or words.

9
Interest expenses
Interest expenses mainly comprised interest due on bank and other loans, Hong Kong
dollar-denominated convertible bonds, US$-denominated convertible bonds, SGD-
denominated corporate bonds and HK$-denominated corporate bonds. The Group’s
interest expenses increased by approximately 2.3% year-on-year to approximately
RMB392.3 million for the year ended 31 December 2018. As at 31 December 2018,
the Group’s balances for external funding was RMB3,288.1 million, of which bank
and other borrowings amounted to approximately RMB1,551.6 million (31 December
2017: approximately RMB1,760.1 million); and corporate bonds and convertible bonds
amounted to approximately RMB1,736.5 million (31 December 2017: approximately
RMB1,366.9 million).
Other income and gains and losses
Other income mainly comprised bank interest income, other interest income and
government grants. The Group’s other gains and losses which mainly comprised fair
value changes of financial assets/held for trading investments through profit or loss as
well as a net gain on disposal of plant and equipment and hashing power amounting to
approximately RMB547.5 million and RMB227.0 million, respectively.
Administrative and other operating expenses
The Group’s administrative and other operating expenses primarily comprised salaries
and staff welfare, intermediary handling charges for third party payment services, bank
and financing charges, sales and marketing related expenses, provision for financial
guarantee and rental expenses. As a result of a significant increase in provision for
the loan receivable in traditional loans and financing business due to the adoption of
Hong Kong Financial Reporting Standard 9 – Financial Instruments and the volatile
economic environment as well as the depreciation for crypto currencies mining computer
equipment, the Group’s administrative and other operating expenses increased by
approximately 18.4% to approximately RMB3,849.3 million for the year ended 31
December 2018.
Provision for financial guarantee represented provision made for loan amount lending
out through the loan facilitation platform, namely Weshare. The amount of provision was
computed based on historical pattern of loan delinquencies,

10
Share-based payment expenses
Share-based payment expenses of the Group for the year ended 31 December 2018
decreased by approximately 55.7% to approximately RMB71.2 million. The decrease in
such expenses represented the fair value of certain share options which were granted in
earlier years and had been amortised over the vesting periods.
Share of results of associates
Share of results of associates for the year ended 31 December 2018 decreased to a loss
of approximately RMB69.9 million. The year-on-year decrease was mainly attributable
to a share of net loss from our 21.46% equity interest in Ping An Securities Group
(Holdings) Limited, offsetting a share of net gain from our 35.0% equity interest in
Shanghai Jifu.
Loss for the year ended 31 December 2018
The loss for the year ended 31 December 2018 was approximately RMB836.4 million,
representing a decrease of approximately 176.1% year-on-year as compared to a profit of
approximately RMB1,098.4 million for the year ended 31 December 2017.
The decrease was mainly due to a decrease in turnover of approximately RMB2,259.8
million, increase in impairments on financial assets, goodwill and intangible assets
of approximately RMB1,234.6 million, RMB100.0 million, and RMB9.7 million,
respectively, offsetting decreases in tax expense and share-based payment expense of
approximately RMB422.5 million and approximately RMB89.5 million, respectively,
a gain on disposal of PPE and hashing power and disposal of an associate of
approximately RMB227.0 million and approximately RMB225.1 million, respectively,
and increases in change in fair value of preference shares of a subsidiary and financial
assets through profit or loss of approximately RMB121.6 million and RMB547.5
million, respectively.
Loss attributable to owners of the Company
Loss attributable to owners of the Company for the year ended 31 December 2018 was
approximately RMB857.6 million, a decrease of approximately 206.8% as compared
to a profit attributable to owners of the Company of approximately RMB803.0 million
for the year ended 31 December 2017. Excluding the non-recurring gain on disposal of
subsidiaries, gain on deemed disposal of subsidiaries, net loss on deemed disposal of an
associate, gain on disposal of an associate, share-based payment expenses and certain
other non-cash items, loss attributable to owners of the Company under non-generally
accepted accounting principles (“GAAP”) for the year ended 31 December 2018 was
approximately RMB966.3 million, a decrease of approximately 256.0% as compared to a
profit attributable to owners of the Company of approximately RMB619.3 million for the
year ended 31 December 2017.

11
Reconciliations of non-GAAP measures to the nearest comparable GAAP measures
The table below sets forth a reconciliation of our profit attributable to owners of the
Company to non-GAAP (loss) profit attributable to owners of the Company for the year
indicated:
For the year ended 31 December
2018 2017
(Unaudited) (Unaudited)
RMB’000 RMB’000
(Loss) profit attributable to owners of the Company (857,619) 803,013
Adjustments for:
Share-based payment expenses 71,235 160,684
Gain on disposal of subsidiaries (42,760) (408,098)
Income tax arising from gain on
deemed/disposal of subsidiaries 60,493 46,417
Net loss (gain) on deemed disposal of subsidiaries 68,563 (3,303)
Change in fair value of investment property – (2,000)
Gain on deemed disposal of an associate (5,373) –
Gain on disposal of an associate (225,050) –
Change in fair value of preference share of
a 48%-owned subsidiary (35,784) 22,563
Non-GAAP (loss) profit attributable to
owners of the Company (966,295) 619,276
The Company’s management believes that the non-GAAP financial measures provide
investors with useful supplementary information to assess the performance of the
Group’s core operations by excluding certain non-cash items and certain impact of
acquisition or disposal transactions.

12
LIQUIDITY, FINANCIAL RESOURCES AND CAPITAL STRUCTURE
During the year ended 31 December 2018, the Group’s source of funds was mainly
from cash generated from operations and new borrowings. As at 31 December 2018, the
Group had bank balances and cash of approximately RMB391.8 million (31 December
2017: approximately RMB969.2 million), of which 62.1%, 26.4%, 0.2%, 4.4% and 6.9%
were denominated in RMB, US$, SGD, VND and HK$ respectively.
MATERIAL ACQUISITIONS OR DISPOSALS OF SUBSIDIARIES AND AFFILIATED COMPANIESDuring the year ended 31 December 2018, the Group has completed the following important transactions:
– the acquisition of 100% of the equity interest in the issued share capital of K&R International from a third party independent to the Group, at a total consideration of approximately HK$109,988,000 (equivalent to approximately RMB87,946,000) satisfied by cash. K&R International is engaged in the provision of third party payment services in Hong Kong.
– the acquisition of 51% equity interest in the issued share capital of Glory Metro from a third party independent to the Group, at a total consideration of RMB178,500,000 satisfied by cash. Glory Metro is engaged in the provision of exhibition services in Hong Kong and the PRC.
– the disposal of its 100% equity interest in 上海深隆商務諮詢有限公司 to independent third parties for a total cash consideration of approximately RMB407,542,000.
– the disposal of its approximately 33.8% equity interest in Singapore Life Pte. Ltd. to an independent third party for a total cash consideration of approximately US$52,760,000 (equivalent to approximately RMB371,661,000).

13
ANNUAL RESULTS
The board of Directors (the “Board”) is pleased to announce the annual consolidated
results of the Group for the year ended 31 December 2018 together with the comparative
figures for the year ended 31 December 2017.
CONSOLIDATED STATEMENT OF PROFIT OR LOSS AND OTHER COMPREHENSIVE INCOMEFOR THE YEAR ENDED 31 DECEMBER 2018
2018 2017NOTES RMB’000 RMB’000
Turnover 4 2,545,187 4,805,010
Interest income 4 398,507 455,276Interest expenses 7 (392,343) (383,354)
Net interest income 6,164 71,922
Financial consultancy service income 4 156,453 70,685
Third party payment service income 4 360,433 338,950
Online investment and technology-enabled lending service income 4 959,723 3,334,003
Transaction verification service income 4 420,341 289,063
Gain on transfer of rights on interests on loan receivables 4 – 31,132
Other 4 249,730 285,901
2,152,844 4,421,656
Other income 6 49,397 32,829Other gains and losses 822,583 20,625Administrative and other operating expenses (3,849,258) (3,250,302)Gain on disposal of a subsidiary 42,760 408,098Net (loss) gain on deemed disposal of
subsidiaries (68,563) 3,303Gain on deemed disposal of associates 5,373 –Gain on disposal of an associate 225,050 –Change in fair value of crypto currencies (122,874) 53,346Change in fair value of investment property – 2,000Change in fair value of preference share of
a subsidiary 74,551 (47,007)Share-based payment expenses (71,235) (160,684)Share of results of associates (69,908) 64,283
(Loss) profit before tax 8 (809,280) 1,548,147Income tax 9 (27,161) (449,699)
(Loss) profit for the year (836,441) 1,098,448

14
Other comprehensive (expense) incomeItems that may be reclassified subsequently
to profit or loss:Exchange differences on translating foreign
operations (32,367) (82,160)
Share of other comprehensive income
(expense) of associates 8,979 (3,490)
Change in fair value of financial assets at
fair value through other comprehensive
expense (224,256) –
Other comprehensive expense for the year (247,644) (85,650)
Total comprehensive (expense) income for the year (1,084,085) 1,012,798
(Loss) profit for the year attributable to:Owners of the Company (857,619) 803,013
Non-controlling interests 21,178 295,435
(836,441) 1,098,448
Total comprehensive (expense) income for the year attributable to:Owners of the Company (1,095,295) 723,254
Non-controlling interests 11,210 289,544
(1,084,085) 1,012,798
RMB RMB
(Losses) earnings per share 11Basic (3.76) cents 3.65 cents
Diluted (3.76) cents 3.49 cents
2018 2017
NOTES RMB’000 RMB’000

15
CONSOLIDATED STATEMENT OF FINANCIAL POSITIONAS AT 31 DECEMBER 2018
2018 2017NOTES RMB’000 RMB’000
Non-current assetsPlant and equipment 138,070 332,009Investment property – 576,000Intangible assets 382,960 178,831Pledged bank deposits – 278,468Goodwill 1,009,590 976,382Available-for-sale investments – 429,511Financial assets at fair value through
other comprehensive income 626,690 –Deferred tax assets 122,003 –Interests in associates 1,211,520 1,457,723Interests in joint ventures 3,194 –
3,494,027 4,228,924
Current assetsInventories 9,570 10,465Financial assets at fair value through profit
or loss/held for trading investments 1,243,948 332,082Trade receivables 12 516,763 417,369Loan receivables 13 3,606,632 3,453,454Prepayments and other receivables 1,395,615 1,256,108Amounts due from joint ventures 1,683 4,666Amounts due from associates 156,217 9,004Amounts due from related companies 191,818 190,724Crypto currencies 280 224,921Tax recoverable 8,336 –Pledged bank deposits 167,242 –Bank balance – trust account 497,590 1,226,622Bank balances and cash 391,809 969,249
8,187,503 8,094,664
Current liabilitiesAccruals and other payables 14 1,387,537 858,274Funds payables and amounts due to
customers 497,590 1,226,622Amounts due to non-controlling
shareholders 1,580 1,541Amounts due to related companies 181,911 187,813Borrowings 1,516,485 1,644,958Corporate bonds 185,086 –Convertible bonds 1,172,406 269,840Preference share of a subsidiary 44,446 118,997Provision for financial guarantee 30,122 225,553Other financial liabilities – 536,000Income tax payables 340,593 385,832
5,357,756 5,455,430

16
Net current assets 2,829,747 2,639,234
Total assets less current liabilities 6,323,774 6,868,158
Non-current liabilitiesCorporate bonds 379,003 61,732
Convertible bonds – 1,035,305
Borrowings 35,128 115,200
Deferred tax liabilities 100,540 89,505
514,671 1,301,742
Net assets 5,809,103 5,566,416
Capital and reservesShare capital 385,717 373,512
Reserves 4,995,233 4,831,636
Equity attributable to owners of
the Company 5,380,950 5,205,148
Non-controlling interests 428,153 361,268
Total equity 5,809,103 5,566,416
2018 2017
RMB’000 RMB’000

17
NOTES:
1. GENERAL INFORMATION AND BASIS OF PRESENTATION
The Company was incorporated in the Cayman Islands on 4 January 2010 as an exempted company
with limited liability under the Companies Law, Cap 22 (Law 3 of 1961, as consolidated and
revised) of the Cayman Islands and its shares are listed on the GEM of The Stock Exchange of
Hong Kong Limited. Mr. Zhang Zhenxin is the substantial shareholder of the Company. The
address of the registered office and principal place of business of the Company are disclosed in the
corporate information section of the annual report.
The consolidated financial statements are presented in Renminbi (“RMB”). Other than those
subsidiaries established in the People’s Republic of China (the “PRC”) and certain subsidiaries of
which primary sources of revenues are dividend income which are derived from the operation of its
major subsidiary operating in Mainland China, whose functional currency is RMB, the functional
currency of the Company and its subsidiaries is Hong Kong dollars (“HK$”). The functional
currency of the Company is HK$, which is different from the presentation currency, RMB. As the
Company’s subsidiaries mainly operate in the PRC, apart from subsidiaries established in Vietnam
which was acquired during the year ended 31 December 2017, whose functional currency is
Vietnamese Dong (“VND”), the directors of the Company consider that it is appropriate to present
the consolidated financial statements in RMB.
The Company’s principal activities during the year are provision of consultancy service and
investment holding.
At 31 December 2018, the Group had bank balance and cash amounted approximately
RMB391,809,000 while borrowings, corporate bonds, convertible bonds totaling approximately
RMB2,873,977,000 which will be matured within the coming twelve months, and the Group’s
ability to meet these liquidity requirements depends on its ability to generate sufficient net cash
inflows from future operations and/or other sources. These facts and circumstances indicate the
existence of material uncertainties which may cast significant doubt on the Group’s ability to
continue as a going concern.
In view of these circumstances, the directors of the Company have given consideration to the
future liquidity and performance of the Group in assessing whether the Group will have sufficient
financial resources to continue as a going concern. Taking into account the Group’s cash flow
projection, including:
– Implementing various strategies to improve the cash flow status, such as managing the loan
receivable portfolio and various investments;
– Putting extra efforts on the collection of trade debtors to improve the debtors turnover days;
and
– Actively and regularly reviewing its capital structure and sourcing additional capital by
issuing bonds or new shares, where appropriate,

18
the directors of the Company consider that it has sufficient working capital to meet its financial
obligations as they fall due for at least the next twelve months from the end of the reporting period
and according, the consolidated financial statements have been prepared on a going concern basis.
2. APPLICATION OF NEW AND REVISED HONG KONG FINANCIAL REPORTING STANDARDS (“HKFRSs”)
In the current year, the Group has applied the following new and revised HKFRSs, which include
HKFRSs, Hong Kong Accounting Standards (“HKAS(s)”) and Interpretations (“Int(s)”), issued by
the Hong Kong Institute of Certified Public Accountants (the “HKICPA”).
HKFRS 9 Financial Instruments
HKFRS 15 Revenue from Contracts with Customers and related Amendments
Amendments to HKFRS 2 Classification and Measurement of Share-based Payment
Transactions
Amendments to HKFRS 4 Applying HKFRS 9 Financial Instruments with HKFRS 4
Insurance Contracts
Amendments to HKAS 28 As part of Annual Improvements to HKFRSs 2014 – 2016 Cycle
Amendments to HKAS 40 Transfers of Investment Property
HK(IFRIC)-Int 22 Foreign Currency Transactions and Advance Consideration
Except as described below, the application of other new and revised HKFRSs in the current year has
had no material impact on the Group’s financial performance and positions for the current and prior
years and/or on the disclosures set out in these consolidated financial statements.
HKFRS 15 Revenue from Contracts with Customers
HKFRS 15 superseded HKAS 11 Construction Contracts, HKAS 18 Revenue and related
interpretations and it applies to all revenue arising from contracts with customers, unless those
contracts are in the scope of other standards. The new standard established a five-step model
for determining whether, how much and when revenue is recognised. The Group has elected to
adopt the modified retrospective approach for contracts with customers that are not completed
as at the date of initial application (i.e. 1 January 2018) with the cumulative effect of initially
applying HKFRS 15 as an adjustment to the opening balance of retained earnings and comparative
information is not restated. Accordingly, certain comparative information may not be comparable as
comparative information was prepared under HKAS 18 Revenue and the related interpretations.
The Group’s accounting policies for its revenue streams are disclosed in detail in Note 3 below.
The impact of transition to HKFRS 15 was insignificant on the retained earnings at 1 January 2018.
The adoption of HKFRS 15 did not have material impact on the consolidated statement of profit
or loss and other comprehensive income for the current year and the consolidated statement of
financial position at 31 December 2018, by comparing the amounts reported under HKAS 18 and
related interpretations that were in effect before the change. The adoption of HKFRS 15 did not
have material impact on the Group’s operating, investing and financing cash flows.

19
HKFRS 9 Financial instruments
HKFRS 9 replaces the provisions of HKAS 39 that relate to the recognition, classification and
measurement of financial assets and financial liabilities, derecognition of financial instruments,
impairment of financial assets and hedge accounting. The Group has applied HKFRS 9
retrospectively to financial instruments that have not been derecognised at the date of initial
application (i.e. 1 January 2018) in accordance with the transition provisions under HKFRS 9, and
chosen not to restate comparative information. Differences in the carrying amounts of financial
assets and financial liabilities on initial application are recognised in retained earnings and other
components of equity as at 1 January 2018.
The Group’s accounting policies for the classification and measurement of financial instruments
and the impairment of financial assets are disclosed in detail in Note 3 below.
(i) Classification and measurement of financial instruments
The directors of the Company reviewed and assessed the Group’s existing financial assets
and liabilities as at 1 January 2018 based on the facts and circumstances that existed at that
date and concluded that the initial application of HKFRS 9 has had the following impact on
the Group’s financial assets and liabilities as regards their classification and measurement:
Unlisted equity investments previously classified as available-for-sale investments carried at
cost less impairment:
The Group had elected to present in other comprehensive income for the fair value
changes in respect of certain of the Group’s unlisted equity instruments amounting to
approximately RMB364,558,000 as they are held for medium or long-term strategic purpose,
and reclassified them to financial assets at fair value through other comprehensive income
(“FVTOCI”) upon initial application of HKFRS 9. The Group measures them at fair value
at the end of subsequent reporting periods with fair value gains or losses to be recognised as
other comprehensive income and accumulated in the investment revaluation reserve, which
will not be reclassified to profit or loss when they are derecognised. On initial application
of HKFRS 9, an amount of approximately RMB100,832,000 representing the difference
between the previous carrying amount and the fair value was adjusted to investments
revaluation reserve at 1 January 2018.
For the remaining available-for-sale unlisted equity investments carried at cost less
impairment amounting to approximately RMB64,953,000, the Group has not elected the
option for designation at FVTOCI and reclassified them to financial assets at fair value
through profit or loss. The Group measures them at fair value at the end of subsequent
reporting periods with fair value gains or losses to be recognised in profit or loss.
Accordingly, the difference between the previous carrying amount and the fair value relating
to these investments amounting to approximately RMB302,641,000 was adjusted to retained
profits as at 1 January 2018 upon initial application of HKFRS 9.

20
(ii) Loss allowance for expected credit losses (“ECL”)
The adoption of HKFRS 9 has changed the Group’s accounting for impairment losses
for financial assets by replacing HKAS 39’s incurred loss model with a forward-looking
expected credit loss (“ECL”) model. As at 1 January 2018, the directors of the Company
reviewed and assessed the Group’s existing financial assets and other items subject to ECL
for impairment using reasonable and supportable information that is available without undue
cost or effort in accordance with the requirement HKFRS 9.
As at 1 January 2018, an additional allowance on the Group’s loan receivables and
trade receivables of approximately RMB14,198,000 and RMB6,342,000, respectively,
have been recognised, thereby reducing the opening retained earnings of approximately
RMB15,679,000, net of their related deferred tax impact of approximately RMB4,861,000.
The table below summarises the original measurement categories under HKAS 39 and the
new measurement categories under HKFRS 9 for the Group’s financial assets and reconciles
the carrying amounts of these financial assets under HKAS 39 to the carrying amounts under
HKFRS 9 on 1 January 2018.
(iii) Summary of effects arising from initial application of HKFRS 9
Carrying amount Adoption of Adoption of Carrying amount
at 31 December HKFRS 9 – HKFRS 9 – at 1 January
2017 (HKAS 39) Reclassification Remeasurement 2018 (HKFRS 9)
RMB’000 RMB’000 RMB’000 RMB’000
Financial Assets
Loan and receivable
– Loan receivables 3,453,454 – (14,198) 3,439,256
– Trade receivables 417,369 – (6,342) 411,027
Available-for-sale (“AFS”)
investments
– Unlisted equity securities 429,511 (429,511) – –
Financial assets at FVTPL
– Unlisted equity securities – 64,953 302,641 367,594
Financial assets at FVTOCI
– Unlisted equity securities – 364,558 100,832 465,390
The table below summarises the impact of transition to HKFRS 9 on retained profits and
other components of equity at 1 January 2018.

21
Investmentrevaluation Retained
reserve profits
RMB’000 RMB’000
Balance at 31 December 2017 as originally stated – 1,677,297
Recognition of the difference between the previous
carrying amount and the fair value of the financial
assets now measured
– at FVTPL – 302,641
– at FVTOCI 100,832 –
Recognition of additional expected credit losses – (15,679)
Total changes as a result of adoption of HKFRS 9
on 1 January 2018 100,832 286,962
Balance at 1 January 2018 as restated 100,832 1,964,259
There were no financial assets or financial liabilities which the Group had previously
designated as at FVTPL under HKAS 39 that were subject to reclassification or which the
Group has elected to reclassify upon the application of HKFRS 9.
3. REVENUE RECOGNITION
Policy applicable to the year ended 31 December 2018 (with application of HKFRS 15)
Revenue is recognised to depict the transfer of promised goods or services to customers in an
amount that reflects the consideration to which the entity expects to be entitled in exchange for
those goods or services. Specifically, the Group uses a 5-step approach to revenue recognition:
Step 1: Identify the contract(s) with a customer
Step 2: Identify the performance obligations in the contract
Step 3: Determine the transaction price
Step 4: Allocate the transaction price to the performance obligations in the contract
Step 5: Recognise revenue when (or as) the entity satisfies a performance obligation.
The Group recognised revenue when (or as) a performance obligation is satisfied, i.e. when
“control” of the goods or services underlying the particular performance obligation is transferred to
customers.
A performance obligation represents a good or service (or a bundle of goods or services) that is
distinct or a series of distinct goods or services that are substantially same.

22
Control is transferred over time and revenue is recognised over time by reference to the progress
towards complete satisfaction of the relevant performance obligation if one of the following criteria
is met:
• The customer simultaneously receives and consumes the benefits provided by the Group’s
performance as the Group performs;
• The Group’s performance creates and enhances an asset that the customer controls as the
asset is created and enhanced; or
• The Group’ performance does not create an asset with an alternative use to the Group and the
Group has an enforceable right to payment for performance completed to date.
Otherwise, revenue is recognised at a point in time when the customer obtains control of the distinct
goods or service.
Revenue is measured based on the consideration specified in a contract with a customer, excludes
amounts collected on behalf of third parties, discounts and sales related taxes.
The Group recognised revenue from the following major sources:
• Provision of financing consultancy services
• Provision of third party payment service
• Provision of online investment and technology-enabled lending service
• Provision of transaction verification services
• Provision of online gaming services
• Provision of IT solution services
• Provision of exhibition services
Policy applicable to the year ended 31 December 2017
Revenue is measured at the fair value of the consideration received or receivable and represents
amount receivable for services provided in the normal course of business net of sale related taxes.
4. TURNOVER
The principal activities of the Group are provision of traditional financial services and related
financing consultancy services including entrusted loan service, real estate-backed loan service,
pawn loan service, other loan service and microfinance service, and internet financing service
including third party payment service, online investment and technology-enabled lending service
and related activities on loan portfolio management, as well as provision of social gaming services,
provision of IT solution service, provision of exhibition service and provision of transaction
verification services.

23
Turnover represents interest income (either from entrusted loans, pawn loans, real estate-backed
loans, other loans and micro loans), financial consultancy service income, third party payment
service income, online investment and technology-enabled lending service income, social gaming
service income, IT solution services income, exhibition service income, transaction verification
service income, gain on transfer of interest rights on loan receivables, net of corresponding sales
related taxes. An analysis of revenue, net is as follows:
RMB’000
For the year ended 31 December 2018Revenue from contracts with customers within the scope of HKFRS 15 Disaggregated by major products or services lines
Traditional loans and financing segment
– Financial consultancy service income 156,453
Online investment and technology-enabled lending service segment
– Online investment and technology-enabled lending service income 959,723
Others segment
– IT solution service income 199,006
– Exhibition service income 40,779
1,355,961
Third party payment service segment
– Third party payment service income 360,433
Others segment
– Social gaming service income 9,945
370,378
Total revenue from contracts with customers 1,726,339
Revenue from other sources(a) Traditional loans and financing segment
Interest income – Entrusted loan service income 57,313
Interest income – Other loan service and
real estate-backed loan service income 341,194
398,507
(b) Blockchain services segment
Blockchain services income 420,341
818,848
Turnover 2,545,187

24
Transaction price allocated to the remaining performance obligations
All sales contracts are with an original expected duration of one year or less or contracts for
which revenue is recognised at the amount to which that Group has the right to invoice for the
performance performed. Accordingly, the Group has elected the practical expedient and has
not disclosed the amount of transaction price allocated to the performance obligations that are
unsatisfied (or partially satisfied) as of the end of the reporting period.
RMB’000
For the year ended 31 December 2017Within the scope of HKAS 18 and related interpretationFinancial consultancy service income 70,685
Third party payment service income 338,950
Online investment and technology-enabled lending service income 3,334,003
Others 285,901
Revenue from other sources 4,029,539
Interest incomeEntrusted loan service income 89,126
Other loan service and real estate-backed loan service income 366,150
455,276
Transaction verification service income 289,063
Gain on transfer of rights on interests on loan receivables 31,132
Turnover 4,805,010
5. SEGMENT INFORMATION
Operating segments, and the amounts of each segment item reported in the consolidated financial
statements, are identified from the financial data and information provided regularly to the Group’s
chief operation decision maker (“CODM”), which are the most senior executive management, for
the purposes of allocating resources to, and assessing the performance of, the Group’s various lines
of business and geographical locations.

25
Specifically, the Group’s reportable segments are as follows:
1. Traditional loans and loans financing – provision of financing services in the PRC and Hong
Kong;
2. Third party payment service – provision of online third party payment services and prepaid
card issuance business;
3. Online investment and technology-enabled lending – provision of internet loan financing
service in the PRC;
4. Blockchain services – provision of transaction verification services in Hong Kong, Canada
and Georgia; and
5. Others – provision of social gaming service in the PRC, provision of IT solution services in
Vietnam and provision of exhibition services in Hong Kong and PRC.
Segment revenue and results
For the year ended 31 December 2018
Traditional loans and
loans financing
Third party payment
service
Online investment
and technology-
enabled lending service
Blockchain services Others Total
RMB’000 RMB’000 RMB’000 RMB’000 RMB’000 RMB’000
REVENUEExternal income and gain 554,960 360,433 959,723 420,341 249,730 2,545,187
Segment results (451,438) 68,042 26,719 (360,914) (218,273) (935,864)
Share of results of associates (69,908)Unallocated other income 46,610Other gains and losses 595,544Change in fair value of preference
share of a subsidiary 74,551Net loss on deemed disposal of subsidiaries (68,563)Gain on deemed disposal of associates 5,373Gain on disposal of an associate 225,050Gain on disposal of a subsidiary 42,760Share-based payment expenses (71,235)Interest expenses (183,830)Unallocated expenses (469,768)
Loss before tax (809,280)

26
For the year ended 31 December 2017
Traditional
loans and
loans
financing
Third party
payment
service
Online
investment
and
technology-
enabled
lending
service
Blockchain
services Others Total
RMB’000 RMB’000 RMB’000 RMB’000 RMB’000 RMB’000
REVENUEExternal income and gain 557,093 338,950 3,334,003 289,063 285,901 4,805,010
Segment results 104,005 186,175 851,135 216,828 45,019 1,403,162
Share of results of associates 64,283
Unallocated other income 22,537
Other gains and losses 20,625
Change in fair value of preference
share of a subsidiary (47,007)
Gain on deemed disposal of subsidiaries 3,303
Gain on disposal of subsidiaries 408,098
Share-based payment expenses (160,684)
Interest expenses (73,735)
Unallocated expenses (92,435)
Profit before tax 1,548,147
The accounting policies of the operating segments are the same as the Group’s accounting policies
described in note 3. Segment profit or loss represents profit earned by or loss from each segment
without allocation of share of results of associates, certain other income, certain other gains and
losses, gain on disposal of subsidiaries, gain on deemed disposal of subsidiaries, change in fair
value of preference share of a subsidiary, loss on disposal of an associate, net loss on deemed
disposal of associates, central administration costs, share-based payment expenses and certain
interest expenses. This is the measure reported to the CODM for the purposes of resource allocation
and performance assessment.

27
Segment assets and liabilities
The following is an analysis of the Group’s assets and liabilities by reportable and operating
segment:
Segment assets
As at 31 December2018 2017
RMB’000 RMB’000
Traditional loans and loans financing 3,781,202 3,901,174
Third party payment service 1,389,676 1,240,963
Online investment and technology-enabled lending service 2,211,918 2,874,718
Blockchain services 7,254 831,164
Others 609,679 1,040,529
Total segment assets 7,999,729 9,888,548
Unallocated corporate assets 3,681,801 2,435,040
Consolidated total assets 11,681,530 12,323,588
Segment liabilities
As at 31 December2018 2017
RMB’000 RMB’000
Traditional loans and loans financing 231,157 613,694
Third party payment service 487,924 468,291
Online investment and technology-enabled lending service 1,039,301 1,185,559
Blockchain services 8,567 11,343
Others 148,300 31,562
Total segment liabilities 1,915,249 2,310,449
Unallocated corporate liabilities 3,957,178 4,446,723
Consolidated total liabilities 5,872,427 6,757,172

28
For the purposes of monitoring segment performances and allocating resources between segments:
• all assets are allocated to operating segments other than interests in associates/joint ventures,
available-for-sale investments, FVTOCI, FVTPL, held for trading investments, amounts due
from joint ventures, amounts due from associates, amounts due from related companies,
certain bank balances and cash, deferred tax assets and income tax recoverable; and
• all liabilities are allocated to operating segments other than amounts due to non-controlling
shareholders, amounts due to related companies, certain borrowings, convertible bond,
corporate bonds, preference shares of a subsidiary, other financial liabilities, deferred tax
liabilities and income tax payables.
Other segment information
For the year ended 31 December 2018
Traditional loans and
loans financing
Third party payment
service
Online investment
and technology-
enabled lendingservice
Blockchain services Others Total
RMB’000 RMB’000 RMB’000 RMB’000 RMB’000 RMB’000
Amounts included in the measure of segment profit or loss or segment assets:
Additions to non-current assets (Note) 2,421 120,225 23,452 299,574 266,578 712,250Depreciation 324 30,479 6,494 376,057 1,831 415,185Amortisation – 875 – – 38,688 39,563Fair value change of provision for financial
guarantee – – 186,032 – – 186,032Fair value change in preference share of
a subsidiary – – (74,551) – – (74,551)Impairment recognised on intangible assets – – – – 32,889 32,889Impairment recognised on amounts due
from a joint venture – – – – 2,951 2,951Net impairment recognised
on amounts due from an associate – – – – 403,850 403,850Net impairment recognised
on trade receivables 64,004 200 (149) – 64,089 128,144Net impairment recognised
on other receivables (4,744) – – 187,553 – 182,809Net impairment recognised
on loan receivables 595,244 – – – – 595,244Gain on disposal of hashing power – – – (232,669) – (232,669)Net loss on disposal of plant and equipment – – 13,301 (7,671) – 5,630

29
For the year ended 31 December 2017
Traditional
loans and
loans
financing
Third party
payment
service
Online
investment
and
technology-
enabled
lending
service
Blockchain
services Others Total
RMB’000 RMB’000 RMB’000 RMB’000 RMB’000 RMB’000
Amounts included in the measure of segment profit or loss or segment assets:
Additions to non-current assets (Note) 38,446 79,397 13,056 245,752 115,531 492,182
Depreciation 839 15,279 2,899 64,070 415 83,502
Amortisation – – – – 60,707 60,707
Fair value change of provision
for financial guarantee – – 1,283,428 – – 1,283,428
Fair value change in preference share of
a subsidiary – – 47,007 – – 47,007
Impairment recognised on intangible assets – – – – 23,223 23,223
Impairment recognised on amounts due
from joint ventures – – – – 4,074 4,074
Impairment recognised on other receivables 24,414 – – – – 24,414
Impairment recognised on loan receivables 49,929 – – – – 49,929
Net loss on disposal/written off of
plant and equipment 1,854 – – – – 1,854
Note:
Non-current assets included plant and equipment, investment property, goodwill and intangible
assets for the years ended 31 December 2018 and 2017.
Geographical information
Information about the Group’s revenue from external customers is presented based on the location
of customers. Information about the Group’s non-current assets other than financial instruments and
deferred tax assets, is presented based on the geographical location of the assets.
Revenue fromexternal customers Non-current assets
For the year ended 31 December As at 31 December2018 2017 2018 2017
RMB’000 RMB’000 RMB’000 RMB’000
PRC 1,585,362 4,005,233 2,529,485 2,830,733
Hong Kong 246,771 334,827 117,720 255,461
Vietnam 211,646 175,886 95,023 86,919
Georgia 264,744 227,873 – 189,396
Others * 236,664 61,191 3,106 158,436
2,545,187 4,805,010 2,745,334 3,520,945
* Others include Canada and Singapore.

30
Information about major customers
None of the customers accounting for 10% or more of aggregate revenue of the Group during the
years ended 31 December 2018 and 2017.
6. OTHER INCOME
For the year ended 31 December2018 2017
RMB’000 RMB’000
Government grants (Note) 23,872 2,747
Bank interest income 10,335 8,573
Interest income on convertible bond 804 –
Dividend income from held for trading investments – 6,834
Other interest income 12,403 11,217
Others 1,983 3,458
49,397 32,829
Note:
Government grants in respect of encouragement of expansion of enterprise were recognised at the
time the Group fulfilled the relevant granting criteria.
7. INTEREST EXPENSES
For the year ended 31 December2018 2017
RMB’000 RMB’000
Interest on bank and other borrowings 177,729 172,181
Interest on corporate bonds 58,397 8,431
Interest on convertible bonds 156,217 202,742
392,343 383,354

31
8. (LOSS) PROFIT BEFORE TAX
(Loss) profit before tax has been arrived at after charging (crediting):
For the year ended 31 December2018 2017
RMB’000 RMB’000
(a) Staff costs, including directors’ remunerationSalaries, wages and other benefits 328,078 282,874
Contribution to defined contribution retirement
benefits scheme 43,017 27,699
Share-based payment expenses 71,235 160,684
442,330 471,257
(b) Other itemsAuditors’ remuneration 2,740 2,557
Depreciation(included in administrative and
other operating expenses) 415,185 83,502
Amortisation (included in administrative and
other operating expenses) 39,563 60,707
Operating lease charges in respect of properties 72,650 46,511
Fair value change of provision for financial guarantee
(included in administrative and other operating
expenses) 186,032 1,283,428
Impairment loss recognised:
Net impairment recognised on loan receivables
(included in administrative and
other operating expenses) 595,244 49,929
Net impairment recognised on other receivables
(included in administrative and other
operating expenses) 182,809 24,414
Net impairment recognised on trade receivables
(included in administrative and other
operating expenses) 128,144 –
Net impairment recognised on amounts due from
a joint venture (included in administrative and
other operating expenses) 2,951 4,074
Net impairment recognised on amounts due from
an associate (included in administrative and
other operating expenses) 403,850 –
Impairment loss recognised on goodwill (included
in administrative and other operating expenses) 100,000 –
Impairment loss recognised on intangible assets
(included in administrative and
other operating expenses) 32,889 23,223
1,445,887 101,640
Net loss on written-off of plant and
equipment (included in administrative and
other operating expenses) – 1,854

32
9. INCOME TAX
Taxation in the consolidated statement of profit or loss and other comprehensive income represented:
For the year ended 31 December2018 2017
RMB’000 RMB’000
Current tax:
Provision for Hong Kong Profits Tax 4,247 10,687
Provision for PRC Enterprise Income Tax
(the “EIT”) 143,857 434,117
Provision for Vietnam Income Tax 1,621 3,276
Over-provision in prior years (1,082) –
148,643 448,080
Deferred tax (121,482) 1,619
27,161 449,699
(i) Pursuant to the rules and regulations of the Cayman Islands and the British Virgin Island (the
“BVI”), the Group is not subject to any income tax in the Cayman Islands and the BVI.
(ii) On 21 March 2018, the Hong Kong Legislative Council passed The Inland Revenue
(Amendment) (No. 7) Bill 2017 (the “Bill”) which introduces the two-tiered profits tax rates
regime. The Bill was signed into law on 28 March 2018 and was gazetted on the following
day. Under the two-tiered profits tax rates regime, the first HK$2 million of profits of
qualifying corporation will be taxed at 8.25%, and profits above HK$2 million will be taxed
at 16.5%. For the year ended 31 December 2018, Hong Kong Profits Tax of the qualified
entity of the Group is calculated in accordance with the two-tiered profits tax rates regime.
The profits of other Group entities in Hong Kong not qualifying for the two-tiered profits
tax rates regime will continue to be taxed at the flat rate of 16.5%. For the year ended
31 December 2017, Hong Kong Profits Tax was calculated at a flat rate of 16.5% of the
estimated assessable profits.
(iii) Profits of the subsidiaries established in the PRC are subject to PRC EIT.
Under the Law of the People’s Republic of China on EIT (the “EIT Law”) and
Implementation Regulation of EIT Law, the tax rate of the PRC subsidiaries is 25% for both
years.
During the years ended 31 December 2018 and 2017, several subsidiaries established in the
PRC were recognised as High Technology Enterprises and subject to PRC income tax at 15%
in accordance with the EIT Law, which will expire in the year of 2019.

33
(iv) Profits of the subsidiaries established in Vietnam are subject to Vietnam Income Tax.
In accordance with the Corporate Income Tax Law in Vietnam, the income tax rate is 20%
from 2016.
10. DIVIDENDS
Final dividend for 2018 and 2017
No dividend was paid or proposed during the year ended 31 December 2018, nor has any dividend
been proposed since the end of the reporting period (2017: nil).
11. (LOSSES) EARNINGS PER SHARE
The calculation of basic and diluted (losses) earnings per share attributable to the owners of the
Company is based on the following data:
2018 2017
RMB’000 RMB’000
(Losses) earnings
(Losses) earnings for the year attributable to the owners of
the Company for the purpose of basic and
diluted (losses) earnings per share: (857,619) 803,013
As at 31 December2018 2017
Number of shares
Weighted average number of ordinary shares for the purpose
of basic (losses) earnings per share 22,822,071,700 21,997,539,947
Effect of dilutive potential ordinary shares:
Share options issued by the Company – 940,625,091
Contingent share consideration for acquisition of Qiyuan – 95,955,037
Weighted average number of ordinary shares for the purpose
of diluted (losses) earnings per share 22,822,071,700 23,034,120,075
For the year ended 31 December 2018, the computation of diluted losses per share does not assume
the effect of outstanding share options and conversion of the Company’s outstanding convertible
bonds since their exercise would result in a decrease in losses per share.
For the year ended 31 December 2017, the computation of diluted earnings per share does not
assume the conversion of the Company’s outstanding convertible bonds since their exercise would
result in an increase in earnings per share.
As at 31 December 2018, the number of new shares of the Company which may be issued due to
the convertible bond are 1,792,039,042 shares.

34
12. TRADE RECEIVABLES
The Group allows an average credit period of 90 to 180 days to its trade customers. As at 31
December 2018, other than trade receivables of approximately RMB50,426,000 (2017: nil) which
were secured by collaterals or are guaranteed, the Group does not hold any collateral over the
remaining trade receivables. The following is an aged analysis of trade receivables net of allowance
for impairment of trade receivables presented based on the invoice date for financial consultancy
service income, P2P loan, provision of social gaming service in the PRC, provision of IT solution
services and provision of exhibition services and date of providing services for interest income and
online third party payment service income, which approximates the respective revenue recognition
dates, at the end of each reporting period and as follows:
As at 31 December2018 2017
RMB’000 RMB’000
0 – 90 days 428,073 357,762
91 – 180 days 66,063 8,134
181 – 365 days 21,273 40,028
Over 1 year 1,354 11,445
516,763 417,369
13. LOAN RECEIVABLES
As at 31 December2018 2017
RMB’000 RMB’000
Loan receivablesSecured loans
Real estate-backed loans to customers 382,017 299,322
Entrusted loans to customers 35,608 35,608
Other loans to customers 365,758 718,409
783,383 1,053,339
Unsecured loans
Entrusted loans to customers 2,159,096 822,200
Other loans to customers 1,323,596 1,627,616
Micro loans to customers 16,777 17,077
3,499,469 2,466,893
4,282,852 3,520,232
Less: Allowance for secured and unsecured loan
receivables (676,220) (66,778)
3,606,632 3,453,454

35
Loan receivables
The pawn loans to customers arising under the Group’s pawn loans business had an average loan
period of 1 to 2 years (2017: 1 to 2 years). The real estate-backed loans had an average loan period
of 60 days to 365 days (2017: 60 days to 365 days). The secured and unsecured entrusted loans to
customers arising from the Group’s entrusted loan business had an average loan period of 30 days
to 1 year (2017: 30 days to 1 year). The secured and unsecured other loans granted to customers
arising from the Group’s other loans business had an average loan period of 30 days to 2 years
(2017: 30 days to 2 years). The unsecured micro loans to customers arising from the Group’s
microfinance business had an average loan period of 1 year (2017: 1 year). The loans provided to
customers bore fixed interest rate ranging from 0.36% to 3% per month (2017: 0.33% to 3% per
month) and were repayable according to the loan agreements.
Included in the secured loan balances are loans of approximately RMB411,833,000 (2017:
RMB299,322,000) secured by real estates in the PRC, loans of RMB6,593,000 (2017:
RMB8,326,000) secured by listed shares, loans of nil (2017: RMB130,357,000) secured by
real estate in the PRC and the Company’s shares and approximately RMB212,450,000 (2017:
approximately RMB571,663,000) secured by the Company’s shares.
Included in the unsecured loan balances are loans of approximately RMB2,947,934,000 (2017:
RMB1,845,962,000) guaranteed by guarantors.
Included in the loan receivables there were balances of approximately RMB2,194,704,000 (2017:
RMB857,808,000) which represented entrusted loans to customers through licensed banks in the
PRC. In addition, no loan receivables were pledged under factoring agreements with recourse for
obtaining other loans (2017: nil).
As at 31 December 2018, the Group held collaterals with value of approximately RMB693,896,000
(2017: RMB1,737,643,000) in total over the secured financing advances to customers.
(a) Ageing analysis
As at 31 December
2018 2017
RMB’000 RMB’000
Within 90 days 846,652 569,086
91 to 180 days 263,855 233,050
181 to 365 days 1,896,701 1,031,406
Over 365 days 599,424 1,619,912
3,606,632 3,453,454
The above ageing analysis is presented based on the date of loans granted to customers.
The Group’s financing advances to customers included in the loan receivables are due as of
the due date specified in respective loan agreements.

36
14. ACCRUALS AND OTHER PAYABLES
As at 31 December2018 2017
RMB’000 RMB’000
Other payables and accrued expenses 1,300,503 834,386
Consideration payable for acquisition of
remaining interests in a subsidiary 4,455 4,545
Consideration for acquisition of a subsidiary 77,969 –
1,382,927 838,931
Financing service income receipts in advance (note) 4,610 19,343
1,387,537 858,274
Note:
Financing service income receipts in advance represents the deferred income arose from the
difference between loan receivables and the actual fund transferred to the customers at the inception
of loan granted in accordance with the respective loan agreements and the deferred income will be
recognised as interest income over the loan period.

37
CLOSURE OF REGISTER OF MEMBERS
The annual general meeting of the Company is scheduled for Tuesday, 7 May 2019 (the
“2019 AGM”). For determining the entitlement of the shareholders of the Company (the
“Shareholders”) to attend and vote at the 2019 AGM, the register of members of the
Company will be closed from Thursday, 2 May 2019 to Tuesday, 7 May 2019, both days
inclusive, during which period no transfer of the shares of the Company (the “Shares”)
will be effected. In order to qualify for attending and voting at the 2019 AGM, the non-
registered Shareholders must lodge all share transfer forms accompanied by the relevant
share certificates with the Company’s branch share registrar in Hong Kong, Tricor
Investor Services Limited, at Level 22, Hopewell Centre, 183 Queen’s Road East, Hong
Kong for registration not later than 4:30 p.m. on Tuesday, 30 April 2019.
FINAL DIVIDEND
The Board has resolved not to recommend the payment of any final dividend for the Year
(2017: Nil).
FUTURE PLANS FOR MATERIAL INVESTMENTS OR CAPITAL ASSETS AND EXPECTED SOURCES OF FUNDING
Save as disclosed under “Management Discussion and Analysis” in this announcement,
there was no specific plan for material investments or capital assets as at 31 December
2018.
CONTINGENT LIABILITIES
As at 31 December 2018, the Group had no significant contingent liabilities (31
December 2017: Nil).
CAPITAL COMMITMENTS
As at 31 December 2018, the Group had the following capital commitments:
2018 2017
RMB’000 RMB’000
Capital expenditure contracted but not
provided for in respect of:
Acquisition of plant and equipment or
intangible assets 5,624 12,242

38
FOREIGN EXCHANGE EXPOSURE
The Group operates mainly in Hong Kong and the PRC. For the operations in Hong
Kong, most of the transactions are denominated in HK$ and US dollars. The exchange
rate of US dollars against HK$ is relatively stable and the related currency exchange
risk is considered minimal. For the operations in the PRC, most of the transactions are
denominated in RMB. Given the floating level of RMB against HK$ during the period
under review, no financial instrument was used for hedging purposes.
The Group is mainly exposed to the fluctuation of HK$ against RMB as certain of its
bank balances, other borrowing and corporate bonds are denominated in HK$ which
is not the functional currency of the relevant group entities. The Group has not made
other arrangement to hedge against the exchange rate risk. However, the Directors and
management will continue to monitor the foreign exchange exposure and will consider
utilizing applicable derivatives to hedge out the exchange risk when necessary.
TREASURY POLICIES
The Group adopts a conservative approach towards its treasury policies. The Group
strives to reduce exposure to credit risk by performing ongoing credit evaluations of
the financial conditions of its customers. To manage liquidity risk, the Directors closely
monitor the Group’s liquidity position to ensure that the liquidity structure of the
Group’s assets, liabilities and commitments can meet its funding requirements.
EMPLOYEES AND REMUNERATION POLICIES
As at 31 December 2018, the Group had a total of 1,133 staff and 11 contractors (2017:
1,454 staff and 15 contractors). Total staff costs (including Directors’ emoluments)
were approximately RMB442.30 million and total share options benefit to contractors
were RMB33.7 million for the Year (2017: RMB471.3 million and RMB82.6 million,
respectively). Remuneration is determined by reference to the market conditions and the
performance, qualifications and experience of individual employees. Year-end bonuses
based on individual performance will be paid to employees as recognition of and reward
for their contributions. Other benefits include contributions to a statutory mandatory
provident fund scheme, social insurance together with housing provident funds, central
provident fund scheme and a mandatory social security for its employees in Hong
Kong, the PRC, Singapore and Vietnam, respectively. Periods training programmes were
provided to enhance the knowledge of the staff.
The Group operates a share option scheme for the purpose of providing incentives and
rewards to eligible Directors, employees and contractors of the Group, who contribute to
the success of the Group’s operations.

39
CORPORATE GOVERNANCE
The Board is of the view that the Company has complied with all the applicable code
provisions set out in the Corporate Governance Code and Corporate Governance
Report contained in Appendix 15 to the GEM Listing Rules (the “CG Code”) and all
the requirements of the GEM Listing Rules during the Year except for the following
deviation:
Code provision E.1.2 of the CG Code requires the chairman of the board of directors of
a listed issuer to attend the annual general meeting. Due to other business commitments
which must be attended by Mr. Li Mingshan (“Mr. Li”), the then chairman of the
Board (who has resigned as the chairman of the Board and a non-executive Director
of the Company (“NED”) effective from 1 March 2019), Mr. Li was not able to attend
the annual general meeting of the Company held on 8 May 2018 (the “2018 AGM”).
Mr. Phang Yew Kiat, the vice-chairman, an executive Director and the chief executive
officer of the Company, acted as the chairman of the 2018 AGM to ensure an effective
communication with the Shareholders. Mr. Li had enquired about the questions raised
and the opinions expressed by the Shareholders at the 2018 AGM.
Compliance with Requirements under Rule 5.05A of the GEM Listing Rules
Upon the appointment of Mr. Yang Jianhui as an executive Director on 8 November
2017, the Company did not have sufficient independent non-executive Directors (the
“INEDs”) representing at least one-third of the Board under Rule 5.05A of the GEM
Listing Rules. Immediately after the resignation of Mr. Wong Sai Hung as a NED on 5
February 2018, the Company has fulfilled the aforesaid requirement of Rule 5.05A of
the GEM Listing Rules.
Code of Conduct Regarding Securities Transactions by Directors
The Company has adopted its securities dealing code regarding dealings in the
Company’s securities by the Directors (the “Own Code”) on terms no less exacting
than the required standard of dealings set out in Rules 5.48 to 5.67 of the GEM Listing
Rules (the “Required Standard of Dealings”). A specific enquiry has been made by
the Company with each of those who were the Directors during the Year and all of
them have confirmed that they had complied with the required standards set out in the
Required Standard of Dealings and the Own Code throughout the Year.

40
No incident of non-compliance of the Required Standard of Dealings or the Own Code
by the Directors was noted by the Company.
When the Company is aware of any restricted period for dealings in the Company’s
securities, the Company will notify the Directors, senior management and relevant
employees in advance.
ISSUE OF EQUITY SECURITIES
On 31 January 2018, the Company allotted 28,768,000 ordinary shares to the subscriber
as a result of the exercise of the conversion rights for the 7% convertible bonds in the
principal amount of HK$1,000,000,000. 1,237,055,469 new shares might be issued
pursuant to the convertible bonds as at 31 December 2018.
On 8 June 2018, the Company allotted 576,923,075 ordinary shares to the subscriber
as a result of the exercise of the conversion rights for the 6% convertible bonds in the
principal amount of HK$300,000,000. No remaining number of new shares was issued
pursuant to the convertible bonds as at 31 December 2018.
PURCHASE, SALE OR REDEMPTION OF LISTED SECURITIES
The Company did not redeem any of its securities listed and traded on the Stock
Exchange, nor did the Company or any of its subsidiaries purchase or sell any of such
securities during the Year.
EVENTS AFTER THE REPORTING PERIOD
During January 2019, the Company repurchased 43,212,000 ordinary shares of the
Company in aggregate for an aggregate consideration of HK$3,840,000 (equivalent to
approximately RMB3,379,000) on the Stock Exchange and all of the purchased shares
have not been cancelled by the Company.
Save as disclosed above, the Company did not redeem any of its securities listed
and traded on the Stock Exchange, nor did the Company or any of its subsidiaries
purchase or sell any of such securities since 1 January 2019 and up to the date of this
announcement.
There has been no occurrence of events that had a significant impact on the Group’s
operation, financial and trading prospects since 31 December 2018 and up to the date of
this announcement.
41
REVIEW OF FINANCIAL INFORMATION
The audit committee of the Company, which comprises four INEDs, namely Mr. Ge
Ming (the chairman), Dr. Ou Minggang, Dr. Wang Songqi and Dr. Yin Zhongli, has
reviewed with the management the accounting principles and practices adopted by the
Group and discussed with them auditing, risk management, internal control and financial
reporting matters, including the review of the draft consolidated results of the Group for
the Year.
The figures in respect of the Group’s consolidated statement of financial position,
consolidated statement of profit or loss and comprehensive income and the related
notes thereto for the Year as set out in this announcement have been agreed by the
Group’s independent auditor, SHINEWING (HK) CPA Limited (“SHINEWING”),
to the amounts set out in the Group’s audited consolidated financial statements for
the Year. The work performed by SHINEWING in this respect did not constitute an
assurance engagement in accordance with Hong Kong Standards on Auditing, Hong
Kong Standards on Review Engagements or Hong Kong Standards on Assurance
Engagements issued by the HKICPA and consequently, no assurance has been expressed
by SHINEWING in this announcement.
EXTRACT FROM INDEPENDENT AUDITOR’S REPORT PREPARED BY THE INDEPENDENT AUDITOR
The Group would like to provide an extract from the independent auditor’s report
prepared by SHINEWING (HK) CPA Limited (the independent auditor) on the Group’s
annual financial statements for the year ended 31 December 2018 as set out below:
“Material Uncertainty Relating to Going Concern

42
We draw attention to note 1 to the consolidated financial statements, which indicates that
the Group had bank balance and cash amounted approximately RMB391,809,000, while
its borrowings, corporate bonds and convertibles bonds amounted RMB2,873,977,000
which will be due in the coming twelve months as at 31 December 2018. These
conditions, along with other matters as set forth in note 1 to the consolidated financial
statements, indicate that a material uncertainty exists that may cast significant doubt
on the Group’s ability to continue as a going concern. Our opinion is not modified in
respect of this matter.”
By Order of the Board
Chong Sing Holdings FinTech Group LimitedPhang Yew Kiat
Vice-Chairman, Chief Executive Officer andExecutive Director
Hong Kong, 26 March 2019
As at the date of this announcement, the Directors are as follows:
Executive Directors:Mr. Phang Yew Kiat (Vice-Chairman and Chief Executive Officer)Mr. Chng Swee Ho
Mr. Sheng Jia
Mr. Yang Jianhui
Non-executive Directors:Mr. Li Gang
Mr. Zhang Zhenxin
Ms. Li Shuang
Independent Non-executive Directors:Mr. Ge Ming
Dr. Ou Minggang
Dr. Wang Songqi
Dr. Yin Zhongli
This announcement will remain on the “Latest Company Announcements” page of the GEM website (www.hkgem.com) for at least 7 days from the date of its publication. This announcement will also be posted on the website of the Company (www.csfgroup.com).
![New Chong Hing Bank Limited ( ) · 2016. 3. 10. · [COPY] CERTIFICATE OF INCORPORATION I HEREBY CERTIFY that LIU CHONG HING BANK LIMITED ( ) is this day incorporated in Hong Kong](https://img.pdfslide.tips/doc/110x75/6010dc5d3e0d6b17412cb376/new-chong-hing-bank-limited-2016-3-10-copy-certificate-of-incorporation.jpg)