Embed Size (px)
DESCRIPTION
principales indicadores de ciencia y tecnologia (2015)
Citation preview
AvAilAble on line
Main S
cience and Techno
log
y Indicato
rs2015/1
Main Science and Technology IndicatorsThis biannual publication provides a set of indicators that reflect the level and structure of the efforts undertaken by oeCD member countries and seven non-member economies (Argentina, China, Romania, Russian Federation, Singapore, South Africa, Chinese Taipei) in the field of science and technology. These data include final or provisional results as well as forecasts established by government authorities. The indicators cover the resources devoted to research and development, patent families, technology balance of payments and international trade in R&D-intensive industries. Also presented are the underlying economic series used to calculate these indicators. Series are presented for a reference year and for the last six years for which data are available.
AlSo AvAIlAble on lIne
The electronic data product provides longer time series: data from 1981 onwards are included. The database is in CSv format and allows users to extract and export data, prepare customised graphs and tables, and perform their own analysis. it is also available on line at www.oecd-ilibrary.org.
volume 2015/1
Main Science and Technology Indicators
volume 2015/1
Consult this publication on line at http://dx.doi.org/10.1787/msti-v2015-1-en.
This work is published on the oeCD ilibrary, which gathers all oeCD books, periodicals and statistical databases.visit www.oecd-ilibrary.org for more information.
ISSn 2304-27612015 Subscription (2 issues)
94 2015 01 1 p 9HRMDKE*chgbai+

Main Scienceand Technology
Indicators
Volume 2015/1
This work is published on the responsibility of the Secretary-General of the OECD. The
opinions expressed and arguments employed herein do not necessarily reflect the official
views of the Organisation or of the governments of its member countries.
This document and any map included herein are without prejudice to the status of or
sovereignty over any territory, to the delimitation of international frontiers and boundaries
and to the name of any territory, city or area.
ISSN 2304-2761 (print)ISSN 2304-277X (online)
The statistical data for Israel are supplied by and under the responsibility of the relevant Israeli authorities. The useof such data by the OECD is without prejudice to the status of the Golan Heights, East Jerusalem and Israelisettlements in the West Bank under the terms of international law.
Corrigenda to OECD publications may be found on line at: www.oecd.org/publishing/corrigenda.
© OECD 2015
You can copy, download or print OECD content for your own use, and you can include excerpts from OECD publications, databases and
multimedia products in your own documents, presentations, blogs, websites and teaching materials, provided that suitable
acknowledgement of OECD as source and copyright owner is given. All requests for public or commercial use and translation rights should
be submitted to [email protected]. Requests for permission to photocopy portions of this material for public or commercial use shall be
addressed directly to the Copyright Clearance Center (CCC) at [email protected] or the Centre français d’exploitation du droit de copie (CFC)
Please cite this publication as:OECD (2015), Main Science and Technology Indicators Volume 2015 Issue 1, OECD Publishing.http://dx.doi.org/10.1787/msti-v2015-1-en
FOREWORD
MAIN SCIENCE AND TECHNOLOGY INDICATORS: VOLUME 2015/1 – © OECD 2015
3
Foreword
This publication is prepared by the Economic Analysis and Statistics (EAS) Division of the OECD
Secretariat in collaboration with the Working Party of National Experts on Science and Technology
Indicators (NESTI). It contains the main data series selected from the OECD Scientific and
Technological Indicators Database.
The first part of this publication presents key figures in the field of science and technology. These
are found in one summary table and several graphs showing the most used indicators.
The second part consists of 72 standard tables showing data series on resources devoted to
research and experimental development (R&D) and some measures of output and the impact of
scientific and technological activities. It is complemented by a description of the general methodology
used. National specifications and background economic indicators are shown in annex.
R&D dataThe OECD has been collecting R&D data for member countries on a regular basis since the
early 1960s. During the 1990s, it has also embarked on the collection of R&D data for selected non-
member economies, some of which are presented in the tables below. This publication presents
various indicators of the level and trends in total national R&D efforts. The standard expenditure
measure is the Gross Domestic Expenditure on Research and Experimental Development (GERD),
which covers all R&D carried out on national territory in the year concerned. The pattern of financing
and of performance of GERD is also presented.
Further information is given on R&D performed in the business enterprise sector. This includes
tables showing data on total business enterprise R&D carried out by the major industries concerned.
Sets of data are provided for R&D carried out in the higher education and government sectors. All the
above tables are essentially based on retrospective surveys of the units carrying out the R&D though
national forecasts have been included when available.
More up-to-date information on R&D financed by government can be derived from budget data.
These data show government R&D appropriations distinguishing firstly between defence and civil
programmes and secondly between the main objectives of civil R&D. Readers are warned that these
budget R&D data vary in coverage from those in previous tables and that these two types of data
should not be combined.
Two tables show data on R&D expenditure of foreign affiliates. These data come from the OECD
Database on Foreign Affiliates and in some cases are not directly comparable with standard
business enterprise R&D.
Measures of the output and impact of science and technologyThe publication contains no direct measures of the output of scientific and technological activities,
such as indicators based on innovation. However, three types of proxy indicators based on data
originally collected for other purposes are presented: patents, the technology balance of payments
and trade in R&D-intensive industries. While each of these indicators has its shortcomings, taken
together they may throw light on countries’ technological performances.
FOREWORD
MAIN SCIENCE AND TECHNOLOGY INDICATORS: VOLUME 2015/1 – © OECD 2015
4
Patent data can be considered as proxy measures of the output of R&D in the form of inventions.
The data presented show the total number and national percentages of triadic patent families, as
well as the number of patent applications to the EPO in two specific sectors of interest: the ICT and
biotechnology sectors.
The technology balance of payments (TBP) series are data extracted from national sources (balance
of payments or survey results) with the aim of measuring the flow of technological know-how and
services into and out of the country concerned. The OECD manual “Proposed Standard Method of
Compiling and Interpreting Technology Balance of Payments Data”, TBP Manual 1990, gives the
methodology for the international standards for compiling such data. The series quoted comprise
money paid or received for the acquisition or use of patents, licences, trademarks, designs,
inventions, know-how and closely related technical services.
Indicators of trade performance in R&D intensive industries can be used as proxy measures of the
industrial and economic impact of scientific and technological activity. The tables concerned give
trade balances and export market shares for three selected groups of R&D intensive industries:
“pharmaceuticals”, “computer, electronic and optical industry”, and “aerospace”.
ABBREVIATIONS
MAIN SCIENCE AND TECHNOLOGY INDICATORS: VOLUME 2015/1 – © OECD 2015
5
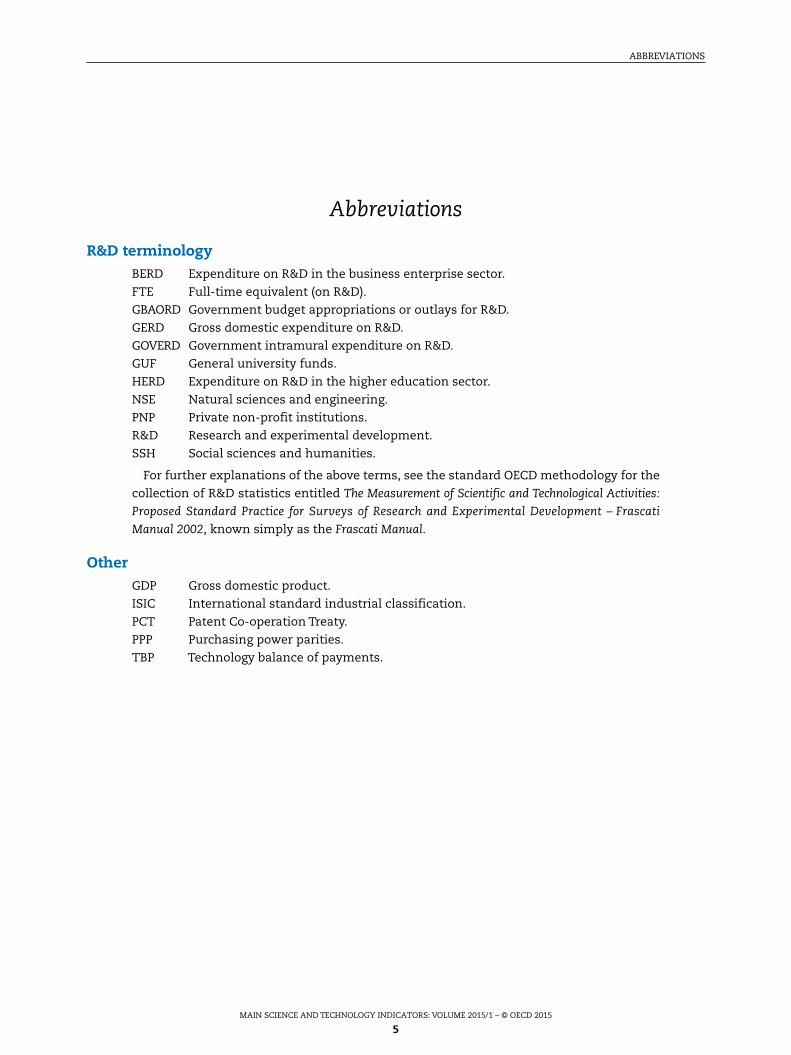
Abbreviations
R&D terminologyBERD Expenditure on R&D in the business enterprise sector.
FTE Full-time equivalent (on R&D).
GBAORD Government budget appropriations or outlays for R&D.
GERD Gross domestic expenditure on R&D.
GOVERD Government intramural expenditure on R&D.
GUF General university funds.
HERD Expenditure on R&D in the higher education sector.
NSE Natural sciences and engineering.
PNP Private non-profit institutions.
R&D Research and experimental development.
SSH Social sciences and humanities.
For further explanations of the above terms, see the standard OECD methodology for the
collection of R&D statistics entitled The Measurement of Scientific and Technological Activities:
Proposed Standard Practice for Surveys of Research and Experimental Development – Frascati
Manual 2002, known simply as the Frascati Manual.
OtherGDP Gross domestic product.
ISIC International standard industrial classification.
PCT Patent Co-operation Treaty.
PPP Purchasing power parities.
TBP Technology balance of payments.

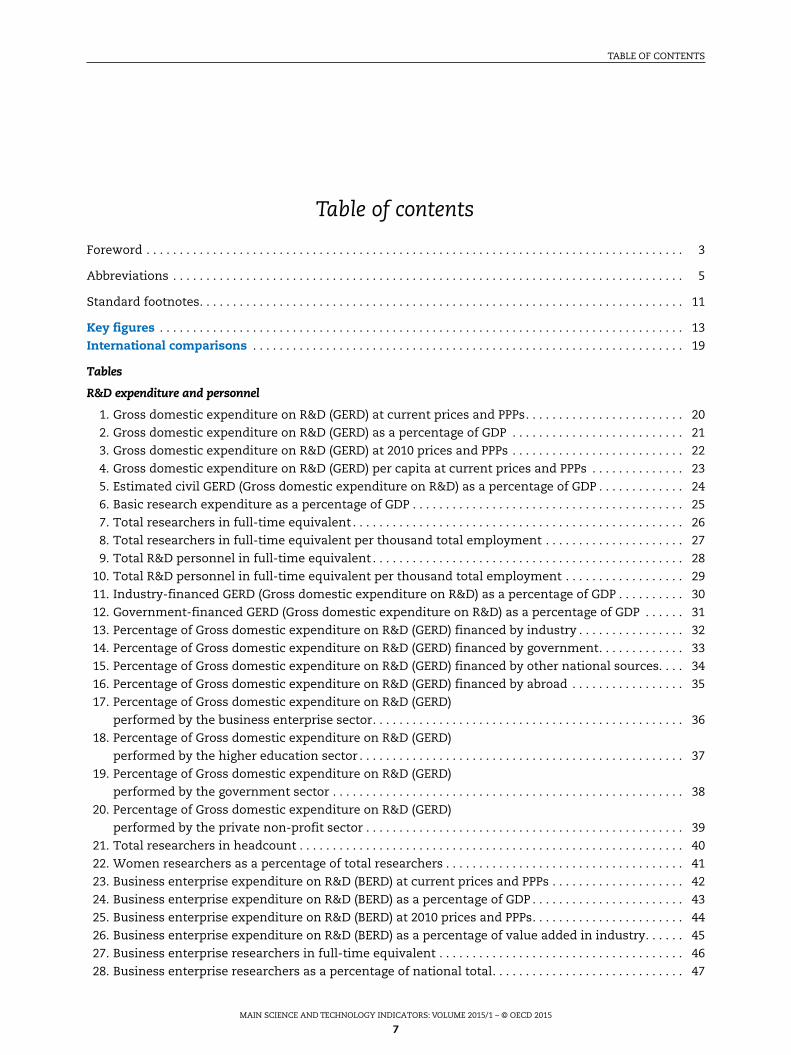
TABLE OF CONTENTS
MAIN SCIENCE AND TECHNOLOGY INDICATORS: VOLUME 2015/1 – © OECD 2015
7
Table of contents
Foreword . . . . . . . . . . . . . . . . . . . . . . . . . . . . . . . . . . . . . . . . . . . . . . . . . . . . . . . . . . . . . . . . . . . . . . . . . . . . . . . . . 3
Abbreviations . . . . . . . . . . . . . . . . . . . . . . . . . . . . . . . . . . . . . . . . . . . . . . . . . . . . . . . . . . . . . . . . . . . . . . . . . . . . . 5
Standard footnotes. . . . . . . . . . . . . . . . . . . . . . . . . . . . . . . . . . . . . . . . . . . . . . . . . . . . . . . . . . . . . . . . . . . . . . . . . 11
Key figures . . . . . . . . . . . . . . . . . . . . . . . . . . . . . . . . . . . . . . . . . . . . . . . . . . . . . . . . . . . . . . . . . . . . . . . . . . . . . . . 13
International comparisons . . . . . . . . . . . . . . . . . . . . . . . . . . . . . . . . . . . . . . . . . . . . . . . . . . . . . . . . . . . . . . . . . 19
Tables
R&D expenditure and personnel
1. Gross domestic expenditure on R&D (GERD) at current prices and PPPs. . . . . . . . . . . . . . . . . . . . . . . . 20
2. Gross domestic expenditure on R&D (GERD) as a percentage of GDP . . . . . . . . . . . . . . . . . . . . . . . . . . 21
3. Gross domestic expenditure on R&D (GERD) at 2010 prices and PPPs . . . . . . . . . . . . . . . . . . . . . . . . . . 22
4. Gross domestic expenditure on R&D (GERD) per capita at current prices and PPPs . . . . . . . . . . . . . . 23
5. Estimated civil GERD (Gross domestic expenditure on R&D) as a percentage of GDP . . . . . . . . . . . . . 24
6. Basic research expenditure as a percentage of GDP . . . . . . . . . . . . . . . . . . . . . . . . . . . . . . . . . . . . . . . . . 25
7. Total researchers in full-time equivalent . . . . . . . . . . . . . . . . . . . . . . . . . . . . . . . . . . . . . . . . . . . . . . . . . . 26
8. Total researchers in full-time equivalent per thousand total employment . . . . . . . . . . . . . . . . . . . . . 27
9. Total R&D personnel in full-time equivalent . . . . . . . . . . . . . . . . . . . . . . . . . . . . . . . . . . . . . . . . . . . . . . . 28
10. Total R&D personnel in full-time equivalent per thousand total employment . . . . . . . . . . . . . . . . . . 29
11. Industry-financed GERD (Gross domestic expenditure on R&D) as a percentage of GDP . . . . . . . . . . 30
12. Government-financed GERD (Gross domestic expenditure on R&D) as a percentage of GDP . . . . . . 31
13. Percentage of Gross domestic expenditure on R&D (GERD) financed by industry . . . . . . . . . . . . . . . . 32
14. Percentage of Gross domestic expenditure on R&D (GERD) financed by government. . . . . . . . . . . . . 33
15. Percentage of Gross domestic expenditure on R&D (GERD) financed by other national sources. . . . 34
16. Percentage of Gross domestic expenditure on R&D (GERD) financed by abroad . . . . . . . . . . . . . . . . . 35
17. Percentage of Gross domestic expenditure on R&D (GERD)
performed by the business enterprise sector. . . . . . . . . . . . . . . . . . . . . . . . . . . . . . . . . . . . . . . . . . . . . . . 36
18. Percentage of Gross domestic expenditure on R&D (GERD)
performed by the higher education sector . . . . . . . . . . . . . . . . . . . . . . . . . . . . . . . . . . . . . . . . . . . . . . . . . 37
19. Percentage of Gross domestic expenditure on R&D (GERD)
performed by the government sector . . . . . . . . . . . . . . . . . . . . . . . . . . . . . . . . . . . . . . . . . . . . . . . . . . . . . 38
20. Percentage of Gross domestic expenditure on R&D (GERD)
performed by the private non-profit sector . . . . . . . . . . . . . . . . . . . . . . . . . . . . . . . . . . . . . . . . . . . . . . . . 39
21. Total researchers in headcount . . . . . . . . . . . . . . . . . . . . . . . . . . . . . . . . . . . . . . . . . . . . . . . . . . . . . . . . . . 40
22. Women researchers as a percentage of total researchers . . . . . . . . . . . . . . . . . . . . . . . . . . . . . . . . . . . . 41
23. Business enterprise expenditure on R&D (BERD) at current prices and PPPs . . . . . . . . . . . . . . . . . . . . 42
24. Business enterprise expenditure on R&D (BERD) as a percentage of GDP . . . . . . . . . . . . . . . . . . . . . . . 43
25. Business enterprise expenditure on R&D (BERD) at 2010 prices and PPPs. . . . . . . . . . . . . . . . . . . . . . . 44
26. Business enterprise expenditure on R&D (BERD) as a percentage of value added in industry. . . . . . 45
27. Business enterprise researchers in full-time equivalent . . . . . . . . . . . . . . . . . . . . . . . . . . . . . . . . . . . . . 46
28. Business enterprise researchers as a percentage of national total. . . . . . . . . . . . . . . . . . . . . . . . . . . . . 47
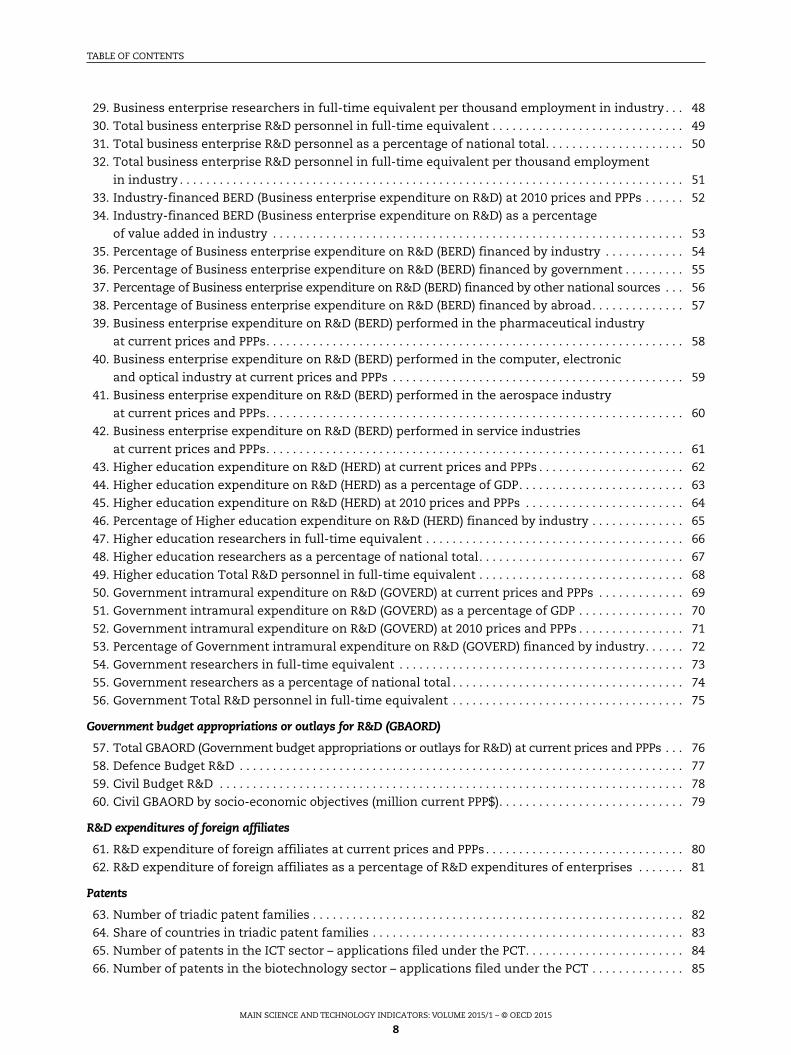
TABLE OF CONTENTS
MAIN SCIENCE AND TECHNOLOGY INDICATORS: VOLUME 2015/1 – © OECD 2015
8
29. Business enterprise researchers in full-time equivalent per thousand employment in industry . . . 48
30. Total business enterprise R&D personnel in full-time equivalent . . . . . . . . . . . . . . . . . . . . . . . . . . . . . 49
31. Total business enterprise R&D personnel as a percentage of national total. . . . . . . . . . . . . . . . . . . . . 50
32. Total business enterprise R&D personnel in full-time equivalent per thousand employment
in industry . . . . . . . . . . . . . . . . . . . . . . . . . . . . . . . . . . . . . . . . . . . . . . . . . . . . . . . . . . . . . . . . . . . . . . . . . . . . 51
33. Industry-financed BERD (Business enterprise expenditure on R&D) at 2010 prices and PPPs . . . . . . 52
34. Industry-financed BERD (Business enterprise expenditure on R&D) as a percentage
of value added in industry . . . . . . . . . . . . . . . . . . . . . . . . . . . . . . . . . . . . . . . . . . . . . . . . . . . . . . . . . . . . . . 53
35. Percentage of Business enterprise expenditure on R&D (BERD) financed by industry . . . . . . . . . . . . 54
36. Percentage of Business enterprise expenditure on R&D (BERD) financed by government . . . . . . . . . 55
37. Percentage of Business enterprise expenditure on R&D (BERD) financed by other national sources . . . 56
38. Percentage of Business enterprise expenditure on R&D (BERD) financed by abroad. . . . . . . . . . . . . . 57
39. Business enterprise expenditure on R&D (BERD) performed in the pharmaceutical industry
at current prices and PPPs. . . . . . . . . . . . . . . . . . . . . . . . . . . . . . . . . . . . . . . . . . . . . . . . . . . . . . . . . . . . . . . 58
40. Business enterprise expenditure on R&D (BERD) performed in the computer, electronic
and optical industry at current prices and PPPs . . . . . . . . . . . . . . . . . . . . . . . . . . . . . . . . . . . . . . . . . . . . 59
41. Business enterprise expenditure on R&D (BERD) performed in the aerospace industry
at current prices and PPPs. . . . . . . . . . . . . . . . . . . . . . . . . . . . . . . . . . . . . . . . . . . . . . . . . . . . . . . . . . . . . . . 60
42. Business enterprise expenditure on R&D (BERD) performed in service industries
at current prices and PPPs. . . . . . . . . . . . . . . . . . . . . . . . . . . . . . . . . . . . . . . . . . . . . . . . . . . . . . . . . . . . . . . 61
43. Higher education expenditure on R&D (HERD) at current prices and PPPs . . . . . . . . . . . . . . . . . . . . . . 62
44. Higher education expenditure on R&D (HERD) as a percentage of GDP. . . . . . . . . . . . . . . . . . . . . . . . . 63
45. Higher education expenditure on R&D (HERD) at 2010 prices and PPPs . . . . . . . . . . . . . . . . . . . . . . . . 64
46. Percentage of Higher education expenditure on R&D (HERD) financed by industry . . . . . . . . . . . . . . 65
47. Higher education researchers in full-time equivalent . . . . . . . . . . . . . . . . . . . . . . . . . . . . . . . . . . . . . . . 66
48. Higher education researchers as a percentage of national total. . . . . . . . . . . . . . . . . . . . . . . . . . . . . . . 67
49. Higher education Total R&D personnel in full-time equivalent . . . . . . . . . . . . . . . . . . . . . . . . . . . . . . . 68
50. Government intramural expenditure on R&D (GOVERD) at current prices and PPPs . . . . . . . . . . . . . 69
51. Government intramural expenditure on R&D (GOVERD) as a percentage of GDP . . . . . . . . . . . . . . . . 70
52. Government intramural expenditure on R&D (GOVERD) at 2010 prices and PPPs . . . . . . . . . . . . . . . . 71
53. Percentage of Government intramural expenditure on R&D (GOVERD) financed by industry. . . . . . 72
54. Government researchers in full-time equivalent . . . . . . . . . . . . . . . . . . . . . . . . . . . . . . . . . . . . . . . . . . . 73
55. Government researchers as a percentage of national total . . . . . . . . . . . . . . . . . . . . . . . . . . . . . . . . . . . 74
56. Government Total R&D personnel in full-time equivalent . . . . . . . . . . . . . . . . . . . . . . . . . . . . . . . . . . . 75
Government budget appropriations or outlays for R&D (GBAORD)
57. Total GBAORD (Government budget appropriations or outlays for R&D) at current prices and PPPs . . . 76
58. Defence Budget R&D . . . . . . . . . . . . . . . . . . . . . . . . . . . . . . . . . . . . . . . . . . . . . . . . . . . . . . . . . . . . . . . . . . . 77
59. Civil Budget R&D . . . . . . . . . . . . . . . . . . . . . . . . . . . . . . . . . . . . . . . . . . . . . . . . . . . . . . . . . . . . . . . . . . . . . . 78
60. Civil GBAORD by socio-economic objectives (million current PPP$). . . . . . . . . . . . . . . . . . . . . . . . . . . . 79
R&D expenditures of foreign affiliates
61. R&D expenditure of foreign affiliates at current prices and PPPs . . . . . . . . . . . . . . . . . . . . . . . . . . . . . . 80
62. R&D expenditure of foreign affiliates as a percentage of R&D expenditures of enterprises . . . . . . . 81
Patents
63. Number of triadic patent families . . . . . . . . . . . . . . . . . . . . . . . . . . . . . . . . . . . . . . . . . . . . . . . . . . . . . . . . 82
64. Share of countries in triadic patent families . . . . . . . . . . . . . . . . . . . . . . . . . . . . . . . . . . . . . . . . . . . . . . . 83
65. Number of patents in the ICT sector – applications filed under the PCT. . . . . . . . . . . . . . . . . . . . . . . . 84
66. Number of patents in the biotechnology sector – applications filed under the PCT . . . . . . . . . . . . . . 85
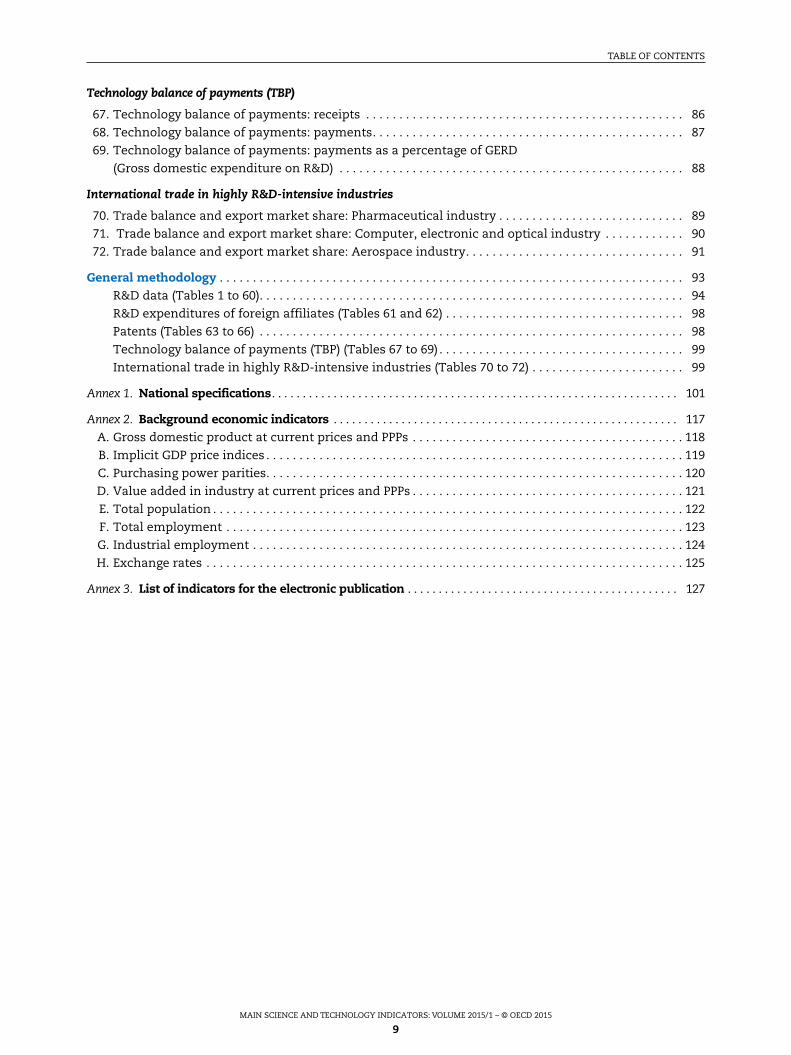
TABLE OF CONTENTS
MAIN SCIENCE AND TECHNOLOGY INDICATORS: VOLUME 2015/1 – © OECD 2015
9
Technology balance of payments (TBP)
67. Technology balance of payments: receipts . . . . . . . . . . . . . . . . . . . . . . . . . . . . . . . . . . . . . . . . . . . . . . . . 86
68. Technology balance of payments: payments. . . . . . . . . . . . . . . . . . . . . . . . . . . . . . . . . . . . . . . . . . . . . . . 87
69. Technology balance of payments: payments as a percentage of GERD
(Gross domestic expenditure on R&D) . . . . . . . . . . . . . . . . . . . . . . . . . . . . . . . . . . . . . . . . . . . . . . . . . . . . 88
International trade in highly R&D-intensive industries
70. Trade balance and export market share: Pharmaceutical industry . . . . . . . . . . . . . . . . . . . . . . . . . . . . 89
71. Trade balance and export market share: Computer, electronic and optical industry . . . . . . . . . . . . 90
72. Trade balance and export market share: Aerospace industry. . . . . . . . . . . . . . . . . . . . . . . . . . . . . . . . . 91
General methodology . . . . . . . . . . . . . . . . . . . . . . . . . . . . . . . . . . . . . . . . . . . . . . . . . . . . . . . . . . . . . . . . . . . . . . 93
R&D data (Tables 1 to 60). . . . . . . . . . . . . . . . . . . . . . . . . . . . . . . . . . . . . . . . . . . . . . . . . . . . . . . . . . . . . . . . 94
R&D expenditures of foreign affiliates (Tables 61 and 62) . . . . . . . . . . . . . . . . . . . . . . . . . . . . . . . . . . . . 98
Patents (Tables 63 to 66) . . . . . . . . . . . . . . . . . . . . . . . . . . . . . . . . . . . . . . . . . . . . . . . . . . . . . . . . . . . . . . . . 98
Technology balance of payments (TBP) (Tables 67 to 69) . . . . . . . . . . . . . . . . . . . . . . . . . . . . . . . . . . . . . 99
International trade in highly R&D-intensive industries (Tables 70 to 72) . . . . . . . . . . . . . . . . . . . . . . . 99
Annex 1. National specifications. . . . . . . . . . . . . . . . . . . . . . . . . . . . . . . . . . . . . . . . . . . . . . . . . . . . . . . . . . . . . . . . . . 101
Annex 2. Background economic indicators . . . . . . . . . . . . . . . . . . . . . . . . . . . . . . . . . . . . . . . . . . . . . . . . . . . . . . . . 117
A. Gross domestic product at current prices and PPPs . . . . . . . . . . . . . . . . . . . . . . . . . . . . . . . . . . . . . . . . . 118
B. Implicit GDP price indices . . . . . . . . . . . . . . . . . . . . . . . . . . . . . . . . . . . . . . . . . . . . . . . . . . . . . . . . . . . . . . . 119
C. Purchasing power parities. . . . . . . . . . . . . . . . . . . . . . . . . . . . . . . . . . . . . . . . . . . . . . . . . . . . . . . . . . . . . . . 120
D. Value added in industry at current prices and PPPs . . . . . . . . . . . . . . . . . . . . . . . . . . . . . . . . . . . . . . . . . 121
E. Total population . . . . . . . . . . . . . . . . . . . . . . . . . . . . . . . . . . . . . . . . . . . . . . . . . . . . . . . . . . . . . . . . . . . . . . . 122
F. Total employment . . . . . . . . . . . . . . . . . . . . . . . . . . . . . . . . . . . . . . . . . . . . . . . . . . . . . . . . . . . . . . . . . . . . . 123
G. Industrial employment . . . . . . . . . . . . . . . . . . . . . . . . . . . . . . . . . . . . . . . . . . . . . . . . . . . . . . . . . . . . . . . . . 124
H. Exchange rates . . . . . . . . . . . . . . . . . . . . . . . . . . . . . . . . . . . . . . . . . . . . . . . . . . . . . . . . . . . . . . . . . . . . . . . . 125
Annex 3. List of indicators for the electronic publication . . . . . . . . . . . . . . . . . . . . . . . . . . . . . . . . . . . . . . . . . . . . 127

STANDARD FOOTNOTES
MAIN SCIENCE AND TECHNOLOGY INDICATORS: VOLUME 2015/1 – © OECD 2015
11
Standard footnotes
a) Break in series with previous year for which data is available.
b) Secretariat estimate or projection based on national sources.
c) National estimate or projection.
d) Defence excluded (all or mostly).
e) National results adjusted by the Secretariat to meet Frascati Manual recommendations.
f) (Not currently used).
g) Excluding R&D in the social sciences and humanities.
h) Federal or central government only.
i) Excludes data for the R&D content of general payment to the higher education sector
for combined education and research (public GUF).
j) Excludes most or all capital expenditure.
k) Total intramural R&D expenditure instead of current intramural R&D expenditure.
l) Overestimated or based on overestimated data.
m) Underestimated or based on underestimated data.
n) Included elsewhere.
o) Includes other classes.
p) Provisional.
q) (Not currently used).
r) (Not currently used).
s) Unrevised breakdown not adding to the revised total.
t) Do not correspond exactly to Frascati Manual recommendations.
u) University graduates instead of researchers.
v) The sum of the breakdown does not add to the total (see General methodology).
w) Including extramural R&D expenditure.
x) Confidential.
y) Compiled according to the System of National Accounts 1993.
z) (Not currently used).


ISSN 2304-2761
Main Science and Technology Indicators: Volume 2015/1
© OECD 2015
13
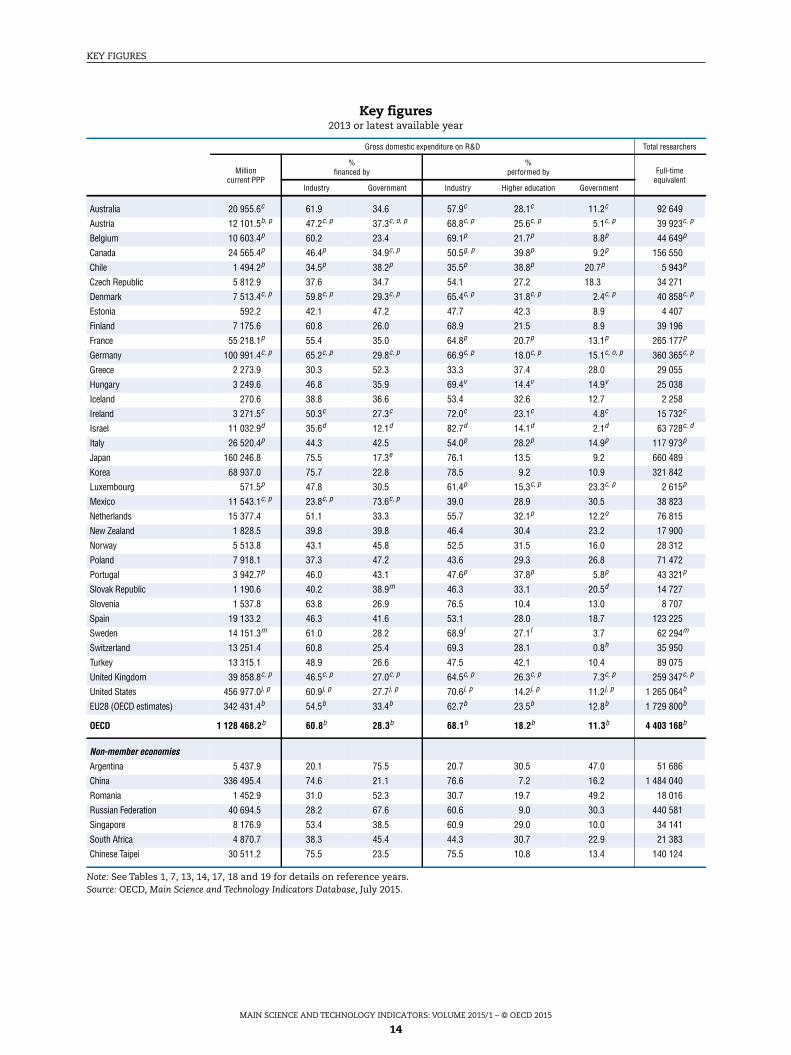
Key figures
KEY FIGURES
MAIN SCIENCE AND TECHNOLOGY INDICATORS: VOLUME 2015/1 – © OECD 2015
14
Note: See Tables 1, 7, 13, 14, 17, 18 and 19 for details on reference years.Source: OECD, Main Science and Technology Indicators Database, July 2015.
Key figures2013 or latest available year
Gross domestic expenditure on R&D Total researchers
Millioncurrent PPP
%financed by
%performed by Full-time
equivalentIndustry Government Industry Higher education Government
Australia 20 955.6c 61.9 34.6 57.9c 28.1c 11.2c 92 649
Austria 12 101.5b, p 47.2c, p 37.3c, o, p 68.8c, p 25.6c, p 5.1c, p 39 923c, p
Belgium 10 603.4p 60.2 23.4 69.1p 21.7p 8.8p 44 649p
Canada 24 565.4p 46.4p 34.9c, p 50.5g, p 39.8p 9.2p 156 550
Chile 1 494.2p 34.5p 38.2p 35.5p 38.8p 20.7p 5 943p
Czech Republic 5 812.9 37.6 34.7 54.1 27.2 18.3 34 271
Denmark 7 513.4c, p 59.8c, p 29.3c, p 65.4c, p 31.8c, p 2.4c, p 40 858c, p
Estonia 592.2 42.1 47.2 47.7 42.3 8.9 4 407
Finland 7 175.6 60.8 26.0 68.9 21.5 8.9 39 196
France 55 218.1p 55.4 35.0 64.8p 20.7p 13.1p 265 177p
Germany 100 991.4c, p 65.2c, p 29.8c, p 66.9c, p 18.0c, p 15.1c, o, p 360 365c, p
Greece 2 273.9 30.3 52.3 33.3 37.4 28.0 29 055
Hungary 3 249.6 46.8 35.9 69.4v 14.4v 14.9v 25 038
Iceland 270.6 38.8 36.6 53.4 32.6 12.7 2 258
Ireland 3 271.5c 50.3c 27.3c 72.0c 23.1c 4.8c 15 732c
Israel 11 032.9d 35.6d 12.1d 82.7d 14.1d 2.1d 63 728c, d
Italy 26 520.4p 44.3 42.5 54.0p 28.2p 14.9p 117 973p
Japan 160 246.8 75.5 17.3e 76.1 13.5 9.2 660 489
Korea 68 937.0 75.7 22.8 78.5 9.2 10.9 321 842
Luxembourg 571.5p 47.8 30.5 61.4p 15.3c, p 23.3c, p 2 615p
Mexico 11 543.1c, p 23.8c, p 73.6c, p 39.0 28.9 30.5 38 823
Netherlands 15 377.4 51.1 33.3 55.7 32.1p 12.2o 76 815
New Zealand 1 828.5 39.8 39.8 46.4 30.4 23.2 17 900
Norway 5 513.8 43.1 45.8 52.5 31.5 16.0 28 312
Poland 7 918.1 37.3 47.2 43.6 29.3 26.8 71 472
Portugal 3 942.7p 46.0 43.1 47.6p 37.8p 5.8p 43 321p
Slovak Republic 1 190.6 40.2 38.9m 46.3 33.1 20.5d 14 727
Slovenia 1 537.8 63.8 26.9 76.5 10.4 13.0 8 707
Spain 19 133.2 46.3 41.6 53.1 28.0 18.7 123 225
Sweden 14 151.3m 61.0 28.2 68.9l 27.1l 3.7 62 294m
Switzerland 13 251.4 60.8 25.4 69.3 28.1 0.8h 35 950
Turkey 13 315.1 48.9 26.6 47.5 42.1 10.4 89 075
United Kingdom 39 858.8c, p 46.5c, p 27.0c, p 64.5c, p 26.3c, p 7.3c, p 259 347c, p
United States 456 977.0j, p 60.9j, p 27.7j, p 70.6j, p 14.2j, p 11.2j, p 1 265 064b
EU28 (OECD estimates) 342 431.4b 54.5b 33.4b 62.7b 23.5b 12.8b 1 729 800b
OECD 1 128 468.2b 60.8b 28.3b 68.1b 18.2b 11.3b 4 403 168b
Non-member economies
Argentina 5 437.9 20.1 75.5 20.7 30.5 47.0 51 686
China 336 495.4 74.6 21.1 76.6 7.2 16.2 1 484 040
Romania 1 452.9 31.0 52.3 30.7 19.7 49.2 18 016
Russian Federation 40 694.5 28.2 67.6 60.6 9.0 30.3 440 581
Singapore 8 176.9 53.4 38.5 60.9 29.0 10.0 34 141
South Africa 4 870.7 38.3 45.4 44.3 30.7 22.9 21 383
Chinese Taipei 30 511.2 75.5 23.5 75.5 10.8 13.4 140 124
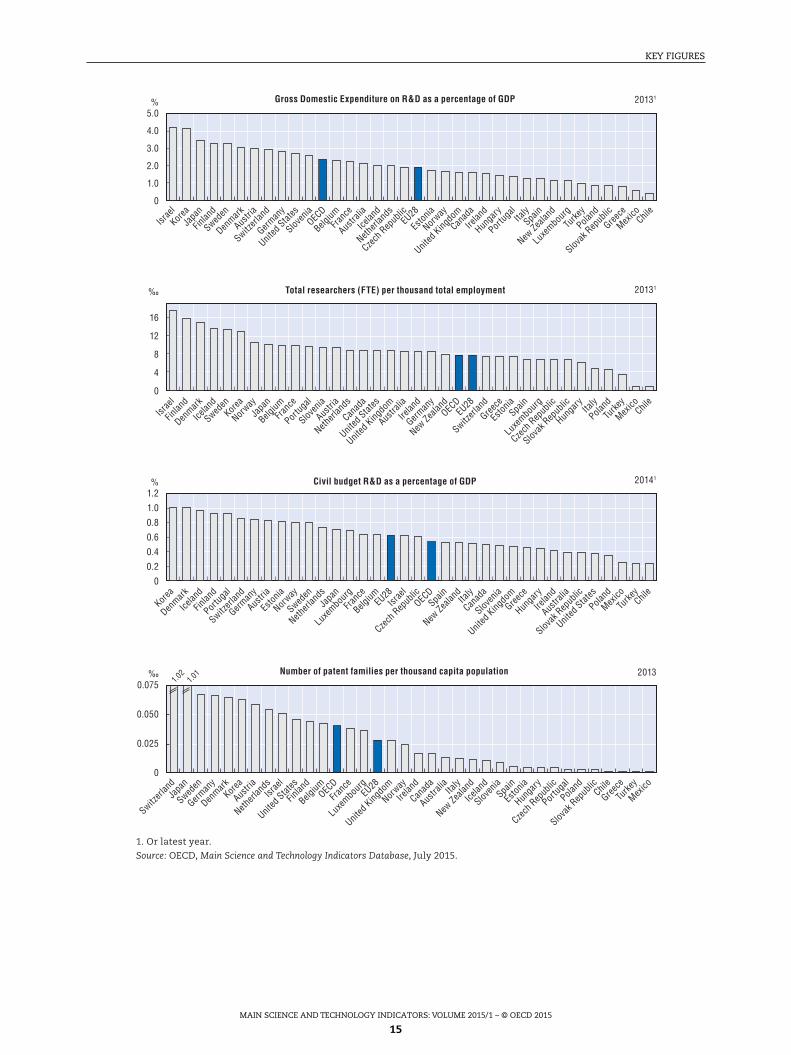
5.0
4.0
3.0
2.0
1.0
0
20131
20131
20141
2013
16
12
8
4
0
1.2
1.0
0.8
0.6
0.4
0.2
0
0.075 1.02
1.01
0.025
0.050
0
%
‰
%
‰
Gross Domestic Expenditure on R&D as a percentage of GDP
Total researchers (FTE) per thousand total employment
Civil budget R&D as a percentage of GDP
Number of patent families per thousand capita population
1. Or latest year.
Source: OECD, Main Science and Technology Indicators Database, July 2015.
Korea
Israe
l
Finlan
d
Sweden
Japa
n
Denmark
Switzerl
and
Austri
a
German
y
United
States
Sloven
iaOEC
D
Belgium
Austra
lia
Franc
e
Icelan
d
Eston
ia
Netherl
ands
Czech
Rep
ublicEU
28
United
Kingdo
m
Canad
a
Irelan
d
Norway
Portug
al
Luxe
mbour
g
New Ze
aland
Hunga
rySpa
inIta
ly
Turke
y
Poland
Slovak
Rep
ublic
Greece
MexicoChil
e
Finlan
dIsr
ael
Denmark
Icelan
dKor
ea
Portug
al
Sweden
Norway
Japa
n
Belgium
Sloven
ia
Franc
e
Austri
a
United
Kingdo
m
Canad
a
Netherl
ands
Luxe
mbourg
Irelan
d
Austra
lia
United
States
New Ze
aland
Greece
Switzerl
and
OECD
Spain
Slovak
Rep
ublic
German
y
Czech
Rep
ublic
Eston
ia
Hunga
ryEU
28 Italy
Poland
Turke
y
MexicoChil
e
Denmark
Korea
Icelan
d
Finlan
d
Austri
a
Switzerl
and
Eston
ia
Sweden
German
y
Portug
al
Norway
Netherl
andsJa
pan
Belgium OEC
DEU
28
Czech
Rep
ublic
Luxe
mbour
g
Sloven
iaIta
lyIsr
ael
United
Kingdo
m
Canad
a
New Ze
aland
Spain
Greece
Irelan
d
Austra
lia
Hunga
ry
United
States
Slovak
Rep
ublic
Franc
e
Poland
Mexico Chil
e
Turke
y
Japa
n
Switzerl
and
Sweden
German
y
United
States
Israe
lKor
ea
Belgium
Denmark
Netherl
ands
Luxe
mbourg
Austri
a
Franc
e
Finlan
dOEC
DEU
28
United
Kingdo
m
Norway
Canad
a
Irelan
d
New Ze
alandIta
ly
Austra
lia
Icelan
d
Eston
iaSpa
in
Hunga
ry
Sloven
ia
Portug
al
Slovak
Rep
ublic
Czech
Rep
ublic
Turke
yChil
e
Poland
Greece
Mexico
KEY FIGURES
MAIN SCIENCE AND TECHNOLOGY INDICATORS: VOLUME 2015/1 – © OECD 2015
15
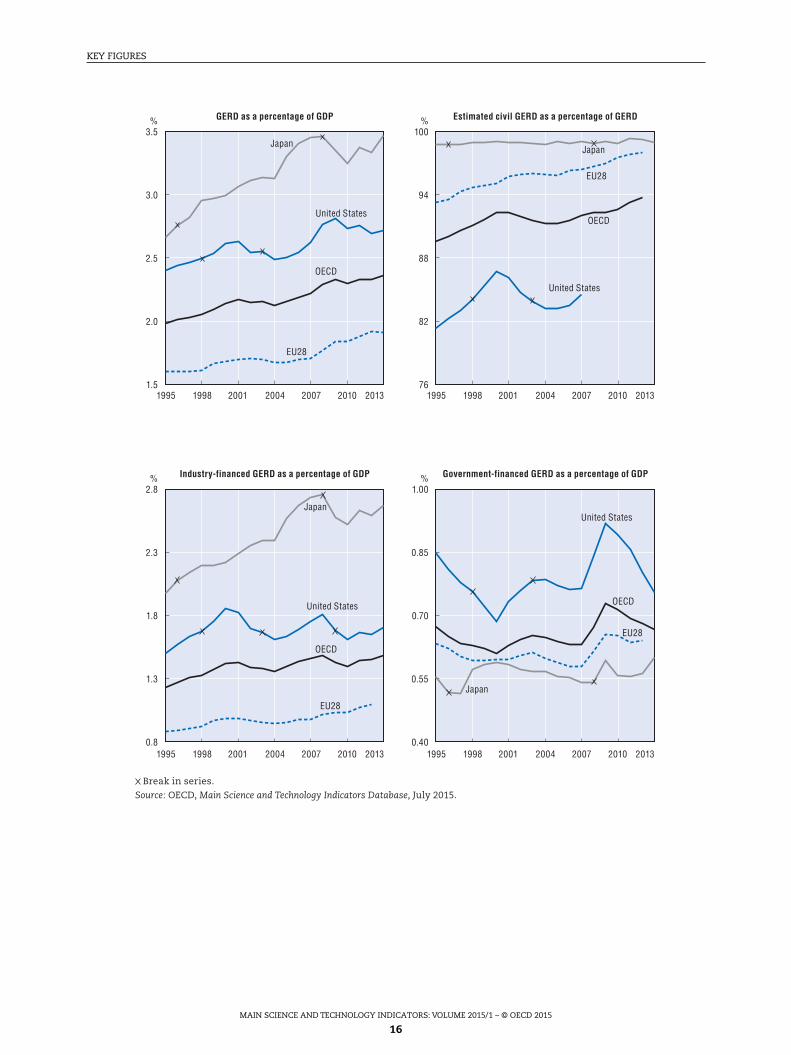
1995 1998 2001 2004 2007 2010 2013 1995 1998 2001 2004 2007 2010 2013
1995 1998 2001 2004 2007 2010 2013 1995 1998 2001 2004 2007 2010 2013
3.5
3.0
2.5
2.0
1.5
%100
94
88
82
76
%
2.8
2.3
1.8
1.3
0.8
%1.00
0.85
0.70
0.55
0.40
%
GERD as a percentage of GDP Estimated civil GERD as a percentage of GERD
Industry-financed GERD as a percentage of GDP Government-financed GERD as a percentage of GDP
United States
Japan
OECD
EU28
EU28
United States
OECD
Japan
EU28
United States
OECD
Japan
Japan
EU28
OECD
United States
Break in series.
Source: OECD, Main Science and Technology Indicators Database, July 2015.
KEY FIGURES
MAIN SCIENCE AND TECHNOLOGY INDICATORS: VOLUME 2015/1 – © OECD 2015
16
1995 1998 2001 2004 2007 2010 2013 1995 1998 2001 2004 2007 2010 2013
1995 1998 2001 2004 2007 2010 2013 1995 1998 2001 2004 2007 2010 2013
12
10
8
6
4
%2.8
2.3
1.8
1.3
0.8
%
0.47
0.42
0.37
0.32
0.27
%0.40
0.35
0.30
0.25
0.20
%
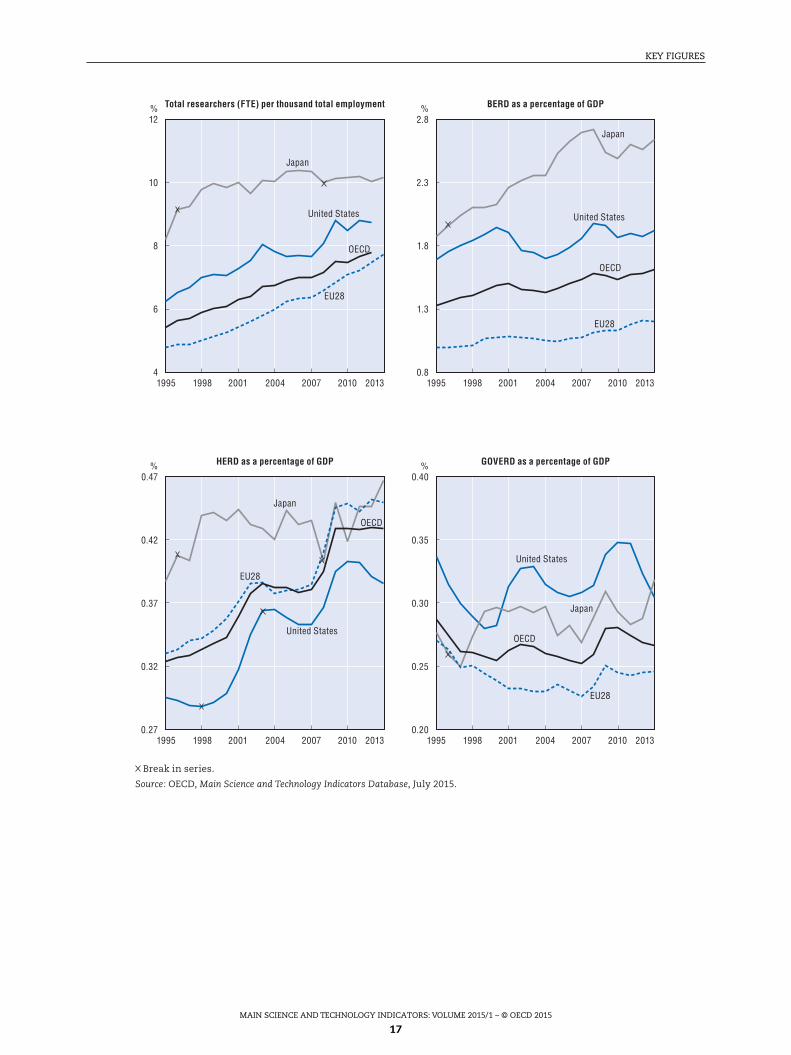
Total researchers (FTE) per thousand total employment BERD as a percentage of GDP
HERD as a percentage of GDP GOVERD as a percentage of GDP
Break in series.
Source: OECD, Main Science and Technology Indicators Database, July 2015.
United States
Japan
OECD
EU28
EU28
EU28
EU28
United States
United States
Japan
OECD
OECD
Japan
United States
OECD
Japan
KEY FIGURES
MAIN SCIENCE AND TECHNOLOGY INDICATORS: VOLUME 2015/1 – © OECD 2015
17

ISSN 2304-2761
Main Science and Technology Indicators: Volume 2015/1
© OECD 2015
19
International comparisons
MAIN SCIENCE AND TECHNOLOGY INDICATORS: VOLUME 2015/1 – © OECD 2015
20
Disclaimer: http://oe.cd/disclaimer1. Information on data for Israel:http://dx.doi.org/10.1787/888932315602Source: OECD, Main Science and Technology Indicators database, July 2015
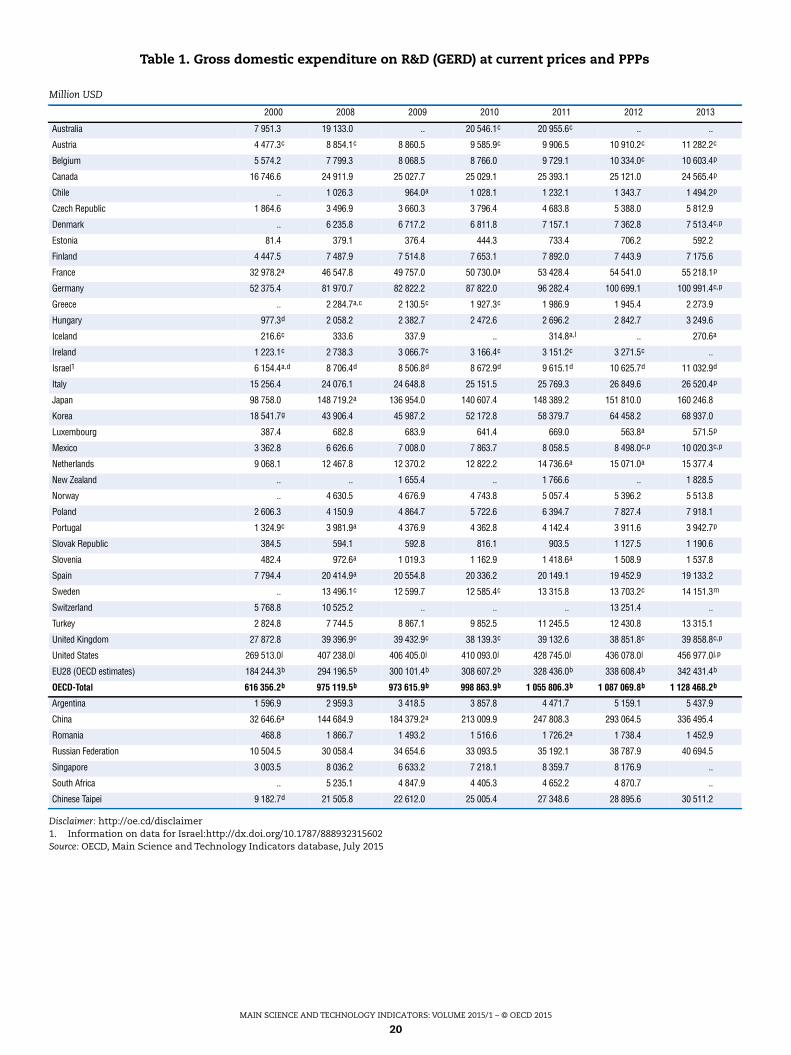
Table 1. Gross domestic expenditure on R&D (GERD) at current prices and PPPs
Million USD
2000 2008 2009 2010 2011 2012 2013
Australia 7 951.3 19 133.0 .. 20 546.1c 20 955.6c .. ..
Austria 4 477.3c 8 854.1c 8 860.5 9 585.9c 9 906.5 10 910.2c 11 282.2c
Belgium 5 574.2 7 799.3 8 068.5 8 766.0 9 729.1 10 334.0c 10 603.4p
Canada 16 746.6 24 911.9 25 027.7 25 029.1 25 393.1 25 121.0 24 565.4p
Chile .. 1 026.3 964.0a 1 028.1 1 232.1 1 343.7 1 494.2p
Czech Republic 1 864.6 3 496.9 3 660.3 3 796.4 4 683.8 5 388.0 5 812.9
Denmark .. 6 235.8 6 717.2 6 811.8 7 157.1 7 362.8 7 513.4c,p
Estonia 81.4 379.1 376.4 444.3 733.4 706.2 592.2
Finland 4 447.5 7 487.9 7 514.8 7 653.1 7 892.0 7 443.9 7 175.6
France 32 978.2a 46 547.8 49 757.0 50 730.0a 53 428.4 54 541.0 55 218.1p
Germany 52 375.4 81 970.7 82 822.2 87 822.0 96 282.4 100 699.1 100 991.4c,p
Greece .. 2 284.7a,c 2 130.5c 1 927.3c 1 986.9 1 945.4 2 273.9
Hungary 977.3d 2 058.2 2 382.7 2 472.6 2 696.2 2 842.7 3 249.6
Iceland 216.6c 333.6 337.9 .. 314.8a,l .. 270.6a
Ireland 1 223.1c 2 738.3 3 066.7c 3 166.4c 3 151.2c 3 271.5c ..
Israel1 6 154.4a,d 8 706.4d 8 506.8d 8 672.9d 9 615.1d 10 625.7d 11 032.9d
Italy 15 256.4 24 076.1 24 648.8 25 151.5 25 769.3 26 849.6 26 520.4p
Japan 98 758.0 148 719.2a 136 954.0 140 607.4 148 389.2 151 810.0 160 246.8
Korea 18 541.7g 43 906.4 45 987.2 52 172.8 58 379.7 64 458.2 68 937.0
Luxembourg 387.4 682.8 683.9 641.4 669.0 563.8a 571.5p
Mexico 3 362.8 6 626.6 7 008.0 7 863.7 8 058.5 8 498.0c,p 10 020.3c,p
Netherlands 9 068.1 12 467.8 12 370.2 12 822.2 14 736.6a 15 071.0a 15 377.4
New Zealand .. .. 1 655.4 .. 1 766.6 .. 1 828.5
Norway .. 4 630.5 4 676.9 4 743.8 5 057.4 5 396.2 5 513.8
Poland 2 606.3 4 150.9 4 864.7 5 722.6 6 394.7 7 827.4 7 918.1
Portugal 1 324.9c 3 981.9a 4 376.9 4 362.8 4 142.4 3 911.6 3 942.7p
Slovak Republic 384.5 594.1 592.8 816.1 903.5 1 127.5 1 190.6
Slovenia 482.4 972.6a 1 019.3 1 162.9 1 418.6a 1 508.9 1 537.8
Spain 7 794.4 20 414.9a 20 554.8 20 336.2 20 149.1 19 452.9 19 133.2
Sweden .. 13 496.1c 12 599.7 12 585.4c 13 315.8 13 703.2c 14 151.3m
Switzerland 5 768.8 10 525.2 .. .. .. 13 251.4 ..
Turkey 2 824.8 7 744.5 8 867.1 9 852.5 11 245.5 12 430.8 13 315.1
United Kingdom 27 872.8 39 396.9c 39 432.9c 38 139.3c 39 132.6 38 851.8c 39 858.8c,p
United States 269 513.0j 407 238.0j 406 405.0j 410 093.0j 428 745.0j 436 078.0j 456 977.0j,p
EU28 (OECD estimates) 184 244.3b 294 196.5b 300 101.4b 308 607.2b 328 436.0b 338 608.4b 342 431.4b
OECD-Total 616 356.2b 975 119.5b 973 615.9b 998 863.9b 1 055 806.3b 1 087 069.8b 1 128 468.2b
Argentina 1 596.9 2 959.3 3 418.5 3 857.8 4 471.7 5 159.1 5 437.9
China 32 646.6a 144 684.9 184 379.2a 213 009.9 247 808.3 293 064.5 336 495.4
Romania 468.8 1 866.7 1 493.2 1 516.6 1 726.2a 1 738.4 1 452.9
Russian Federation 10 504.5 30 058.4 34 654.6 33 093.5 35 192.1 38 787.9 40 694.5
Singapore 3 003.5 8 036.2 6 633.2 7 218.1 8 359.7 8 176.9 ..
South Africa .. 5 235.1 4 847.9 4 405.3 4 652.2 4 870.7 ..
Chinese Taipei 9 182.7d 21 505.8 22 612.0 25 005.4 27 348.6 28 895.6 30 511.2
MAIN SCIENCE AND TECHNOLOGY INDICATORS: VOLUME 2015/1 – © OECD 2015
21
Disclaimer: http://oe.cd/disclaimer1. Information on data for Israel:http://dx.doi.org/10.1787/888932315602Source: OECD, Main Science and Technology Indicators database, July 2015
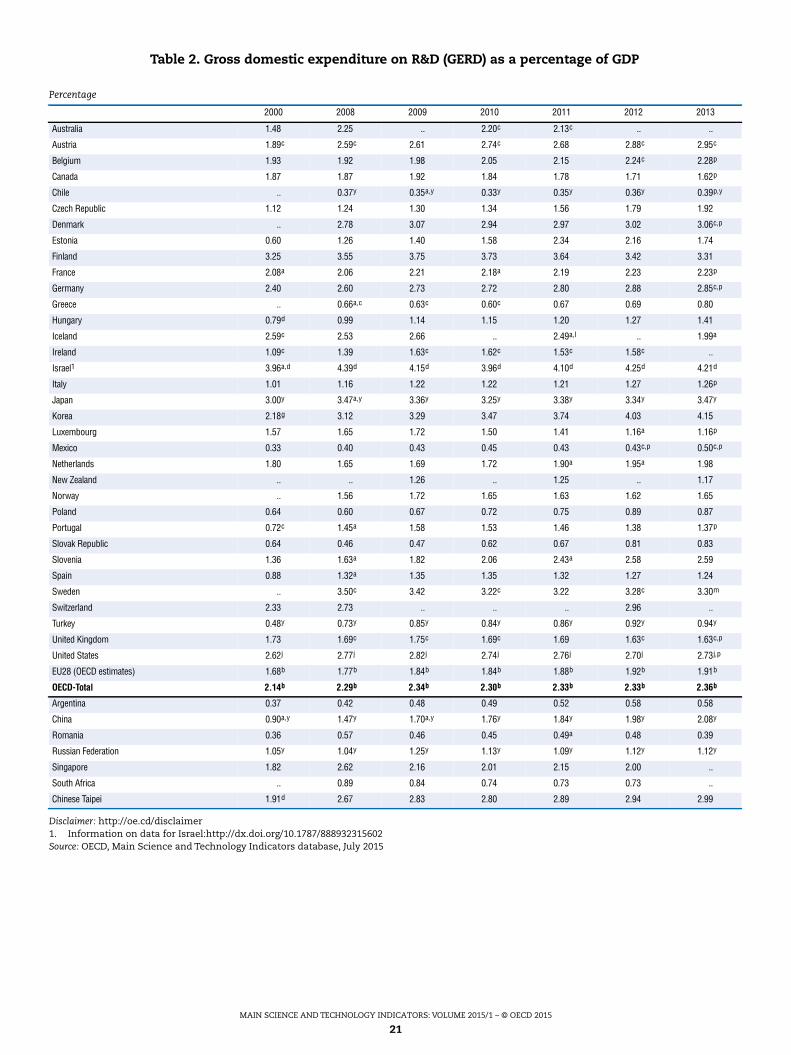
Table 2. Gross domestic expenditure on R&D (GERD) as a percentage of GDP
Percentage
2000 2008 2009 2010 2011 2012 2013
Australia 1.48 2.25 .. 2.20c 2.13c .. ..
Austria 1.89c 2.59c 2.61 2.74c 2.68 2.88c 2.95c
Belgium 1.93 1.92 1.98 2.05 2.15 2.24c 2.28p
Canada 1.87 1.87 1.92 1.84 1.78 1.71 1.62p
Chile .. 0.37y 0.35a,y 0.33y 0.35y 0.36y 0.39p,y
Czech Republic 1.12 1.24 1.30 1.34 1.56 1.79 1.92
Denmark .. 2.78 3.07 2.94 2.97 3.02 3.06c,p
Estonia 0.60 1.26 1.40 1.58 2.34 2.16 1.74
Finland 3.25 3.55 3.75 3.73 3.64 3.42 3.31
France 2.08a 2.06 2.21 2.18a 2.19 2.23 2.23p
Germany 2.40 2.60 2.73 2.72 2.80 2.88 2.85c,p
Greece .. 0.66a,c 0.63c 0.60c 0.67 0.69 0.80
Hungary 0.79d 0.99 1.14 1.15 1.20 1.27 1.41
Iceland 2.59c 2.53 2.66 .. 2.49a,l .. 1.99a
Ireland 1.09c 1.39 1.63c 1.62c 1.53c 1.58c ..
Israel1 3.96a,d 4.39d 4.15d 3.96d 4.10d 4.25d 4.21d
Italy 1.01 1.16 1.22 1.22 1.21 1.27 1.26p
Japan 3.00y 3.47a,y 3.36y 3.25y 3.38y 3.34y 3.47y
Korea 2.18g 3.12 3.29 3.47 3.74 4.03 4.15
Luxembourg 1.57 1.65 1.72 1.50 1.41 1.16a 1.16p
Mexico 0.33 0.40 0.43 0.45 0.43 0.43c,p 0.50c,p
Netherlands 1.80 1.65 1.69 1.72 1.90a 1.95a 1.98
New Zealand .. .. 1.26 .. 1.25 .. 1.17
Norway .. 1.56 1.72 1.65 1.63 1.62 1.65
Poland 0.64 0.60 0.67 0.72 0.75 0.89 0.87
Portugal 0.72c 1.45a 1.58 1.53 1.46 1.38 1.37p
Slovak Republic 0.64 0.46 0.47 0.62 0.67 0.81 0.83
Slovenia 1.36 1.63a 1.82 2.06 2.43a 2.58 2.59
Spain 0.88 1.32a 1.35 1.35 1.32 1.27 1.24
Sweden .. 3.50c 3.42 3.22c 3.22 3.28c 3.30m
Switzerland 2.33 2.73 .. .. .. 2.96 ..
Turkey 0.48y 0.73y 0.85y 0.84y 0.86y 0.92y 0.94y
United Kingdom 1.73 1.69c 1.75c 1.69c 1.69 1.63c 1.63c,p
United States 2.62j 2.77j 2.82j 2.74j 2.76j 2.70j 2.73j,p
EU28 (OECD estimates) 1.68b 1.77b 1.84b 1.84b 1.88b 1.92b 1.91b
OECD-Total 2.14b 2.29b 2.34b 2.30b 2.33b 2.33b 2.36b
Argentina 0.37 0.42 0.48 0.49 0.52 0.58 0.58
China 0.90a,y 1.47y 1.70a,y 1.76y 1.84y 1.98y 2.08y
Romania 0.36 0.57 0.46 0.45 0.49a 0.48 0.39
Russian Federation 1.05y 1.04y 1.25y 1.13y 1.09y 1.12y 1.12y
Singapore 1.82 2.62 2.16 2.01 2.15 2.00 ..
South Africa .. 0.89 0.84 0.74 0.73 0.73 ..
Chinese Taipei 1.91d 2.67 2.83 2.80 2.89 2.94 2.99
MAIN SCIENCE AND TECHNOLOGY INDICATORS: VOLUME 2015/1 – © OECD 2015
22
Disclaimer: http://oe.cd/disclaimer1. Information on data for Israel:http://dx.doi.org/10.1787/888932315602Source: OECD, Main Science and Technology Indicators database, July 2015
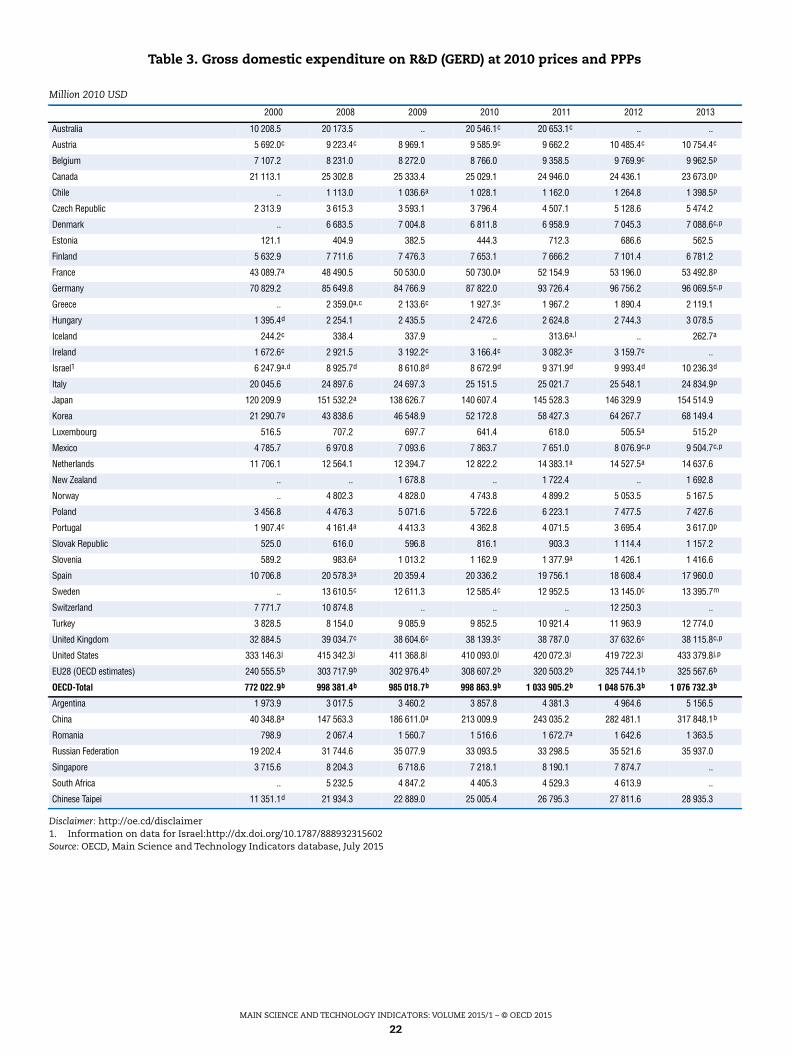
Table 3. Gross domestic expenditure on R&D (GERD) at 2010 prices and PPPs
Million 2010 USD
2000 2008 2009 2010 2011 2012 2013
Australia 10 208.5 20 173.5 .. 20 546.1c 20 653.1c .. ..
Austria 5 692.0c 9 223.4c 8 969.1 9 585.9c 9 662.2 10 485.4c 10 754.4c
Belgium 7 107.2 8 231.0 8 272.0 8 766.0 9 358.5 9 769.9c 9 962.5p
Canada 21 113.1 25 302.8 25 333.4 25 029.1 24 946.0 24 436.1 23 673.0p
Chile .. 1 113.0 1 036.6a 1 028.1 1 162.0 1 264.8 1 398.5p
Czech Republic 2 313.9 3 615.3 3 593.1 3 796.4 4 507.1 5 128.6 5 474.2
Denmark .. 6 683.5 7 004.8 6 811.8 6 958.9 7 045.3 7 088.6c,p
Estonia 121.1 404.9 382.5 444.3 712.3 686.6 562.5
Finland 5 632.9 7 711.6 7 476.3 7 653.1 7 666.2 7 101.4 6 781.2
France 43 089.7a 48 490.5 50 530.0 50 730.0a 52 154.9 53 196.0 53 492.8p
Germany 70 829.2 85 649.8 84 766.9 87 822.0 93 726.4 96 756.2 96 069.5c,p
Greece .. 2 359.0a,c 2 133.6c 1 927.3c 1 967.2 1 890.4 2 119.1
Hungary 1 395.4d 2 254.1 2 435.5 2 472.6 2 624.8 2 744.3 3 078.5
Iceland 244.2c 338.4 337.9 .. 313.6a,l .. 262.7a
Ireland 1 672.6c 2 921.5 3 192.2c 3 166.4c 3 082.3c 3 159.7c ..
Israel1 6 247.9a,d 8 925.7d 8 610.8d 8 672.9d 9 371.9d 9 993.4d 10 236.3d
Italy 20 045.6 24 897.6 24 697.3 25 151.5 25 021.7 25 548.1 24 834.9p
Japan 120 209.9 151 532.2a 138 626.7 140 607.4 145 528.3 146 329.9 154 514.9
Korea 21 290.7g 43 838.6 46 548.9 52 172.8 58 427.3 64 267.7 68 149.4
Luxembourg 516.5 707.2 697.7 641.4 618.0 505.5a 515.2p
Mexico 4 785.7 6 970.8 7 093.6 7 863.7 7 651.0 8 076.9c,p 9 504.7c,p
Netherlands 11 706.1 12 564.1 12 394.7 12 822.2 14 383.1a 14 527.5a 14 637.6
New Zealand .. .. 1 678.8 .. 1 722.4 .. 1 692.8
Norway .. 4 802.3 4 828.0 4 743.8 4 899.2 5 053.5 5 167.5
Poland 3 456.8 4 476.3 5 071.6 5 722.6 6 223.1 7 477.5 7 427.6
Portugal 1 907.4c 4 161.4a 4 413.3 4 362.8 4 071.5 3 695.4 3 617.0p
Slovak Republic 525.0 616.0 596.8 816.1 903.3 1 114.4 1 157.2
Slovenia 589.2 983.6a 1 013.2 1 162.9 1 377.9a 1 426.1 1 416.6
Spain 10 706.8 20 578.3a 20 359.4 20 336.2 19 756.1 18 608.4 17 960.0
Sweden .. 13 610.5c 12 611.3 12 585.4c 12 952.5 13 145.0c 13 395.7m
Switzerland 7 771.7 10 874.8 .. .. .. 12 250.3 ..
Turkey 3 828.5 8 154.0 9 085.9 9 852.5 10 921.4 11 963.9 12 774.0
United Kingdom 32 884.5 39 034.7c 38 604.6c 38 139.3c 38 787.0 37 632.6c 38 115.8c,p
United States 333 146.3j 415 342.3j 411 368.8j 410 093.0j 420 072.3j 419 722.3j 433 379.8j,p
EU28 (OECD estimates) 240 555.5b 303 717.9b 302 976.4b 308 607.2b 320 503.2b 325 744.1b 325 567.6b
OECD-Total 772 022.9b 998 381.4b 985 018.7b 998 863.9b 1 033 905.2b 1 048 576.3b 1 076 732.3b
Argentina 1 973.9 3 017.5 3 460.2 3 857.8 4 381.3 4 964.6 5 156.5
China 40 348.8a 147 563.3 186 611.0a 213 009.9 243 035.2 282 481.1 317 848.1b
Romania 798.9 2 067.4 1 560.7 1 516.6 1 672.7a 1 642.6 1 363.5
Russian Federation 19 202.4 31 744.6 35 077.9 33 093.5 33 298.5 35 521.6 35 937.0
Singapore 3 715.6 8 204.3 6 718.6 7 218.1 8 190.1 7 874.7 ..
South Africa .. 5 232.5 4 847.2 4 405.3 4 529.3 4 613.9 ..
Chinese Taipei 11 351.1d 21 934.3 22 889.0 25 005.4 26 795.3 27 811.6 28 935.3
MAIN SCIENCE AND TECHNOLOGY INDICATORS: VOLUME 2015/1 – © OECD 2015
23
Disclaimer: http://oe.cd/disclaimer1. Information on data for Israel:http://dx.doi.org/10.1787/888932315602Source: OECD, Main Science and Technology Indicators database, July 2015
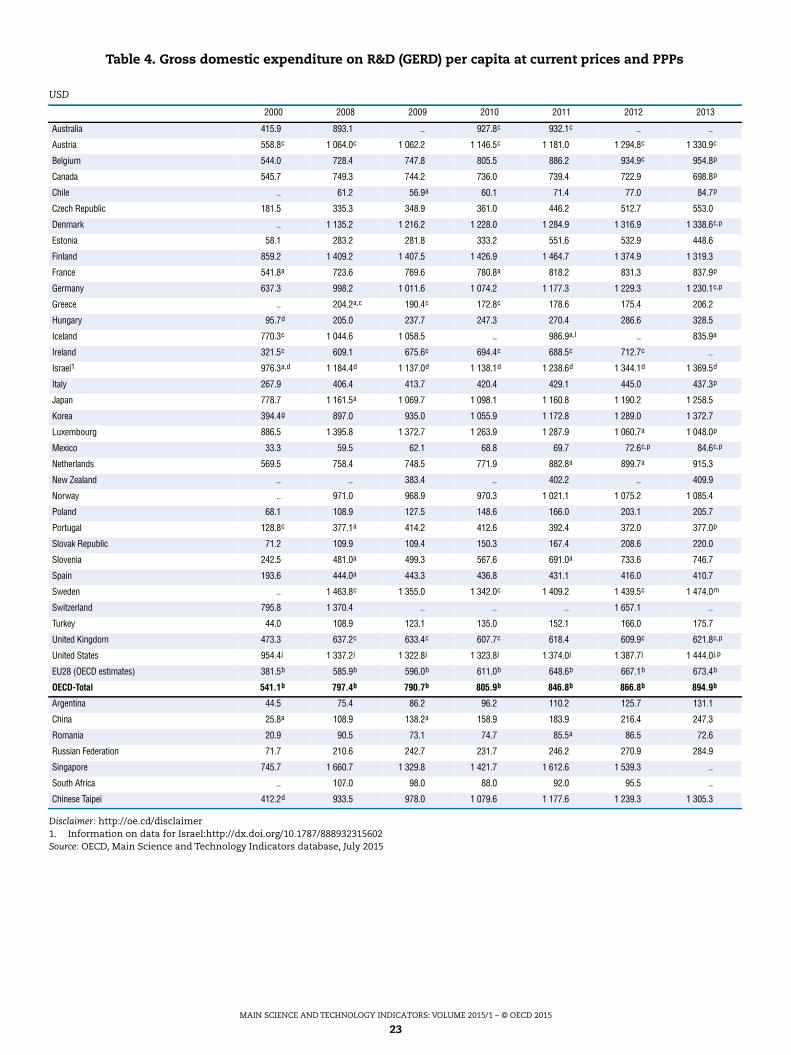
Table 4. Gross domestic expenditure on R&D (GERD) per capita at current prices and PPPs
USD
2000 2008 2009 2010 2011 2012 2013
Australia 415.9 893.1 .. 927.8c 932.1c .. ..
Austria 558.8c 1 064.0c 1 062.2 1 146.5c 1 181.0 1 294.8c 1 330.9c
Belgium 544.0 728.4 747.8 805.5 886.2 934.9c 954.8p
Canada 545.7 749.3 744.2 736.0 739.4 722.9 698.8p
Chile .. 61.2 56.9a 60.1 71.4 77.0 84.7p
Czech Republic 181.5 335.3 348.9 361.0 446.2 512.7 553.0
Denmark .. 1 135.2 1 216.2 1 228.0 1 284.9 1 316.9 1 338.6c,p
Estonia 58.1 283.2 281.8 333.2 551.6 532.9 448.6
Finland 859.2 1 409.2 1 407.5 1 426.9 1 464.7 1 374.9 1 319.3
France 541.8a 723.6 769.6 780.8a 818.2 831.3 837.9p
Germany 637.3 998.2 1 011.6 1 074.2 1 177.3 1 229.3 1 230.1c,p
Greece .. 204.2a,c 190.4c 172.8c 178.6 175.4 206.2
Hungary 95.7d 205.0 237.7 247.3 270.4 286.6 328.5
Iceland 770.3c 1 044.6 1 058.5 .. 986.9a,l .. 835.9a
Ireland 321.5c 609.1 675.6c 694.4c 688.5c 712.7c ..
Israel1 976.3a,d 1 184.4d 1 137.0d 1 138.1d 1 238.6d 1 344.1d 1 369.5d
Italy 267.9 406.4 413.7 420.4 429.1 445.0 437.3p
Japan 778.7 1 161.5a 1 069.7 1 098.1 1 160.8 1 190.2 1 258.5
Korea 394.4g 897.0 935.0 1 055.9 1 172.8 1 289.0 1 372.7
Luxembourg 886.5 1 395.8 1 372.7 1 263.9 1 287.9 1 060.7a 1 048.0p
Mexico 33.3 59.5 62.1 68.8 69.7 72.6c,p 84.6c,p
Netherlands 569.5 758.4 748.5 771.9 882.8a 899.7a 915.3
New Zealand .. .. 383.4 .. 402.2 .. 409.9
Norway .. 971.0 968.9 970.3 1 021.1 1 075.2 1 085.4
Poland 68.1 108.9 127.5 148.6 166.0 203.1 205.7
Portugal 128.8c 377.1a 414.2 412.6 392.4 372.0 377.0p
Slovak Republic 71.2 109.9 109.4 150.3 167.4 208.6 220.0
Slovenia 242.5 481.0a 499.3 567.6 691.0a 733.6 746.7
Spain 193.6 444.0a 443.3 436.8 431.1 416.0 410.7
Sweden .. 1 463.8c 1 355.0 1 342.0c 1 409.2 1 439.5c 1 474.0m
Switzerland 795.8 1 370.4 .. .. .. 1 657.1 ..
Turkey 44.0 108.9 123.1 135.0 152.1 166.0 175.7
United Kingdom 473.3 637.2c 633.4c 607.7c 618.4 609.9c 621.8c,p
United States 954.4j 1 337.2j 1 322.8j 1 323.8j 1 374.0j 1 387.7j 1 444.0j,p
EU28 (OECD estimates) 381.5b 585.9b 596.0b 611.0b 648.6b 667.1b 673.4b
OECD-Total 541.1b 797.4b 790.7b 805.9b 846.8b 866.8b 894.9b
Argentina 44.5 75.4 86.2 96.2 110.2 125.7 131.1
China 25.8a 108.9 138.2a 158.9 183.9 216.4 247.3
Romania 20.9 90.5 73.1 74.7 85.5a 86.5 72.6
Russian Federation 71.7 210.6 242.7 231.7 246.2 270.9 284.9
Singapore 745.7 1 660.7 1 329.8 1 421.7 1 612.6 1 539.3 ..
South Africa .. 107.0 98.0 88.0 92.0 95.5 ..
Chinese Taipei 412.2d 933.5 978.0 1 079.6 1 177.6 1 239.3 1 305.3
MAIN SCIENCE AND TECHNOLOGY INDICATORS: VOLUME 2015/1 – © OECD 2015
24
Disclaimer: http://oe.cd/disclaimer1. Information on data for Israel:http://dx.doi.org/10.1787/888932315602Source: OECD, Main Science and Technology Indicators database, July 2015
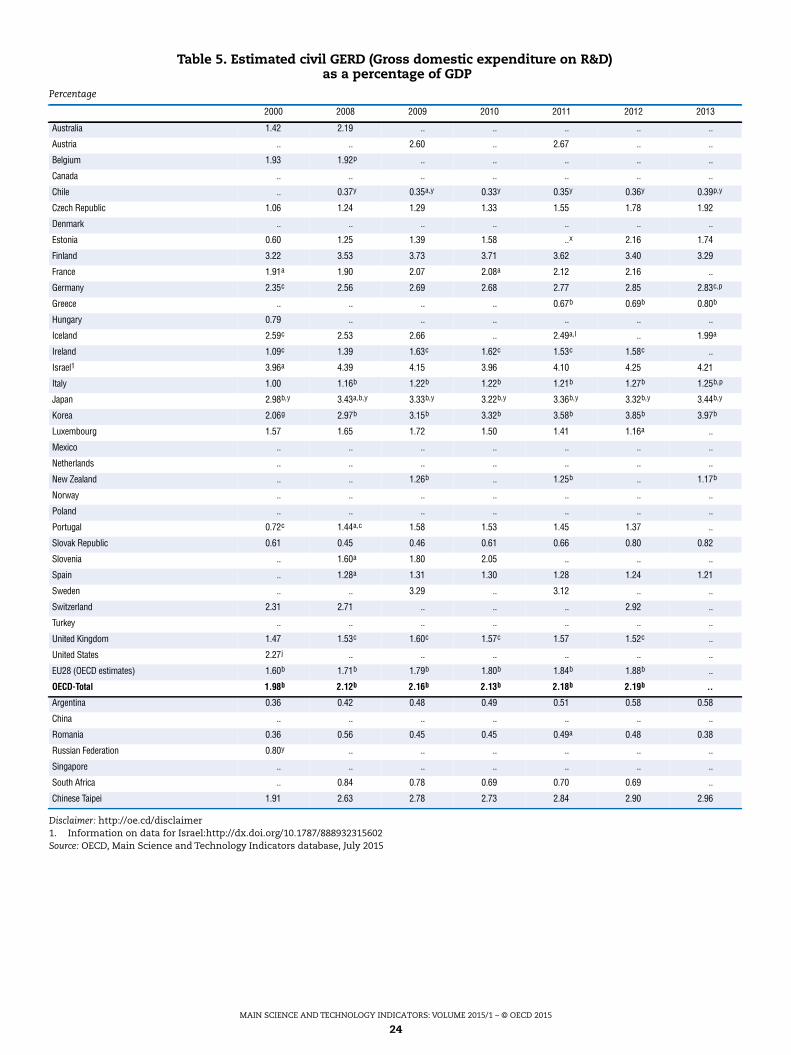
Table 5. Estimated civil GERD (Gross domestic expenditure on R&D)as a percentage of GDP
Percentage
2000 2008 2009 2010 2011 2012 2013
Australia 1.42 2.19 .. .. .. .. ..
Austria .. .. 2.60 .. 2.67 .. ..
Belgium 1.93 1.92p .. .. .. .. ..
Canada .. .. .. .. .. .. ..
Chile .. 0.37y 0.35a,y 0.33y 0.35y 0.36y 0.39p,y
Czech Republic 1.06 1.24 1.29 1.33 1.55 1.78 1.92
Denmark .. .. .. .. .. .. ..
Estonia 0.60 1.25 1.39 1.58 ..x 2.16 1.74
Finland 3.22 3.53 3.73 3.71 3.62 3.40 3.29
France 1.91a 1.90 2.07 2.08a 2.12 2.16 ..
Germany 2.35c 2.56 2.69 2.68 2.77 2.85 2.83c,p
Greece .. .. .. .. 0.67b 0.69b 0.80b
Hungary 0.79 .. .. .. .. .. ..
Iceland 2.59c 2.53 2.66 .. 2.49a,l .. 1.99a
Ireland 1.09c 1.39 1.63c 1.62c 1.53c 1.58c ..
Israel1 3.96a 4.39 4.15 3.96 4.10 4.25 4.21
Italy 1.00 1.16b 1.22b 1.22b 1.21b 1.27b 1.25b,p
Japan 2.98b,y 3.43a,b,y 3.33b,y 3.22b,y 3.36b,y 3.32b,y 3.44b,y
Korea 2.06g 2.97b 3.15b 3.32b 3.58b 3.85b 3.97b
Luxembourg 1.57 1.65 1.72 1.50 1.41 1.16a ..
Mexico .. .. .. .. .. .. ..
Netherlands .. .. .. .. .. .. ..
New Zealand .. .. 1.26b .. 1.25b .. 1.17b
Norway .. .. .. .. .. .. ..
Poland .. .. .. .. .. .. ..
Portugal 0.72c 1.44a,c 1.58 1.53 1.45 1.37 ..
Slovak Republic 0.61 0.45 0.46 0.61 0.66 0.80 0.82
Slovenia .. 1.60a 1.80 2.05 .. .. ..
Spain .. 1.28a 1.31 1.30 1.28 1.24 1.21
Sweden .. .. 3.29 .. 3.12 .. ..
Switzerland 2.31 2.71 .. .. .. 2.92 ..
Turkey .. .. .. .. .. .. ..
United Kingdom 1.47 1.53c 1.60c 1.57c 1.57 1.52c ..
United States 2.27j .. .. .. .. .. ..
EU28 (OECD estimates) 1.60b 1.71b 1.79b 1.80b 1.84b 1.88b ..
OECD-Total 1.98b 2.12b 2.16b 2.13b 2.18b 2.19b ..
Argentina 0.36 0.42 0.48 0.49 0.51 0.58 0.58
China .. .. .. .. .. .. ..
Romania 0.36 0.56 0.45 0.45 0.49a 0.48 0.38
Russian Federation 0.80y .. .. .. .. .. ..
Singapore .. .. .. .. .. .. ..
South Africa .. 0.84 0.78 0.69 0.70 0.69 ..
Chinese Taipei 1.91 2.63 2.78 2.73 2.84 2.90 2.96
MAIN SCIENCE AND TECHNOLOGY INDICATORS: VOLUME 2015/1 – © OECD 2015
25
Disclaimer: http://oe.cd/disclaimer1. Information on data for Israel:http://dx.doi.org/10.1787/888932315602Source: OECD, Main Science and Technology Indicators database, July 2015
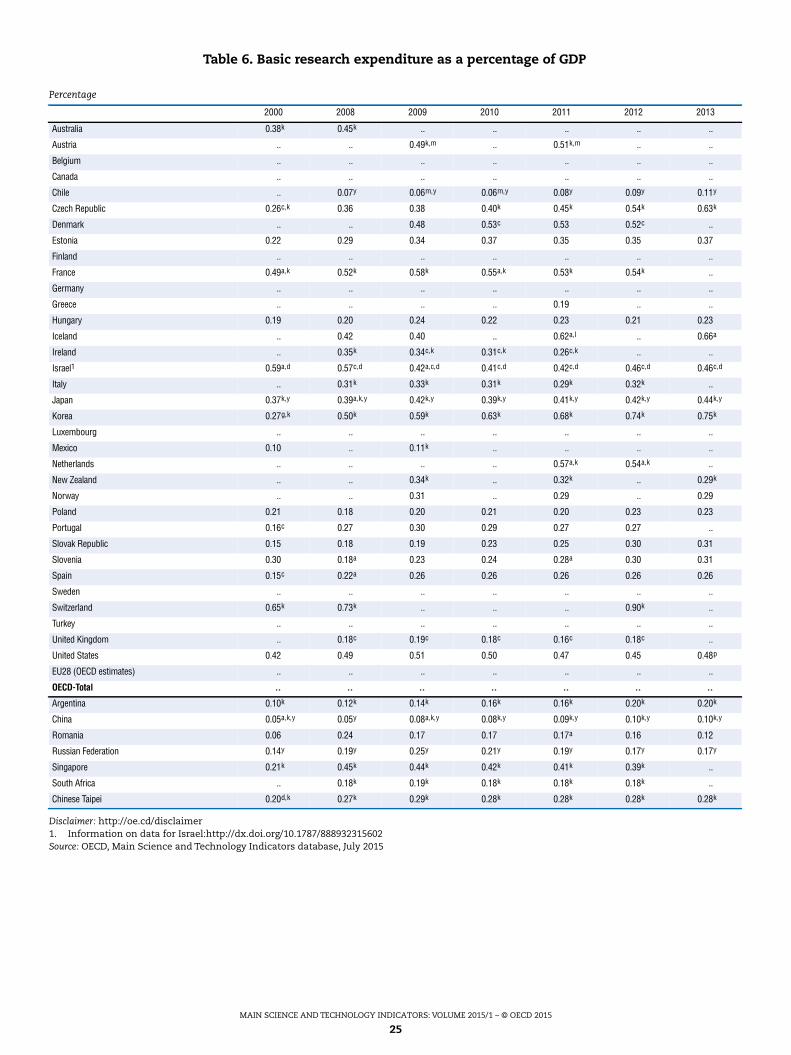
Table 6. Basic research expenditure as a percentage of GDP
Percentage
2000 2008 2009 2010 2011 2012 2013
Australia 0.38k 0.45k .. .. .. .. ..
Austria .. .. 0.49k,m .. 0.51k,m .. ..
Belgium .. .. .. .. .. .. ..
Canada .. .. .. .. .. .. ..
Chile .. 0.07y 0.06m,y 0.06m,y 0.08y 0.09y 0.11y
Czech Republic 0.26c,k 0.36 0.38 0.40k 0.45k 0.54k 0.63k
Denmark .. .. 0.48 0.53c 0.53 0.52c ..
Estonia 0.22 0.29 0.34 0.37 0.35 0.35 0.37
Finland .. .. .. .. .. .. ..
France 0.49a,k 0.52k 0.58k 0.55a,k 0.53k 0.54k ..
Germany .. .. .. .. .. .. ..
Greece .. .. .. .. 0.19 .. ..
Hungary 0.19 0.20 0.24 0.22 0.23 0.21 0.23
Iceland .. 0.42 0.40 .. 0.62a,l .. 0.66a
Ireland .. 0.35k 0.34c,k 0.31c,k 0.26c,k .. ..
Israel1 0.59a,d 0.57c,d 0.42a,c,d 0.41c,d 0.42c,d 0.46c,d 0.46c,d
Italy .. 0.31k 0.33k 0.31k 0.29k 0.32k ..
Japan 0.37k,y 0.39a,k,y 0.42k,y 0.39k,y 0.41k,y 0.42k,y 0.44k,y
Korea 0.27g,k 0.50k 0.59k 0.63k 0.68k 0.74k 0.75k
Luxembourg .. .. .. .. .. .. ..
Mexico 0.10 .. 0.11k .. .. .. ..
Netherlands .. .. .. .. 0.57a,k 0.54a,k ..
New Zealand .. .. 0.34k .. 0.32k .. 0.29k
Norway .. .. 0.31 .. 0.29 .. 0.29
Poland 0.21 0.18 0.20 0.21 0.20 0.23 0.23
Portugal 0.16c 0.27 0.30 0.29 0.27 0.27 ..
Slovak Republic 0.15 0.18 0.19 0.23 0.25 0.30 0.31
Slovenia 0.30 0.18a 0.23 0.24 0.28a 0.30 0.31
Spain 0.15c 0.22a 0.26 0.26 0.26 0.26 0.26
Sweden .. .. .. .. .. .. ..
Switzerland 0.65k 0.73k .. .. .. 0.90k ..
Turkey .. .. .. .. .. .. ..
United Kingdom .. 0.18c 0.19c 0.18c 0.16c 0.18c ..
United States 0.42 0.49 0.51 0.50 0.47 0.45 0.48p
EU28 (OECD estimates) .. .. .. .. .. .. ..
OECD-Total .. .. .. .. .. .. ..
Argentina 0.10k 0.12k 0.14k 0.16k 0.16k 0.20k 0.20k
China 0.05a,k,y 0.05y 0.08a,k,y 0.08k,y 0.09k,y 0.10k,y 0.10k,y
Romania 0.06 0.24 0.17 0.17 0.17a 0.16 0.12
Russian Federation 0.14y 0.19y 0.25y 0.21y 0.19y 0.17y 0.17y
Singapore 0.21k 0.45k 0.44k 0.42k 0.41k 0.39k ..
South Africa .. 0.18k 0.19k 0.18k 0.18k 0.18k ..
Chinese Taipei 0.20d,k 0.27k 0.29k 0.28k 0.28k 0.28k 0.28k
MAIN SCIENCE AND TECHNOLOGY INDICATORS: VOLUME 2015/1 – © OECD 2015
26
Disclaimer: http://oe.cd/disclaimer1. Information on data for Israel:http://dx.doi.org/10.1787/888932315602Source: OECD, Main Science and Technology Indicators database, July 2015
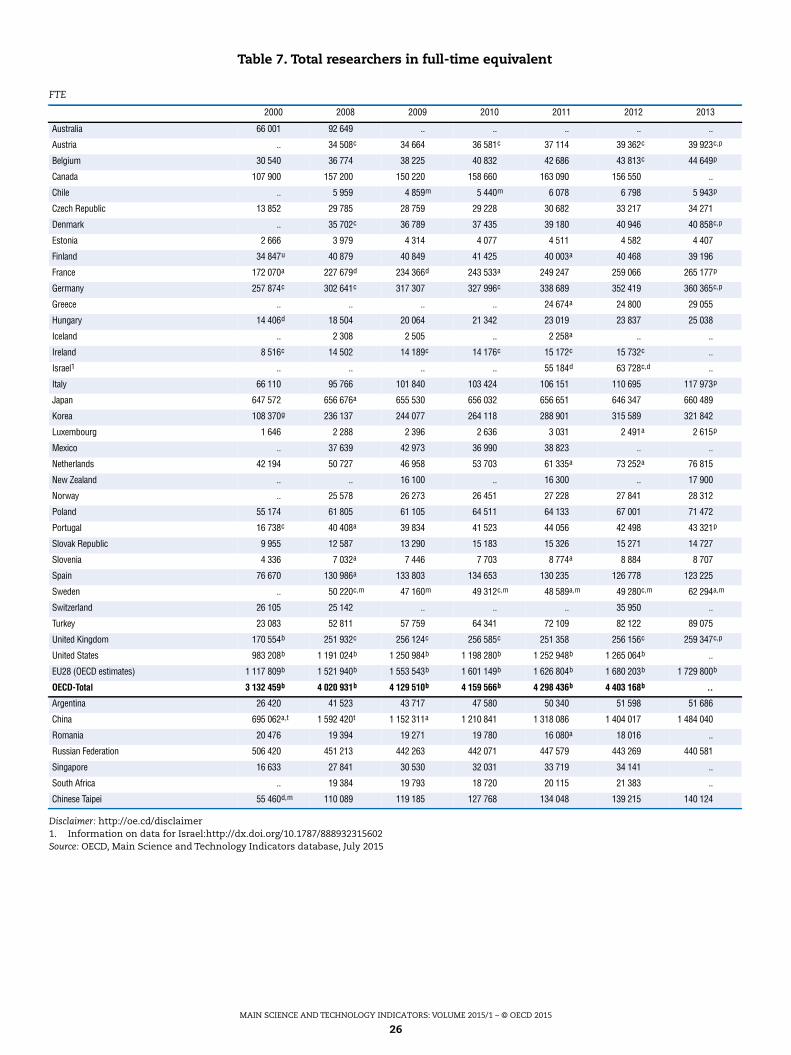
Table 7. Total researchers in full-time equivalent
FTE
2000 2008 2009 2010 2011 2012 2013
Australia 66 001 92 649 .. .. .. .. ..
Austria .. 34 508c 34 664 36 581c 37 114 39 362c 39 923c,p
Belgium 30 540 36 774 38 225 40 832 42 686 43 813c 44 649p
Canada 107 900 157 200 150 220 158 660 163 090 156 550 ..
Chile .. 5 959 4 859m 5 440m 6 078 6 798 5 943p
Czech Republic 13 852 29 785 28 759 29 228 30 682 33 217 34 271
Denmark .. 35 702c 36 789 37 435 39 180 40 946 40 858c,p
Estonia 2 666 3 979 4 314 4 077 4 511 4 582 4 407
Finland 34 847u 40 879 40 849 41 425 40 003a 40 468 39 196
France 172 070a 227 679d 234 366d 243 533a 249 247 259 066 265 177p
Germany 257 874c 302 641c 317 307 327 996c 338 689 352 419 360 365c,p
Greece .. .. .. .. 24 674a 24 800 29 055
Hungary 14 406d 18 504 20 064 21 342 23 019 23 837 25 038
Iceland .. 2 308 2 505 .. 2 258a .. ..
Ireland 8 516c 14 502 14 189c 14 176c 15 172c 15 732c ..
Israel1 .. .. .. .. 55 184d 63 728c,d ..
Italy 66 110 95 766 101 840 103 424 106 151 110 695 117 973p
Japan 647 572 656 676a 655 530 656 032 656 651 646 347 660 489
Korea 108 370g 236 137 244 077 264 118 288 901 315 589 321 842
Luxembourg 1 646 2 288 2 396 2 636 3 031 2 491a 2 615p
Mexico .. 37 639 42 973 36 990 38 823 .. ..
Netherlands 42 194 50 727 46 958 53 703 61 335a 73 252a 76 815
New Zealand .. .. 16 100 .. 16 300 .. 17 900
Norway .. 25 578 26 273 26 451 27 228 27 841 28 312
Poland 55 174 61 805 61 105 64 511 64 133 67 001 71 472
Portugal 16 738c 40 408a 39 834 41 523 44 056 42 498 43 321p
Slovak Republic 9 955 12 587 13 290 15 183 15 326 15 271 14 727
Slovenia 4 336 7 032a 7 446 7 703 8 774a 8 884 8 707
Spain 76 670 130 986a 133 803 134 653 130 235 126 778 123 225
Sweden .. 50 220c,m 47 160m 49 312c,m 48 589a,m 49 280c,m 62 294a,m
Switzerland 26 105 25 142 .. .. .. 35 950 ..
Turkey 23 083 52 811 57 759 64 341 72 109 82 122 89 075
United Kingdom 170 554b 251 932c 256 124c 256 585c 251 358 256 156c 259 347c,p
United States 983 208b 1 191 024b 1 250 984b 1 198 280b 1 252 948b 1 265 064b ..
EU28 (OECD estimates) 1 117 809b 1 521 940b 1 553 543b 1 601 149b 1 626 804b 1 680 203b 1 729 800b
OECD-Total 3 132 459b 4 020 931b 4 129 510b 4 159 566b 4 298 436b 4 403 168b ..
Argentina 26 420 41 523 43 717 47 580 50 340 51 598 51 686
China 695 062a,t 1 592 420t 1 152 311a 1 210 841 1 318 086 1 404 017 1 484 040
Romania 20 476 19 394 19 271 19 780 16 080a 18 016 ..
Russian Federation 506 420 451 213 442 263 442 071 447 579 443 269 440 581
Singapore 16 633 27 841 30 530 32 031 33 719 34 141 ..
South Africa .. 19 384 19 793 18 720 20 115 21 383 ..
Chinese Taipei 55 460d,m 110 089 119 185 127 768 134 048 139 215 140 124
MAIN SCIENCE AND TECHNOLOGY INDICATORS: VOLUME 2015/1 – © OECD 2015
27
Disclaimer: http://oe.cd/disclaimer1. Information on data for Israel:http://dx.doi.org/10.1787/888932315602Source: OECD, Main Science and Technology Indicators database, July 2015
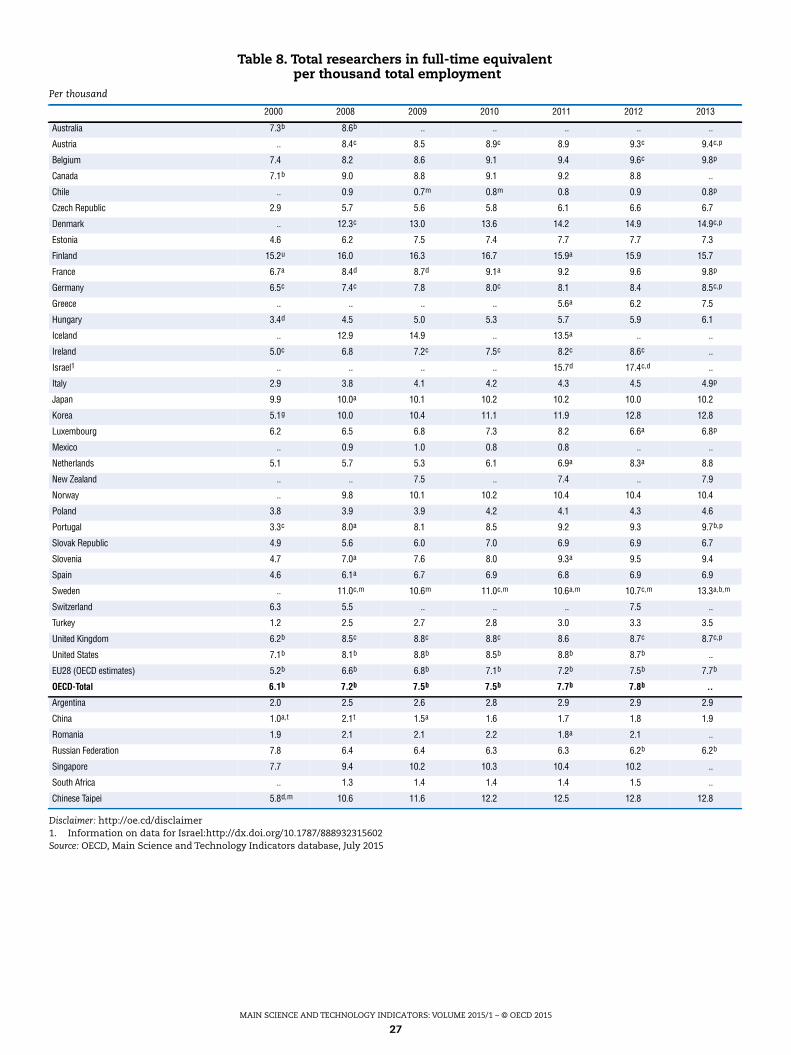
Table 8. Total researchers in full-time equivalentper thousand total employment
Per thousand
2000 2008 2009 2010 2011 2012 2013
Australia 7.3b 8.6b .. .. .. .. ..
Austria .. 8.4c 8.5 8.9c 8.9 9.3c 9.4c,p
Belgium 7.4 8.2 8.6 9.1 9.4 9.6c 9.8p
Canada 7.1b 9.0 8.8 9.1 9.2 8.8 ..
Chile .. 0.9 0.7m 0.8m 0.8 0.9 0.8p
Czech Republic 2.9 5.7 5.6 5.8 6.1 6.6 6.7
Denmark .. 12.3c 13.0 13.6 14.2 14.9 14.9c,p
Estonia 4.6 6.2 7.5 7.4 7.7 7.7 7.3
Finland 15.2u 16.0 16.3 16.7 15.9a 15.9 15.7
France 6.7a 8.4d 8.7d 9.1a 9.2 9.6 9.8p
Germany 6.5c 7.4c 7.8 8.0c 8.1 8.4 8.5c,p
Greece .. .. .. .. 5.6a 6.2 7.5
Hungary 3.4d 4.5 5.0 5.3 5.7 5.9 6.1
Iceland .. 12.9 14.9 .. 13.5a .. ..
Ireland 5.0c 6.8 7.2c 7.5c 8.2c 8.6c ..
Israel1 .. .. .. .. 15.7d 17.4c,d ..
Italy 2.9 3.8 4.1 4.2 4.3 4.5 4.9p
Japan 9.9 10.0a 10.1 10.2 10.2 10.0 10.2
Korea 5.1g 10.0 10.4 11.1 11.9 12.8 12.8
Luxembourg 6.2 6.5 6.8 7.3 8.2 6.6a 6.8p
Mexico .. 0.9 1.0 0.8 0.8 .. ..
Netherlands 5.1 5.7 5.3 6.1 6.9a 8.3a 8.8
New Zealand .. .. 7.5 .. 7.4 .. 7.9
Norway .. 9.8 10.1 10.2 10.4 10.4 10.4
Poland 3.8 3.9 3.9 4.2 4.1 4.3 4.6
Portugal 3.3c 8.0a 8.1 8.5 9.2 9.3 9.7b,p
Slovak Republic 4.9 5.6 6.0 7.0 6.9 6.9 6.7
Slovenia 4.7 7.0a 7.6 8.0 9.3a 9.5 9.4
Spain 4.6 6.1a 6.7 6.9 6.8 6.9 6.9
Sweden .. 11.0c,m 10.6m 11.0c,m 10.6a,m 10.7c,m 13.3a,b,m
Switzerland 6.3 5.5 .. .. .. 7.5 ..
Turkey 1.2 2.5 2.7 2.8 3.0 3.3 3.5
United Kingdom 6.2b 8.5c 8.8c 8.8c 8.6 8.7c 8.7c,p
United States 7.1b 8.1b 8.8b 8.5b 8.8b 8.7b ..
EU28 (OECD estimates) 5.2b 6.6b 6.8b 7.1b 7.2b 7.5b 7.7b
OECD-Total 6.1b 7.2b 7.5b 7.5b 7.7b 7.8b ..
Argentina 2.0 2.5 2.6 2.8 2.9 2.9 2.9
China 1.0a,t 2.1t 1.5a 1.6 1.7 1.8 1.9
Romania 1.9 2.1 2.1 2.2 1.8a 2.1 ..
Russian Federation 7.8 6.4 6.4 6.3 6.3 6.2b 6.2b
Singapore 7.7 9.4 10.2 10.3 10.4 10.2 ..
South Africa .. 1.3 1.4 1.4 1.4 1.5 ..
Chinese Taipei 5.8d,m 10.6 11.6 12.2 12.5 12.8 12.8
MAIN SCIENCE AND TECHNOLOGY INDICATORS: VOLUME 2015/1 – © OECD 2015
28
Disclaimer: http://oe.cd/disclaimer1. Information on data for Israel:http://dx.doi.org/10.1787/888932315602Source: OECD, Main Science and Technology Indicators database, July 2015
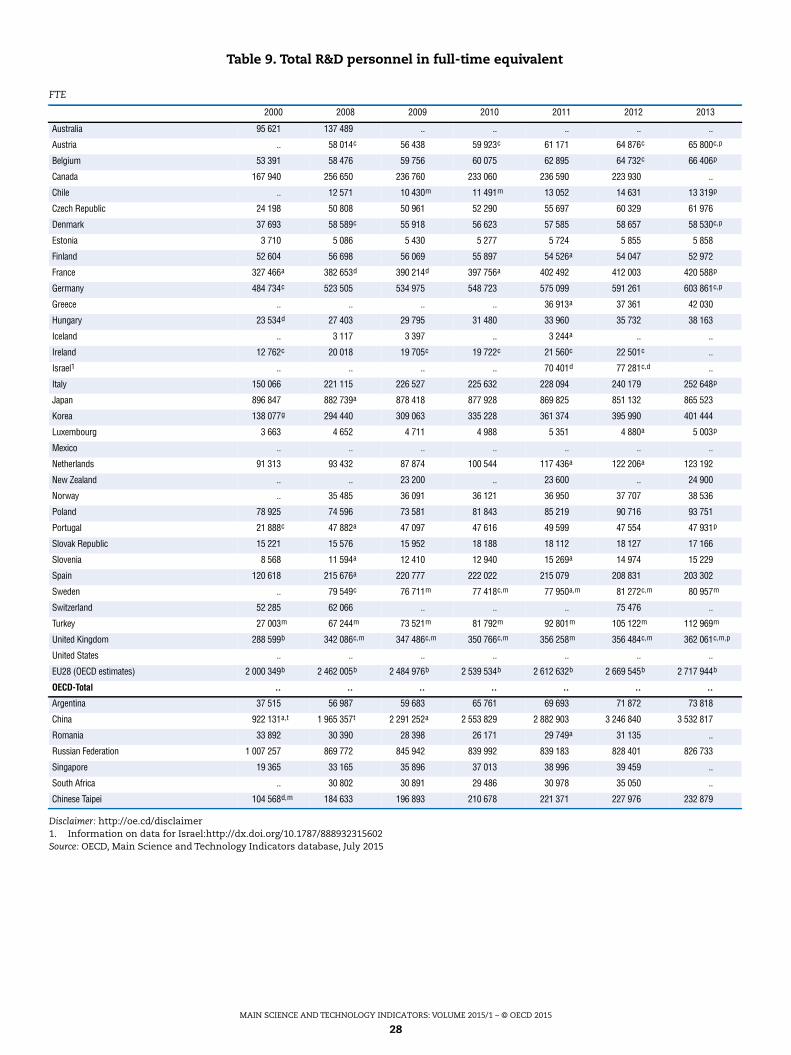
Table 9. Total R&D personnel in full-time equivalent
FTE
2000 2008 2009 2010 2011 2012 2013
Australia 95 621 137 489 .. .. .. .. ..
Austria .. 58 014c 56 438 59 923c 61 171 64 876c 65 800c,p
Belgium 53 391 58 476 59 756 60 075 62 895 64 732c 66 406p
Canada 167 940 256 650 236 760 233 060 236 590 223 930 ..
Chile .. 12 571 10 430m 11 491m 13 052 14 631 13 319p
Czech Republic 24 198 50 808 50 961 52 290 55 697 60 329 61 976
Denmark 37 693 58 589c 55 918 56 623 57 585 58 657 58 530c,p
Estonia 3 710 5 086 5 430 5 277 5 724 5 855 5 858
Finland 52 604 56 698 56 069 55 897 54 526a 54 047 52 972
France 327 466a 382 653d 390 214d 397 756a 402 492 412 003 420 588p
Germany 484 734c 523 505 534 975 548 723 575 099 591 261 603 861c,p
Greece .. .. .. .. 36 913a 37 361 42 030
Hungary 23 534d 27 403 29 795 31 480 33 960 35 732 38 163
Iceland .. 3 117 3 397 .. 3 244a .. ..
Ireland 12 762c 20 018 19 705c 19 722c 21 560c 22 501c ..
Israel1 .. .. .. .. 70 401d 77 281c,d ..
Italy 150 066 221 115 226 527 225 632 228 094 240 179 252 648p
Japan 896 847 882 739a 878 418 877 928 869 825 851 132 865 523
Korea 138 077g 294 440 309 063 335 228 361 374 395 990 401 444
Luxembourg 3 663 4 652 4 711 4 988 5 351 4 880a 5 003p
Mexico .. .. .. .. .. .. ..
Netherlands 91 313 93 432 87 874 100 544 117 436a 122 206a 123 192
New Zealand .. .. 23 200 .. 23 600 .. 24 900
Norway .. 35 485 36 091 36 121 36 950 37 707 38 536
Poland 78 925 74 596 73 581 81 843 85 219 90 716 93 751
Portugal 21 888c 47 882a 47 097 47 616 49 599 47 554 47 931p
Slovak Republic 15 221 15 576 15 952 18 188 18 112 18 127 17 166
Slovenia 8 568 11 594a 12 410 12 940 15 269a 14 974 15 229
Spain 120 618 215 676a 220 777 222 022 215 079 208 831 203 302
Sweden .. 79 549c 76 711m 77 418c,m 77 950a,m 81 272c,m 80 957m
Switzerland 52 285 62 066 .. .. .. 75 476 ..
Turkey 27 003m 67 244m 73 521m 81 792m 92 801m 105 122m 112 969m
United Kingdom 288 599b 342 086c,m 347 486c,m 350 766c,m 356 258m 356 484c,m 362 061c,m,p
United States .. .. .. .. .. .. ..
EU28 (OECD estimates) 2 000 349b 2 462 005b 2 484 976b 2 539 534b 2 612 632b 2 669 545b 2 717 944b
OECD-Total .. .. .. .. .. .. ..
Argentina 37 515 56 987 59 683 65 761 69 693 71 872 73 818
China 922 131a,t 1 965 357t 2 291 252a 2 553 829 2 882 903 3 246 840 3 532 817
Romania 33 892 30 390 28 398 26 171 29 749a 31 135 ..
Russian Federation 1 007 257 869 772 845 942 839 992 839 183 828 401 826 733
Singapore 19 365 33 165 35 896 37 013 38 996 39 459 ..
South Africa .. 30 802 30 891 29 486 30 978 35 050 ..
Chinese Taipei 104 568d,m 184 633 196 893 210 678 221 371 227 976 232 879
MAIN SCIENCE AND TECHNOLOGY INDICATORS: VOLUME 2015/1 – © OECD 2015
29
Disclaimer: http://oe.cd/disclaimer1. Information on data for Israel:http://dx.doi.org/10.1787/888932315602Source: OECD, Main Science and Technology Indicators database, July 2015
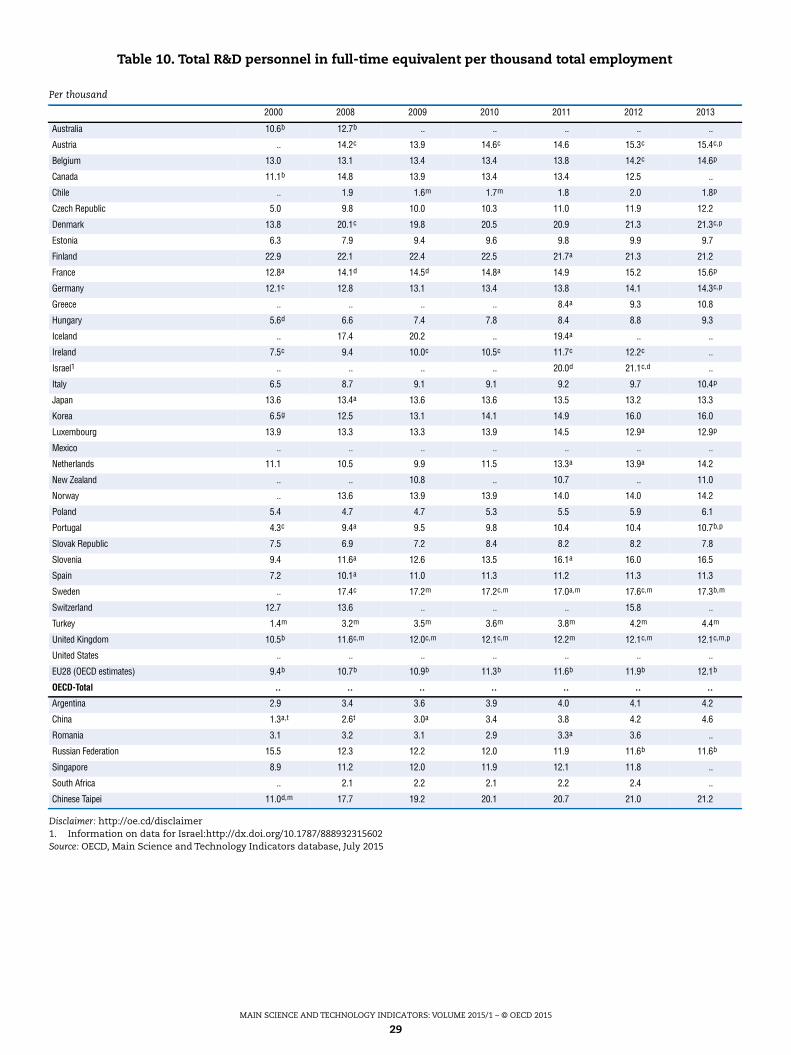
Table 10. Total R&D personnel in full-time equivalent per thousand total employment
Per thousand
2000 2008 2009 2010 2011 2012 2013
Australia 10.6b 12.7b .. .. .. .. ..
Austria .. 14.2c 13.9 14.6c 14.6 15.3c 15.4c,p
Belgium 13.0 13.1 13.4 13.4 13.8 14.2c 14.6p
Canada 11.1b 14.8 13.9 13.4 13.4 12.5 ..
Chile .. 1.9 1.6m 1.7m 1.8 2.0 1.8p
Czech Republic 5.0 9.8 10.0 10.3 11.0 11.9 12.2
Denmark 13.8 20.1c 19.8 20.5 20.9 21.3 21.3c,p
Estonia 6.3 7.9 9.4 9.6 9.8 9.9 9.7
Finland 22.9 22.1 22.4 22.5 21.7a 21.3 21.2
France 12.8a 14.1d 14.5d 14.8a 14.9 15.2 15.6p
Germany 12.1c 12.8 13.1 13.4 13.8 14.1 14.3c,p
Greece .. .. .. .. 8.4a 9.3 10.8
Hungary 5.6d 6.6 7.4 7.8 8.4 8.8 9.3
Iceland .. 17.4 20.2 .. 19.4a .. ..
Ireland 7.5c 9.4 10.0c 10.5c 11.7c 12.2c ..
Israel1 .. .. .. .. 20.0d 21.1c,d ..
Italy 6.5 8.7 9.1 9.1 9.2 9.7 10.4p
Japan 13.6 13.4a 13.6 13.6 13.5 13.2 13.3
Korea 6.5g 12.5 13.1 14.1 14.9 16.0 16.0
Luxembourg 13.9 13.3 13.3 13.9 14.5 12.9a 12.9p
Mexico .. .. .. .. .. .. ..
Netherlands 11.1 10.5 9.9 11.5 13.3a 13.9a 14.2
New Zealand .. .. 10.8 .. 10.7 .. 11.0
Norway .. 13.6 13.9 13.9 14.0 14.0 14.2
Poland 5.4 4.7 4.7 5.3 5.5 5.9 6.1
Portugal 4.3c 9.4a 9.5 9.8 10.4 10.4 10.7b,p
Slovak Republic 7.5 6.9 7.2 8.4 8.2 8.2 7.8
Slovenia 9.4 11.6a 12.6 13.5 16.1a 16.0 16.5
Spain 7.2 10.1a 11.0 11.3 11.2 11.3 11.3
Sweden .. 17.4c 17.2m 17.2c,m 17.0a,m 17.6c,m 17.3b,m
Switzerland 12.7 13.6 .. .. .. 15.8 ..
Turkey 1.4m 3.2m 3.5m 3.6m 3.8m 4.2m 4.4m
United Kingdom 10.5b 11.6c,m 12.0c,m 12.1c,m 12.2m 12.1c,m 12.1c,m,p
United States .. .. .. .. .. .. ..
EU28 (OECD estimates) 9.4b 10.7b 10.9b 11.3b 11.6b 11.9b 12.1b
OECD-Total .. .. .. .. .. .. ..
Argentina 2.9 3.4 3.6 3.9 4.0 4.1 4.2
China 1.3a,t 2.6t 3.0a 3.4 3.8 4.2 4.6
Romania 3.1 3.2 3.1 2.9 3.3a 3.6 ..
Russian Federation 15.5 12.3 12.2 12.0 11.9 11.6b 11.6b
Singapore 8.9 11.2 12.0 11.9 12.1 11.8 ..
South Africa .. 2.1 2.2 2.1 2.2 2.4 ..
Chinese Taipei 11.0d,m 17.7 19.2 20.1 20.7 21.0 21.2
MAIN SCIENCE AND TECHNOLOGY INDICATORS: VOLUME 2015/1 – © OECD 2015
30
Disclaimer: http://oe.cd/disclaimer1. Information on data for Israel:http://dx.doi.org/10.1787/888932315602Source: OECD, Main Science and Technology Indicators database, July 2015
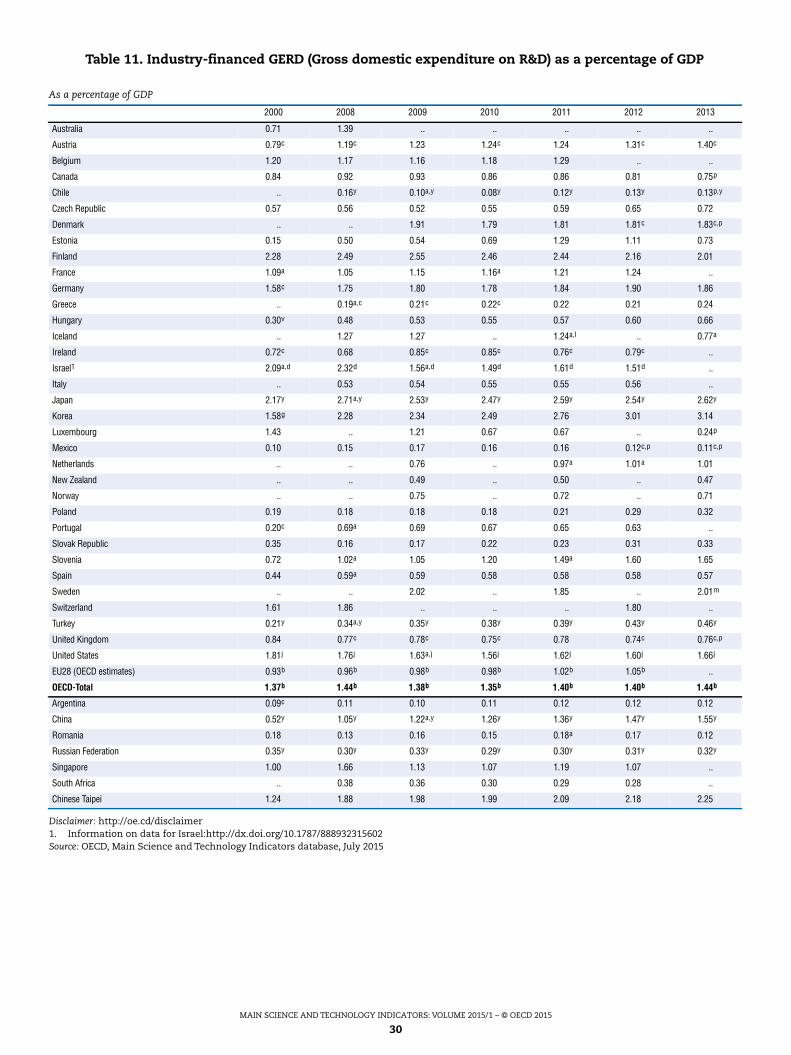
Table 11. Industry-financed GERD (Gross domestic expenditure on R&D) as a percentage of GDP
As a percentage of GDP
2000 2008 2009 2010 2011 2012 2013
Australia 0.71 1.39 .. .. .. .. ..
Austria 0.79c 1.19c 1.23 1.24c 1.24 1.31c 1.40c
Belgium 1.20 1.17 1.16 1.18 1.29 .. ..
Canada 0.84 0.92 0.93 0.86 0.86 0.81 0.75p
Chile .. 0.16y 0.10a,y 0.08y 0.12y 0.13y 0.13p,y
Czech Republic 0.57 0.56 0.52 0.55 0.59 0.65 0.72
Denmark .. .. 1.91 1.79 1.81 1.81c 1.83c,p
Estonia 0.15 0.50 0.54 0.69 1.29 1.11 0.73
Finland 2.28 2.49 2.55 2.46 2.44 2.16 2.01
France 1.09a 1.05 1.15 1.16a 1.21 1.24 ..
Germany 1.58c 1.75 1.80 1.78 1.84 1.90 1.86
Greece .. 0.19a,c 0.21c 0.22c 0.22 0.21 0.24
Hungary 0.30v 0.48 0.53 0.55 0.57 0.60 0.66
Iceland .. 1.27 1.27 .. 1.24a,l .. 0.77a
Ireland 0.72c 0.68 0.85c 0.85c 0.76c 0.79c ..
Israel1 2.09a,d 2.32d 1.56a,d 1.49d 1.61d 1.51d ..
Italy .. 0.53 0.54 0.55 0.55 0.56 ..
Japan 2.17y 2.71a,y 2.53y 2.47y 2.59y 2.54y 2.62y
Korea 1.58g 2.28 2.34 2.49 2.76 3.01 3.14
Luxembourg 1.43 .. 1.21 0.67 0.67 .. 0.24p
Mexico 0.10 0.15 0.17 0.16 0.16 0.12c,p 0.11c,p
Netherlands .. .. 0.76 .. 0.97a 1.01a 1.01
New Zealand .. .. 0.49 .. 0.50 .. 0.47
Norway .. .. 0.75 .. 0.72 .. 0.71
Poland 0.19 0.18 0.18 0.18 0.21 0.29 0.32
Portugal 0.20c 0.69a 0.69 0.67 0.65 0.63 ..
Slovak Republic 0.35 0.16 0.17 0.22 0.23 0.31 0.33
Slovenia 0.72 1.02a 1.05 1.20 1.49a 1.60 1.65
Spain 0.44 0.59a 0.59 0.58 0.58 0.58 0.57
Sweden .. .. 2.02 .. 1.85 .. 2.01m
Switzerland 1.61 1.86 .. .. .. 1.80 ..
Turkey 0.21y 0.34a,y 0.35y 0.38y 0.39y 0.43y 0.46y
United Kingdom 0.84 0.77c 0.78c 0.75c 0.78 0.74c 0.76c,p
United States 1.81j 1.76j 1.63a,j 1.56j 1.62j 1.60j 1.66j
EU28 (OECD estimates) 0.93b 0.96b 0.98b 0.98b 1.02b 1.05b ..
OECD-Total 1.37b 1.44b 1.38b 1.35b 1.40b 1.40b 1.44b
Argentina 0.09c 0.11 0.10 0.11 0.12 0.12 0.12
China 0.52y 1.05y 1.22a,y 1.26y 1.36y 1.47y 1.55y
Romania 0.18 0.13 0.16 0.15 0.18a 0.17 0.12
Russian Federation 0.35y 0.30y 0.33y 0.29y 0.30y 0.31y 0.32y
Singapore 1.00 1.66 1.13 1.07 1.19 1.07 ..
South Africa .. 0.38 0.36 0.30 0.29 0.28 ..
Chinese Taipei 1.24 1.88 1.98 1.99 2.09 2.18 2.25
MAIN SCIENCE AND TECHNOLOGY INDICATORS: VOLUME 2015/1 – © OECD 2015
31
Disclaimer: http://oe.cd/disclaimer1. Information on data for Israel:http://dx.doi.org/10.1787/888932315602Source: OECD, Main Science and Technology Indicators database, July 2015
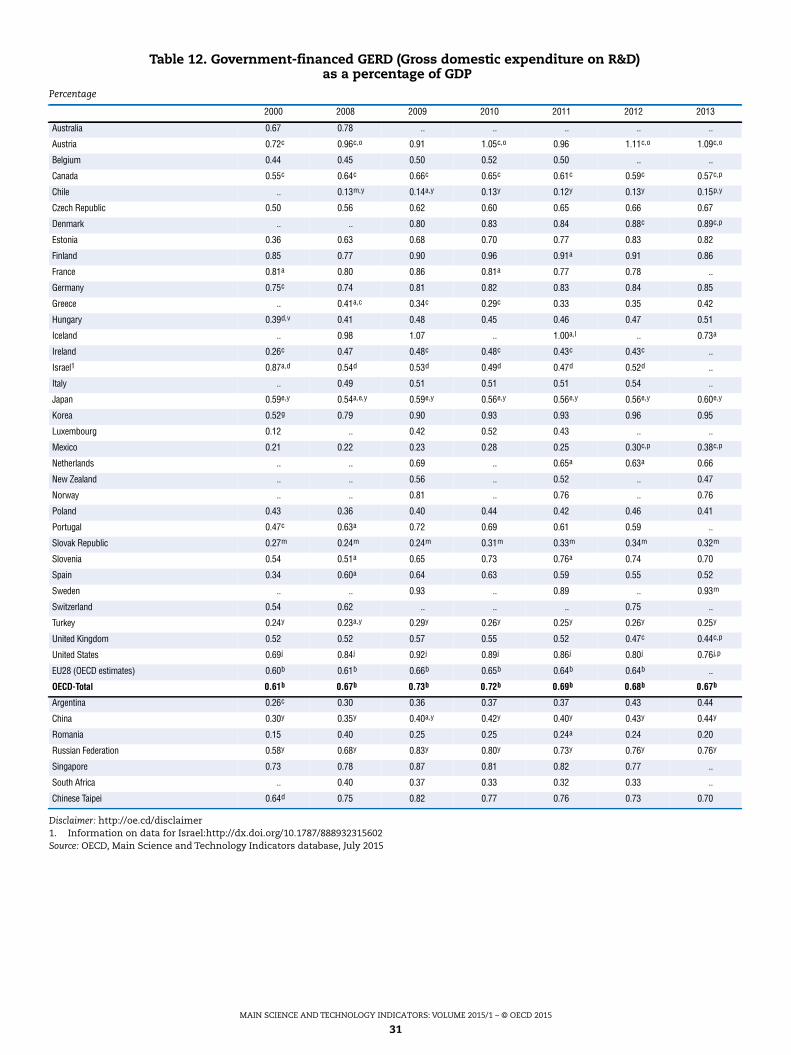
Table 12. Government-financed GERD (Gross domestic expenditure on R&D)as a percentage of GDP
Percentage
2000 2008 2009 2010 2011 2012 2013
Australia 0.67 0.78 .. .. .. .. ..
Austria 0.72c 0.96c,o 0.91 1.05c,o 0.96 1.11c,o 1.09c,o
Belgium 0.44 0.45 0.50 0.52 0.50 .. ..
Canada 0.55c 0.64c 0.66c 0.65c 0.61c 0.59c 0.57c,p
Chile .. 0.13m,y 0.14a,y 0.13y 0.12y 0.13y 0.15p,y
Czech Republic 0.50 0.56 0.62 0.60 0.65 0.66 0.67
Denmark .. .. 0.80 0.83 0.84 0.88c 0.89c,p
Estonia 0.36 0.63 0.68 0.70 0.77 0.83 0.82
Finland 0.85 0.77 0.90 0.96 0.91a 0.91 0.86
France 0.81a 0.80 0.86 0.81a 0.77 0.78 ..
Germany 0.75c 0.74 0.81 0.82 0.83 0.84 0.85
Greece .. 0.41a,c 0.34c 0.29c 0.33 0.35 0.42
Hungary 0.39d,v 0.41 0.48 0.45 0.46 0.47 0.51
Iceland .. 0.98 1.07 .. 1.00a,l .. 0.73a
Ireland 0.26c 0.47 0.48c 0.48c 0.43c 0.43c ..
Israel1 0.87a,d 0.54d 0.53d 0.49d 0.47d 0.52d ..
Italy .. 0.49 0.51 0.51 0.51 0.54 ..
Japan 0.59e,y 0.54a,e,y 0.59e,y 0.56e,y 0.56e,y 0.56e,y 0.60e,y
Korea 0.52g 0.79 0.90 0.93 0.93 0.96 0.95
Luxembourg 0.12 .. 0.42 0.52 0.43 .. ..
Mexico 0.21 0.22 0.23 0.28 0.25 0.30c,p 0.38c,p
Netherlands .. .. 0.69 .. 0.65a 0.63a 0.66
New Zealand .. .. 0.56 .. 0.52 .. 0.47
Norway .. .. 0.81 .. 0.76 .. 0.76
Poland 0.43 0.36 0.40 0.44 0.42 0.46 0.41
Portugal 0.47c 0.63a 0.72 0.69 0.61 0.59 ..
Slovak Republic 0.27m 0.24m 0.24m 0.31m 0.33m 0.34m 0.32m
Slovenia 0.54 0.51a 0.65 0.73 0.76a 0.74 0.70
Spain 0.34 0.60a 0.64 0.63 0.59 0.55 0.52
Sweden .. .. 0.93 .. 0.89 .. 0.93m
Switzerland 0.54 0.62 .. .. .. 0.75 ..
Turkey 0.24y 0.23a,y 0.29y 0.26y 0.25y 0.26y 0.25y
United Kingdom 0.52 0.52 0.57 0.55 0.52 0.47c 0.44c,p
United States 0.69j 0.84j 0.92j 0.89j 0.86j 0.80j 0.76j,p
EU28 (OECD estimates) 0.60b 0.61b 0.66b 0.65b 0.64b 0.64b ..
OECD-Total 0.61b 0.67b 0.73b 0.72b 0.69b 0.68b 0.67b
Argentina 0.26c 0.30 0.36 0.37 0.37 0.43 0.44
China 0.30y 0.35y 0.40a,y 0.42y 0.40y 0.43y 0.44y
Romania 0.15 0.40 0.25 0.25 0.24a 0.24 0.20
Russian Federation 0.58y 0.68y 0.83y 0.80y 0.73y 0.76y 0.76y
Singapore 0.73 0.78 0.87 0.81 0.82 0.77 ..
South Africa .. 0.40 0.37 0.33 0.32 0.33 ..
Chinese Taipei 0.64d 0.75 0.82 0.77 0.76 0.73 0.70
MAIN SCIENCE AND TECHNOLOGY INDICATORS: VOLUME 2015/1 – © OECD 2015
32
Disclaimer: http://oe.cd/disclaimer1. Information on data for Israel:http://dx.doi.org/10.1787/888932315602Source: OECD, Main Science and Technology Indicators database, July 2015
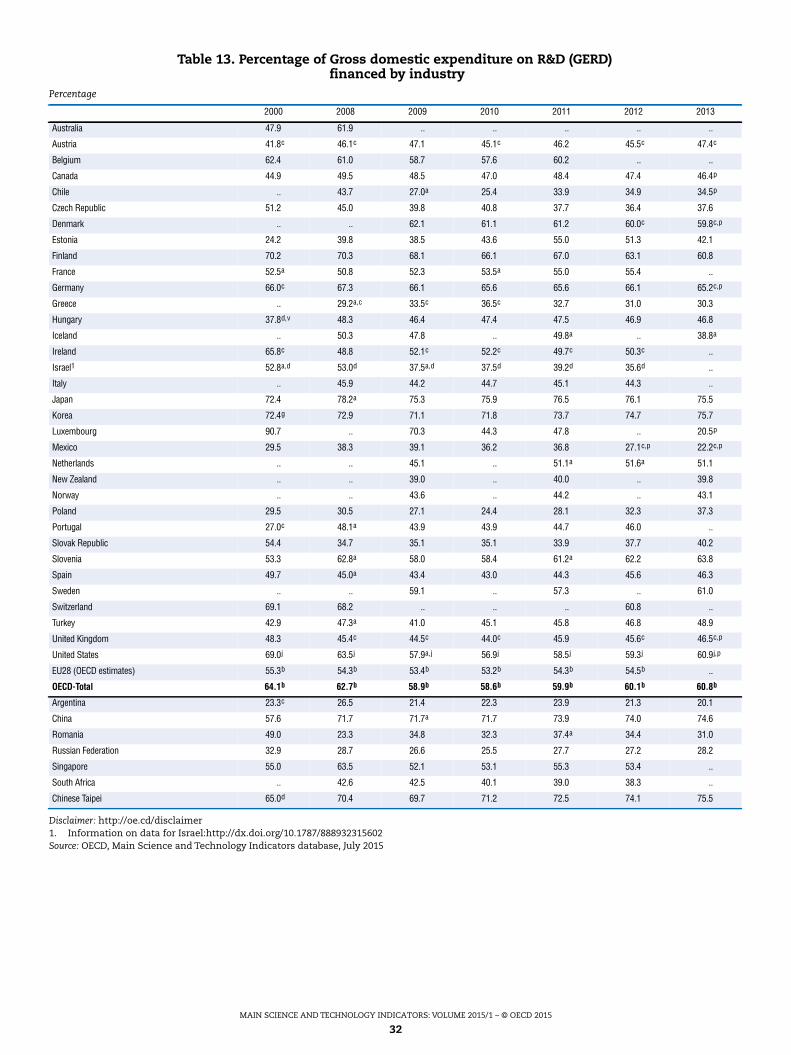
Table 13. Percentage of Gross domestic expenditure on R&D (GERD)financed by industry
Percentage
2000 2008 2009 2010 2011 2012 2013
Australia 47.9 61.9 .. .. .. .. ..
Austria 41.8c 46.1c 47.1 45.1c 46.2 45.5c 47.4c
Belgium 62.4 61.0 58.7 57.6 60.2 .. ..
Canada 44.9 49.5 48.5 47.0 48.4 47.4 46.4p
Chile .. 43.7 27.0a 25.4 33.9 34.9 34.5p
Czech Republic 51.2 45.0 39.8 40.8 37.7 36.4 37.6
Denmark .. .. 62.1 61.1 61.2 60.0c 59.8c,p
Estonia 24.2 39.8 38.5 43.6 55.0 51.3 42.1
Finland 70.2 70.3 68.1 66.1 67.0 63.1 60.8
France 52.5a 50.8 52.3 53.5a 55.0 55.4 ..
Germany 66.0c 67.3 66.1 65.6 65.6 66.1 65.2c,p
Greece .. 29.2a,c 33.5c 36.5c 32.7 31.0 30.3
Hungary 37.8d,v 48.3 46.4 47.4 47.5 46.9 46.8
Iceland .. 50.3 47.8 .. 49.8a .. 38.8a
Ireland 65.8c 48.8 52.1c 52.2c 49.7c 50.3c ..
Israel1 52.8a,d 53.0d 37.5a,d 37.5d 39.2d 35.6d ..
Italy .. 45.9 44.2 44.7 45.1 44.3 ..
Japan 72.4 78.2a 75.3 75.9 76.5 76.1 75.5
Korea 72.4g 72.9 71.1 71.8 73.7 74.7 75.7
Luxembourg 90.7 .. 70.3 44.3 47.8 .. 20.5p
Mexico 29.5 38.3 39.1 36.2 36.8 27.1c,p 22.2c,p
Netherlands .. .. 45.1 .. 51.1a 51.6a 51.1
New Zealand .. .. 39.0 .. 40.0 .. 39.8
Norway .. .. 43.6 .. 44.2 .. 43.1
Poland 29.5 30.5 27.1 24.4 28.1 32.3 37.3
Portugal 27.0c 48.1a 43.9 43.9 44.7 46.0 ..
Slovak Republic 54.4 34.7 35.1 35.1 33.9 37.7 40.2
Slovenia 53.3 62.8a 58.0 58.4 61.2a 62.2 63.8
Spain 49.7 45.0a 43.4 43.0 44.3 45.6 46.3
Sweden .. .. 59.1 .. 57.3 .. 61.0
Switzerland 69.1 68.2 .. .. .. 60.8 ..
Turkey 42.9 47.3a 41.0 45.1 45.8 46.8 48.9
United Kingdom 48.3 45.4c 44.5c 44.0c 45.9 45.6c 46.5c,p
United States 69.0j 63.5j 57.9a,j 56.9j 58.5j 59.3j 60.9j,p
EU28 (OECD estimates) 55.3b 54.3b 53.4b 53.2b 54.3b 54.5b ..
OECD-Total 64.1b 62.7b 58.9b 58.6b 59.9b 60.1b 60.8b
Argentina 23.3c 26.5 21.4 22.3 23.9 21.3 20.1
China 57.6 71.7 71.7a 71.7 73.9 74.0 74.6
Romania 49.0 23.3 34.8 32.3 37.4a 34.4 31.0
Russian Federation 32.9 28.7 26.6 25.5 27.7 27.2 28.2
Singapore 55.0 63.5 52.1 53.1 55.3 53.4 ..
South Africa .. 42.6 42.5 40.1 39.0 38.3 ..
Chinese Taipei 65.0d 70.4 69.7 71.2 72.5 74.1 75.5
MAIN SCIENCE AND TECHNOLOGY INDICATORS: VOLUME 2015/1 – © OECD 2015
33
Disclaimer: http://oe.cd/disclaimer1. Information on data for Israel:http://dx.doi.org/10.1787/888932315602Source: OECD, Main Science and Technology Indicators database, July 2015
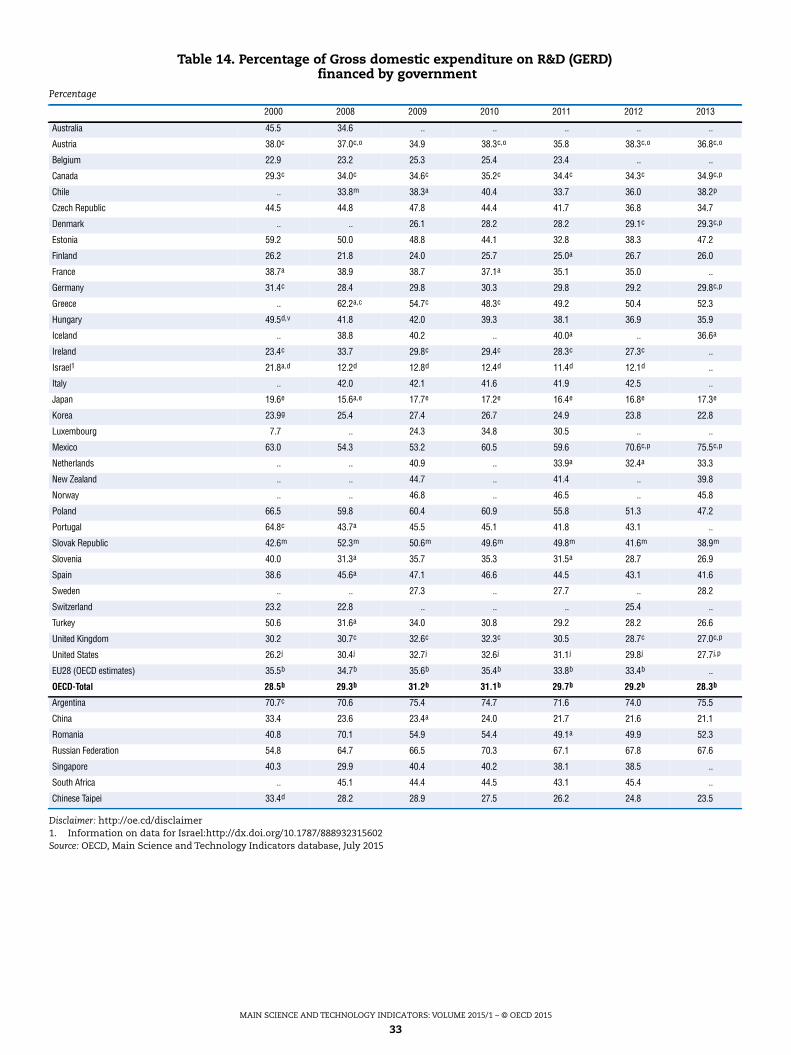
Table 14. Percentage of Gross domestic expenditure on R&D (GERD)financed by government
Percentage
2000 2008 2009 2010 2011 2012 2013
Australia 45.5 34.6 .. .. .. .. ..
Austria 38.0c 37.0c,o 34.9 38.3c,o 35.8 38.3c,o 36.8c,o
Belgium 22.9 23.2 25.3 25.4 23.4 .. ..
Canada 29.3c 34.0c 34.6c 35.2c 34.4c 34.3c 34.9c,p
Chile .. 33.8m 38.3a 40.4 33.7 36.0 38.2p
Czech Republic 44.5 44.8 47.8 44.4 41.7 36.8 34.7
Denmark .. .. 26.1 28.2 28.2 29.1c 29.3c,p
Estonia 59.2 50.0 48.8 44.1 32.8 38.3 47.2
Finland 26.2 21.8 24.0 25.7 25.0a 26.7 26.0
France 38.7a 38.9 38.7 37.1a 35.1 35.0 ..
Germany 31.4c 28.4 29.8 30.3 29.8 29.2 29.8c,p
Greece .. 62.2a,c 54.7c 48.3c 49.2 50.4 52.3
Hungary 49.5d,v 41.8 42.0 39.3 38.1 36.9 35.9
Iceland .. 38.8 40.2 .. 40.0a .. 36.6a
Ireland 23.4c 33.7 29.8c 29.4c 28.3c 27.3c ..
Israel1 21.8a,d 12.2d 12.8d 12.4d 11.4d 12.1d ..
Italy .. 42.0 42.1 41.6 41.9 42.5 ..
Japan 19.6e 15.6a,e 17.7e 17.2e 16.4e 16.8e 17.3e
Korea 23.9g 25.4 27.4 26.7 24.9 23.8 22.8
Luxembourg 7.7 .. 24.3 34.8 30.5 .. ..
Mexico 63.0 54.3 53.2 60.5 59.6 70.6c,p 75.5c,p
Netherlands .. .. 40.9 .. 33.9a 32.4a 33.3
New Zealand .. .. 44.7 .. 41.4 .. 39.8
Norway .. .. 46.8 .. 46.5 .. 45.8
Poland 66.5 59.8 60.4 60.9 55.8 51.3 47.2
Portugal 64.8c 43.7a 45.5 45.1 41.8 43.1 ..
Slovak Republic 42.6m 52.3m 50.6m 49.6m 49.8m 41.6m 38.9m
Slovenia 40.0 31.3a 35.7 35.3 31.5a 28.7 26.9
Spain 38.6 45.6a 47.1 46.6 44.5 43.1 41.6
Sweden .. .. 27.3 .. 27.7 .. 28.2
Switzerland 23.2 22.8 .. .. .. 25.4 ..
Turkey 50.6 31.6a 34.0 30.8 29.2 28.2 26.6
United Kingdom 30.2 30.7c 32.6c 32.3c 30.5 28.7c 27.0c,p
United States 26.2j 30.4j 32.7j 32.6j 31.1j 29.8j 27.7j,p
EU28 (OECD estimates) 35.5b 34.7b 35.6b 35.4b 33.8b 33.4b ..
OECD-Total 28.5b 29.3b 31.2b 31.1b 29.7b 29.2b 28.3b
Argentina 70.7c 70.6 75.4 74.7 71.6 74.0 75.5
China 33.4 23.6 23.4a 24.0 21.7 21.6 21.1
Romania 40.8 70.1 54.9 54.4 49.1a 49.9 52.3
Russian Federation 54.8 64.7 66.5 70.3 67.1 67.8 67.6
Singapore 40.3 29.9 40.4 40.2 38.1 38.5 ..
South Africa .. 45.1 44.4 44.5 43.1 45.4 ..
Chinese Taipei 33.4d 28.2 28.9 27.5 26.2 24.8 23.5
MAIN SCIENCE AND TECHNOLOGY INDICATORS: VOLUME 2015/1 – © OECD 2015
34
Disclaimer: http://oe.cd/disclaimer1. Information on data for Israel:http://dx.doi.org/10.1787/888932315602Source: OECD, Main Science and Technology Indicators database, July 2015
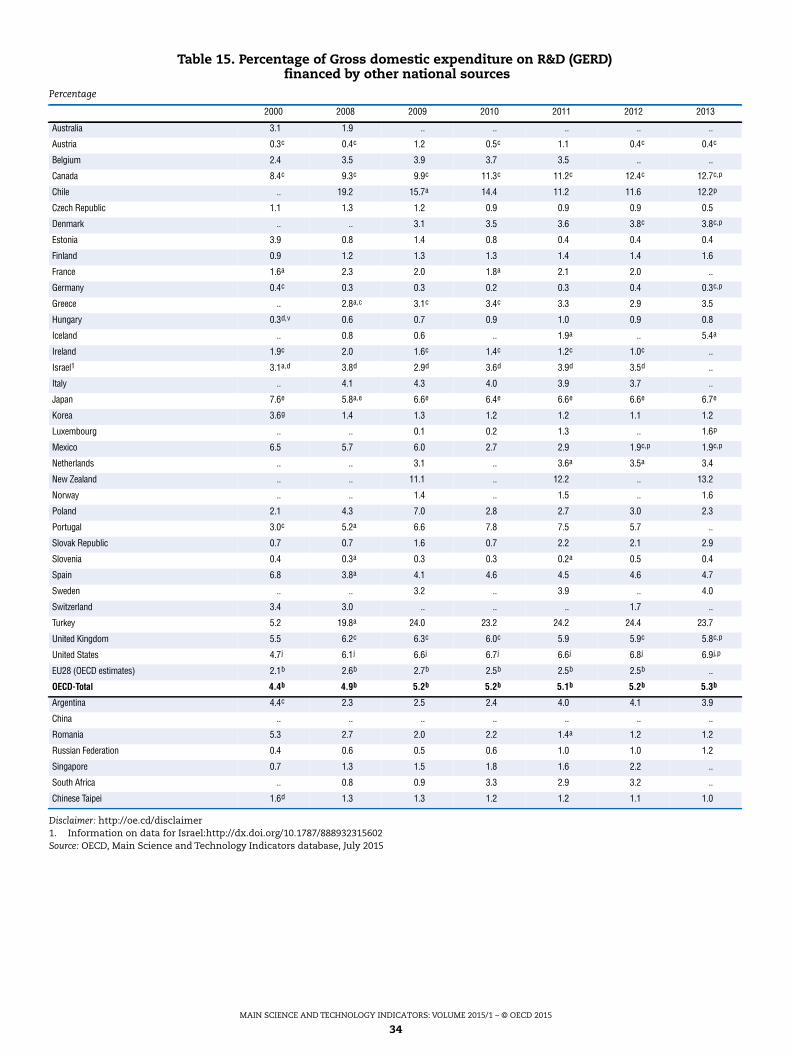
Table 15. Percentage of Gross domestic expenditure on R&D (GERD)financed by other national sources
Percentage
2000 2008 2009 2010 2011 2012 2013
Australia 3.1 1.9 .. .. .. .. ..
Austria 0.3c 0.4c 1.2 0.5c 1.1 0.4c 0.4c
Belgium 2.4 3.5 3.9 3.7 3.5 .. ..
Canada 8.4c 9.3c 9.9c 11.3c 11.2c 12.4c 12.7c,p
Chile .. 19.2 15.7a 14.4 11.2 11.6 12.2p
Czech Republic 1.1 1.3 1.2 0.9 0.9 0.9 0.5
Denmark .. .. 3.1 3.5 3.6 3.8c 3.8c,p
Estonia 3.9 0.8 1.4 0.8 0.4 0.4 0.4
Finland 0.9 1.2 1.3 1.3 1.4 1.4 1.6
France 1.6a 2.3 2.0 1.8a 2.1 2.0 ..
Germany 0.4c 0.3 0.3 0.2 0.3 0.4 0.3c,p
Greece .. 2.8a,c 3.1c 3.4c 3.3 2.9 3.5
Hungary 0.3d,v 0.6 0.7 0.9 1.0 0.9 0.8
Iceland .. 0.8 0.6 .. 1.9a .. 5.4a
Ireland 1.9c 2.0 1.6c 1.4c 1.2c 1.0c ..
Israel1 3.1a,d 3.8d 2.9d 3.6d 3.9d 3.5d ..
Italy .. 4.1 4.3 4.0 3.9 3.7 ..
Japan 7.6e 5.8a,e 6.6e 6.4e 6.6e 6.6e 6.7e
Korea 3.6g 1.4 1.3 1.2 1.2 1.1 1.2
Luxembourg .. .. 0.1 0.2 1.3 .. 1.6p
Mexico 6.5 5.7 6.0 2.7 2.9 1.9c,p 1.9c,p
Netherlands .. .. 3.1 .. 3.6a 3.5a 3.4
New Zealand .. .. 11.1 .. 12.2 .. 13.2
Norway .. .. 1.4 .. 1.5 .. 1.6
Poland 2.1 4.3 7.0 2.8 2.7 3.0 2.3
Portugal 3.0c 5.2a 6.6 7.8 7.5 5.7 ..
Slovak Republic 0.7 0.7 1.6 0.7 2.2 2.1 2.9
Slovenia 0.4 0.3a 0.3 0.3 0.2a 0.5 0.4
Spain 6.8 3.8a 4.1 4.6 4.5 4.6 4.7
Sweden .. .. 3.2 .. 3.9 .. 4.0
Switzerland 3.4 3.0 .. .. .. 1.7 ..
Turkey 5.2 19.8a 24.0 23.2 24.2 24.4 23.7
United Kingdom 5.5 6.2c 6.3c 6.0c 5.9 5.9c 5.8c,p
United States 4.7j 6.1j 6.6j 6.7j 6.6j 6.8j 6.9j,p
EU28 (OECD estimates) 2.1b 2.6b 2.7b 2.5b 2.5b 2.5b ..
OECD-Total 4.4b 4.9b 5.2b 5.2b 5.1b 5.2b 5.3b
Argentina 4.4c 2.3 2.5 2.4 4.0 4.1 3.9
China .. .. .. .. .. .. ..
Romania 5.3 2.7 2.0 2.2 1.4a 1.2 1.2
Russian Federation 0.4 0.6 0.5 0.6 1.0 1.0 1.2
Singapore 0.7 1.3 1.5 1.8 1.6 2.2 ..
South Africa .. 0.8 0.9 3.3 2.9 3.2 ..
Chinese Taipei 1.6d 1.3 1.3 1.2 1.2 1.1 1.0
MAIN SCIENCE AND TECHNOLOGY INDICATORS: VOLUME 2015/1 – © OECD 2015
35
Disclaimer: http://oe.cd/disclaimer1. Information on data for Israel:http://dx.doi.org/10.1787/888932315602Source: OECD, Main Science and Technology Indicators database, July 2015
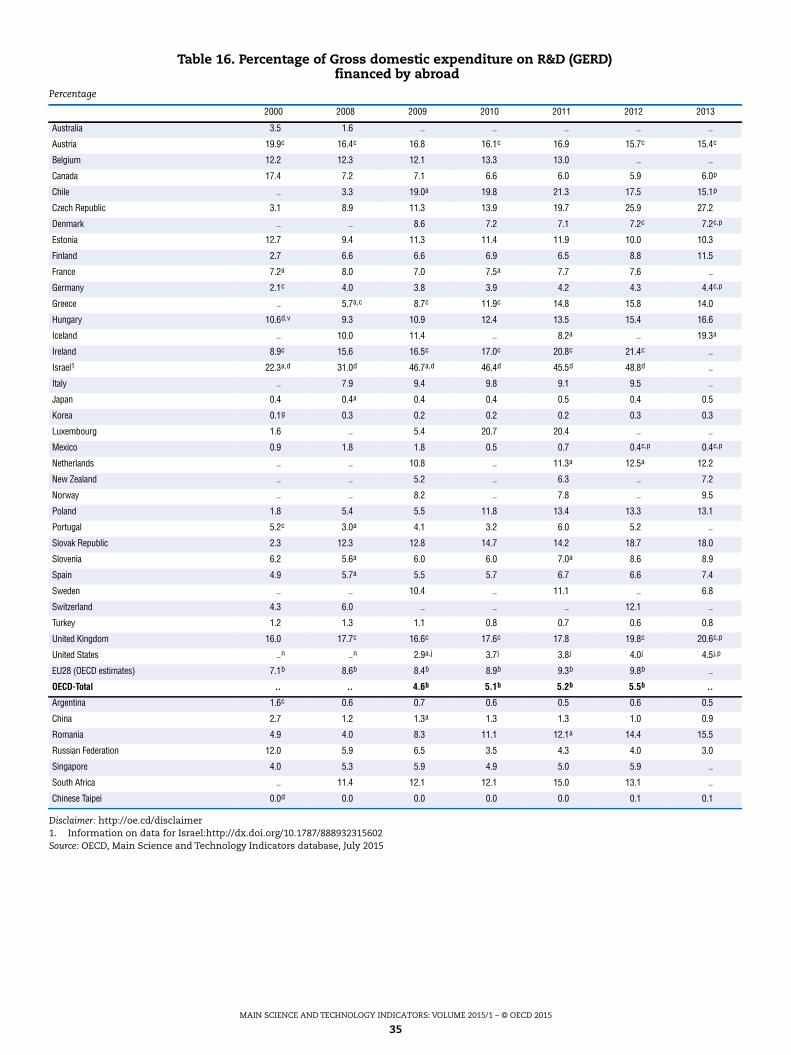
Table 16. Percentage of Gross domestic expenditure on R&D (GERD)financed by abroad
Percentage
2000 2008 2009 2010 2011 2012 2013
Australia 3.5 1.6 .. .. .. .. ..
Austria 19.9c 16.4c 16.8 16.1c 16.9 15.7c 15.4c
Belgium 12.2 12.3 12.1 13.3 13.0 .. ..
Canada 17.4 7.2 7.1 6.6 6.0 5.9 6.0p
Chile .. 3.3 19.0a 19.8 21.3 17.5 15.1p
Czech Republic 3.1 8.9 11.3 13.9 19.7 25.9 27.2
Denmark .. .. 8.6 7.2 7.1 7.2c 7.2c,p
Estonia 12.7 9.4 11.3 11.4 11.9 10.0 10.3
Finland 2.7 6.6 6.6 6.9 6.5 8.8 11.5
France 7.2a 8.0 7.0 7.5a 7.7 7.6 ..
Germany 2.1c 4.0 3.8 3.9 4.2 4.3 4.4c,p
Greece .. 5.7a,c 8.7c 11.9c 14.8 15.8 14.0
Hungary 10.6d,v 9.3 10.9 12.4 13.5 15.4 16.6
Iceland .. 10.0 11.4 .. 8.2a .. 19.3a
Ireland 8.9c 15.6 16.5c 17.0c 20.8c 21.4c ..
Israel1 22.3a,d 31.0d 46.7a,d 46.4d 45.5d 48.8d ..
Italy .. 7.9 9.4 9.8 9.1 9.5 ..
Japan 0.4 0.4a 0.4 0.4 0.5 0.4 0.5
Korea 0.1g 0.3 0.2 0.2 0.2 0.3 0.3
Luxembourg 1.6 .. 5.4 20.7 20.4 .. ..
Mexico 0.9 1.8 1.8 0.5 0.7 0.4c,p 0.4c,p
Netherlands .. .. 10.8 .. 11.3a 12.5a 12.2
New Zealand .. .. 5.2 .. 6.3 .. 7.2
Norway .. .. 8.2 .. 7.8 .. 9.5
Poland 1.8 5.4 5.5 11.8 13.4 13.3 13.1
Portugal 5.2c 3.0a 4.1 3.2 6.0 5.2 ..
Slovak Republic 2.3 12.3 12.8 14.7 14.2 18.7 18.0
Slovenia 6.2 5.6a 6.0 6.0 7.0a 8.6 8.9
Spain 4.9 5.7a 5.5 5.7 6.7 6.6 7.4
Sweden .. .. 10.4 .. 11.1 .. 6.8
Switzerland 4.3 6.0 .. .. .. 12.1 ..
Turkey 1.2 1.3 1.1 0.8 0.7 0.6 0.8
United Kingdom 16.0 17.7c 16.6c 17.6c 17.8 19.8c 20.6c,p
United States ..n ..n 2.9a,j 3.7j 3.8j 4.0j 4.5j,p
EU28 (OECD estimates) 7.1b 8.6b 8.4b 8.9b 9.3b 9.8b ..
OECD-Total .. .. 4.6b 5.1b 5.2b 5.5b ..
Argentina 1.6c 0.6 0.7 0.6 0.5 0.6 0.5
China 2.7 1.2 1.3a 1.3 1.3 1.0 0.9
Romania 4.9 4.0 8.3 11.1 12.1a 14.4 15.5
Russian Federation 12.0 5.9 6.5 3.5 4.3 4.0 3.0
Singapore 4.0 5.3 5.9 4.9 5.0 5.9 ..
South Africa .. 11.4 12.1 12.1 15.0 13.1 ..
Chinese Taipei 0.0d 0.0 0.0 0.0 0.0 0.1 0.1
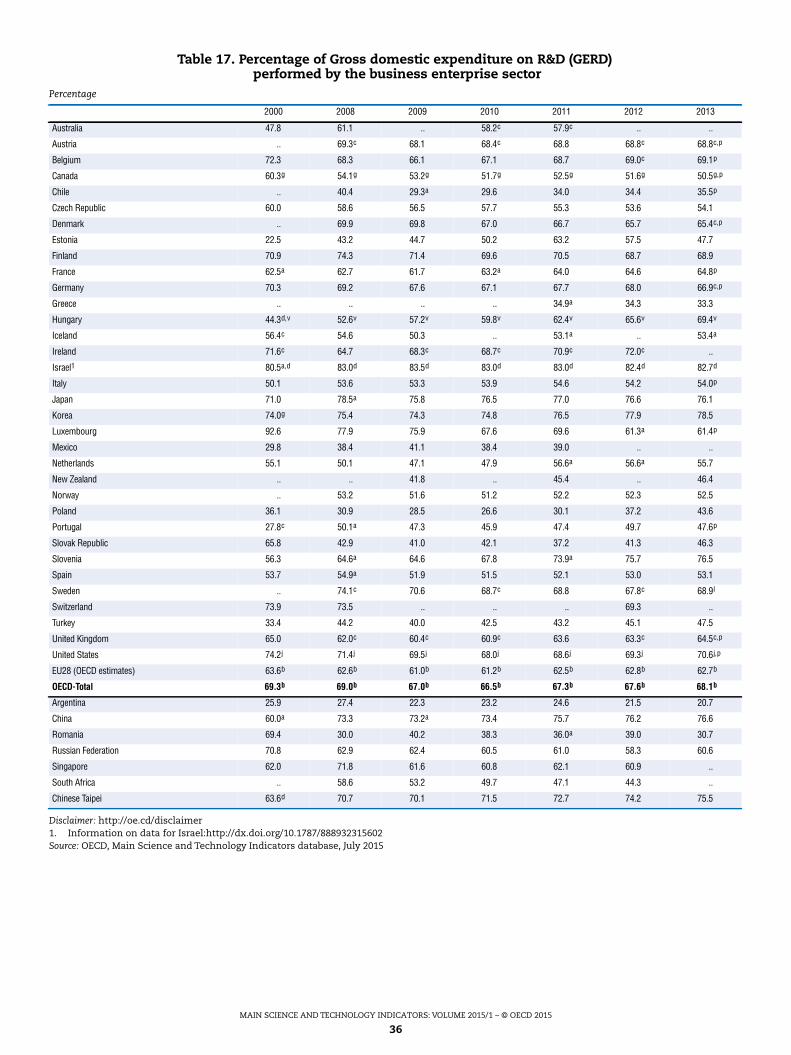
MAIN SCIENCE AND TECHNOLOGY INDICATORS: VOLUME 2015/1 – © OECD 2015
36
Disclaimer: http://oe.cd/disclaimer1. Information on data for Israel:http://dx.doi.org/10.1787/888932315602Source: OECD, Main Science and Technology Indicators database, July 2015
Table 17. Percentage of Gross domestic expenditure on R&D (GERD)performed by the business enterprise sector
Percentage
2000 2008 2009 2010 2011 2012 2013
Australia 47.8 61.1 .. 58.2c 57.9c .. ..
Austria .. 69.3c 68.1 68.4c 68.8 68.8c 68.8c,p
Belgium 72.3 68.3 66.1 67.1 68.7 69.0c 69.1p
Canada 60.3g 54.1g 53.2g 51.7g 52.5g 51.6g 50.5g,p
Chile .. 40.4 29.3a 29.6 34.0 34.4 35.5p
Czech Republic 60.0 58.6 56.5 57.7 55.3 53.6 54.1
Denmark .. 69.9 69.8 67.0 66.7 65.7 65.4c,p
Estonia 22.5 43.2 44.7 50.2 63.2 57.5 47.7
Finland 70.9 74.3 71.4 69.6 70.5 68.7 68.9
France 62.5a 62.7 61.7 63.2a 64.0 64.6 64.8p
Germany 70.3 69.2 67.6 67.1 67.7 68.0 66.9c,p
Greece .. .. .. .. 34.9a 34.3 33.3
Hungary 44.3d,v 52.6v 57.2v 59.8v 62.4v 65.6v 69.4v
Iceland 56.4c 54.6 50.3 .. 53.1a .. 53.4a
Ireland 71.6c 64.7 68.3c 68.7c 70.9c 72.0c ..
Israel1 80.5a,d 83.0d 83.5d 83.0d 83.0d 82.4d 82.7d
Italy 50.1 53.6 53.3 53.9 54.6 54.2 54.0p
Japan 71.0 78.5a 75.8 76.5 77.0 76.6 76.1
Korea 74.0g 75.4 74.3 74.8 76.5 77.9 78.5
Luxembourg 92.6 77.9 75.9 67.6 69.6 61.3a 61.4p
Mexico 29.8 38.4 41.1 38.4 39.0 .. ..
Netherlands 55.1 50.1 47.1 47.9 56.6a 56.6a 55.7
New Zealand .. .. 41.8 .. 45.4 .. 46.4
Norway .. 53.2 51.6 51.2 52.2 52.3 52.5
Poland 36.1 30.9 28.5 26.6 30.1 37.2 43.6
Portugal 27.8c 50.1a 47.3 45.9 47.4 49.7 47.6p
Slovak Republic 65.8 42.9 41.0 42.1 37.2 41.3 46.3
Slovenia 56.3 64.6a 64.6 67.8 73.9a 75.7 76.5
Spain 53.7 54.9a 51.9 51.5 52.1 53.0 53.1
Sweden .. 74.1c 70.6 68.7c 68.8 67.8c 68.9l
Switzerland 73.9 73.5 .. .. .. 69.3 ..
Turkey 33.4 44.2 40.0 42.5 43.2 45.1 47.5
United Kingdom 65.0 62.0c 60.4c 60.9c 63.6 63.3c 64.5c,p
United States 74.2j 71.4j 69.5j 68.0j 68.6j 69.3j 70.6j,p
EU28 (OECD estimates) 63.6b 62.6b 61.0b 61.2b 62.5b 62.8b 62.7b
OECD-Total 69.3b 69.0b 67.0b 66.5b 67.3b 67.6b 68.1b
Argentina 25.9 27.4 22.3 23.2 24.6 21.5 20.7
China 60.0a 73.3 73.2a 73.4 75.7 76.2 76.6
Romania 69.4 30.0 40.2 38.3 36.0a 39.0 30.7
Russian Federation 70.8 62.9 62.4 60.5 61.0 58.3 60.6
Singapore 62.0 71.8 61.6 60.8 62.1 60.9 ..
South Africa .. 58.6 53.2 49.7 47.1 44.3 ..
Chinese Taipei 63.6d 70.7 70.1 71.5 72.7 74.2 75.5
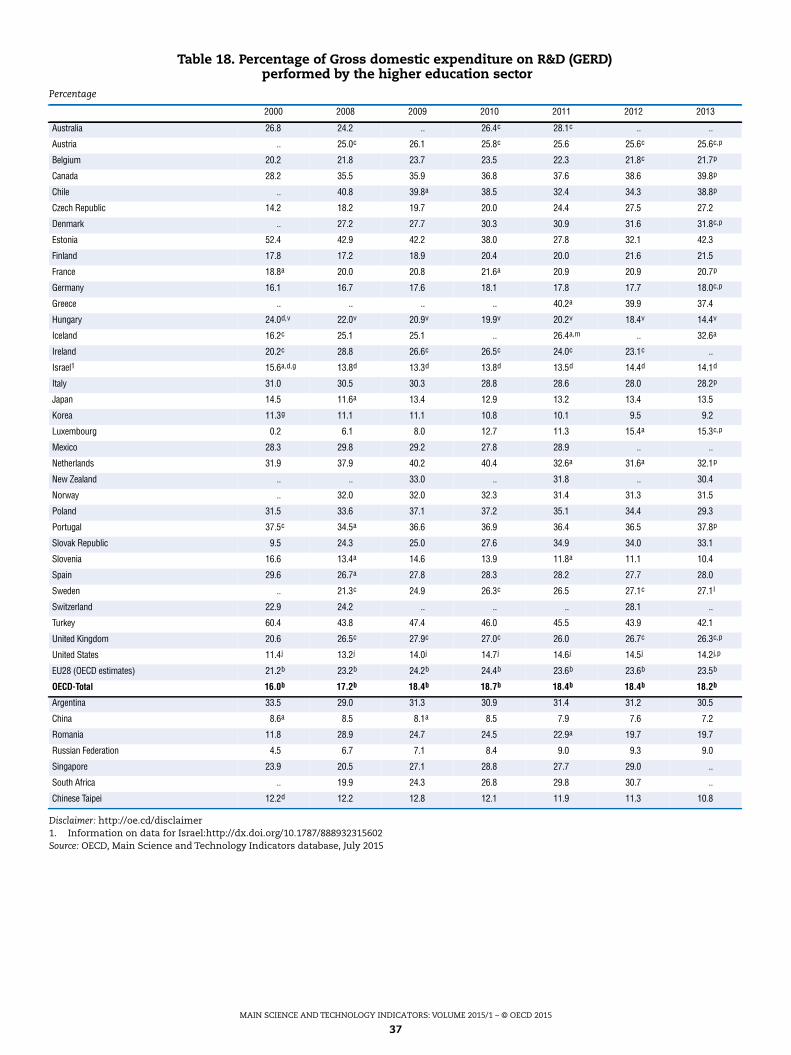
MAIN SCIENCE AND TECHNOLOGY INDICATORS: VOLUME 2015/1 – © OECD 2015
37
Disclaimer: http://oe.cd/disclaimer1. Information on data for Israel:http://dx.doi.org/10.1787/888932315602Source: OECD, Main Science and Technology Indicators database, July 2015
Table 18. Percentage of Gross domestic expenditure on R&D (GERD)performed by the higher education sector
Percentage
2000 2008 2009 2010 2011 2012 2013
Australia 26.8 24.2 .. 26.4c 28.1c .. ..
Austria .. 25.0c 26.1 25.8c 25.6 25.6c 25.6c,p
Belgium 20.2 21.8 23.7 23.5 22.3 21.8c 21.7p
Canada 28.2 35.5 35.9 36.8 37.6 38.6 39.8p
Chile .. 40.8 39.8a 38.5 32.4 34.3 38.8p
Czech Republic 14.2 18.2 19.7 20.0 24.4 27.5 27.2
Denmark .. 27.2 27.7 30.3 30.9 31.6 31.8c,p
Estonia 52.4 42.9 42.2 38.0 27.8 32.1 42.3
Finland 17.8 17.2 18.9 20.4 20.0 21.6 21.5
France 18.8a 20.0 20.8 21.6a 20.9 20.9 20.7p
Germany 16.1 16.7 17.6 18.1 17.8 17.7 18.0c,p
Greece .. .. .. .. 40.2a 39.9 37.4
Hungary 24.0d,v 22.0v 20.9v 19.9v 20.2v 18.4v 14.4v
Iceland 16.2c 25.1 25.1 .. 26.4a,m .. 32.6a
Ireland 20.2c 28.8 26.6c 26.5c 24.0c 23.1c ..
Israel1 15.6a,d,g 13.8d 13.3d 13.8d 13.5d 14.4d 14.1d
Italy 31.0 30.5 30.3 28.8 28.6 28.0 28.2p
Japan 14.5 11.6a 13.4 12.9 13.2 13.4 13.5
Korea 11.3g 11.1 11.1 10.8 10.1 9.5 9.2
Luxembourg 0.2 6.1 8.0 12.7 11.3 15.4a 15.3c,p
Mexico 28.3 29.8 29.2 27.8 28.9 .. ..
Netherlands 31.9 37.9 40.2 40.4 32.6a 31.6a 32.1p
New Zealand .. .. 33.0 .. 31.8 .. 30.4
Norway .. 32.0 32.0 32.3 31.4 31.3 31.5
Poland 31.5 33.6 37.1 37.2 35.1 34.4 29.3
Portugal 37.5c 34.5a 36.6 36.9 36.4 36.5 37.8p
Slovak Republic 9.5 24.3 25.0 27.6 34.9 34.0 33.1
Slovenia 16.6 13.4a 14.6 13.9 11.8a 11.1 10.4
Spain 29.6 26.7a 27.8 28.3 28.2 27.7 28.0
Sweden .. 21.3c 24.9 26.3c 26.5 27.1c 27.1l
Switzerland 22.9 24.2 .. .. .. 28.1 ..
Turkey 60.4 43.8 47.4 46.0 45.5 43.9 42.1
United Kingdom 20.6 26.5c 27.9c 27.0c 26.0 26.7c 26.3c,p
United States 11.4j 13.2j 14.0j 14.7j 14.6j 14.5j 14.2j,p
EU28 (OECD estimates) 21.2b 23.2b 24.2b 24.4b 23.6b 23.6b 23.5b
OECD-Total 16.0b 17.2b 18.4b 18.7b 18.4b 18.4b 18.2b
Argentina 33.5 29.0 31.3 30.9 31.4 31.2 30.5
China 8.6a 8.5 8.1a 8.5 7.9 7.6 7.2
Romania 11.8 28.9 24.7 24.5 22.9a 19.7 19.7
Russian Federation 4.5 6.7 7.1 8.4 9.0 9.3 9.0
Singapore 23.9 20.5 27.1 28.8 27.7 29.0 ..
South Africa .. 19.9 24.3 26.8 29.8 30.7 ..
Chinese Taipei 12.2d 12.2 12.8 12.1 11.9 11.3 10.8

MAIN SCIENCE AND TECHNOLOGY INDICATORS: VOLUME 2015/1 – © OECD 2015
38
Disclaimer: http://oe.cd/disclaimer1. Information on data for Israel:http://dx.doi.org/10.1787/888932315602Source: OECD, Main Science and Technology Indicators database, July 2015
Table 19. Percentage of Gross domestic expenditure on R&D (GERD)performed by the government sector
Percentage
2000 2008 2009 2010 2011 2012 2013
Australia 22.6 12.1 .. 12.4c 11.2c .. ..
Austria .. 5.3c 5.3 5.2c 5.1 5.1c 5.1c,p
Belgium 6.3 8.9 9.2 8.4 8.1 8.8c 8.8p
Canada 11.2 9.8 10.4 11.0 9.5 9.3 9.2p
Chile .. 9.7 3.3a 3.7 4.0 4.1 4.7p
Czech Republic 25.3 22.7 23.3 21.7 19.8 18.4 18.3
Denmark .. 2.6 2.1 2.2 2.0 2.4 2.4c,p
Estonia 23.1 11.8 11.0 10.6 8.1 9.3 8.9
Finland 10.6 8.0 9.1 9.2 8.8 9.0 8.9
France 17.3a 16.0 16.3 14.0a 13.9 13.1 13.1p
Germany 13.6o 14.0o 14.8o 14.8o 14.5o 14.3o 15.1c,o,p
Greece .. .. .. .. 23.8a 24.8 28.0
Hungary 26.1d,v 23.4v 20.1v 18.5v 15.8v 14.4v 14.9v
Iceland 25.5c 17.8 22.1 .. 17.7a .. 12.7a
Ireland 8.1c 6.5 5.0c 4.8c 5.0c 4.8c ..
Israel1 3.2a,d 1.8d 1.9d 2.0d 2.3d 2.1d 2.1d
Italy 18.9 12.7 13.1 13.7 13.4 14.8 14.9p
Japan 9.9 8.3a 9.2 9.0 8.4 8.6 9.2
Korea 13.3g 12.1 13.0 12.7 11.7 11.3 10.9
Luxembourg 7.1 16.0 16.1a 19.7 19.2 23.4a 23.3c,p
Mexico 41.7 29.0 26.8 32.4 30.5 .. ..
Netherlands 12.0a 12.0o 12.7o 11.7o 10.8a,o 11.8a,o 12.2o
New Zealand .. .. 25.3 .. 22.7 .. 23.2
Norway .. 14.8 16.4 16.4 16.4 16.4 16.0
Poland 32.2 35.3 34.3 35.9 34.5 28.0 26.8
Portugal 23.9c 7.3a 7.3 7.1 7.4 5.4 5.8p
Slovak Republic 24.7d 32.8d 33.9d 30.0d 27.7d 24.5d 20.5d
Slovenia 25.9 21.9a 20.8 18.2 14.3a 13.1 13.0
Spain 15.8 18.2a 20.1 20.1 19.5 19.1 18.7
Sweden .. 4.4c 4.4 4.9c 4.3 4.8c 3.7
Switzerland 1.3a,h 0.7h .. .. .. 0.8h ..
Turkey 6.2 11.9 12.6 11.4 11.3 11.0 10.4
United Kingdom 12.6 9.2c 9.2c 9.5c 8.6 8.0c 7.3c,p
United States 10.8h,j 11.3h,j 12.0j 12.7j 12.6j 12.0j 11.2j,p
EU28 (OECD estimates) 14.2b 13.2b 13.6b 13.3b 12.9b 12.8b 12.8b
OECD-Total 11.9b 11.3b 12.0b 12.2b 11.8b 11.5b 11.3b
Argentina 38.3 41.8 44.7 44.3 42.3 45.6 47.0
China 31.5a 18.3 18.7a 18.1 16.3 16.3 16.2
Romania 18.8 41.0 34.9 36.8 40.7a 40.9 49.2
Russian Federation 24.4 30.1 30.3 31.0 29.8 32.2 30.3
Singapore 14.1 7.6 11.3 10.4 10.2 10.0 ..
South Africa .. 20.3 21.6 22.7 22.4 22.9 ..
Chinese Taipei 23.5d 16.8 16.8 16.0 15.1 14.2 13.4

MAIN SCIENCE AND TECHNOLOGY INDICATORS: VOLUME 2015/1 – © OECD 2015
39
Disclaimer: http://oe.cd/disclaimer1. Information on data for Israel:http://dx.doi.org/10.1787/888932315602Source: OECD, Main Science and Technology Indicators database, July 2015
Table 20. Percentage of Gross domestic expenditure on R&D (GERD)performed by the private non-profit sector
Percentage
2000 2008 2009 2010 2011 2012 2013
Australia 2.77 2.63 .. 2.96c 2.98c .. ..
Austria .. 0.37c 0.48a 0.49c 0.49 0.49c 0.49c,p
Belgium 1.18 0.98 1.00 0.91 0.90 0.44c 0.43p
Canada 0.28 0.58 0.41 0.44 0.40 0.48 0.52p
Chile .. 9.09 27.53a 28.16 29.57 27.23 20.96p
Czech Republic 0.51 0.42 0.54 0.61 0.55 0.51 0.34
Denmark .. 0.32 0.42 0.44 0.37 0.40 0.40c,p
Estonia 1.95 2.08 2.17 1.25 0.91 1.05 1.06
Finland 0.67 0.53 0.58 0.68 0.71 0.68 0.71
France 1.42a 1.25 1.20 1.25a 1.25 1.35 1.35p
Germany ..n ..n ..n ..n ..n ..n ..n
Greece .. .. .. .. 1.01 0.96 1.25
Hungary .. .. .. .. .. .. ..
Iceland 1.87c 2.47 2.46 .. 2.75a .. 1.30a
Ireland .. .. .. .. .. .. ..
Israel1 0.75a,d 1.36d 1.30d 1.22d 1.20d 1.10d 1.05d
Italy .. 3.24 3.30 3.62 3.34 2.96 2.88p
Japan 4.62 1.57a 1.61 1.59 1.45 1.40 1.28
Korea 1.36g 1.43 1.64 1.71 1.65 1.28 1.33
Luxembourg .. .. .. .. .. .. ..
Mexico 0.26 2.79 2.91 1.41 1.61 .. ..
Netherlands ..n ..n ..n ..n ..n ..n ..n
New Zealand .. .. .. .. .. .. ..
Norway .. .. .. .. .. .. ..
Poland 0.13 0.09 0.13 0.28 0.23 0.40 0.29
Portugal 10.79c 8.14a 8.81 10.09 8.84 8.47 8.80p
Slovak Republic 0.00 0.06 0.05 0.31 0.21 0.10 0.15
Slovenia 1.17 0.10a 0.07 0.06 0.05a 0.05 0.04
Spain 0.90 0.16a 0.20 0.19 0.17 0.19 0.17
Sweden .. 0.20c 0.07a,m 0.03c,m 0.32a 0.29c 0.22l
Switzerland 1.92 1.60 .. .. .. 1.84 ..
Turkey .. .. .. .. .. .. ..
United Kingdom 1.82 2.36c 2.48c 2.48c 1.81 1.91c 1.88c,p
United States 3.63c,j 4.03c,j 4.47c,j 4.54c,j 4.27c,j 4.18c,j 4.10c,j,p
EU28 (OECD estimates) 0.90b 1.13b 1.18b 1.21b 1.06b 1.03b 1.02b
OECD-Total 2.71b 2.46b 2.68b 2.69b 2.51b 2.42b 2.38b
Argentina 2.37 1.73 1.69 1.63 1.66 1.76 1.75
China .. .. .. .. .. .. ..
Romania .. 0.23 0.17 0.41 0.38a 0.40 0.40
Russian Federation 0.22 0.26 0.23 0.19 0.17 0.18 0.13
Singapore .. .. .. .. .. .. ..
South Africa .. 1.14 0.90 0.80 0.77 2.11 ..
Chinese Taipei 0.70d 0.34 0.37 0.36 0.34 0.31 0.32
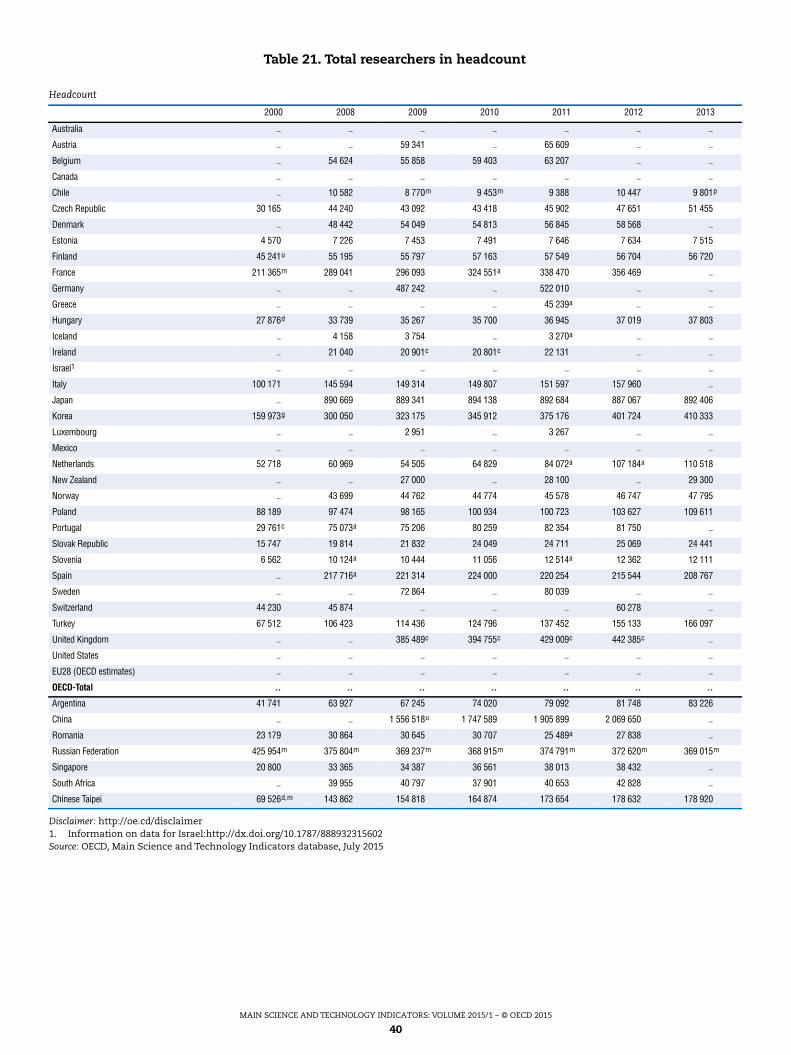
MAIN SCIENCE AND TECHNOLOGY INDICATORS: VOLUME 2015/1 – © OECD 2015
40
Disclaimer: http://oe.cd/disclaimer1. Information on data for Israel:http://dx.doi.org/10.1787/888932315602Source: OECD, Main Science and Technology Indicators database, July 2015
Table 21. Total researchers in headcount
Headcount
2000 2008 2009 2010 2011 2012 2013
Australia .. .. .. .. .. .. ..
Austria .. .. 59 341 .. 65 609 .. ..
Belgium .. 54 624 55 858 59 403 63 207 .. ..
Canada .. .. .. .. .. .. ..
Chile .. 10 582 8 770m 9 453m 9 388 10 447 9 801p
Czech Republic 30 165 44 240 43 092 43 418 45 902 47 651 51 455
Denmark .. 48 442 54 049 54 813 56 845 58 568 ..
Estonia 4 570 7 226 7 453 7 491 7 646 7 634 7 515
Finland 45 241u 55 195 55 797 57 163 57 549 56 704 56 720
France 211 365m 289 041 296 093 324 551a 338 470 356 469 ..
Germany .. .. 487 242 .. 522 010 .. ..
Greece .. .. .. .. 45 239a .. ..
Hungary 27 876d 33 739 35 267 35 700 36 945 37 019 37 803
Iceland .. 4 158 3 754 .. 3 270a .. ..
Ireland .. 21 040 20 901c 20 801c 22 131 .. ..
Israel1 .. .. .. .. .. .. ..
Italy 100 171 145 594 149 314 149 807 151 597 157 960 ..
Japan .. 890 669 889 341 894 138 892 684 887 067 892 406
Korea 159 973g 300 050 323 175 345 912 375 176 401 724 410 333
Luxembourg .. .. 2 951 .. 3 267 .. ..
Mexico .. .. .. .. .. .. ..
Netherlands 52 718 60 969 54 505 64 829 84 072a 107 184a 110 518
New Zealand .. .. 27 000 .. 28 100 .. 29 300
Norway .. 43 699 44 762 44 774 45 578 46 747 47 795
Poland 88 189 97 474 98 165 100 934 100 723 103 627 109 611
Portugal 29 761c 75 073a 75 206 80 259 82 354 81 750 ..
Slovak Republic 15 747 19 814 21 832 24 049 24 711 25 069 24 441
Slovenia 6 562 10 124a 10 444 11 056 12 514a 12 362 12 111
Spain .. 217 716a 221 314 224 000 220 254 215 544 208 767
Sweden .. .. 72 864 .. 80 039 .. ..
Switzerland 44 230 45 874 .. .. .. 60 278 ..
Turkey 67 512 106 423 114 436 124 796 137 452 155 133 166 097
United Kingdom .. .. 385 489c 394 755c 429 009c 442 385c ..
United States .. .. .. .. .. .. ..
EU28 (OECD estimates) .. .. .. .. .. .. ..
OECD-Total .. .. .. .. .. .. ..
Argentina 41 741 63 927 67 245 74 020 79 092 81 748 83 226
China .. .. 1 556 518u 1 747 589 1 905 899 2 069 650 ..
Romania 23 179 30 864 30 645 30 707 25 489a 27 838 ..
Russian Federation 425 954m 375 804m 369 237m 368 915m 374 791m 372 620m 369 015m
Singapore 20 800 33 365 34 387 36 561 38 013 38 432 ..
South Africa .. 39 955 40 797 37 901 40 653 42 828 ..
Chinese Taipei 69 526d,m 143 862 154 818 164 874 173 654 178 632 178 920
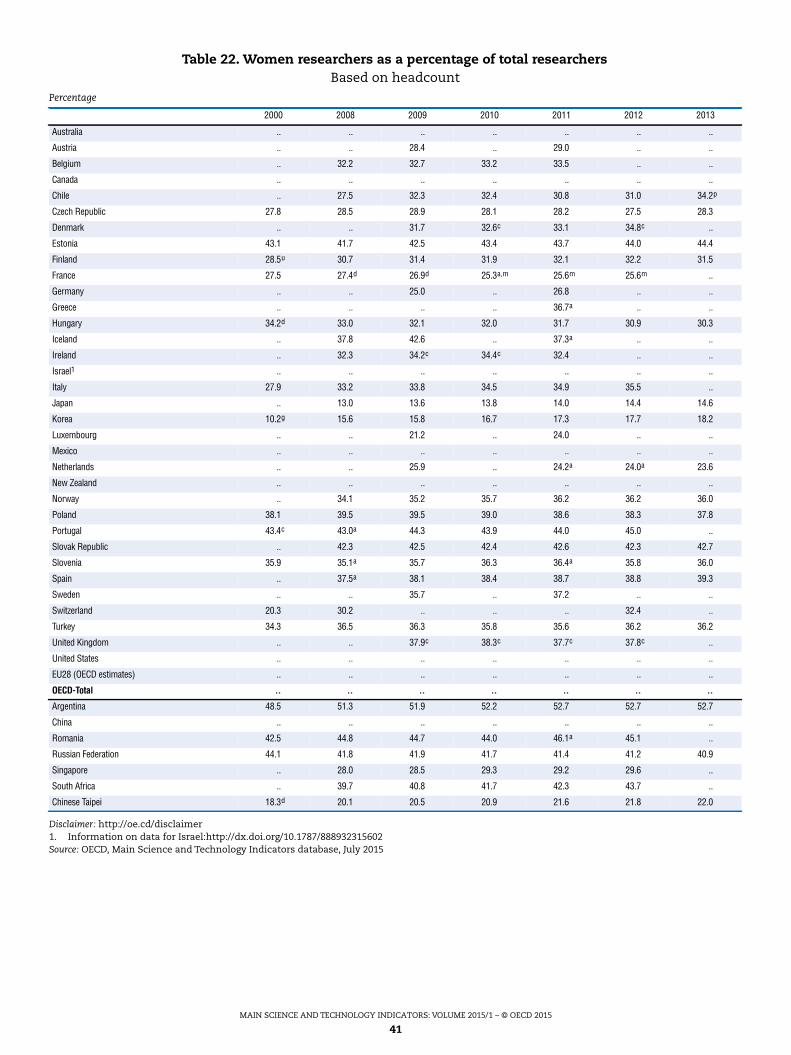
MAIN SCIENCE AND TECHNOLOGY INDICATORS: VOLUME 2015/1 – © OECD 2015
41
Disclaimer: http://oe.cd/disclaimer1. Information on data for Israel:http://dx.doi.org/10.1787/888932315602Source: OECD, Main Science and Technology Indicators database, July 2015
Table 22. Women researchers as a percentage of total researchersBased on headcount
Percentage
2000 2008 2009 2010 2011 2012 2013
Australia .. .. .. .. .. .. ..
Austria .. .. 28.4 .. 29.0 .. ..
Belgium .. 32.2 32.7 33.2 33.5 .. ..
Canada .. .. .. .. .. .. ..
Chile .. 27.5 32.3 32.4 30.8 31.0 34.2p
Czech Republic 27.8 28.5 28.9 28.1 28.2 27.5 28.3
Denmark .. .. 31.7 32.6c 33.1 34.8c ..
Estonia 43.1 41.7 42.5 43.4 43.7 44.0 44.4
Finland 28.5u 30.7 31.4 31.9 32.1 32.2 31.5
France 27.5 27.4d 26.9d 25.3a,m 25.6m 25.6m ..
Germany .. .. 25.0 .. 26.8 .. ..
Greece .. .. .. .. 36.7a .. ..
Hungary 34.2d 33.0 32.1 32.0 31.7 30.9 30.3
Iceland .. 37.8 42.6 .. 37.3a .. ..
Ireland .. 32.3 34.2c 34.4c 32.4 .. ..
Israel1 .. .. .. .. .. .. ..
Italy 27.9 33.2 33.8 34.5 34.9 35.5 ..
Japan .. 13.0 13.6 13.8 14.0 14.4 14.6
Korea 10.2g 15.6 15.8 16.7 17.3 17.7 18.2
Luxembourg .. .. 21.2 .. 24.0 .. ..
Mexico .. .. .. .. .. .. ..
Netherlands .. .. 25.9 .. 24.2a 24.0a 23.6
New Zealand .. .. .. .. .. .. ..
Norway .. 34.1 35.2 35.7 36.2 36.2 36.0
Poland 38.1 39.5 39.5 39.0 38.6 38.3 37.8
Portugal 43.4c 43.0a 44.3 43.9 44.0 45.0 ..
Slovak Republic .. 42.3 42.5 42.4 42.6 42.3 42.7
Slovenia 35.9 35.1a 35.7 36.3 36.4a 35.8 36.0
Spain .. 37.5a 38.1 38.4 38.7 38.8 39.3
Sweden .. .. 35.7 .. 37.2 .. ..
Switzerland 20.3 30.2 .. .. .. 32.4 ..
Turkey 34.3 36.5 36.3 35.8 35.6 36.2 36.2
United Kingdom .. .. 37.9c 38.3c 37.7c 37.8c ..
United States .. .. .. .. .. .. ..
EU28 (OECD estimates) .. .. .. .. .. .. ..
OECD-Total .. .. .. .. .. .. ..
Argentina 48.5 51.3 51.9 52.2 52.7 52.7 52.7
China .. .. .. .. .. .. ..
Romania 42.5 44.8 44.7 44.0 46.1a 45.1 ..
Russian Federation 44.1 41.8 41.9 41.7 41.4 41.2 40.9
Singapore .. 28.0 28.5 29.3 29.2 29.6 ..
South Africa .. 39.7 40.8 41.7 42.3 43.7 ..
Chinese Taipei 18.3d 20.1 20.5 20.9 21.6 21.8 22.0
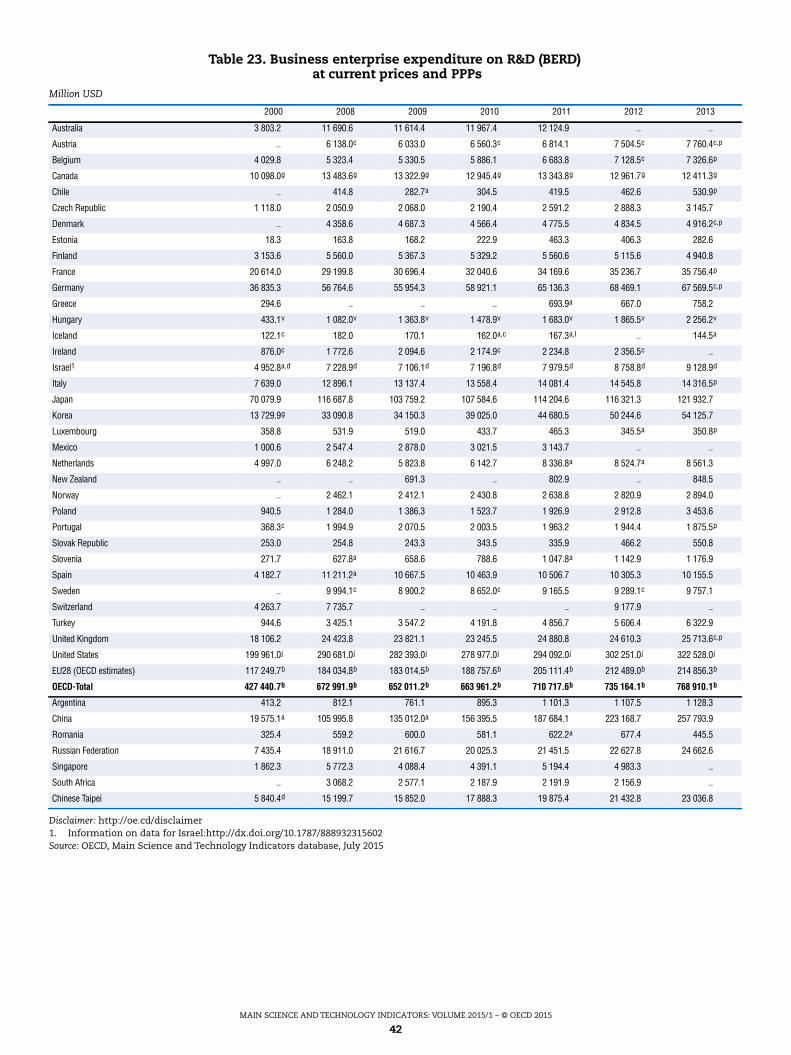
MAIN SCIENCE AND TECHNOLOGY INDICATORS: VOLUME 2015/1 – © OECD 2015
42
Disclaimer: http://oe.cd/disclaimer1. Information on data for Israel:http://dx.doi.org/10.1787/888932315602Source: OECD, Main Science and Technology Indicators database, July 2015
Table 23. Business enterprise expenditure on R&D (BERD)at current prices and PPPs
Million USD
2000 2008 2009 2010 2011 2012 2013
Australia 3 803.2 11 690.6 11 614.4 11 967.4 12 124.9 .. ..
Austria .. 6 138.0c 6 033.0 6 560.3c 6 814.1 7 504.5c 7 760.4c,p
Belgium 4 029.8 5 323.4 5 330.5 5 886.1 6 683.8 7 128.5c 7 326.6p
Canada 10 098.0g 13 483.6g 13 322.9g 12 945.4g 13 343.8g 12 961.7g 12 411.3g
Chile .. 414.8 282.7a 304.5 419.5 462.6 530.9p
Czech Republic 1 118.0 2 050.9 2 068.0 2 190.4 2 591.2 2 888.3 3 145.7
Denmark .. 4 358.6 4 687.3 4 566.4 4 775.5 4 834.5 4 916.2c,p
Estonia 18.3 163.8 168.2 222.9 463.3 406.3 282.6
Finland 3 153.6 5 560.0 5 367.3 5 329.2 5 560.6 5 115.6 4 940.8
France 20 614.0 29 199.8 30 696.4 32 040.6 34 169.6 35 236.7 35 756.4p
Germany 36 835.3 56 764.6 55 954.3 58 921.1 65 136.3 68 469.1 67 569.5c,p
Greece 294.6 .. .. .. 693.9a 667.0 758.2
Hungary 433.1v 1 082.0v 1 363.8v 1 478.9v 1 683.0v 1 865.5v 2 256.2v
Iceland 122.1c 182.0 170.1 162.0a,c 167.3a,l .. 144.5a
Ireland 876.0c 1 772.6 2 094.6 2 174.9c 2 234.8 2 356.5c ..
Israel1 4 952.8a,d 7 228.9d 7 106.1d 7 196.8d 7 979.5d 8 758.8d 9 128.9d
Italy 7 639.0 12 896.1 13 137.4 13 558.4 14 081.4 14 545.8 14 316.5p
Japan 70 079.9 116 687.8 103 759.2 107 584.6 114 204.6 116 321.3 121 932.7
Korea 13 729.9g 33 090.8 34 150.3 39 025.0 44 680.5 50 244.6 54 125.7
Luxembourg 358.8 531.9 519.0 433.7 465.3 345.5a 350.8p
Mexico 1 000.6 2 547.4 2 878.0 3 021.5 3 143.7 .. ..
Netherlands 4 997.0 6 248.2 5 823.8 6 142.7 8 336.8a 8 524.7a 8 561.3
New Zealand .. .. 691.3 .. 802.9 .. 848.5
Norway .. 2 462.1 2 412.1 2 430.8 2 638.8 2 820.9 2 894.0
Poland 940.5 1 284.0 1 386.3 1 523.7 1 926.9 2 912.8 3 453.6
Portugal 368.3c 1 994.9 2 070.5 2 003.5 1 963.2 1 944.4 1 875.5p
Slovak Republic 253.0 254.8 243.3 343.5 335.9 466.2 550.8
Slovenia 271.7 627.8a 658.6 788.6 1 047.8a 1 142.9 1 176.9
Spain 4 182.7 11 211.2a 10 667.5 10 463.9 10 506.7 10 305.3 10 155.5
Sweden .. 9 994.1c 8 900.2 8 652.0c 9 165.5 9 289.1c 9 757.1
Switzerland 4 263.7 7 735.7 .. .. .. 9 177.9 ..
Turkey 944.6 3 425.1 3 547.2 4 191.8 4 856.7 5 606.4 6 322.9
United Kingdom 18 106.2 24 423.8 23 821.1 23 245.5 24 880.8 24 610.3 25 713.6c,p
United States 199 961.0j 290 681.0j 282 393.0j 278 977.0j 294 092.0j 302 251.0j 322 528.0j
EU28 (OECD estimates) 117 249.7b 184 034.8b 183 014.5b 188 757.6b 205 111.4b 212 489.0b 214 856.3b
OECD-Total 427 440.7b 672 991.9b 652 011.2b 663 961.2b 710 717.6b 735 164.1b 768 910.1b
Argentina 413.2 812.1 761.1 895.3 1 101.3 1 107.5 1 128.3
China 19 575.1a 105 995.8 135 012.0a 156 395.5 187 684.1 223 168.7 257 793.9
Romania 325.4 559.2 600.0 581.1 622.2a 677.4 445.5
Russian Federation 7 435.4 18 911.0 21 616.7 20 025.3 21 451.5 22 627.8 24 662.6
Singapore 1 862.3 5 772.3 4 088.4 4 391.1 5 194.4 4 983.3 ..
South Africa .. 3 068.2 2 577.1 2 187.9 2 191.9 2 156.9 ..
Chinese Taipei 5 840.4d 15 199.7 15 852.0 17 888.3 19 875.4 21 432.8 23 036.8
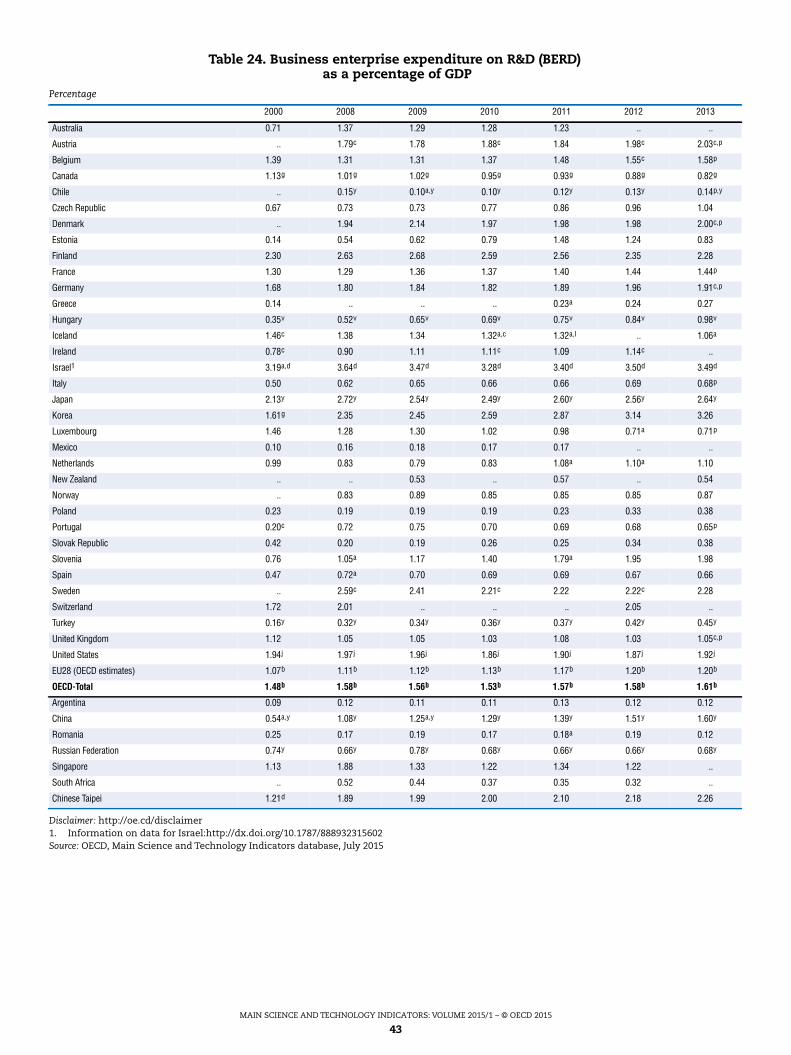
MAIN SCIENCE AND TECHNOLOGY INDICATORS: VOLUME 2015/1 – © OECD 2015
43
Disclaimer: http://oe.cd/disclaimer1. Information on data for Israel:http://dx.doi.org/10.1787/888932315602Source: OECD, Main Science and Technology Indicators database, July 2015
Table 24. Business enterprise expenditure on R&D (BERD)as a percentage of GDP
Percentage
2000 2008 2009 2010 2011 2012 2013
Australia 0.71 1.37 1.29 1.28 1.23 .. ..
Austria .. 1.79c 1.78 1.88c 1.84 1.98c 2.03c,p
Belgium 1.39 1.31 1.31 1.37 1.48 1.55c 1.58p
Canada 1.13g 1.01g 1.02g 0.95g 0.93g 0.88g 0.82g
Chile .. 0.15y 0.10a,y 0.10y 0.12y 0.13y 0.14p,y
Czech Republic 0.67 0.73 0.73 0.77 0.86 0.96 1.04
Denmark .. 1.94 2.14 1.97 1.98 1.98 2.00c,p
Estonia 0.14 0.54 0.62 0.79 1.48 1.24 0.83
Finland 2.30 2.63 2.68 2.59 2.56 2.35 2.28
France 1.30 1.29 1.36 1.37 1.40 1.44 1.44p
Germany 1.68 1.80 1.84 1.82 1.89 1.96 1.91c,p
Greece 0.14 .. .. .. 0.23a 0.24 0.27
Hungary 0.35v 0.52v 0.65v 0.69v 0.75v 0.84v 0.98v
Iceland 1.46c 1.38 1.34 1.32a,c 1.32a,l .. 1.06a
Ireland 0.78c 0.90 1.11 1.11c 1.09 1.14c ..
Israel1 3.19a,d 3.64d 3.47d 3.28d 3.40d 3.50d 3.49d
Italy 0.50 0.62 0.65 0.66 0.66 0.69 0.68p
Japan 2.13y 2.72y 2.54y 2.49y 2.60y 2.56y 2.64y
Korea 1.61g 2.35 2.45 2.59 2.87 3.14 3.26
Luxembourg 1.46 1.28 1.30 1.02 0.98 0.71a 0.71p
Mexico 0.10 0.16 0.18 0.17 0.17 .. ..
Netherlands 0.99 0.83 0.79 0.83 1.08a 1.10a 1.10
New Zealand .. .. 0.53 .. 0.57 .. 0.54
Norway .. 0.83 0.89 0.85 0.85 0.85 0.87
Poland 0.23 0.19 0.19 0.19 0.23 0.33 0.38
Portugal 0.20c 0.72 0.75 0.70 0.69 0.68 0.65p
Slovak Republic 0.42 0.20 0.19 0.26 0.25 0.34 0.38
Slovenia 0.76 1.05a 1.17 1.40 1.79a 1.95 1.98
Spain 0.47 0.72a 0.70 0.69 0.69 0.67 0.66
Sweden .. 2.59c 2.41 2.21c 2.22 2.22c 2.28
Switzerland 1.72 2.01 .. .. .. 2.05 ..
Turkey 0.16y 0.32y 0.34y 0.36y 0.37y 0.42y 0.45y
United Kingdom 1.12 1.05 1.05 1.03 1.08 1.03 1.05c,p
United States 1.94j 1.97j 1.96j 1.86j 1.90j 1.87j 1.92j
EU28 (OECD estimates) 1.07b 1.11b 1.12b 1.13b 1.17b 1.20b 1.20b
OECD-Total 1.48b 1.58b 1.56b 1.53b 1.57b 1.58b 1.61b
Argentina 0.09 0.12 0.11 0.11 0.13 0.12 0.12
China 0.54a,y 1.08y 1.25a,y 1.29y 1.39y 1.51y 1.60y
Romania 0.25 0.17 0.19 0.17 0.18a 0.19 0.12
Russian Federation 0.74y 0.66y 0.78y 0.68y 0.66y 0.66y 0.68y
Singapore 1.13 1.88 1.33 1.22 1.34 1.22 ..
South Africa .. 0.52 0.44 0.37 0.35 0.32 ..
Chinese Taipei 1.21d 1.89 1.99 2.00 2.10 2.18 2.26
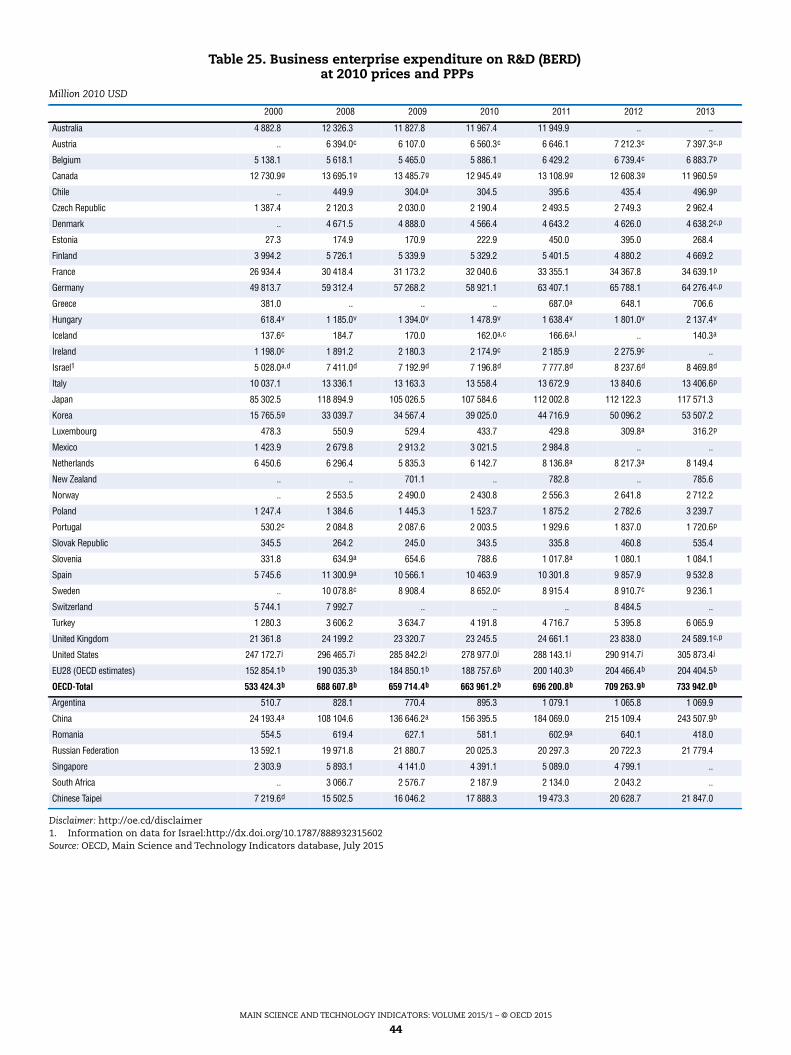
MAIN SCIENCE AND TECHNOLOGY INDICATORS: VOLUME 2015/1 – © OECD 2015
44
Disclaimer: http://oe.cd/disclaimer1. Information on data for Israel:http://dx.doi.org/10.1787/888932315602Source: OECD, Main Science and Technology Indicators database, July 2015
Table 25. Business enterprise expenditure on R&D (BERD)at 2010 prices and PPPs
Million 2010 USD
2000 2008 2009 2010 2011 2012 2013
Australia 4 882.8 12 326.3 11 827.8 11 967.4 11 949.9 .. ..
Austria .. 6 394.0c 6 107.0 6 560.3c 6 646.1 7 212.3c 7 397.3c,p
Belgium 5 138.1 5 618.1 5 465.0 5 886.1 6 429.2 6 739.4c 6 883.7p
Canada 12 730.9g 13 695.1g 13 485.7g 12 945.4g 13 108.9g 12 608.3g 11 960.5g
Chile .. 449.9 304.0a 304.5 395.6 435.4 496.9p
Czech Republic 1 387.4 2 120.3 2 030.0 2 190.4 2 493.5 2 749.3 2 962.4
Denmark .. 4 671.5 4 888.0 4 566.4 4 643.2 4 626.0 4 638.2c,p
Estonia 27.3 174.9 170.9 222.9 450.0 395.0 268.4
Finland 3 994.2 5 726.1 5 339.9 5 329.2 5 401.5 4 880.2 4 669.2
France 26 934.4 30 418.4 31 173.2 32 040.6 33 355.1 34 367.8 34 639.1p
Germany 49 813.7 59 312.4 57 268.2 58 921.1 63 407.1 65 788.1 64 276.4c,p
Greece 381.0 .. .. .. 687.0a 648.1 706.6
Hungary 618.4v 1 185.0v 1 394.0v 1 478.9v 1 638.4v 1 801.0v 2 137.4v
Iceland 137.6c 184.7 170.0 162.0a,c 166.6a,l .. 140.3a
Ireland 1 198.0c 1 891.2 2 180.3 2 174.9c 2 185.9 2 275.9c ..
Israel1 5 028.0a,d 7 411.0d 7 192.9d 7 196.8d 7 777.8d 8 237.6d 8 469.8d
Italy 10 037.1 13 336.1 13 163.3 13 558.4 13 672.9 13 840.6 13 406.6p
Japan 85 302.5 118 894.9 105 026.5 107 584.6 112 002.8 112 122.3 117 571.3
Korea 15 765.5g 33 039.7 34 567.4 39 025.0 44 716.9 50 096.2 53 507.2
Luxembourg 478.3 550.9 529.4 433.7 429.8 309.8a 316.2p
Mexico 1 423.9 2 679.8 2 913.2 3 021.5 2 984.8 .. ..
Netherlands 6 450.6 6 296.4 5 835.3 6 142.7 8 136.8a 8 217.3a 8 149.4
New Zealand .. .. 701.1 .. 782.8 .. 785.6
Norway .. 2 553.5 2 490.0 2 430.8 2 556.3 2 641.8 2 712.2
Poland 1 247.4 1 384.6 1 445.3 1 523.7 1 875.2 2 782.6 3 239.7
Portugal 530.2c 2 084.8 2 087.6 2 003.5 1 929.6 1 837.0 1 720.6p
Slovak Republic 345.5 264.2 245.0 343.5 335.8 460.8 535.4
Slovenia 331.8 634.9a 654.6 788.6 1 017.8a 1 080.1 1 084.1
Spain 5 745.6 11 300.9a 10 566.1 10 463.9 10 301.8 9 857.9 9 532.8
Sweden .. 10 078.8c 8 908.4 8 652.0c 8 915.4 8 910.7c 9 236.1
Switzerland 5 744.1 7 992.7 .. .. .. 8 484.5 ..
Turkey 1 280.3 3 606.2 3 634.7 4 191.8 4 716.7 5 395.8 6 065.9
United Kingdom 21 361.8 24 199.2 23 320.7 23 245.5 24 661.1 23 838.0 24 589.1c,p
United States 247 172.7j 296 465.7j 285 842.2j 278 977.0j 288 143.1j 290 914.7j 305 873.4j
EU28 (OECD estimates) 152 854.1b 190 035.3b 184 850.1b 188 757.6b 200 140.3b 204 466.4b 204 404.5b
OECD-Total 533 424.3b 688 607.8b 659 714.4b 663 961.2b 696 200.8b 709 263.9b 733 942.0b
Argentina 510.7 828.1 770.4 895.3 1 079.1 1 065.8 1 069.9
China 24 193.4a 108 104.6 136 646.2a 156 395.5 184 069.0 215 109.4 243 507.9b
Romania 554.5 619.4 627.1 581.1 602.9a 640.1 418.0
Russian Federation 13 592.1 19 971.8 21 880.7 20 025.3 20 297.3 20 722.3 21 779.4
Singapore 2 303.9 5 893.1 4 141.0 4 391.1 5 089.0 4 799.1 ..
South Africa .. 3 066.7 2 576.7 2 187.9 2 134.0 2 043.2 ..
Chinese Taipei 7 219.6d 15 502.5 16 046.2 17 888.3 19 473.3 20 628.7 21 847.0
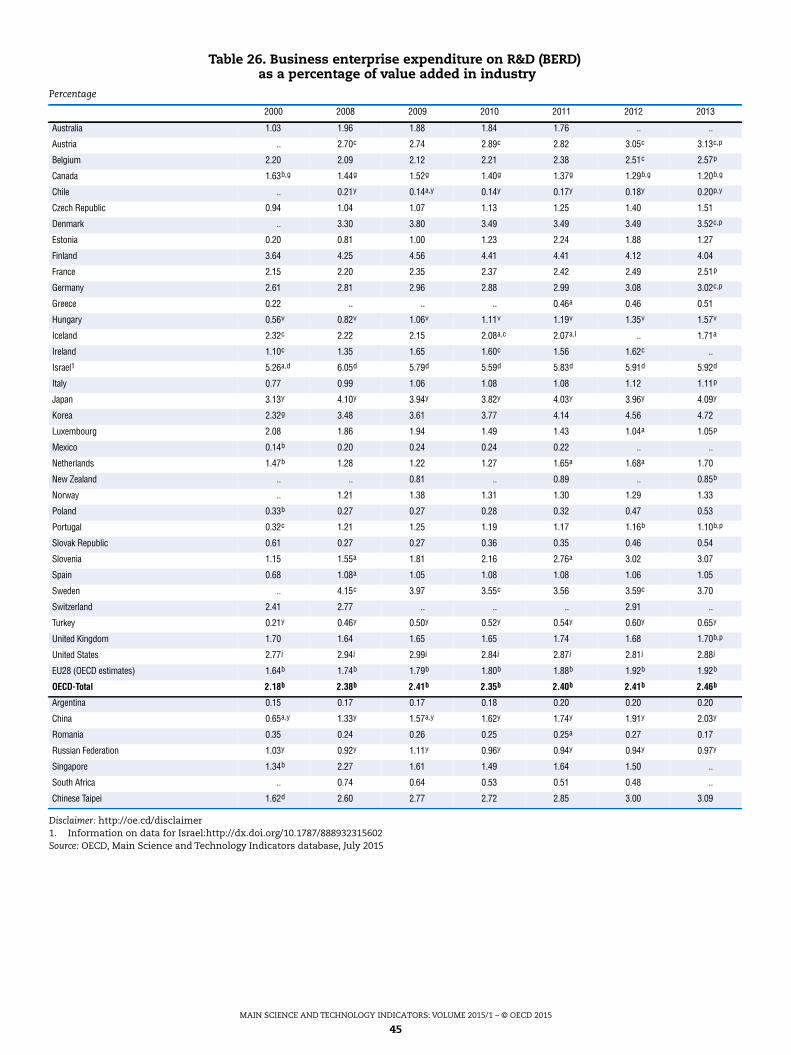
MAIN SCIENCE AND TECHNOLOGY INDICATORS: VOLUME 2015/1 – © OECD 2015
45
Disclaimer: http://oe.cd/disclaimer1. Information on data for Israel:http://dx.doi.org/10.1787/888932315602Source: OECD, Main Science and Technology Indicators database, July 2015
Table 26. Business enterprise expenditure on R&D (BERD)as a percentage of value added in industry
Percentage
2000 2008 2009 2010 2011 2012 2013
Australia 1.03 1.96 1.88 1.84 1.76 .. ..
Austria .. 2.70c 2.74 2.89c 2.82 3.05c 3.13c,p
Belgium 2.20 2.09 2.12 2.21 2.38 2.51c 2.57p
Canada 1.63b,g 1.44g 1.52g 1.40g 1.37g 1.29b,g 1.20b,g
Chile .. 0.21y 0.14a,y 0.14y 0.17y 0.18y 0.20p,y
Czech Republic 0.94 1.04 1.07 1.13 1.25 1.40 1.51
Denmark .. 3.30 3.80 3.49 3.49 3.49 3.52c,p
Estonia 0.20 0.81 1.00 1.23 2.24 1.88 1.27
Finland 3.64 4.25 4.56 4.41 4.41 4.12 4.04
France 2.15 2.20 2.35 2.37 2.42 2.49 2.51p
Germany 2.61 2.81 2.96 2.88 2.99 3.08 3.02c,p
Greece 0.22 .. .. .. 0.46a 0.46 0.51
Hungary 0.56v 0.82v 1.06v 1.11v 1.19v 1.35v 1.57v
Iceland 2.32c 2.22 2.15 2.08a,c 2.07a,l .. 1.71a
Ireland 1.10c 1.35 1.65 1.60c 1.56 1.62c ..
Israel1 5.26a,d 6.05d 5.79d 5.59d 5.83d 5.91d 5.92d
Italy 0.77 0.99 1.06 1.08 1.08 1.12 1.11p
Japan 3.13y 4.10y 3.94y 3.82y 4.03y 3.96y 4.09y
Korea 2.32g 3.48 3.61 3.77 4.14 4.56 4.72
Luxembourg 2.08 1.86 1.94 1.49 1.43 1.04a 1.05p
Mexico 0.14b 0.20 0.24 0.24 0.22 .. ..
Netherlands 1.47b 1.28 1.22 1.27 1.65a 1.68a 1.70
New Zealand .. .. 0.81 .. 0.89 .. 0.85b
Norway .. 1.21 1.38 1.31 1.30 1.29 1.33
Poland 0.33b 0.27 0.27 0.28 0.32 0.47 0.53
Portugal 0.32c 1.21 1.25 1.19 1.17 1.16b 1.10b,p
Slovak Republic 0.61 0.27 0.27 0.36 0.35 0.46 0.54
Slovenia 1.15 1.55a 1.81 2.16 2.76a 3.02 3.07
Spain 0.68 1.08a 1.05 1.08 1.08 1.06 1.05
Sweden .. 4.15c 3.97 3.55c 3.56 3.59c 3.70
Switzerland 2.41 2.77 .. .. .. 2.91 ..
Turkey 0.21y 0.46y 0.50y 0.52y 0.54y 0.60y 0.65y
United Kingdom 1.70 1.64 1.65 1.65 1.74 1.68 1.70b,p
United States 2.77j 2.94j 2.99j 2.84j 2.87j 2.81j 2.88j
EU28 (OECD estimates) 1.64b 1.74b 1.79b 1.80b 1.88b 1.92b 1.92b
OECD-Total 2.18b 2.38b 2.41b 2.35b 2.40b 2.41b 2.46b
Argentina 0.15 0.17 0.17 0.18 0.20 0.20 0.20
China 0.65a,y 1.33y 1.57a,y 1.62y 1.74y 1.91y 2.03y
Romania 0.35 0.24 0.26 0.25 0.25a 0.27 0.17
Russian Federation 1.03y 0.92y 1.11y 0.96y 0.94y 0.94y 0.97y
Singapore 1.34b 2.27 1.61 1.49 1.64 1.50 ..
South Africa .. 0.74 0.64 0.53 0.51 0.48 ..
Chinese Taipei 1.62d 2.60 2.77 2.72 2.85 3.00 3.09
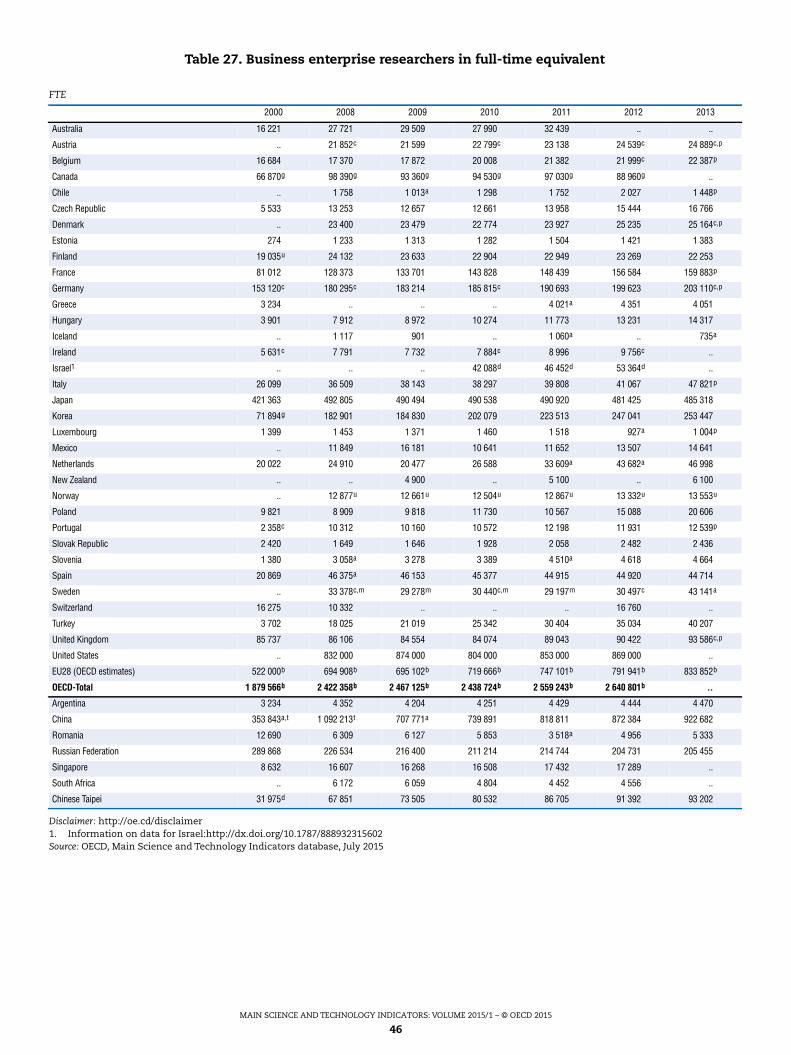
MAIN SCIENCE AND TECHNOLOGY INDICATORS: VOLUME 2015/1 – © OECD 2015
46
Disclaimer: http://oe.cd/disclaimer1. Information on data for Israel:http://dx.doi.org/10.1787/888932315602Source: OECD, Main Science and Technology Indicators database, July 2015
Table 27. Business enterprise researchers in full-time equivalent
FTE
2000 2008 2009 2010 2011 2012 2013
Australia 16 221 27 721 29 509 27 990 32 439 .. ..
Austria .. 21 852c 21 599 22 799c 23 138 24 539c 24 889c,p
Belgium 16 684 17 370 17 872 20 008 21 382 21 999c 22 387p
Canada 66 870g 98 390g 93 360g 94 530g 97 030g 88 960g ..
Chile .. 1 758 1 013a 1 298 1 752 2 027 1 448p
Czech Republic 5 533 13 253 12 657 12 661 13 958 15 444 16 766
Denmark .. 23 400 23 479 22 774 23 927 25 235 25 164c,p
Estonia 274 1 233 1 313 1 282 1 504 1 421 1 383
Finland 19 035u 24 132 23 633 22 904 22 949 23 269 22 253
France 81 012 128 373 133 701 143 828 148 439 156 584 159 883p
Germany 153 120c 180 295c 183 214 185 815c 190 693 199 623 203 110c,p
Greece 3 234 .. .. .. 4 021a 4 351 4 051
Hungary 3 901 7 912 8 972 10 274 11 773 13 231 14 317
Iceland .. 1 117 901 .. 1 060a .. 735a
Ireland 5 631c 7 791 7 732 7 884c 8 996 9 756c ..
Israel1 .. .. .. 42 088d 46 452d 53 364d ..
Italy 26 099 36 509 38 143 38 297 39 808 41 067 47 821p
Japan 421 363 492 805 490 494 490 538 490 920 481 425 485 318
Korea 71 894g 182 901 184 830 202 079 223 513 247 041 253 447
Luxembourg 1 399 1 453 1 371 1 460 1 518 927a 1 004p
Mexico .. 11 849 16 181 10 641 11 652 13 507 14 641
Netherlands 20 022 24 910 20 477 26 588 33 609a 43 682a 46 998
New Zealand .. .. 4 900 .. 5 100 .. 6 100
Norway .. 12 877u 12 661u 12 504u 12 867u 13 332u 13 553u
Poland 9 821 8 909 9 818 11 730 10 567 15 088 20 606
Portugal 2 358c 10 312 10 160 10 572 12 198 11 931 12 539p
Slovak Republic 2 420 1 649 1 646 1 928 2 058 2 482 2 436
Slovenia 1 380 3 058a 3 278 3 389 4 510a 4 618 4 664
Spain 20 869 46 375a 46 153 45 377 44 915 44 920 44 714
Sweden .. 33 378c,m 29 278m 30 440c,m 29 197m 30 497c 43 141a
Switzerland 16 275 10 332 .. .. .. 16 760 ..
Turkey 3 702 18 025 21 019 25 342 30 404 35 034 40 207
United Kingdom 85 737 86 106 84 554 84 074 89 043 90 422 93 586c,p
United States .. 832 000 874 000 804 000 853 000 869 000 ..
EU28 (OECD estimates) 522 000b 694 908b 695 102b 719 666b 747 101b 791 941b 833 852b
OECD-Total 1 879 566b 2 422 358b 2 467 125b 2 438 724b 2 559 243b 2 640 801b ..
Argentina 3 234 4 352 4 204 4 251 4 429 4 444 4 470
China 353 843a,t 1 092 213t 707 771a 739 891 818 811 872 384 922 682
Romania 12 690 6 309 6 127 5 853 3 518a 4 956 5 333
Russian Federation 289 868 226 534 216 400 211 214 214 744 204 731 205 455
Singapore 8 632 16 607 16 268 16 508 17 432 17 289 ..
South Africa .. 6 172 6 059 4 804 4 452 4 556 ..
Chinese Taipei 31 975d 67 851 73 505 80 532 86 705 91 392 93 202
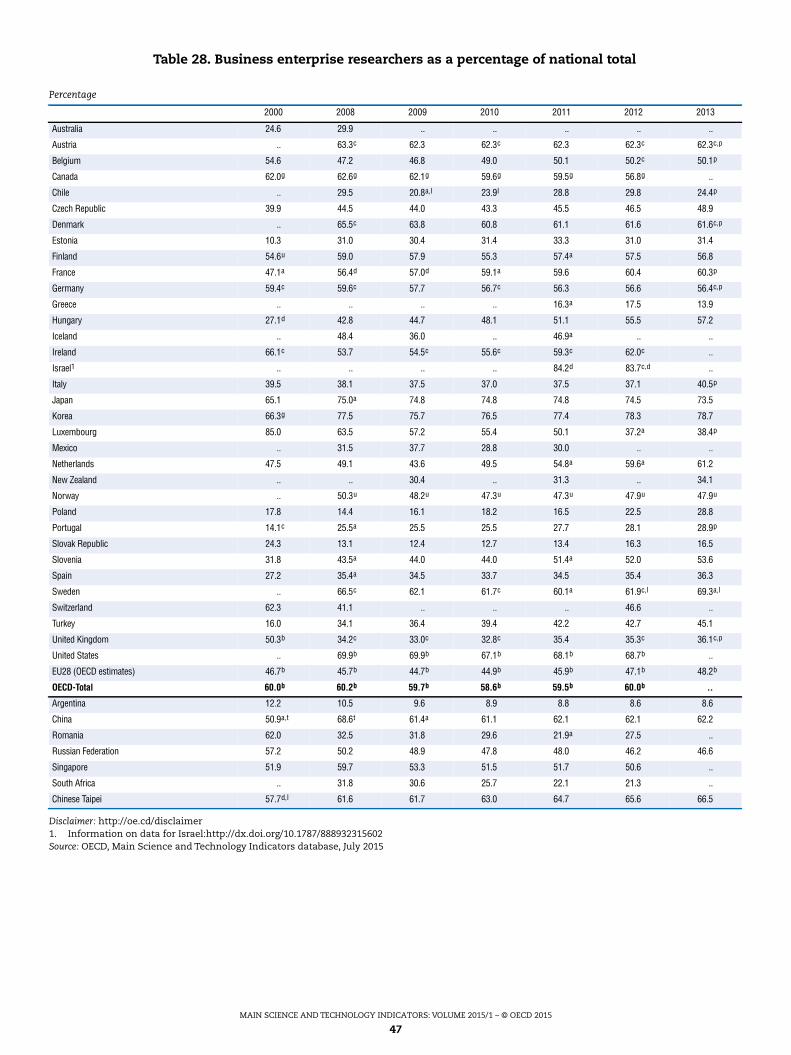
MAIN SCIENCE AND TECHNOLOGY INDICATORS: VOLUME 2015/1 – © OECD 2015
47
Disclaimer: http://oe.cd/disclaimer1. Information on data for Israel:http://dx.doi.org/10.1787/888932315602Source: OECD, Main Science and Technology Indicators database, July 2015
Table 28. Business enterprise researchers as a percentage of national total
Percentage
2000 2008 2009 2010 2011 2012 2013
Australia 24.6 29.9 .. .. .. .. ..
Austria .. 63.3c 62.3 62.3c 62.3 62.3c 62.3c,p
Belgium 54.6 47.2 46.8 49.0 50.1 50.2c 50.1p
Canada 62.0g 62.6g 62.1g 59.6g 59.5g 56.8g ..
Chile .. 29.5 20.8a,l 23.9l 28.8 29.8 24.4p
Czech Republic 39.9 44.5 44.0 43.3 45.5 46.5 48.9
Denmark .. 65.5c 63.8 60.8 61.1 61.6 61.6c,p
Estonia 10.3 31.0 30.4 31.4 33.3 31.0 31.4
Finland 54.6u 59.0 57.9 55.3 57.4a 57.5 56.8
France 47.1a 56.4d 57.0d 59.1a 59.6 60.4 60.3p
Germany 59.4c 59.6c 57.7 56.7c 56.3 56.6 56.4c,p
Greece .. .. .. .. 16.3a 17.5 13.9
Hungary 27.1d 42.8 44.7 48.1 51.1 55.5 57.2
Iceland .. 48.4 36.0 .. 46.9a .. ..
Ireland 66.1c 53.7 54.5c 55.6c 59.3c 62.0c ..
Israel1 .. .. .. .. 84.2d 83.7c,d ..
Italy 39.5 38.1 37.5 37.0 37.5 37.1 40.5p
Japan 65.1 75.0a 74.8 74.8 74.8 74.5 73.5
Korea 66.3g 77.5 75.7 76.5 77.4 78.3 78.7
Luxembourg 85.0 63.5 57.2 55.4 50.1 37.2a 38.4p
Mexico .. 31.5 37.7 28.8 30.0 .. ..
Netherlands 47.5 49.1 43.6 49.5 54.8a 59.6a 61.2
New Zealand .. .. 30.4 .. 31.3 .. 34.1
Norway .. 50.3u 48.2u 47.3u 47.3u 47.9u 47.9u
Poland 17.8 14.4 16.1 18.2 16.5 22.5 28.8
Portugal 14.1c 25.5a 25.5 25.5 27.7 28.1 28.9p
Slovak Republic 24.3 13.1 12.4 12.7 13.4 16.3 16.5
Slovenia 31.8 43.5a 44.0 44.0 51.4a 52.0 53.6
Spain 27.2 35.4a 34.5 33.7 34.5 35.4 36.3
Sweden .. 66.5c 62.1 61.7c 60.1a 61.9c,l 69.3a,l
Switzerland 62.3 41.1 .. .. .. 46.6 ..
Turkey 16.0 34.1 36.4 39.4 42.2 42.7 45.1
United Kingdom 50.3b 34.2c 33.0c 32.8c 35.4 35.3c 36.1c,p
United States .. 69.9b 69.9b 67.1b 68.1b 68.7b ..
EU28 (OECD estimates) 46.7b 45.7b 44.7b 44.9b 45.9b 47.1b 48.2b
OECD-Total 60.0b 60.2b 59.7b 58.6b 59.5b 60.0b ..
Argentina 12.2 10.5 9.6 8.9 8.8 8.6 8.6
China 50.9a,t 68.6t 61.4a 61.1 62.1 62.1 62.2
Romania 62.0 32.5 31.8 29.6 21.9a 27.5 ..
Russian Federation 57.2 50.2 48.9 47.8 48.0 46.2 46.6
Singapore 51.9 59.7 53.3 51.5 51.7 50.6 ..
South Africa .. 31.8 30.6 25.7 22.1 21.3 ..
Chinese Taipei 57.7d,l 61.6 61.7 63.0 64.7 65.6 66.5
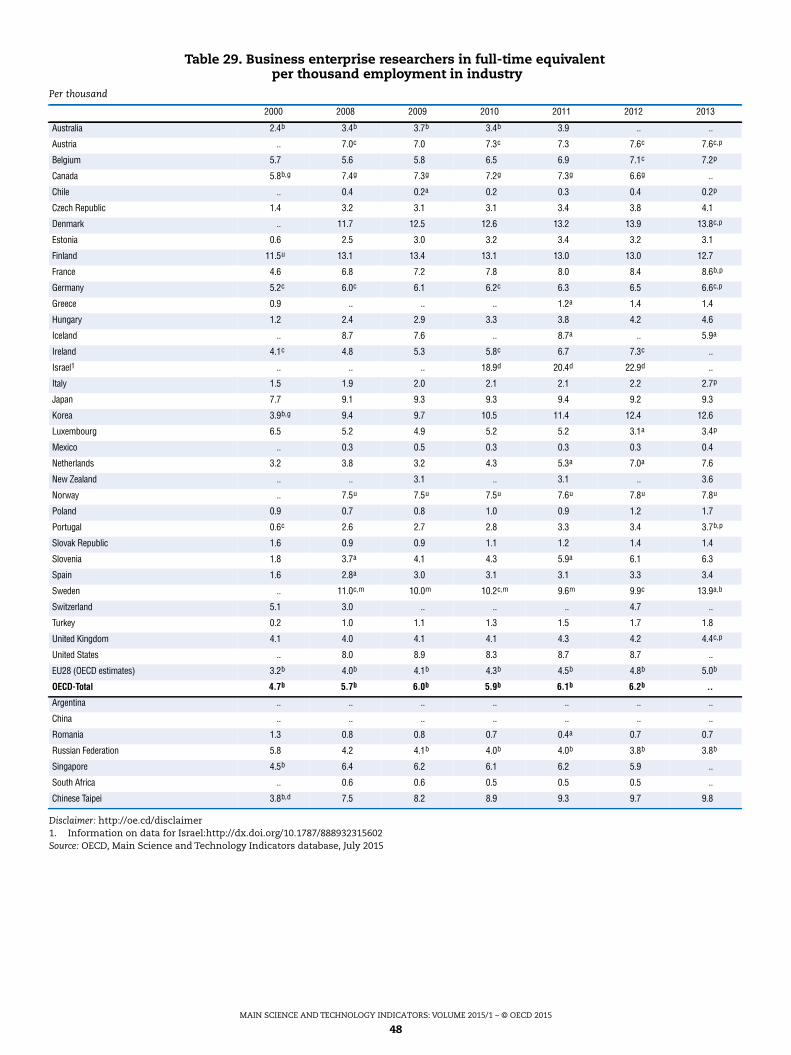
MAIN SCIENCE AND TECHNOLOGY INDICATORS: VOLUME 2015/1 – © OECD 2015
48
Disclaimer: http://oe.cd/disclaimer1. Information on data for Israel:http://dx.doi.org/10.1787/888932315602Source: OECD, Main Science and Technology Indicators database, July 2015
Table 29. Business enterprise researchers in full-time equivalentper thousand employment in industry
Per thousand
2000 2008 2009 2010 2011 2012 2013
Australia 2.4b 3.4b 3.7b 3.4b 3.9 .. ..
Austria .. 7.0c 7.0 7.3c 7.3 7.6c 7.6c,p
Belgium 5.7 5.6 5.8 6.5 6.9 7.1c 7.2p
Canada 5.8b,g 7.4g 7.3g 7.2g 7.3g 6.6g ..
Chile .. 0.4 0.2a 0.2 0.3 0.4 0.2p
Czech Republic 1.4 3.2 3.1 3.1 3.4 3.8 4.1
Denmark .. 11.7 12.5 12.6 13.2 13.9 13.8c,p
Estonia 0.6 2.5 3.0 3.2 3.4 3.2 3.1
Finland 11.5u 13.1 13.4 13.1 13.0 13.0 12.7
France 4.6 6.8 7.2 7.8 8.0 8.4 8.6b,p
Germany 5.2c 6.0c 6.1 6.2c 6.3 6.5 6.6c,p
Greece 0.9 .. .. .. 1.2a 1.4 1.4
Hungary 1.2 2.4 2.9 3.3 3.8 4.2 4.6
Iceland .. 8.7 7.6 .. 8.7a .. 5.9a
Ireland 4.1c 4.8 5.3 5.8c 6.7 7.3c ..
Israel1 .. .. .. 18.9d 20.4d 22.9d ..
Italy 1.5 1.9 2.0 2.1 2.1 2.2 2.7p
Japan 7.7 9.1 9.3 9.3 9.4 9.2 9.3
Korea 3.9b,g 9.4 9.7 10.5 11.4 12.4 12.6
Luxembourg 6.5 5.2 4.9 5.2 5.2 3.1a 3.4p
Mexico .. 0.3 0.5 0.3 0.3 0.3 0.4
Netherlands 3.2 3.8 3.2 4.3 5.3a 7.0a 7.6
New Zealand .. .. 3.1 .. 3.1 .. 3.6
Norway .. 7.5u 7.5u 7.5u 7.6u 7.8u 7.8u
Poland 0.9 0.7 0.8 1.0 0.9 1.2 1.7
Portugal 0.6c 2.6 2.7 2.8 3.3 3.4 3.7b,p
Slovak Republic 1.6 0.9 0.9 1.1 1.2 1.4 1.4
Slovenia 1.8 3.7a 4.1 4.3 5.9a 6.1 6.3
Spain 1.6 2.8a 3.0 3.1 3.1 3.3 3.4
Sweden .. 11.0c,m 10.0m 10.2c,m 9.6m 9.9c 13.9a,b
Switzerland 5.1 3.0 .. .. .. 4.7 ..
Turkey 0.2 1.0 1.1 1.3 1.5 1.7 1.8
United Kingdom 4.1 4.0 4.1 4.1 4.3 4.2 4.4c,p
United States .. 8.0 8.9 8.3 8.7 8.7 ..
EU28 (OECD estimates) 3.2b 4.0b 4.1b 4.3b 4.5b 4.8b 5.0b
OECD-Total 4.7b 5.7b 6.0b 5.9b 6.1b 6.2b ..
Argentina .. .. .. .. .. .. ..
China .. .. .. .. .. .. ..
Romania 1.3 0.8 0.8 0.7 0.4a 0.7 0.7
Russian Federation 5.8 4.2 4.1b 4.0b 4.0b 3.8b 3.8b
Singapore 4.5b 6.4 6.2 6.1 6.2 5.9 ..
South Africa .. 0.6 0.6 0.5 0.5 0.5 ..
Chinese Taipei 3.8b,d 7.5 8.2 8.9 9.3 9.7 9.8
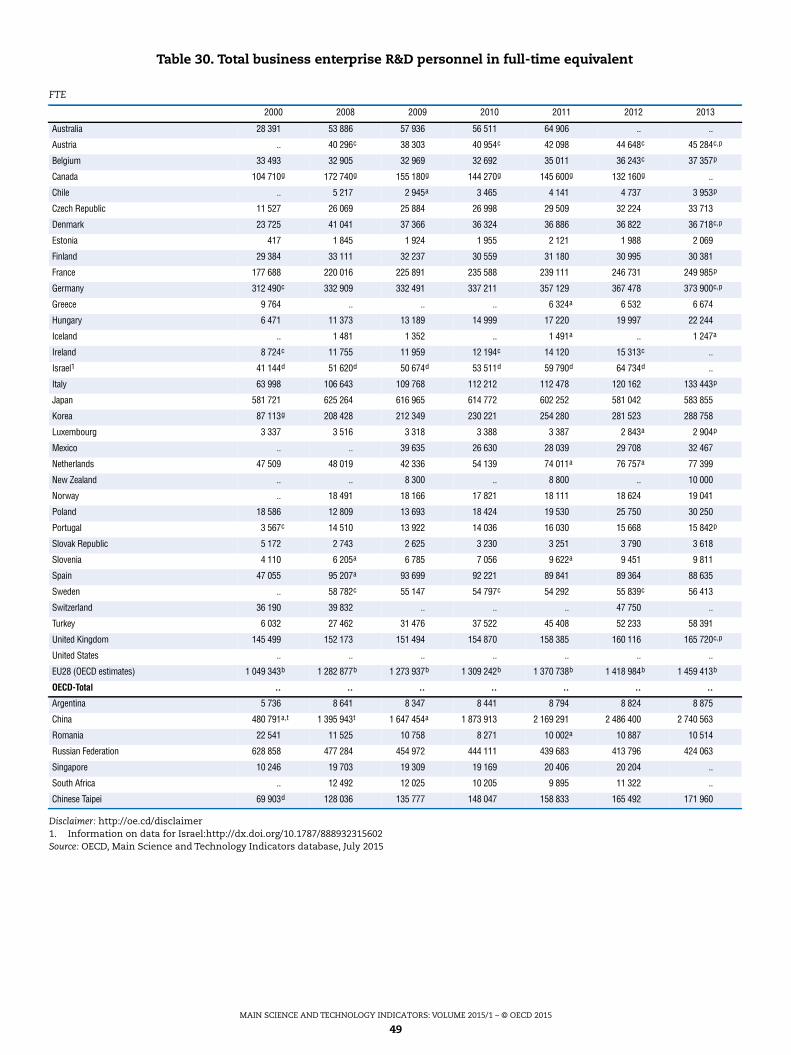
MAIN SCIENCE AND TECHNOLOGY INDICATORS: VOLUME 2015/1 – © OECD 2015
49
Disclaimer: http://oe.cd/disclaimer1. Information on data for Israel:http://dx.doi.org/10.1787/888932315602Source: OECD, Main Science and Technology Indicators database, July 2015
Table 30. Total business enterprise R&D personnel in full-time equivalent
FTE
2000 2008 2009 2010 2011 2012 2013
Australia 28 391 53 886 57 936 56 511 64 906 .. ..
Austria .. 40 296c 38 303 40 954c 42 098 44 648c 45 284c,p
Belgium 33 493 32 905 32 969 32 692 35 011 36 243c 37 357p
Canada 104 710g 172 740g 155 180g 144 270g 145 600g 132 160g ..
Chile .. 5 217 2 945a 3 465 4 141 4 737 3 953p
Czech Republic 11 527 26 069 25 884 26 998 29 509 32 224 33 713
Denmark 23 725 41 041 37 366 36 324 36 886 36 822 36 718c,p
Estonia 417 1 845 1 924 1 955 2 121 1 988 2 069
Finland 29 384 33 111 32 237 30 559 31 180 30 995 30 381
France 177 688 220 016 225 891 235 588 239 111 246 731 249 985p
Germany 312 490c 332 909 332 491 337 211 357 129 367 478 373 900c,p
Greece 9 764 .. .. .. 6 324a 6 532 6 674
Hungary 6 471 11 373 13 189 14 999 17 220 19 997 22 244
Iceland .. 1 481 1 352 .. 1 491a .. 1 247a
Ireland 8 724c 11 755 11 959 12 194c 14 120 15 313c ..
Israel1 41 144d 51 620d 50 674d 53 511d 59 790d 64 734d ..
Italy 63 998 106 643 109 768 112 212 112 478 120 162 133 443p
Japan 581 721 625 264 616 965 614 772 602 252 581 042 583 855
Korea 87 113g 208 428 212 349 230 221 254 280 281 523 288 758
Luxembourg 3 337 3 516 3 318 3 388 3 387 2 843a 2 904p
Mexico .. .. 39 635 26 630 28 039 29 708 32 467
Netherlands 47 509 48 019 42 336 54 139 74 011a 76 757a 77 399
New Zealand .. .. 8 300 .. 8 800 .. 10 000
Norway .. 18 491 18 166 17 821 18 111 18 624 19 041
Poland 18 586 12 809 13 693 18 424 19 530 25 750 30 250
Portugal 3 567c 14 510 13 922 14 036 16 030 15 668 15 842p
Slovak Republic 5 172 2 743 2 625 3 230 3 251 3 790 3 618
Slovenia 4 110 6 205a 6 785 7 056 9 622a 9 451 9 811
Spain 47 055 95 207a 93 699 92 221 89 841 89 364 88 635
Sweden .. 58 782c 55 147 54 797c 54 292 55 839c 56 413
Switzerland 36 190 39 832 .. .. .. 47 750 ..
Turkey 6 032 27 462 31 476 37 522 45 408 52 233 58 391
United Kingdom 145 499 152 173 151 494 154 870 158 385 160 116 165 720c,p
United States .. .. .. .. .. .. ..
EU28 (OECD estimates) 1 049 343b 1 282 877b 1 273 937b 1 309 242b 1 370 738b 1 418 984b 1 459 413b
OECD-Total .. .. .. .. .. .. ..
Argentina 5 736 8 641 8 347 8 441 8 794 8 824 8 875
China 480 791a,t 1 395 943t 1 647 454a 1 873 913 2 169 291 2 486 400 2 740 563
Romania 22 541 11 525 10 758 8 271 10 002a 10 887 10 514
Russian Federation 628 858 477 284 454 972 444 111 439 683 413 796 424 063
Singapore 10 246 19 703 19 309 19 169 20 406 20 204 ..
South Africa .. 12 492 12 025 10 205 9 895 11 322 ..
Chinese Taipei 69 903d 128 036 135 777 148 047 158 833 165 492 171 960
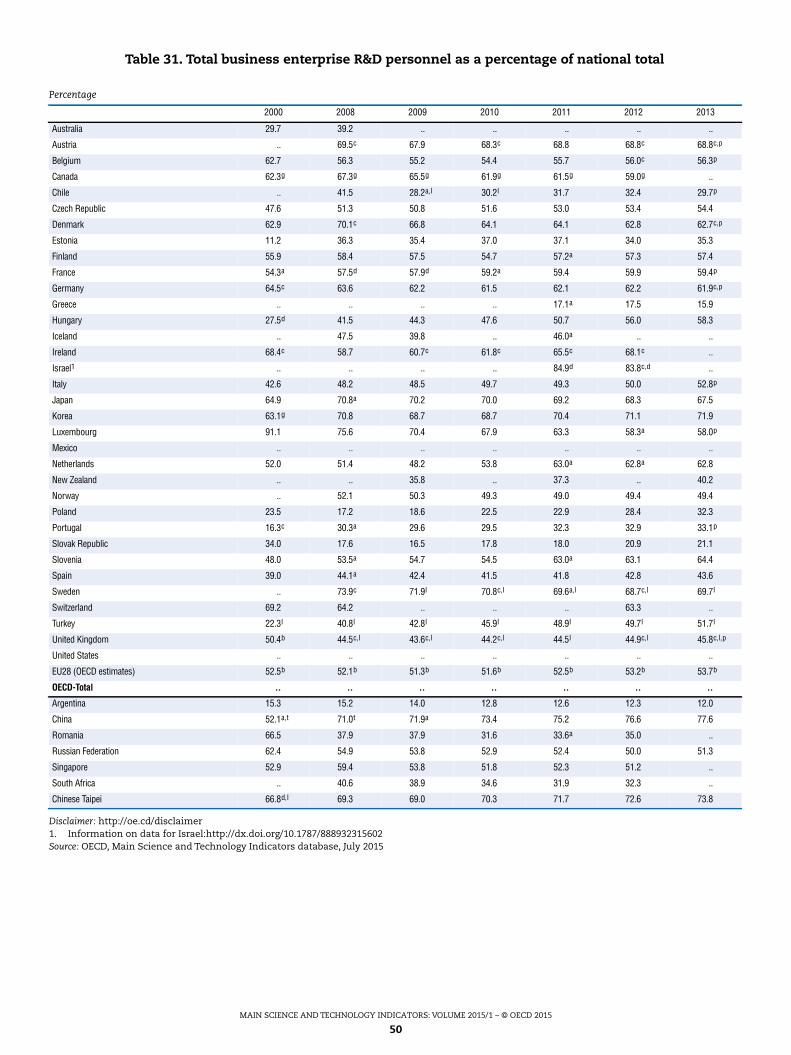
MAIN SCIENCE AND TECHNOLOGY INDICATORS: VOLUME 2015/1 – © OECD 2015
50
Disclaimer: http://oe.cd/disclaimer1. Information on data for Israel:http://dx.doi.org/10.1787/888932315602Source: OECD, Main Science and Technology Indicators database, July 2015
Table 31. Total business enterprise R&D personnel as a percentage of national total
Percentage
2000 2008 2009 2010 2011 2012 2013
Australia 29.7 39.2 .. .. .. .. ..
Austria .. 69.5c 67.9 68.3c 68.8 68.8c 68.8c,p
Belgium 62.7 56.3 55.2 54.4 55.7 56.0c 56.3p
Canada 62.3g 67.3g 65.5g 61.9g 61.5g 59.0g ..
Chile .. 41.5 28.2a,l 30.2l 31.7 32.4 29.7p
Czech Republic 47.6 51.3 50.8 51.6 53.0 53.4 54.4
Denmark 62.9 70.1c 66.8 64.1 64.1 62.8 62.7c,p
Estonia 11.2 36.3 35.4 37.0 37.1 34.0 35.3
Finland 55.9 58.4 57.5 54.7 57.2a 57.3 57.4
France 54.3a 57.5d 57.9d 59.2a 59.4 59.9 59.4p
Germany 64.5c 63.6 62.2 61.5 62.1 62.2 61.9c,p
Greece .. .. .. .. 17.1a 17.5 15.9
Hungary 27.5d 41.5 44.3 47.6 50.7 56.0 58.3
Iceland .. 47.5 39.8 .. 46.0a .. ..
Ireland 68.4c 58.7 60.7c 61.8c 65.5c 68.1c ..
Israel1 .. .. .. .. 84.9d 83.8c,d ..
Italy 42.6 48.2 48.5 49.7 49.3 50.0 52.8p
Japan 64.9 70.8a 70.2 70.0 69.2 68.3 67.5
Korea 63.1g 70.8 68.7 68.7 70.4 71.1 71.9
Luxembourg 91.1 75.6 70.4 67.9 63.3 58.3a 58.0p
Mexico .. .. .. .. .. .. ..
Netherlands 52.0 51.4 48.2 53.8 63.0a 62.8a 62.8
New Zealand .. .. 35.8 .. 37.3 .. 40.2
Norway .. 52.1 50.3 49.3 49.0 49.4 49.4
Poland 23.5 17.2 18.6 22.5 22.9 28.4 32.3
Portugal 16.3c 30.3a 29.6 29.5 32.3 32.9 33.1p
Slovak Republic 34.0 17.6 16.5 17.8 18.0 20.9 21.1
Slovenia 48.0 53.5a 54.7 54.5 63.0a 63.1 64.4
Spain 39.0 44.1a 42.4 41.5 41.8 42.8 43.6
Sweden .. 73.9c 71.9l 70.8c,l 69.6a,l 68.7c,l 69.7l
Switzerland 69.2 64.2 .. .. .. 63.3 ..
Turkey 22.3l 40.8l 42.8l 45.9l 48.9l 49.7l 51.7l
United Kingdom 50.4b 44.5c,l 43.6c,l 44.2c,l 44.5l 44.9c,l 45.8c,l,p
United States .. .. .. .. .. .. ..
EU28 (OECD estimates) 52.5b 52.1b 51.3b 51.6b 52.5b 53.2b 53.7b
OECD-Total .. .. .. .. .. .. ..
Argentina 15.3 15.2 14.0 12.8 12.6 12.3 12.0
China 52.1a,t 71.0t 71.9a 73.4 75.2 76.6 77.6
Romania 66.5 37.9 37.9 31.6 33.6a 35.0 ..
Russian Federation 62.4 54.9 53.8 52.9 52.4 50.0 51.3
Singapore 52.9 59.4 53.8 51.8 52.3 51.2 ..
South Africa .. 40.6 38.9 34.6 31.9 32.3 ..
Chinese Taipei 66.8d,l 69.3 69.0 70.3 71.7 72.6 73.8
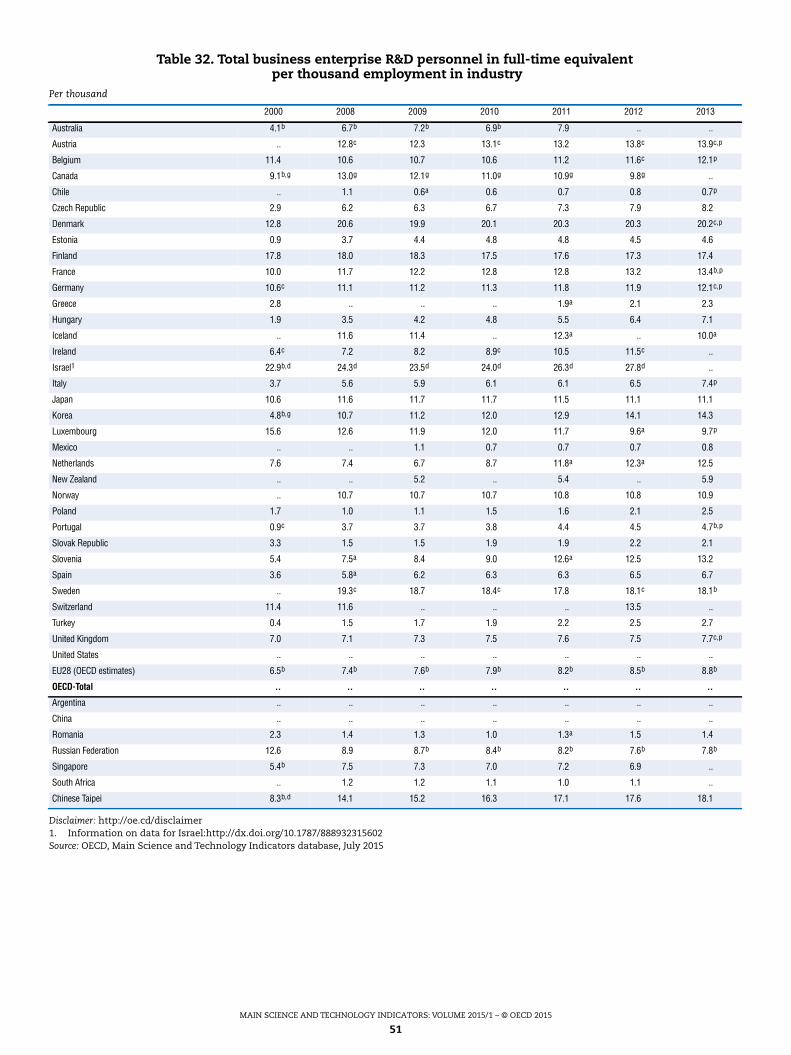
MAIN SCIENCE AND TECHNOLOGY INDICATORS: VOLUME 2015/1 – © OECD 2015
51
Disclaimer: http://oe.cd/disclaimer1. Information on data for Israel:http://dx.doi.org/10.1787/888932315602Source: OECD, Main Science and Technology Indicators database, July 2015
Table 32. Total business enterprise R&D personnel in full-time equivalentper thousand employment in industry
Per thousand
2000 2008 2009 2010 2011 2012 2013
Australia 4.1b 6.7b 7.2b 6.9b 7.9 .. ..
Austria .. 12.8c 12.3 13.1c 13.2 13.8c 13.9c,p
Belgium 11.4 10.6 10.7 10.6 11.2 11.6c 12.1p
Canada 9.1b,g 13.0g 12.1g 11.0g 10.9g 9.8g ..
Chile .. 1.1 0.6a 0.6 0.7 0.8 0.7p
Czech Republic 2.9 6.2 6.3 6.7 7.3 7.9 8.2
Denmark 12.8 20.6 19.9 20.1 20.3 20.3 20.2c,p
Estonia 0.9 3.7 4.4 4.8 4.8 4.5 4.6
Finland 17.8 18.0 18.3 17.5 17.6 17.3 17.4
France 10.0 11.7 12.2 12.8 12.8 13.2 13.4b,p
Germany 10.6c 11.1 11.2 11.3 11.8 11.9 12.1c,p
Greece 2.8 .. .. .. 1.9a 2.1 2.3
Hungary 1.9 3.5 4.2 4.8 5.5 6.4 7.1
Iceland .. 11.6 11.4 .. 12.3a .. 10.0a
Ireland 6.4c 7.2 8.2 8.9c 10.5 11.5c ..
Israel1 22.9b,d 24.3d 23.5d 24.0d 26.3d 27.8d ..
Italy 3.7 5.6 5.9 6.1 6.1 6.5 7.4p
Japan 10.6 11.6 11.7 11.7 11.5 11.1 11.1
Korea 4.8b,g 10.7 11.2 12.0 12.9 14.1 14.3
Luxembourg 15.6 12.6 11.9 12.0 11.7 9.6a 9.7p
Mexico .. .. 1.1 0.7 0.7 0.7 0.8
Netherlands 7.6 7.4 6.7 8.7 11.8a 12.3a 12.5
New Zealand .. .. 5.2 .. 5.4 .. 5.9
Norway .. 10.7 10.7 10.7 10.8 10.8 10.9
Poland 1.7 1.0 1.1 1.5 1.6 2.1 2.5
Portugal 0.9c 3.7 3.7 3.8 4.4 4.5 4.7b,p
Slovak Republic 3.3 1.5 1.5 1.9 1.9 2.2 2.1
Slovenia 5.4 7.5a 8.4 9.0 12.6a 12.5 13.2
Spain 3.6 5.8a 6.2 6.3 6.3 6.5 6.7
Sweden .. 19.3c 18.7 18.4c 17.8 18.1c 18.1b
Switzerland 11.4 11.6 .. .. .. 13.5 ..
Turkey 0.4 1.5 1.7 1.9 2.2 2.5 2.7
United Kingdom 7.0 7.1 7.3 7.5 7.6 7.5 7.7c,p
United States .. .. .. .. .. .. ..
EU28 (OECD estimates) 6.5b 7.4b 7.6b 7.9b 8.2b 8.5b 8.8b
OECD-Total .. .. .. .. .. .. ..
Argentina .. .. .. .. .. .. ..
China .. .. .. .. .. .. ..
Romania 2.3 1.4 1.3 1.0 1.3a 1.5 1.4
Russian Federation 12.6 8.9 8.7b 8.4b 8.2b 7.6b 7.8b
Singapore 5.4b 7.5 7.3 7.0 7.2 6.9 ..
South Africa .. 1.2 1.2 1.1 1.0 1.1 ..
Chinese Taipei 8.3b,d 14.1 15.2 16.3 17.1 17.6 18.1
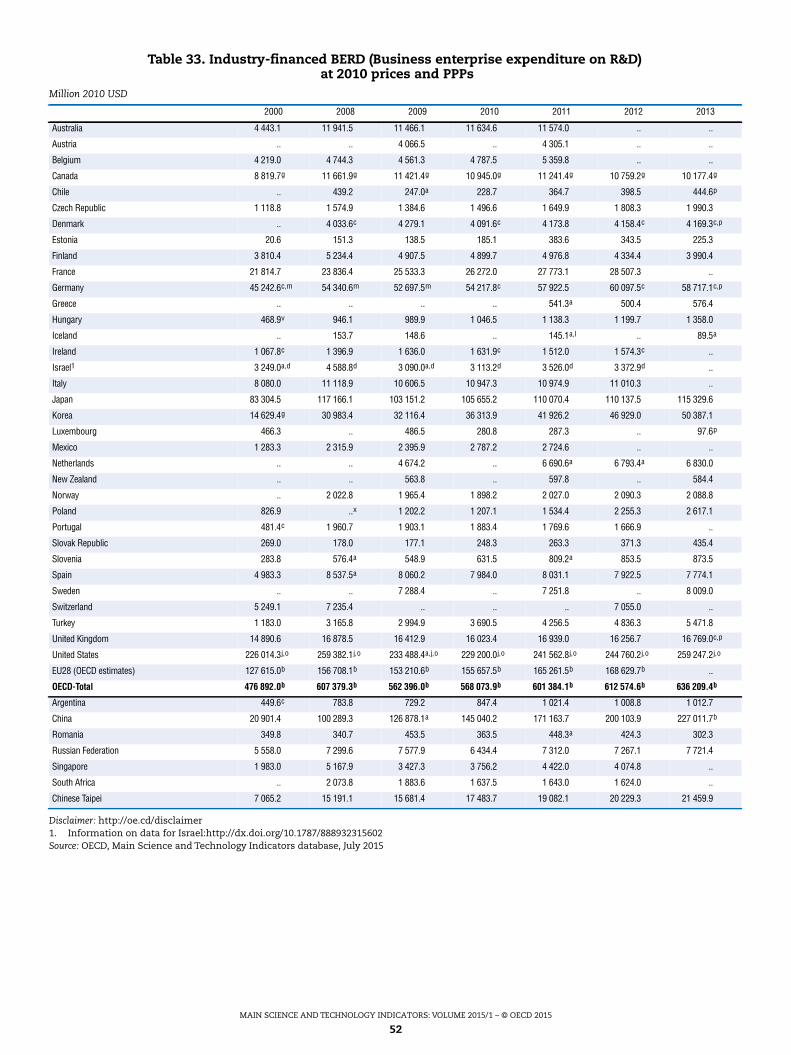
MAIN SCIENCE AND TECHNOLOGY INDICATORS: VOLUME 2015/1 – © OECD 2015
52
Disclaimer: http://oe.cd/disclaimer1. Information on data for Israel:http://dx.doi.org/10.1787/888932315602Source: OECD, Main Science and Technology Indicators database, July 2015
Table 33. Industry-financed BERD (Business enterprise expenditure on R&D)at 2010 prices and PPPs
Million 2010 USD
2000 2008 2009 2010 2011 2012 2013
Australia 4 443.1 11 941.5 11 466.1 11 634.6 11 574.0 .. ..
Austria .. .. 4 066.5 .. 4 305.1 .. ..
Belgium 4 219.0 4 744.3 4 561.3 4 787.5 5 359.8 .. ..
Canada 8 819.7g 11 661.9g 11 421.4g 10 945.0g 11 241.4g 10 759.2g 10 177.4g
Chile .. 439.2 247.0a 228.7 364.7 398.5 444.6p
Czech Republic 1 118.8 1 574.9 1 384.6 1 496.6 1 649.9 1 808.3 1 990.3
Denmark .. 4 033.6c 4 279.1 4 091.6c 4 173.8 4 158.4c 4 169.3c,p
Estonia 20.6 151.3 138.5 185.1 383.6 343.5 225.3
Finland 3 810.4 5 234.4 4 907.5 4 899.7 4 976.8 4 334.4 3 990.4
France 21 814.7 23 836.4 25 533.3 26 272.0 27 773.1 28 507.3 ..
Germany 45 242.6c,m 54 340.6m 52 697.5m 54 217.8c 57 922.5 60 097.5c 58 717.1c,p
Greece .. .. .. .. 541.3a 500.4 576.4
Hungary 468.9v 946.1 989.9 1 046.5 1 138.3 1 199.7 1 358.0
Iceland .. 153.7 148.6 .. 145.1a,l .. 89.5a
Ireland 1 067.8c 1 396.9 1 636.0 1 631.9c 1 512.0 1 574.3c ..
Israel1 3 249.0a,d 4 588.8d 3 090.0a,d 3 113.2d 3 526.0d 3 372.9d ..
Italy 8 080.0 11 118.9 10 606.5 10 947.3 10 974.9 11 010.3 ..
Japan 83 304.5 117 166.1 103 151.2 105 655.2 110 070.4 110 137.5 115 329.6
Korea 14 629.4g 30 983.4 32 116.4 36 313.9 41 926.2 46 929.0 50 387.1
Luxembourg 466.3 .. 486.5 280.8 287.3 .. 97.6p
Mexico 1 283.3 2 315.9 2 395.9 2 787.2 2 724.6 .. ..
Netherlands .. .. 4 674.2 .. 6 690.6a 6 793.4a 6 830.0
New Zealand .. .. 563.8 .. 597.8 .. 584.4
Norway .. 2 022.8 1 965.4 1 898.2 2 027.0 2 090.3 2 088.8
Poland 826.9 ..x 1 202.2 1 207.1 1 534.4 2 255.3 2 617.1
Portugal 481.4c 1 960.7 1 903.1 1 883.4 1 769.6 1 666.9 ..
Slovak Republic 269.0 178.0 177.1 248.3 263.3 371.3 435.4
Slovenia 283.8 576.4a 548.9 631.5 809.2a 853.5 873.5
Spain 4 983.3 8 537.5a 8 060.2 7 984.0 8 031.1 7 922.5 7 774.1
Sweden .. .. 7 288.4 .. 7 251.8 .. 8 009.0
Switzerland 5 249.1 7 235.4 .. .. .. 7 055.0 ..
Turkey 1 183.0 3 165.8 2 994.9 3 690.5 4 256.5 4 836.3 5 471.8
United Kingdom 14 890.6 16 878.5 16 412.9 16 023.4 16 939.0 16 256.7 16 769.0c,p
United States 226 014.3j,o 259 382.1j,o 233 488.4a,j,o 229 200.0j,o 241 562.8j,o 244 760.2j,o 259 247.2j,o
EU28 (OECD estimates) 127 615.0b 156 708.1b 153 210.6b 155 657.5b 165 261.5b 168 629.7b ..
OECD-Total 476 892.0b 607 379.3b 562 396.0b 568 073.9b 601 384.1b 612 574.6b 636 209.4b
Argentina 449.6c 783.8 729.2 847.4 1 021.4 1 008.8 1 012.7
China 20 901.4 100 289.3 126 878.1a 145 040.2 171 163.7 200 103.9 227 011.7b
Romania 349.8 340.7 453.5 363.5 448.3a 424.3 302.3
Russian Federation 5 558.0 7 299.6 7 577.9 6 434.4 7 312.0 7 267.1 7 721.4
Singapore 1 983.0 5 167.9 3 427.3 3 756.2 4 422.0 4 074.8 ..
South Africa .. 2 073.8 1 883.6 1 637.5 1 643.0 1 624.0 ..
Chinese Taipei 7 065.2 15 191.1 15 681.4 17 483.7 19 082.1 20 229.3 21 459.9
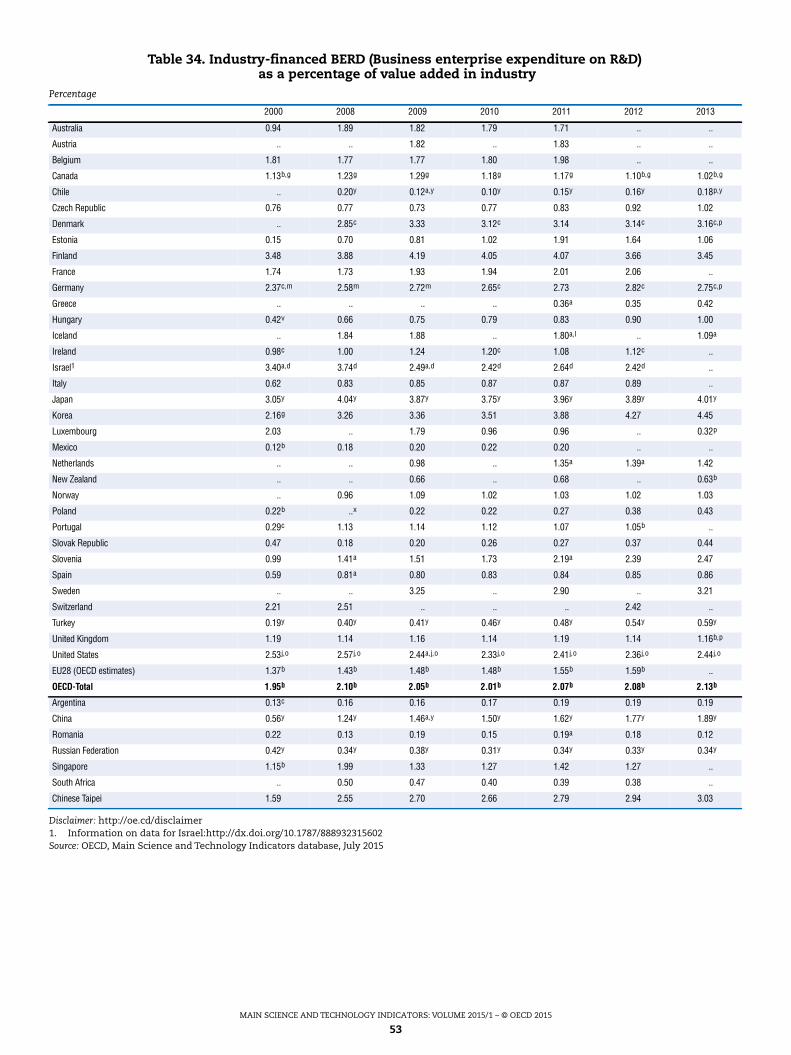
MAIN SCIENCE AND TECHNOLOGY INDICATORS: VOLUME 2015/1 – © OECD 2015
53
Disclaimer: http://oe.cd/disclaimer1. Information on data for Israel:http://dx.doi.org/10.1787/888932315602Source: OECD, Main Science and Technology Indicators database, July 2015
Table 34. Industry-financed BERD (Business enterprise expenditure on R&D)as a percentage of value added in industry
Percentage
2000 2008 2009 2010 2011 2012 2013
Australia 0.94 1.89 1.82 1.79 1.71 .. ..
Austria .. .. 1.82 .. 1.83 .. ..
Belgium 1.81 1.77 1.77 1.80 1.98 .. ..
Canada 1.13b,g 1.23g 1.29g 1.18g 1.17g 1.10b,g 1.02b,g
Chile .. 0.20y 0.12a,y 0.10y 0.15y 0.16y 0.18p,y
Czech Republic 0.76 0.77 0.73 0.77 0.83 0.92 1.02
Denmark .. 2.85c 3.33 3.12c 3.14 3.14c 3.16c,p
Estonia 0.15 0.70 0.81 1.02 1.91 1.64 1.06
Finland 3.48 3.88 4.19 4.05 4.07 3.66 3.45
France 1.74 1.73 1.93 1.94 2.01 2.06 ..
Germany 2.37c,m 2.58m 2.72m 2.65c 2.73 2.82c 2.75c,p
Greece .. .. .. .. 0.36a 0.35 0.42
Hungary 0.42v 0.66 0.75 0.79 0.83 0.90 1.00
Iceland .. 1.84 1.88 .. 1.80a,l .. 1.09a
Ireland 0.98c 1.00 1.24 1.20c 1.08 1.12c ..
Israel1 3.40a,d 3.74d 2.49a,d 2.42d 2.64d 2.42d ..
Italy 0.62 0.83 0.85 0.87 0.87 0.89 ..
Japan 3.05y 4.04y 3.87y 3.75y 3.96y 3.89y 4.01y
Korea 2.16g 3.26 3.36 3.51 3.88 4.27 4.45
Luxembourg 2.03 .. 1.79 0.96 0.96 .. 0.32p
Mexico 0.12b 0.18 0.20 0.22 0.20 .. ..
Netherlands .. .. 0.98 .. 1.35a 1.39a 1.42
New Zealand .. .. 0.66 .. 0.68 .. 0.63b
Norway .. 0.96 1.09 1.02 1.03 1.02 1.03
Poland 0.22b ..x 0.22 0.22 0.27 0.38 0.43
Portugal 0.29c 1.13 1.14 1.12 1.07 1.05b ..
Slovak Republic 0.47 0.18 0.20 0.26 0.27 0.37 0.44
Slovenia 0.99 1.41a 1.51 1.73 2.19a 2.39 2.47
Spain 0.59 0.81a 0.80 0.83 0.84 0.85 0.86
Sweden .. .. 3.25 .. 2.90 .. 3.21
Switzerland 2.21 2.51 .. .. .. 2.42 ..
Turkey 0.19y 0.40y 0.41y 0.46y 0.48y 0.54y 0.59y
United Kingdom 1.19 1.14 1.16 1.14 1.19 1.14 1.16b,p
United States 2.53j,o 2.57j,o 2.44a,j,o 2.33j,o 2.41j,o 2.36j,o 2.44j,o
EU28 (OECD estimates) 1.37b 1.43b 1.48b 1.48b 1.55b 1.59b ..
OECD-Total 1.95b 2.10b 2.05b 2.01b 2.07b 2.08b 2.13b
Argentina 0.13c 0.16 0.16 0.17 0.19 0.19 0.19
China 0.56y 1.24y 1.46a,y 1.50y 1.62y 1.77y 1.89y
Romania 0.22 0.13 0.19 0.15 0.19a 0.18 0.12
Russian Federation 0.42y 0.34y 0.38y 0.31y 0.34y 0.33y 0.34y
Singapore 1.15b 1.99 1.33 1.27 1.42 1.27 ..
South Africa .. 0.50 0.47 0.40 0.39 0.38 ..
Chinese Taipei 1.59 2.55 2.70 2.66 2.79 2.94 3.03
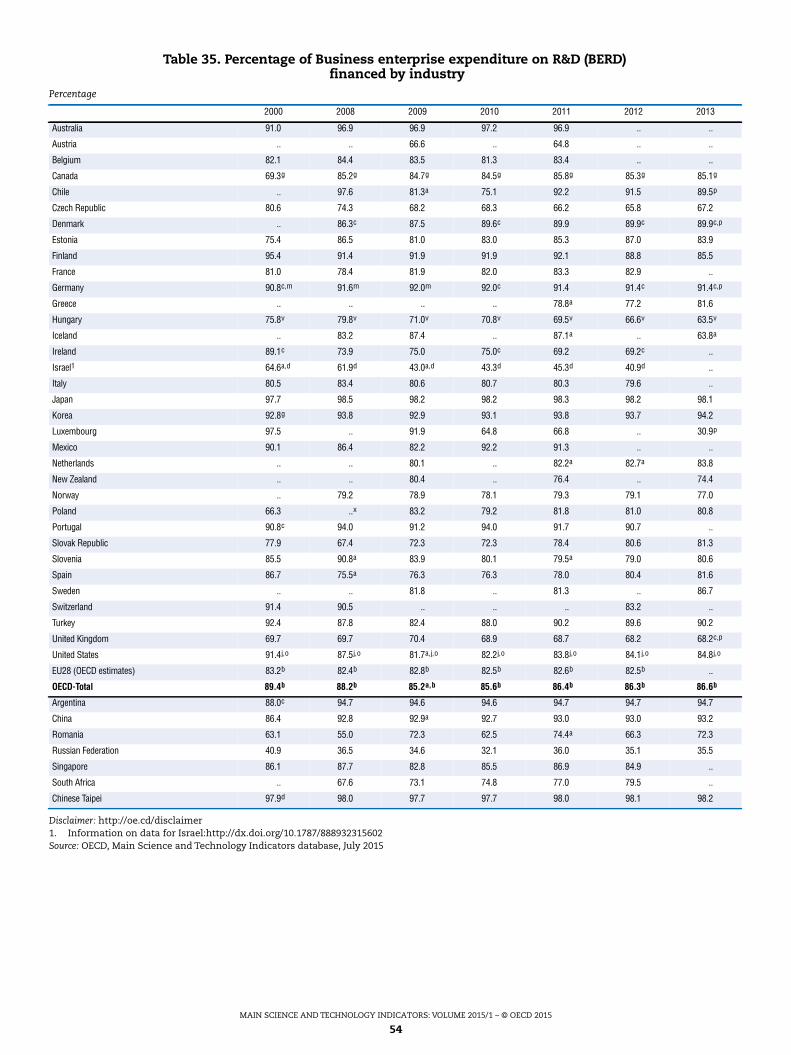
MAIN SCIENCE AND TECHNOLOGY INDICATORS: VOLUME 2015/1 – © OECD 2015
54
Disclaimer: http://oe.cd/disclaimer1. Information on data for Israel:http://dx.doi.org/10.1787/888932315602Source: OECD, Main Science and Technology Indicators database, July 2015
Table 35. Percentage of Business enterprise expenditure on R&D (BERD)financed by industry
Percentage
2000 2008 2009 2010 2011 2012 2013
Australia 91.0 96.9 96.9 97.2 96.9 .. ..
Austria .. .. 66.6 .. 64.8 .. ..
Belgium 82.1 84.4 83.5 81.3 83.4 .. ..
Canada 69.3g 85.2g 84.7g 84.5g 85.8g 85.3g 85.1g
Chile .. 97.6 81.3a 75.1 92.2 91.5 89.5p
Czech Republic 80.6 74.3 68.2 68.3 66.2 65.8 67.2
Denmark .. 86.3c 87.5 89.6c 89.9 89.9c 89.9c,p
Estonia 75.4 86.5 81.0 83.0 85.3 87.0 83.9
Finland 95.4 91.4 91.9 91.9 92.1 88.8 85.5
France 81.0 78.4 81.9 82.0 83.3 82.9 ..
Germany 90.8c,m 91.6m 92.0m 92.0c 91.4 91.4c 91.4c,p
Greece .. .. .. .. 78.8a 77.2 81.6
Hungary 75.8v 79.8v 71.0v 70.8v 69.5v 66.6v 63.5v
Iceland .. 83.2 87.4 .. 87.1a .. 63.8a
Ireland 89.1c 73.9 75.0 75.0c 69.2 69.2c ..
Israel1 64.6a,d 61.9d 43.0a,d 43.3d 45.3d 40.9d ..
Italy 80.5 83.4 80.6 80.7 80.3 79.6 ..
Japan 97.7 98.5 98.2 98.2 98.3 98.2 98.1
Korea 92.8g 93.8 92.9 93.1 93.8 93.7 94.2
Luxembourg 97.5 .. 91.9 64.8 66.8 .. 30.9p
Mexico 90.1 86.4 82.2 92.2 91.3 .. ..
Netherlands .. .. 80.1 .. 82.2a 82.7a 83.8
New Zealand .. .. 80.4 .. 76.4 .. 74.4
Norway .. 79.2 78.9 78.1 79.3 79.1 77.0
Poland 66.3 ..x 83.2 79.2 81.8 81.0 80.8
Portugal 90.8c 94.0 91.2 94.0 91.7 90.7 ..
Slovak Republic 77.9 67.4 72.3 72.3 78.4 80.6 81.3
Slovenia 85.5 90.8a 83.9 80.1 79.5a 79.0 80.6
Spain 86.7 75.5a 76.3 76.3 78.0 80.4 81.6
Sweden .. .. 81.8 .. 81.3 .. 86.7
Switzerland 91.4 90.5 .. .. .. 83.2 ..
Turkey 92.4 87.8 82.4 88.0 90.2 89.6 90.2
United Kingdom 69.7 69.7 70.4 68.9 68.7 68.2 68.2c,p
United States 91.4j,o 87.5j,o 81.7a,j,o 82.2j,o 83.8j,o 84.1j,o 84.8j,o
EU28 (OECD estimates) 83.2b 82.4b 82.8b 82.5b 82.6b 82.5b ..
OECD-Total 89.4b 88.2b 85.2a,b 85.6b 86.4b 86.3b 86.6b
Argentina 88.0c 94.7 94.6 94.6 94.7 94.7 94.7
China 86.4 92.8 92.9a 92.7 93.0 93.0 93.2
Romania 63.1 55.0 72.3 62.5 74.4a 66.3 72.3
Russian Federation 40.9 36.5 34.6 32.1 36.0 35.1 35.5
Singapore 86.1 87.7 82.8 85.5 86.9 84.9 ..
South Africa .. 67.6 73.1 74.8 77.0 79.5 ..
Chinese Taipei 97.9d 98.0 97.7 97.7 98.0 98.1 98.2
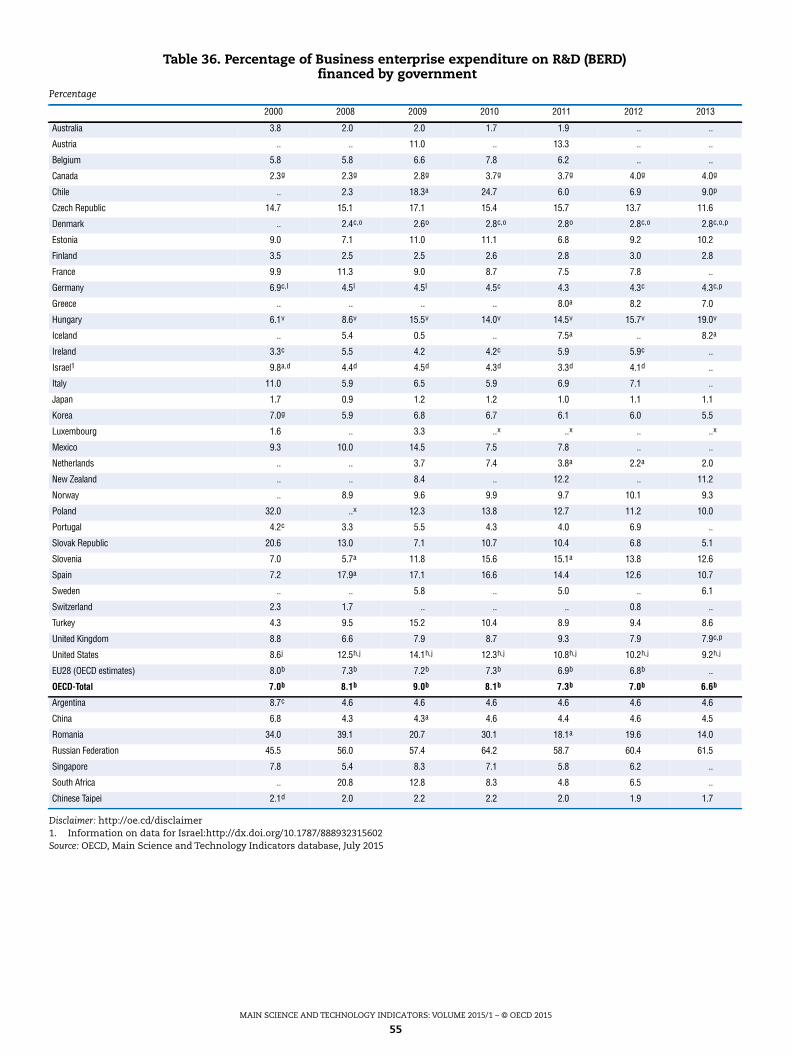
MAIN SCIENCE AND TECHNOLOGY INDICATORS: VOLUME 2015/1 – © OECD 2015
55
Disclaimer: http://oe.cd/disclaimer1. Information on data for Israel:http://dx.doi.org/10.1787/888932315602Source: OECD, Main Science and Technology Indicators database, July 2015
Table 36. Percentage of Business enterprise expenditure on R&D (BERD)financed by government
Percentage
2000 2008 2009 2010 2011 2012 2013
Australia 3.8 2.0 2.0 1.7 1.9 .. ..
Austria .. .. 11.0 .. 13.3 .. ..
Belgium 5.8 5.8 6.6 7.8 6.2 .. ..
Canada 2.3g 2.3g 2.8g 3.7g 3.7g 4.0g 4.0g
Chile .. 2.3 18.3a 24.7 6.0 6.9 9.0p
Czech Republic 14.7 15.1 17.1 15.4 15.7 13.7 11.6
Denmark .. 2.4c,o 2.6o 2.8c,o 2.8o 2.8c,o 2.8c,o,p
Estonia 9.0 7.1 11.0 11.1 6.8 9.2 10.2
Finland 3.5 2.5 2.5 2.6 2.8 3.0 2.8
France 9.9 11.3 9.0 8.7 7.5 7.8 ..
Germany 6.9c,l 4.5l 4.5l 4.5c 4.3 4.3c 4.3c,p
Greece .. .. .. .. 8.0a 8.2 7.0
Hungary 6.1v 8.6v 15.5v 14.0v 14.5v 15.7v 19.0v
Iceland .. 5.4 0.5 .. 7.5a .. 8.2a
Ireland 3.3c 5.5 4.2 4.2c 5.9 5.9c ..
Israel1 9.8a,d 4.4d 4.5d 4.3d 3.3d 4.1d ..
Italy 11.0 5.9 6.5 5.9 6.9 7.1 ..
Japan 1.7 0.9 1.2 1.2 1.0 1.1 1.1
Korea 7.0g 5.9 6.8 6.7 6.1 6.0 5.5
Luxembourg 1.6 .. 3.3 ..x ..x .. ..x
Mexico 9.3 10.0 14.5 7.5 7.8 .. ..
Netherlands .. .. 3.7 7.4 3.8a 2.2a 2.0
New Zealand .. .. 8.4 .. 12.2 .. 11.2
Norway .. 8.9 9.6 9.9 9.7 10.1 9.3
Poland 32.0 ..x 12.3 13.8 12.7 11.2 10.0
Portugal 4.2c 3.3 5.5 4.3 4.0 6.9 ..
Slovak Republic 20.6 13.0 7.1 10.7 10.4 6.8 5.1
Slovenia 7.0 5.7a 11.8 15.6 15.1a 13.8 12.6
Spain 7.2 17.9a 17.1 16.6 14.4 12.6 10.7
Sweden .. .. 5.8 .. 5.0 .. 6.1
Switzerland 2.3 1.7 .. .. .. 0.8 ..
Turkey 4.3 9.5 15.2 10.4 8.9 9.4 8.6
United Kingdom 8.8 6.6 7.9 8.7 9.3 7.9 7.9c,p
United States 8.6j 12.5h,j 14.1h,j 12.3h,j 10.8h,j 10.2h,j 9.2h,j
EU28 (OECD estimates) 8.0b 7.3b 7.2b 7.3b 6.9b 6.8b ..
OECD-Total 7.0b 8.1b 9.0b 8.1b 7.3b 7.0b 6.6b
Argentina 8.7c 4.6 4.6 4.6 4.6 4.6 4.6
China 6.8 4.3 4.3a 4.6 4.4 4.6 4.5
Romania 34.0 39.1 20.7 30.1 18.1a 19.6 14.0
Russian Federation 45.5 56.0 57.4 64.2 58.7 60.4 61.5
Singapore 7.8 5.4 8.3 7.1 5.8 6.2 ..
South Africa .. 20.8 12.8 8.3 4.8 6.5 ..
Chinese Taipei 2.1d 2.0 2.2 2.2 2.0 1.9 1.7

MAIN SCIENCE AND TECHNOLOGY INDICATORS: VOLUME 2015/1 – © OECD 2015
56
Disclaimer: http://oe.cd/disclaimer1. Information on data for Israel:http://dx.doi.org/10.1787/888932315602Source: OECD, Main Science and Technology Indicators database, July 2015
Table 37. Percentage of Business enterprise expenditure on R&D (BERD)financed by other national sources
Percentage
2000 2008 2009 2010 2011 2012 2013
Australia 0.56 0.10 ..x ..x ..x .. ..
Austria .. .. 0.09 .. 0.10 .. ..
Belgium 0.05 0.07 0.15 0.01 0.01 .. ..
Canada 0.00g 0.00g 0.00g 0.00g 0.00g 0.00g 0.00g
Chile .. 0.00 0.22a 0.13 1.58 1.39 0.05p
Czech Republic 1.01 0.15 0.16 0.10 0.05 0.04 0.08
Denmark .. 0.32c 0.43 0.27c 0.26 0.26c 0.26c,p
Estonia 0.38 0.55 0.59 0.11 0.01 0.03 0.11
Finland 0.14 0.03 0.05 0.02 0.05 0.06 0.06
France 0.05 0.11 0.08 0.10 0.06 0.06 ..
Germany 0.20c 0.17c 0.09 0.09c 0.26 0.26c 0.26c,p
Greece .. .. .. .. 0.20a 0.15 0.06
Hungary 0.03v 0.16v 0.14v 0.26v 0.12v 0.05v 0.06v
Iceland .. 0.00 0.00 .. 0.01a .. 0.55a
Ireland 0.00c 0.04 0.04 0.04c 0.07 0.07c ..
Israel1 0.66a,d 0.55d 0.59d 0.65d 0.65d 0.63d ..
Italy 0.33 0.24 0.33 0.21 0.30 0.40 ..
Japan 0.07 0.09 0.10 0.08 0.11 0.14 0.24
Korea 0.17g 0.08 0.09 0.07 0.06 0.06 0.06
Luxembourg .. .. .. .. .. .. ..
Mexico 0.07 0.01 0.07 0.10 0.25 .. ..
Netherlands .. .. 0.20 .. 0.76a 0.57a 0.69
New Zealand .. .. ..x .. ..x .. ..x
Norway .. 0.03 0.02 0.01 0.02 0.01 0.02
Poland 0.13 0.09 0.07 0.09 0.20 0.13 0.06
Portugal 0.00c 0.01 0.01 0.00 0.01 0.01 ..
Slovak Republic 0.00 0.07 0.05 0.03 0.15 0.00 0.00
Slovenia 0.00 0.00a 0.00 0.06 0.01a 0.13 0.01
Spain 2.33 0.22a 0.28 0.30 0.22 0.22 0.25
Sweden .. .. 0.22 .. 0.34 .. 0.27
Switzerland 0.51 0.77 .. .. .. 0.62 ..
Turkey 1.40 0.07 0.18 0.19 0.08 0.21 0.20
United Kingdom 0.02 0.15 0.08 0.03 0.60a 0.22 0.21c,p
United States ..n ..n 0.13j 0.28j 0.13j 0.11j 0.08j
EU28 (OECD estimates) 0.24b .. 0.14b .. 0.26b 0.21b ..
OECD-Total 0.10b 0.08b 0.14b 0.19b 0.17b 0.16b ..
Argentina 0.00c .. .. .. .. .. ..
China .. .. .. .. .. .. ..
Romania 0.58 0.28 0.70 0.37 0.08a 0.16 0.27
Russian Federation 0.08 0.19 0.10 0.16 0.32 0.10 0.13
Singapore 0.10 0.03 0.04 0.05 0.03 0.01 ..
South Africa .. 0.24 0.25 2.54 3.31 2.79 ..
Chinese Taipei 0.07d 0.04 0.03 0.03 0.02 0.01 0.01
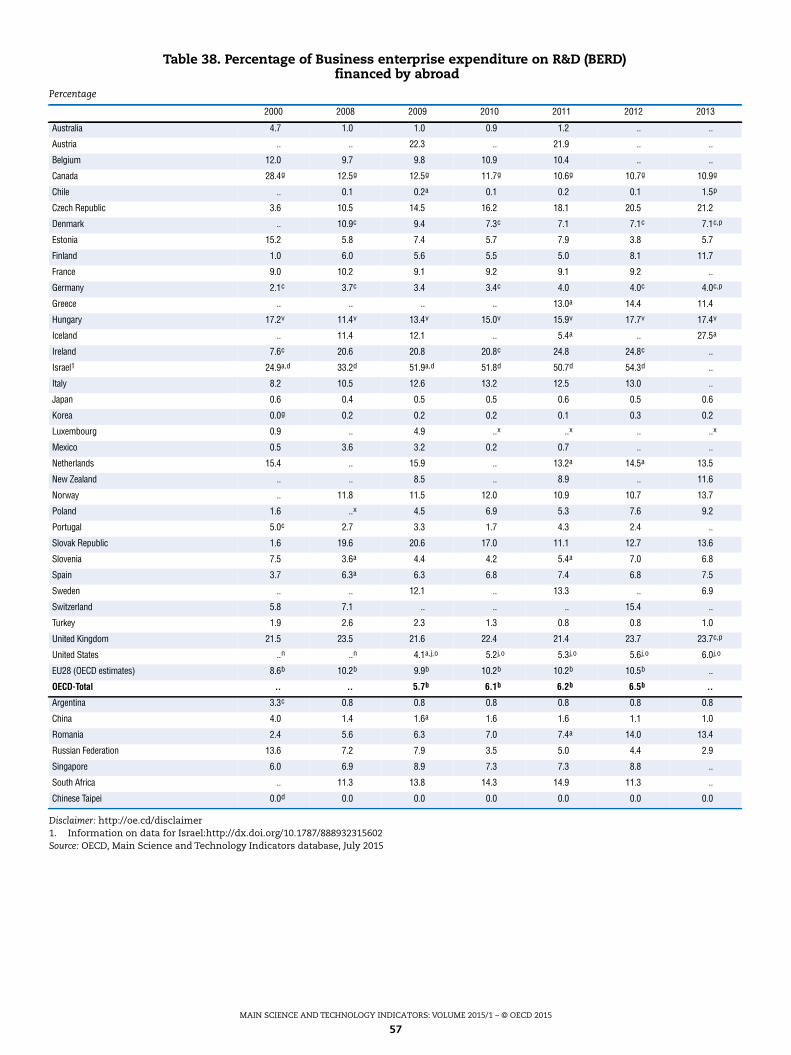
MAIN SCIENCE AND TECHNOLOGY INDICATORS: VOLUME 2015/1 – © OECD 2015
57
Disclaimer: http://oe.cd/disclaimer1. Information on data for Israel:http://dx.doi.org/10.1787/888932315602Source: OECD, Main Science and Technology Indicators database, July 2015
Table 38. Percentage of Business enterprise expenditure on R&D (BERD)financed by abroad
Percentage
2000 2008 2009 2010 2011 2012 2013
Australia 4.7 1.0 1.0 0.9 1.2 .. ..
Austria .. .. 22.3 .. 21.9 .. ..
Belgium 12.0 9.7 9.8 10.9 10.4 .. ..
Canada 28.4g 12.5g 12.5g 11.7g 10.6g 10.7g 10.9g
Chile .. 0.1 0.2a 0.1 0.2 0.1 1.5p
Czech Republic 3.6 10.5 14.5 16.2 18.1 20.5 21.2
Denmark .. 10.9c 9.4 7.3c 7.1 7.1c 7.1c,p
Estonia 15.2 5.8 7.4 5.7 7.9 3.8 5.7
Finland 1.0 6.0 5.6 5.5 5.0 8.1 11.7
France 9.0 10.2 9.1 9.2 9.1 9.2 ..
Germany 2.1c 3.7c 3.4 3.4c 4.0 4.0c 4.0c,p
Greece .. .. .. .. 13.0a 14.4 11.4
Hungary 17.2v 11.4v 13.4v 15.0v 15.9v 17.7v 17.4v
Iceland .. 11.4 12.1 .. 5.4a .. 27.5a
Ireland 7.6c 20.6 20.8 20.8c 24.8 24.8c ..
Israel1 24.9a,d 33.2d 51.9a,d 51.8d 50.7d 54.3d ..
Italy 8.2 10.5 12.6 13.2 12.5 13.0 ..
Japan 0.6 0.4 0.5 0.5 0.6 0.5 0.6
Korea 0.0g 0.2 0.2 0.2 0.1 0.3 0.2
Luxembourg 0.9 .. 4.9 ..x ..x .. ..x
Mexico 0.5 3.6 3.2 0.2 0.7 .. ..
Netherlands 15.4 .. 15.9 .. 13.2a 14.5a 13.5
New Zealand .. .. 8.5 .. 8.9 .. 11.6
Norway .. 11.8 11.5 12.0 10.9 10.7 13.7
Poland 1.6 ..x 4.5 6.9 5.3 7.6 9.2
Portugal 5.0c 2.7 3.3 1.7 4.3 2.4 ..
Slovak Republic 1.6 19.6 20.6 17.0 11.1 12.7 13.6
Slovenia 7.5 3.6a 4.4 4.2 5.4a 7.0 6.8
Spain 3.7 6.3a 6.3 6.8 7.4 6.8 7.5
Sweden .. .. 12.1 .. 13.3 .. 6.9
Switzerland 5.8 7.1 .. .. .. 15.4 ..
Turkey 1.9 2.6 2.3 1.3 0.8 0.8 1.0
United Kingdom 21.5 23.5 21.6 22.4 21.4 23.7 23.7c,p
United States ..n ..n 4.1a,j,o 5.2j,o 5.3j,o 5.6j,o 6.0j,o
EU28 (OECD estimates) 8.6b 10.2b 9.9b 10.2b 10.2b 10.5b ..
OECD-Total .. .. 5.7b 6.1b 6.2b 6.5b ..
Argentina 3.3c 0.8 0.8 0.8 0.8 0.8 0.8
China 4.0 1.4 1.6a 1.6 1.6 1.1 1.0
Romania 2.4 5.6 6.3 7.0 7.4a 14.0 13.4
Russian Federation 13.6 7.2 7.9 3.5 5.0 4.4 2.9
Singapore 6.0 6.9 8.9 7.3 7.3 8.8 ..
South Africa .. 11.3 13.8 14.3 14.9 11.3 ..
Chinese Taipei 0.0d 0.0 0.0 0.0 0.0 0.0 0.0
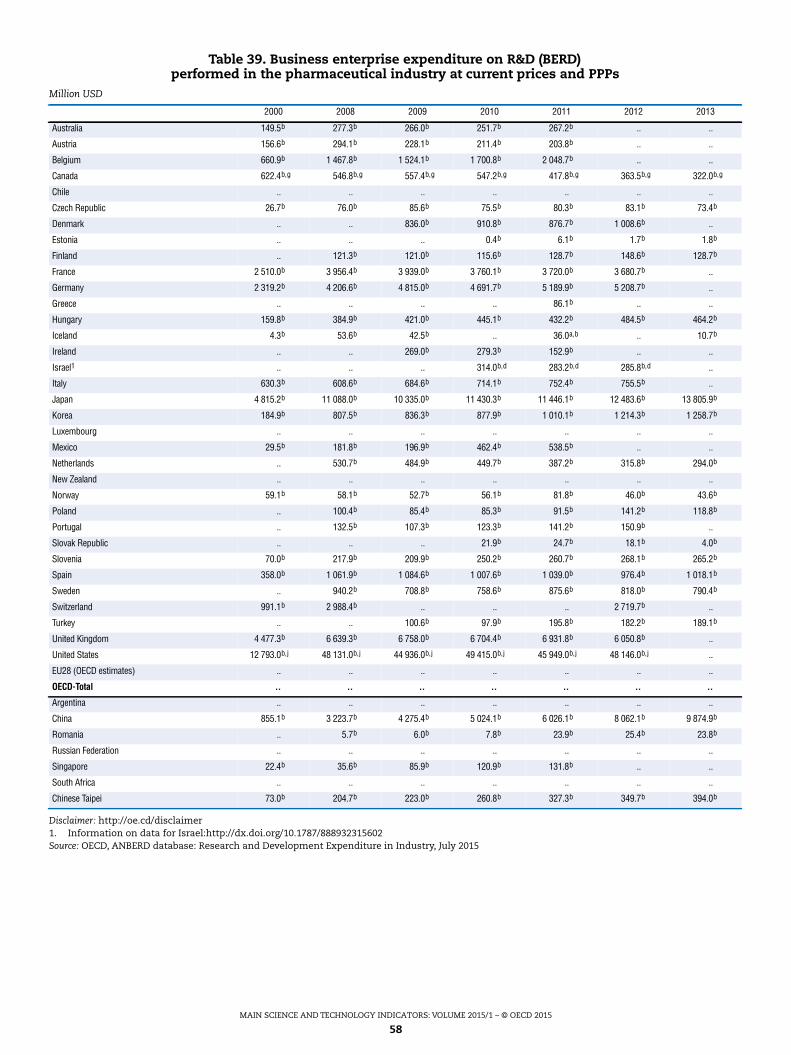
MAIN SCIENCE AND TECHNOLOGY INDICATORS: VOLUME 2015/1 – © OECD 2015
58
Disclaimer: http://oe.cd/disclaimer1. Information on data for Israel:http://dx.doi.org/10.1787/888932315602Source: OECD, ANBERD database: Research and Development Expenditure in Industry, July 2015
Table 39. Business enterprise expenditure on R&D (BERD)performed in the pharmaceutical industry at current prices and PPPs
Million USD
2000 2008 2009 2010 2011 2012 2013
Australia 149.5b 277.3b 266.0b 251.7b 267.2b .. ..
Austria 156.6b 294.1b 228.1b 211.4b 203.8b .. ..
Belgium 660.9b 1 467.8b 1 524.1b 1 700.8b 2 048.7b .. ..
Canada 622.4b,g 546.8b,g 557.4b,g 547.2b,g 417.8b,g 363.5b,g 322.0b,g
Chile .. .. .. .. .. .. ..
Czech Republic 26.7b 76.0b 85.6b 75.5b 80.3b 83.1b 73.4b
Denmark .. .. 836.0b 910.8b 876.7b 1 008.6b ..
Estonia .. .. .. 0.4b 6.1b 1.7b 1.8b
Finland .. 121.3b 121.0b 115.6b 128.7b 148.6b 128.7b
France 2 510.0b 3 956.4b 3 939.0b 3 760.1b 3 720.0b 3 680.7b ..
Germany 2 319.2b 4 206.6b 4 815.0b 4 691.7b 5 189.9b 5 208.7b ..
Greece .. .. .. .. 86.1b .. ..
Hungary 159.8b 384.9b 421.0b 445.1b 432.2b 484.5b 464.2b
Iceland 4.3b 53.6b 42.5b .. 36.0a,b .. 10.7b
Ireland .. .. 269.0b 279.3b 152.9b .. ..
Israel1 .. .. .. 314.0b,d 283.2b,d 285.8b,d ..
Italy 630.3b 608.6b 684.6b 714.1b 752.4b 755.5b ..
Japan 4 815.2b 11 088.0b 10 335.0b 11 430.3b 11 446.1b 12 483.6b 13 805.9b
Korea 184.9b 807.5b 836.3b 877.9b 1 010.1b 1 214.3b 1 258.7b
Luxembourg .. .. .. .. .. .. ..
Mexico 29.5b 181.8b 196.9b 462.4b 538.5b .. ..
Netherlands .. 530.7b 484.9b 449.7b 387.2b 315.8b 294.0b
New Zealand .. .. .. .. .. .. ..
Norway 59.1b 58.1b 52.7b 56.1b 81.8b 46.0b 43.6b
Poland .. 100.4b 85.4b 85.3b 91.5b 141.2b 118.8b
Portugal .. 132.5b 107.3b 123.3b 141.2b 150.9b ..
Slovak Republic .. .. .. 21.9b 24.7b 18.1b 4.0b
Slovenia 70.0b 217.9b 209.9b 250.2b 260.7b 268.1b 265.2b
Spain 358.0b 1 061.9b 1 084.6b 1 007.6b 1 039.0b 976.4b 1 018.1b
Sweden .. 940.2b 708.8b 758.6b 875.6b 818.0b 790.4b
Switzerland 991.1b 2 988.4b .. .. .. 2 719.7b ..
Turkey .. .. 100.6b 97.9b 195.8b 182.2b 189.1b
United Kingdom 4 477.3b 6 639.3b 6 758.0b 6 704.4b 6 931.8b 6 050.8b ..
United States 12 793.0b,j 48 131.0b,j 44 936.0b,j 49 415.0b,j 45 949.0b,j 48 146.0b,j ..
EU28 (OECD estimates) .. .. .. .. .. .. ..
OECD-Total .. .. .. .. .. .. ..
Argentina .. .. .. .. .. .. ..
China 855.1b 3 223.7b 4 275.4b 5 024.1b 6 026.1b 8 062.1b 9 874.9b
Romania .. 5.7b 6.0b 7.8b 23.9b 25.4b 23.8b
Russian Federation .. .. .. .. .. .. ..
Singapore 22.4b 35.6b 85.9b 120.9b 131.8b .. ..
South Africa .. .. .. .. .. .. ..
Chinese Taipei 73.0b 204.7b 223.0b 260.8b 327.3b 349.7b 394.0b
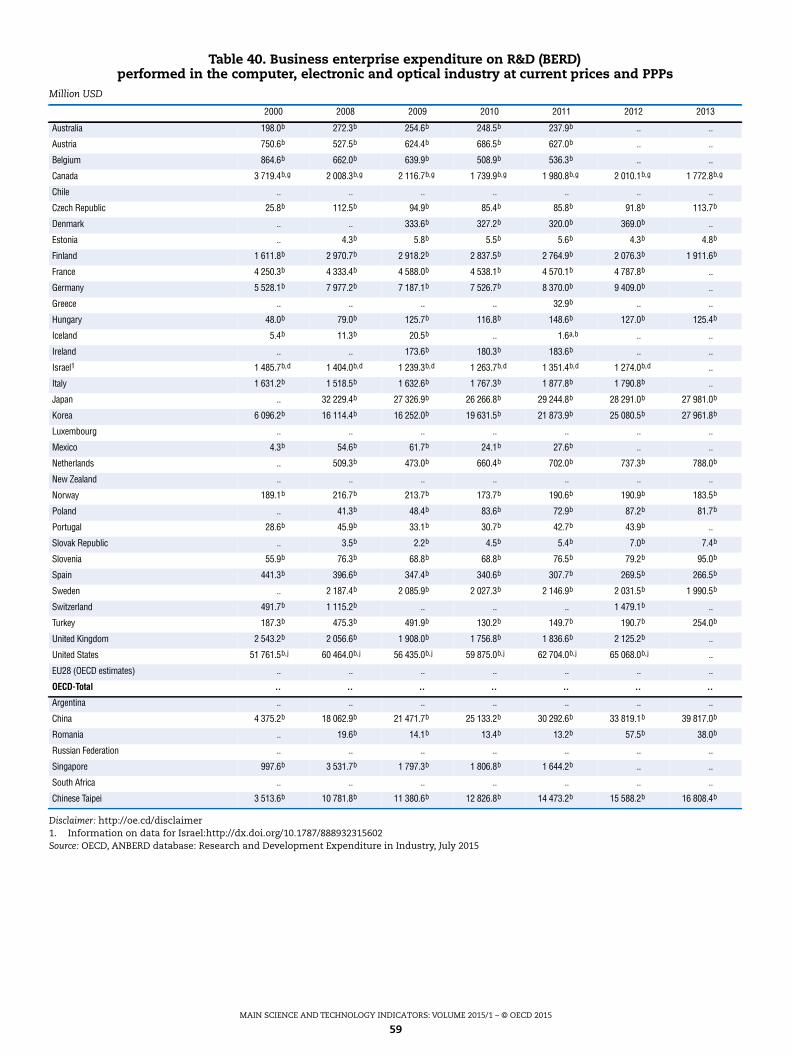
MAIN SCIENCE AND TECHNOLOGY INDICATORS: VOLUME 2015/1 – © OECD 2015
59
Disclaimer: http://oe.cd/disclaimer1. Information on data for Israel:http://dx.doi.org/10.1787/888932315602Source: OECD, ANBERD database: Research and Development Expenditure in Industry, July 2015
Table 40. Business enterprise expenditure on R&D (BERD)performed in the computer, electronic and optical industry at current prices and PPPs
Million USD
2000 2008 2009 2010 2011 2012 2013
Australia 198.0b 272.3b 254.6b 248.5b 237.9b .. ..
Austria 750.6b 527.5b 624.4b 686.5b 627.0b .. ..
Belgium 864.6b 662.0b 639.9b 508.9b 536.3b .. ..
Canada 3 719.4b,g 2 008.3b,g 2 116.7b,g 1 739.9b,g 1 980.8b,g 2 010.1b,g 1 772.8b,g
Chile .. .. .. .. .. .. ..
Czech Republic 25.8b 112.5b 94.9b 85.4b 85.8b 91.8b 113.7b
Denmark .. .. 333.6b 327.2b 320.0b 369.0b ..
Estonia .. 4.3b 5.8b 5.5b 5.6b 4.3b 4.8b
Finland 1 611.8b 2 970.7b 2 918.2b 2 837.5b 2 764.9b 2 076.3b 1 911.6b
France 4 250.3b 4 333.4b 4 588.0b 4 538.1b 4 570.1b 4 787.8b ..
Germany 5 528.1b 7 977.2b 7 187.1b 7 526.7b 8 370.0b 9 409.0b ..
Greece .. .. .. .. 32.9b .. ..
Hungary 48.0b 79.0b 125.7b 116.8b 148.6b 127.0b 125.4b
Iceland 5.4b 11.3b 20.5b .. 1.6a,b .. ..
Ireland .. .. 173.6b 180.3b 183.6b .. ..
Israel1 1 485.7b,d 1 404.0b,d 1 239.3b,d 1 263.7b,d 1 351.4b,d 1 274.0b,d ..
Italy 1 631.2b 1 518.5b 1 632.6b 1 767.3b 1 877.8b 1 790.8b ..
Japan .. 32 229.4b 27 326.9b 26 266.8b 29 244.8b 28 291.0b 27 981.0b
Korea 6 096.2b 16 114.4b 16 252.0b 19 631.5b 21 873.9b 25 080.5b 27 961.8b
Luxembourg .. .. .. .. .. .. ..
Mexico 4.3b 54.6b 61.7b 24.1b 27.6b .. ..
Netherlands .. 509.3b 473.0b 660.4b 702.0b 737.3b 788.0b
New Zealand .. .. .. .. .. .. ..
Norway 189.1b 216.7b 213.7b 173.7b 190.6b 190.9b 183.5b
Poland .. 41.3b 48.4b 83.6b 72.9b 87.2b 81.7b
Portugal 28.6b 45.9b 33.1b 30.7b 42.7b 43.9b ..
Slovak Republic .. 3.5b 2.2b 4.5b 5.4b 7.0b 7.4b
Slovenia 55.9b 76.3b 68.8b 68.8b 76.5b 79.2b 95.0b
Spain 441.3b 396.6b 347.4b 340.6b 307.7b 269.5b 266.5b
Sweden .. 2 187.4b 2 085.9b 2 027.3b 2 146.9b 2 031.5b 1 990.5b
Switzerland 491.7b 1 115.2b .. .. .. 1 479.1b ..
Turkey 187.3b 475.3b 491.9b 130.2b 149.7b 190.7b 254.0b
United Kingdom 2 543.2b 2 056.6b 1 908.0b 1 756.8b 1 836.6b 2 125.2b ..
United States 51 761.5b,j 60 464.0b,j 56 435.0b,j 59 875.0b,j 62 704.0b,j 65 068.0b,j ..
EU28 (OECD estimates) .. .. .. .. .. .. ..
OECD-Total .. .. .. .. .. .. ..
Argentina .. .. .. .. .. .. ..
China 4 375.2b 18 062.9b 21 471.7b 25 133.2b 30 292.6b 33 819.1b 39 817.0b
Romania .. 19.6b 14.1b 13.4b 13.2b 57.5b 38.0b
Russian Federation .. .. .. .. .. .. ..
Singapore 997.6b 3 531.7b 1 797.3b 1 806.8b 1 644.2b .. ..
South Africa .. .. .. .. .. .. ..
Chinese Taipei 3 513.6b 10 781.8b 11 380.6b 12 826.8b 14 473.2b 15 588.2b 16 808.4b
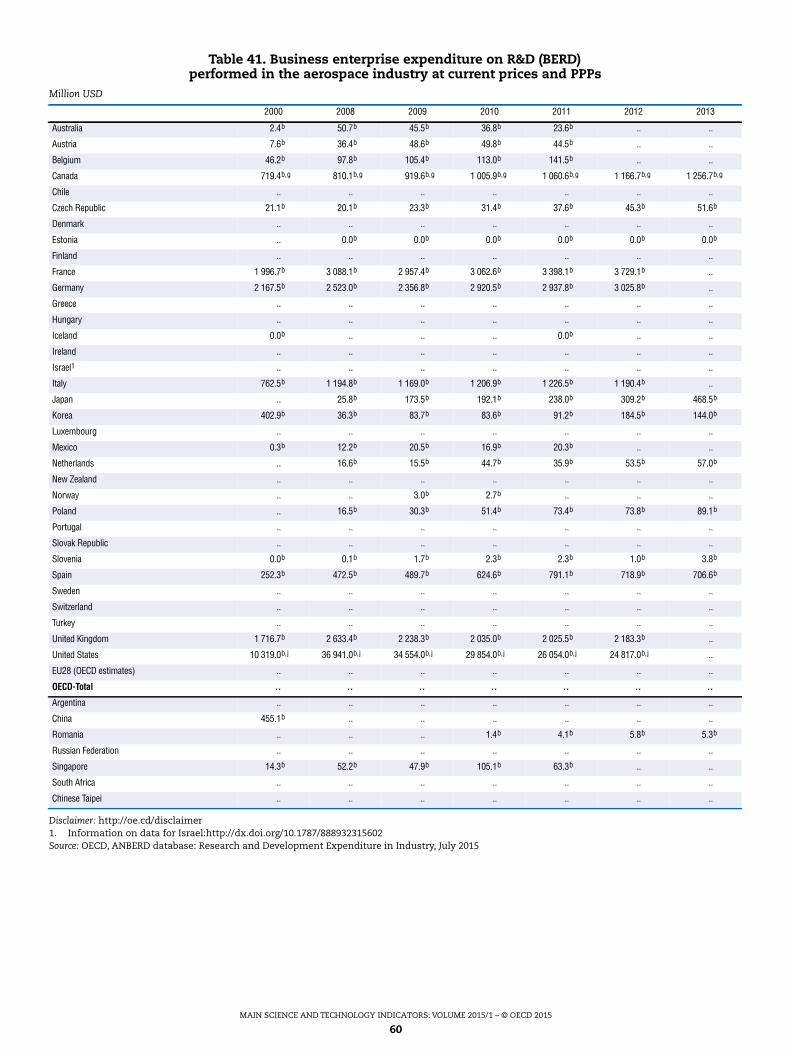
MAIN SCIENCE AND TECHNOLOGY INDICATORS: VOLUME 2015/1 – © OECD 2015
60
Disclaimer: http://oe.cd/disclaimer1. Information on data for Israel:http://dx.doi.org/10.1787/888932315602Source: OECD, ANBERD database: Research and Development Expenditure in Industry, July 2015
Table 41. Business enterprise expenditure on R&D (BERD)performed in the aerospace industry at current prices and PPPs
Million USD
2000 2008 2009 2010 2011 2012 2013
Australia 2.4b 50.7b 45.5b 36.8b 23.6b .. ..
Austria 7.6b 36.4b 48.6b 49.8b 44.5b .. ..
Belgium 46.2b 97.8b 105.4b 113.0b 141.5b .. ..
Canada 719.4b,g 810.1b,g 919.6b,g 1 005.9b,g 1 060.6b,g 1 166.7b,g 1 256.7b,g
Chile .. .. .. .. .. .. ..
Czech Republic 21.1b 20.1b 23.3b 31.4b 37.6b 45.3b 51.6b
Denmark .. .. .. .. .. .. ..
Estonia .. 0.0b 0.0b 0.0b 0.0b 0.0b 0.0b
Finland .. .. .. .. .. .. ..
France 1 996.7b 3 088.1b 2 957.4b 3 062.6b 3 398.1b 3 729.1b ..
Germany 2 167.5b 2 523.0b 2 356.8b 2 920.5b 2 937.8b 3 025.8b ..
Greece .. .. .. .. .. .. ..
Hungary .. .. .. .. .. .. ..
Iceland 0.0b .. .. .. 0.0b .. ..
Ireland .. .. .. .. .. .. ..
Israel1 .. .. .. .. .. .. ..
Italy 762.5b 1 194.8b 1 169.0b 1 206.9b 1 226.5b 1 190.4b ..
Japan .. 25.8b 173.5b 192.1b 238.0b 309.2b 468.5b
Korea 402.9b 36.3b 83.7b 83.6b 91.2b 184.5b 144.0b
Luxembourg .. .. .. .. .. .. ..
Mexico 0.3b 12.2b 20.5b 16.9b 20.3b .. ..
Netherlands .. 16.6b 15.5b 44.7b 35.9b 53.5b 57.0b
New Zealand .. .. .. .. .. .. ..
Norway .. .. 3.0b 2.7b .. .. ..
Poland .. 16.5b 30.3b 51.4b 73.4b 73.8b 89.1b
Portugal .. .. .. .. .. .. ..
Slovak Republic .. .. .. .. .. .. ..
Slovenia 0.0b 0.1b 1.7b 2.3b 2.3b 1.0b 3.8b
Spain 252.3b 472.5b 489.7b 624.6b 791.1b 718.9b 706.6b
Sweden .. .. .. .. .. .. ..
Switzerland .. .. .. .. .. .. ..
Turkey .. .. .. .. .. .. ..
United Kingdom 1 716.7b 2 633.4b 2 238.3b 2 035.0b 2 025.5b 2 183.3b ..
United States 10 319.0b,j 36 941.0b,j 34 554.0b,j 29 854.0b,j 26 054.0b,j 24 817.0b,j ..
EU28 (OECD estimates) .. .. .. .. .. .. ..
OECD-Total .. .. .. .. .. .. ..
Argentina .. .. .. .. .. .. ..
China 455.1b .. .. .. .. .. ..
Romania .. .. .. 1.4b 4.1b 5.8b 5.3b
Russian Federation .. .. .. .. .. .. ..
Singapore 14.3b 52.2b 47.9b 105.1b 63.3b .. ..
South Africa .. .. .. .. .. .. ..
Chinese Taipei .. .. .. .. .. .. ..
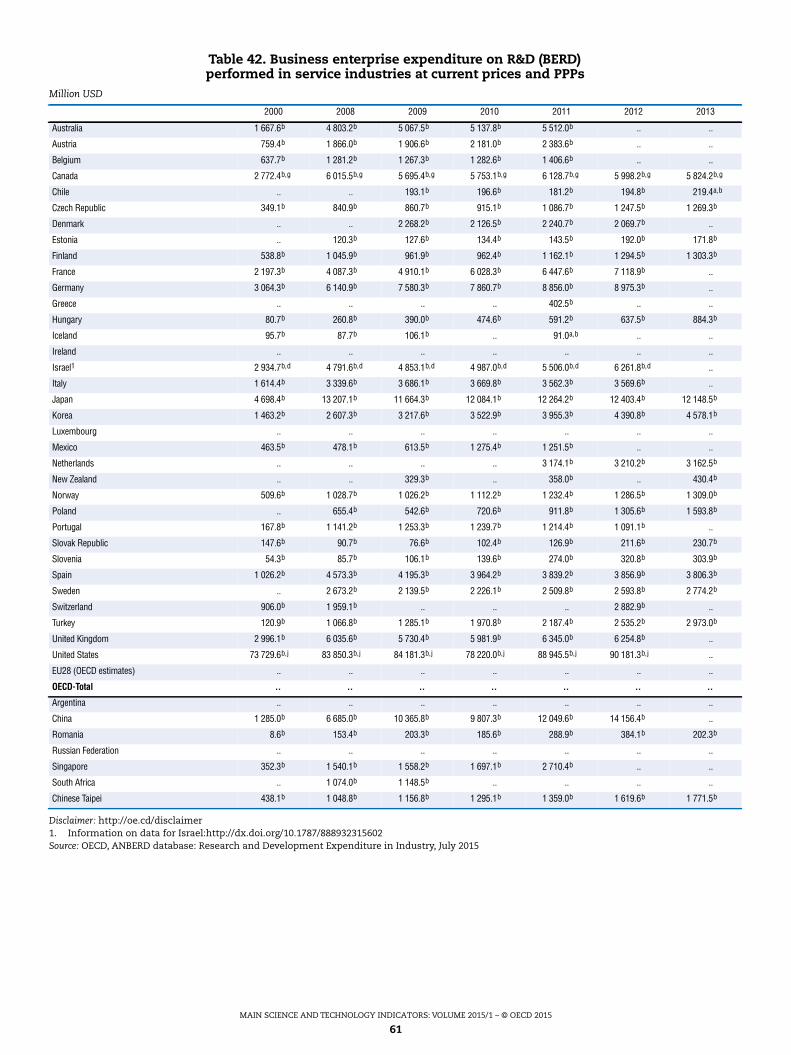
MAIN SCIENCE AND TECHNOLOGY INDICATORS: VOLUME 2015/1 – © OECD 2015
61
Disclaimer: http://oe.cd/disclaimer1. Information on data for Israel:http://dx.doi.org/10.1787/888932315602Source: OECD, ANBERD database: Research and Development Expenditure in Industry, July 2015
Table 42. Business enterprise expenditure on R&D (BERD)performed in service industries at current prices and PPPs
Million USD
2000 2008 2009 2010 2011 2012 2013
Australia 1 667.6b 4 803.2b 5 067.5b 5 137.8b 5 512.0b .. ..
Austria 759.4b 1 866.0b 1 906.6b 2 181.0b 2 383.6b .. ..
Belgium 637.7b 1 281.2b 1 267.3b 1 282.6b 1 406.6b .. ..
Canada 2 772.4b,g 6 015.5b,g 5 695.4b,g 5 753.1b,g 6 128.7b,g 5 998.2b,g 5 824.2b,g
Chile .. .. 193.1b 196.6b 181.2b 194.8b 219.4a,b
Czech Republic 349.1b 840.9b 860.7b 915.1b 1 086.7b 1 247.5b 1 269.3b
Denmark .. .. 2 268.2b 2 126.5b 2 240.7b 2 069.7b ..
Estonia .. 120.3b 127.6b 134.4b 143.5b 192.0b 171.8b
Finland 538.8b 1 045.9b 961.9b 962.4b 1 162.1b 1 294.5b 1 303.3b
France 2 197.3b 4 087.3b 4 910.1b 6 028.3b 6 447.6b 7 118.9b ..
Germany 3 064.3b 6 140.9b 7 580.3b 7 860.7b 8 856.0b 8 975.3b ..
Greece .. .. .. .. 402.5b .. ..
Hungary 80.7b 260.8b 390.0b 474.6b 591.2b 637.5b 884.3b
Iceland 95.7b 87.7b 106.1b .. 91.0a,b .. ..
Ireland .. .. .. .. .. .. ..
Israel1 2 934.7b,d 4 791.6b,d 4 853.1b,d 4 987.0b,d 5 506.0b,d 6 261.8b,d ..
Italy 1 614.4b 3 339.6b 3 686.1b 3 669.8b 3 562.3b 3 569.6b ..
Japan 4 698.4b 13 207.1b 11 664.3b 12 084.1b 12 264.2b 12 403.4b 12 148.5b
Korea 1 463.2b 2 607.3b 3 217.6b 3 522.9b 3 955.3b 4 390.8b 4 578.1b
Luxembourg .. .. .. .. .. .. ..
Mexico 463.5b 478.1b 613.5b 1 275.4b 1 251.5b .. ..
Netherlands .. .. .. .. 3 174.1b 3 210.2b 3 162.5b
New Zealand .. .. 329.3b .. 358.0b .. 430.4b
Norway 509.6b 1 028.7b 1 026.2b 1 112.2b 1 232.4b 1 286.5b 1 309.0b
Poland .. 655.4b 542.6b 720.6b 911.8b 1 305.6b 1 593.8b
Portugal 167.8b 1 141.2b 1 253.3b 1 239.7b 1 214.4b 1 091.1b ..
Slovak Republic 147.6b 90.7b 76.6b 102.4b 126.9b 211.6b 230.7b
Slovenia 54.3b 85.7b 106.1b 139.6b 274.0b 320.8b 303.9b
Spain 1 026.2b 4 573.3b 4 195.3b 3 964.2b 3 839.2b 3 856.9b 3 806.3b
Sweden .. 2 673.2b 2 139.5b 2 226.1b 2 509.8b 2 593.8b 2 774.2b
Switzerland 906.0b 1 959.1b .. .. .. 2 882.9b ..
Turkey 120.9b 1 066.8b 1 285.1b 1 970.8b 2 187.4b 2 535.2b 2 973.0b
United Kingdom 2 996.1b 6 035.6b 5 730.4b 5 981.9b 6 345.0b 6 254.8b ..
United States 73 729.6b,j 83 850.3b,j 84 181.3b,j 78 220.0b,j 88 945.5b,j 90 181.3b,j ..
EU28 (OECD estimates) .. .. .. .. .. .. ..
OECD-Total .. .. .. .. .. .. ..
Argentina .. .. .. .. .. .. ..
China 1 285.0b 6 685.0b 10 365.8b 9 807.3b 12 049.6b 14 156.4b ..
Romania 8.6b 153.4b 203.3b 185.6b 288.9b 384.1b 202.3b
Russian Federation .. .. .. .. .. .. ..
Singapore 352.3b 1 540.1b 1 558.2b 1 697.1b 2 710.4b .. ..
South Africa .. 1 074.0b 1 148.5b .. .. .. ..
Chinese Taipei 438.1b 1 048.8b 1 156.8b 1 295.1b 1 359.0b 1 619.6b 1 771.5b
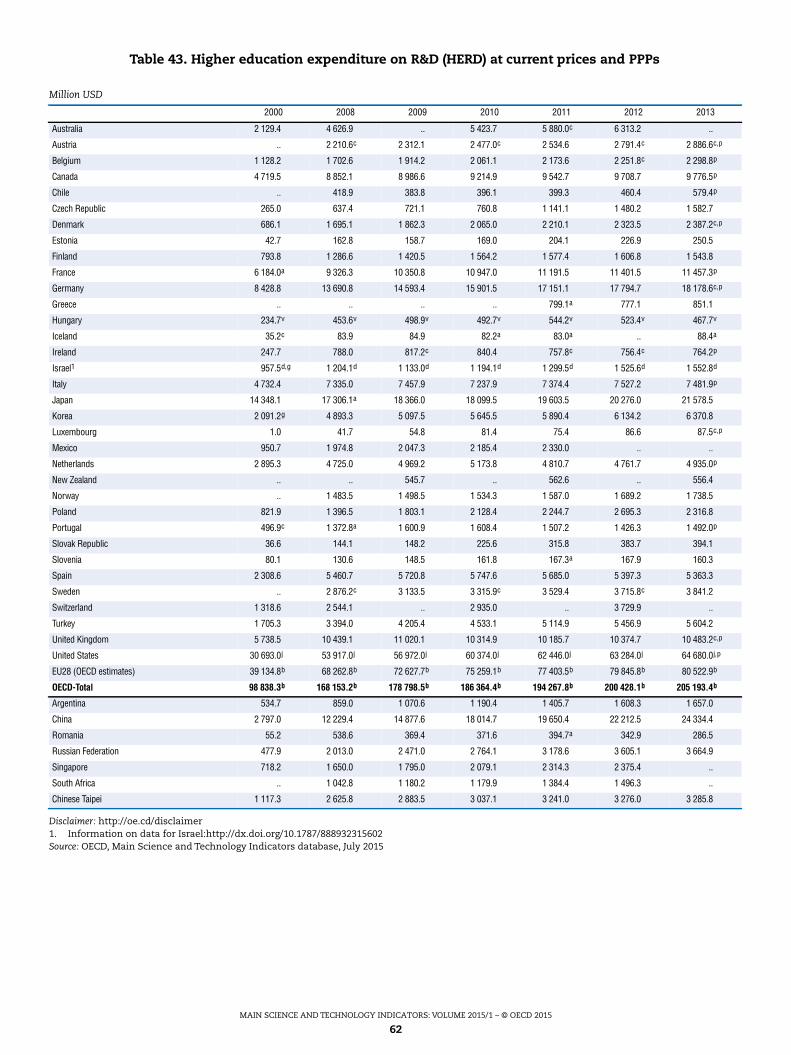
MAIN SCIENCE AND TECHNOLOGY INDICATORS: VOLUME 2015/1 – © OECD 2015
62
Disclaimer: http://oe.cd/disclaimer1. Information on data for Israel:http://dx.doi.org/10.1787/888932315602Source: OECD, Main Science and Technology Indicators database, July 2015
Table 43. Higher education expenditure on R&D (HERD) at current prices and PPPs
Million USD
2000 2008 2009 2010 2011 2012 2013
Australia 2 129.4 4 626.9 .. 5 423.7 5 880.0c 6 313.2 ..
Austria .. 2 210.6c 2 312.1 2 477.0c 2 534.6 2 791.4c 2 886.6c,p
Belgium 1 128.2 1 702.6 1 914.2 2 061.1 2 173.6 2 251.8c 2 298.8p
Canada 4 719.5 8 852.1 8 986.6 9 214.9 9 542.7 9 708.7 9 776.5p
Chile .. 418.9 383.8 396.1 399.3 460.4 579.4p
Czech Republic 265.0 637.4 721.1 760.8 1 141.1 1 480.2 1 582.7
Denmark 686.1 1 695.1 1 862.3 2 065.0 2 210.1 2 323.5 2 387.2c,p
Estonia 42.7 162.8 158.7 169.0 204.1 226.9 250.5
Finland 793.8 1 286.6 1 420.5 1 564.2 1 577.4 1 606.8 1 543.8
France 6 184.0a 9 326.3 10 350.8 10 947.0 11 191.5 11 401.5 11 457.3p
Germany 8 428.8 13 690.8 14 593.4 15 901.5 17 151.1 17 794.7 18 178.6c,p
Greece .. .. .. .. 799.1a 777.1 851.1
Hungary 234.7v 453.6v 498.9v 492.7v 544.2v 523.4v 467.7v
Iceland 35.2c 83.9 84.9 82.2a 83.0a .. 88.4a
Ireland 247.7 788.0 817.2c 840.4 757.8c 756.4c 764.2p
Israel1 957.5d,g 1 204.1d 1 133.0d 1 194.1d 1 299.5d 1 525.6d 1 552.8d
Italy 4 732.4 7 335.0 7 457.9 7 237.9 7 374.4 7 527.2 7 481.9p
Japan 14 348.1 17 306.1a 18 366.0 18 099.5 19 603.5 20 276.0 21 578.5
Korea 2 091.2g 4 893.3 5 097.5 5 645.5 5 890.4 6 134.2 6 370.8
Luxembourg 1.0 41.7 54.8 81.4 75.4 86.6 87.5c,p
Mexico 950.7 1 974.8 2 047.3 2 185.4 2 330.0 .. ..
Netherlands 2 895.3 4 725.0 4 969.2 5 173.8 4 810.7 4 761.7 4 935.0p
New Zealand .. .. 545.7 .. 562.6 .. 556.4
Norway .. 1 483.5 1 498.5 1 534.3 1 587.0 1 689.2 1 738.5
Poland 821.9 1 396.5 1 803.1 2 128.4 2 244.7 2 695.3 2 316.8
Portugal 496.9c 1 372.8a 1 600.9 1 608.4 1 507.2 1 426.3 1 492.0p
Slovak Republic 36.6 144.1 148.2 225.6 315.8 383.7 394.1
Slovenia 80.1 130.6 148.5 161.8 167.3a 167.9 160.3
Spain 2 308.6 5 460.7 5 720.8 5 747.6 5 685.0 5 397.3 5 363.3
Sweden .. 2 876.2c 3 133.5 3 315.9c 3 529.4 3 715.8c 3 841.2
Switzerland 1 318.6 2 544.1 .. 2 935.0 .. 3 729.9 ..
Turkey 1 705.3 3 394.0 4 205.4 4 533.1 5 114.9 5 456.9 5 604.2
United Kingdom 5 738.5 10 439.1 11 020.1 10 314.9 10 185.7 10 374.7 10 483.2c,p
United States 30 693.0j 53 917.0j 56 972.0j 60 374.0j 62 446.0j 63 284.0j 64 680.0j,p
EU28 (OECD estimates) 39 134.8b 68 262.8b 72 627.7b 75 259.1b 77 403.5b 79 845.8b 80 522.9b
OECD-Total 98 838.3b 168 153.2b 178 798.5b 186 364.4b 194 267.8b 200 428.1b 205 193.4b
Argentina 534.7 859.0 1 070.6 1 190.4 1 405.7 1 608.3 1 657.0
China 2 797.0 12 229.4 14 877.6 18 014.7 19 650.4 22 212.5 24 334.4
Romania 55.2 538.6 369.4 371.6 394.7a 342.9 286.5
Russian Federation 477.9 2 013.0 2 471.0 2 764.1 3 178.6 3 605.1 3 664.9
Singapore 718.2 1 650.0 1 795.0 2 079.1 2 314.3 2 375.4 ..
South Africa .. 1 042.8 1 180.2 1 179.9 1 384.4 1 496.3 ..
Chinese Taipei 1 117.3 2 625.8 2 883.5 3 037.1 3 241.0 3 276.0 3 285.8

MAIN SCIENCE AND TECHNOLOGY INDICATORS: VOLUME 2015/1 – © OECD 2015
63
Disclaimer: http://oe.cd/disclaimer1. Information on data for Israel:http://dx.doi.org/10.1787/888932315602Source: OECD, Main Science and Technology Indicators database, July 2015
Table 44. Higher education expenditure on R&D (HERD)as a percentage of GDP
Percentage
2000 2008 2009 2010 2011 2012 2013
Australia 0.40 0.54 .. 0.58 0.60c 0.63 ..
Austria .. 0.65c 0.68 0.71c 0.69 0.74c 0.76c,p
Belgium 0.39 0.42 0.47 0.48 0.48 0.49c 0.49p
Canada 0.53 0.66 0.69 0.68 0.67 0.66 0.65p
Chile .. 0.15y 0.14y 0.13y 0.11y 0.13y 0.15p,y
Czech Republic 0.16 0.23 0.26 0.27 0.38 0.49 0.52
Denmark 0.43 0.76 0.85 0.89 0.92 0.95 0.97c,p
Estonia 0.31 0.54 0.59 0.60 0.65 0.69 0.74
Finland 0.58 0.61 0.71 0.76 0.73 0.74 0.71
France 0.39a 0.41 0.46 0.47 0.46 0.47 0.46p
Germany 0.39 0.43 0.48 0.49 0.50 0.51 0.51c,p
Greece .. .. .. .. 0.27a 0.28 0.30
Hungary 0.19v 0.22v 0.24v 0.23v 0.24v 0.23v 0.20v
Iceland 0.42c 0.64 0.67 0.67a 0.66a .. 0.65a
Ireland 0.22 0.40 0.43c 0.43 0.37c 0.36c 0.36p
Israel1 0.62d,g 0.61d 0.55d 0.54d 0.55d 0.61d 0.59d
Italy 0.31 0.35 0.37 0.35 0.35 0.36 0.35p
Japan 0.44y 0.40a,y 0.45y 0.42y 0.45y 0.45y 0.47y
Korea 0.25g 0.35 0.37 0.38 0.38 0.38 0.38
Luxembourg 0.00 0.10 0.14 0.19 0.16 0.18 0.18c,p
Mexico 0.09 0.12 0.13 0.13 0.12 .. ..
Netherlands 0.58 0.63 0.68 0.70 0.62 0.62 0.64p
New Zealand .. .. 0.42 .. 0.40 .. 0.36
Norway .. 0.50 0.55 0.53 0.51 0.51 0.52
Poland 0.20 0.20 0.25 0.27 0.26 0.31 0.25
Portugal 0.27c 0.50a 0.58 0.57 0.53 0.50 0.52p
Slovak Republic 0.06 0.11 0.12 0.17 0.23 0.28 0.27
Slovenia 0.23 0.22 0.26 0.29 0.29a 0.29 0.27
Spain 0.26 0.35 0.38 0.38 0.37 0.35 0.35
Sweden .. 0.74c 0.85 0.85c 0.85 0.89c 0.90
Switzerland 0.53 0.66 .. 0.73 .. 0.83 ..
Turkey 0.29y 0.32y 0.40y 0.39y 0.39y 0.40y 0.40y
United Kingdom 0.36 0.45 0.49 0.46 0.44 0.44 0.43c,p
United States 0.30j 0.37j 0.40j 0.40j 0.40j 0.39j 0.39j,p
EU28 (OECD estimates) 0.36b 0.41b 0.45b 0.45b 0.44b 0.45b 0.45b
OECD-Total 0.34b 0.40b 0.43b 0.43b 0.43b 0.43b 0.43b
Argentina 0.12 0.12 0.15 0.15 0.16 0.18 0.18
China 0.08y 0.12y 0.14y 0.15y 0.15y 0.15y 0.15y
Romania 0.04 0.16 0.11 0.11 0.11a 0.09 0.08
Russian Federation 0.05y 0.07y 0.09y 0.09y 0.10y 0.10y 0.10y
Singapore 0.44 0.54 0.58 0.58 0.60 0.58 ..
South Africa .. 0.18 0.20 0.20 0.22 0.22 ..
Chinese Taipei 0.23 0.33 0.36 0.34 0.34 0.33 0.32
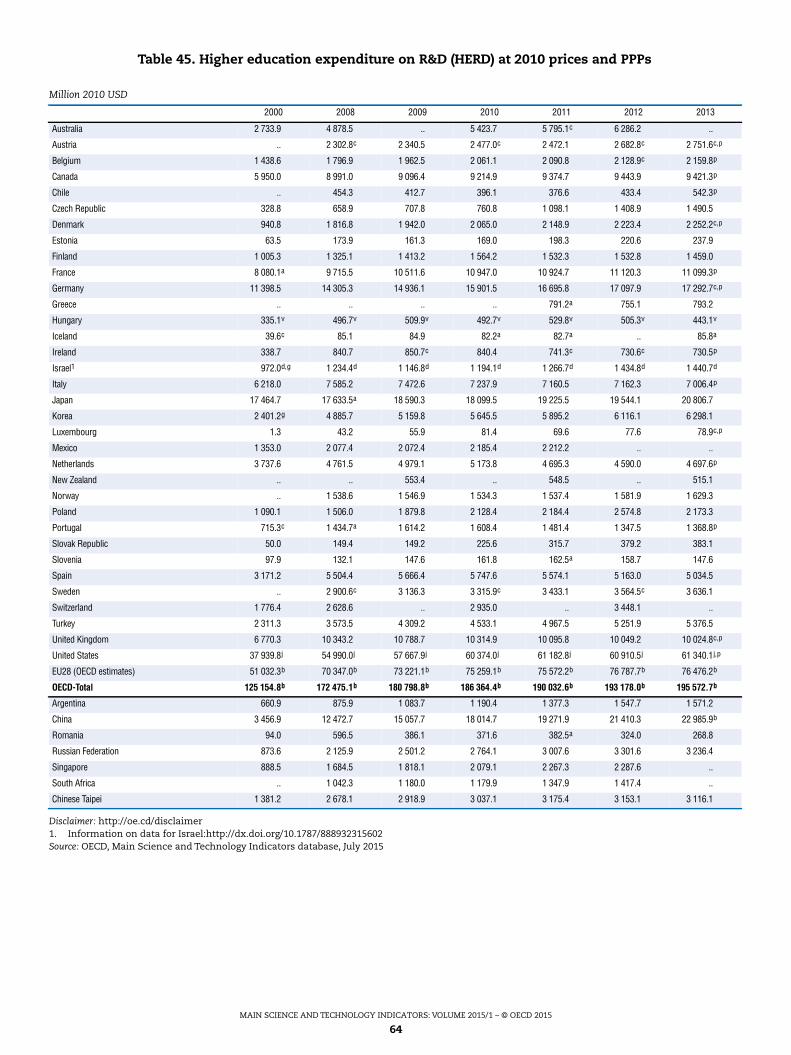
MAIN SCIENCE AND TECHNOLOGY INDICATORS: VOLUME 2015/1 – © OECD 2015
64
Disclaimer: http://oe.cd/disclaimer1. Information on data for Israel:http://dx.doi.org/10.1787/888932315602Source: OECD, Main Science and Technology Indicators database, July 2015
Table 45. Higher education expenditure on R&D (HERD) at 2010 prices and PPPs
Million 2010 USD
2000 2008 2009 2010 2011 2012 2013
Australia 2 733.9 4 878.5 .. 5 423.7 5 795.1c 6 286.2 ..
Austria .. 2 302.8c 2 340.5 2 477.0c 2 472.1 2 682.8c 2 751.6c,p
Belgium 1 438.6 1 796.9 1 962.5 2 061.1 2 090.8 2 128.9c 2 159.8p
Canada 5 950.0 8 991.0 9 096.4 9 214.9 9 374.7 9 443.9 9 421.3p
Chile .. 454.3 412.7 396.1 376.6 433.4 542.3p
Czech Republic 328.8 658.9 707.8 760.8 1 098.1 1 408.9 1 490.5
Denmark 940.8 1 816.8 1 942.0 2 065.0 2 148.9 2 223.4 2 252.2c,p
Estonia 63.5 173.9 161.3 169.0 198.3 220.6 237.9
Finland 1 005.3 1 325.1 1 413.2 1 564.2 1 532.3 1 532.8 1 459.0
France 8 080.1a 9 715.5 10 511.6 10 947.0 10 924.7 11 120.3 11 099.3p
Germany 11 398.5 14 305.3 14 936.1 15 901.5 16 695.8 17 097.9 17 292.7c,p
Greece .. .. .. .. 791.2a 755.1 793.2
Hungary 335.1v 496.7v 509.9v 492.7v 529.8v 505.3v 443.1v
Iceland 39.6c 85.1 84.9 82.2a 82.7a .. 85.8a
Ireland 338.7 840.7 850.7c 840.4 741.3c 730.6c 730.5p
Israel1 972.0d,g 1 234.4d 1 146.8d 1 194.1d 1 266.7d 1 434.8d 1 440.7d
Italy 6 218.0 7 585.2 7 472.6 7 237.9 7 160.5 7 162.3 7 006.4p
Japan 17 464.7 17 633.5a 18 590.3 18 099.5 19 225.5 19 544.1 20 806.7
Korea 2 401.2g 4 885.7 5 159.8 5 645.5 5 895.2 6 116.1 6 298.1
Luxembourg 1.3 43.2 55.9 81.4 69.6 77.6 78.9c,p
Mexico 1 353.0 2 077.4 2 072.4 2 185.4 2 212.2 .. ..
Netherlands 3 737.6 4 761.5 4 979.1 5 173.8 4 695.3 4 590.0 4 697.6p
New Zealand .. .. 553.4 .. 548.5 .. 515.1
Norway .. 1 538.6 1 546.9 1 534.3 1 537.4 1 581.9 1 629.3
Poland 1 090.1 1 506.0 1 879.8 2 128.4 2 184.4 2 574.8 2 173.3
Portugal 715.3c 1 434.7a 1 614.2 1 608.4 1 481.4 1 347.5 1 368.8p
Slovak Republic 50.0 149.4 149.2 225.6 315.7 379.2 383.1
Slovenia 97.9 132.1 147.6 161.8 162.5a 158.7 147.6
Spain 3 171.2 5 504.4 5 666.4 5 747.6 5 574.1 5 163.0 5 034.5
Sweden .. 2 900.6c 3 136.3 3 315.9c 3 433.1 3 564.5c 3 636.1
Switzerland 1 776.4 2 628.6 .. 2 935.0 .. 3 448.1 ..
Turkey 2 311.3 3 573.5 4 309.2 4 533.1 4 967.5 5 251.9 5 376.5
United Kingdom 6 770.3 10 343.2 10 788.7 10 314.9 10 095.8 10 049.2 10 024.8c,p
United States 37 939.8j 54 990.0j 57 667.9j 60 374.0j 61 182.8j 60 910.5j 61 340.1j,p
EU28 (OECD estimates) 51 032.3b 70 347.0b 73 221.1b 75 259.1b 75 572.2b 76 787.7b 76 476.2b
OECD-Total 125 154.8b 172 475.1b 180 798.8b 186 364.4b 190 032.6b 193 178.0b 195 572.7b
Argentina 660.9 875.9 1 083.7 1 190.4 1 377.3 1 547.7 1 571.2
China 3 456.9 12 472.7 15 057.7 18 014.7 19 271.9 21 410.3 22 985.9b
Romania 94.0 596.5 386.1 371.6 382.5a 324.0 268.8
Russian Federation 873.6 2 125.9 2 501.2 2 764.1 3 007.6 3 301.6 3 236.4
Singapore 888.5 1 684.5 1 818.1 2 079.1 2 267.3 2 287.6 ..
South Africa .. 1 042.3 1 180.0 1 179.9 1 347.9 1 417.4 ..
Chinese Taipei 1 381.2 2 678.1 2 918.9 3 037.1 3 175.4 3 153.1 3 116.1
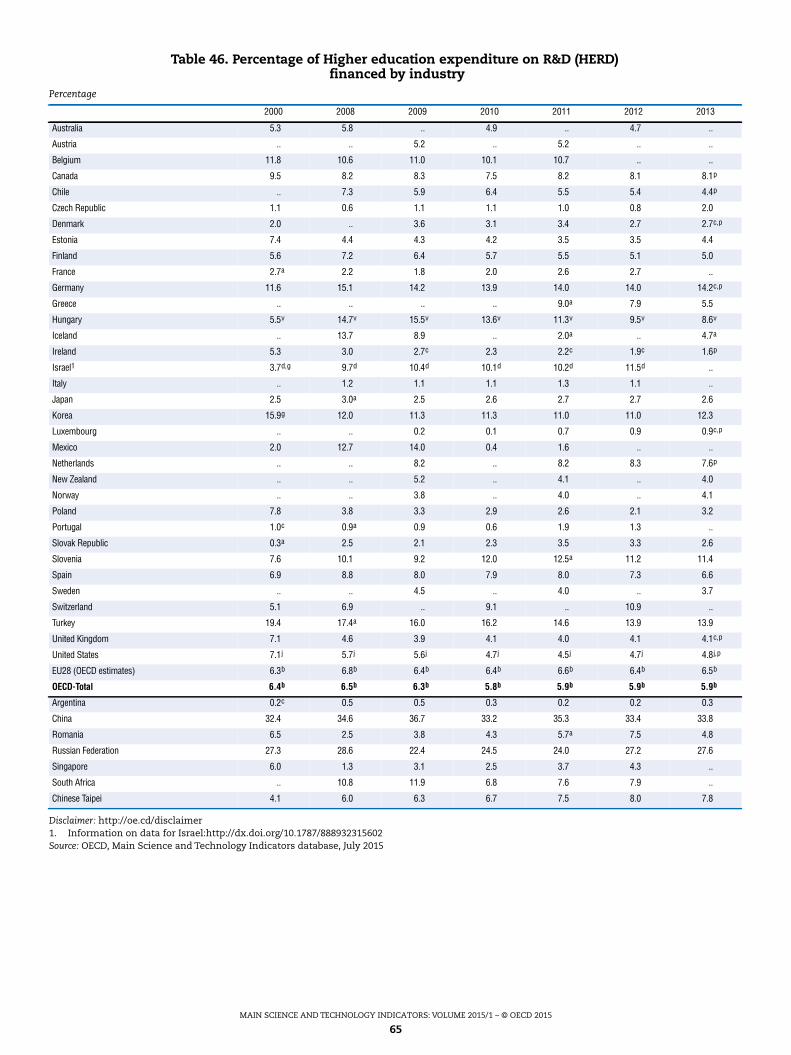
MAIN SCIENCE AND TECHNOLOGY INDICATORS: VOLUME 2015/1 – © OECD 2015
65
Disclaimer: http://oe.cd/disclaimer1. Information on data for Israel:http://dx.doi.org/10.1787/888932315602Source: OECD, Main Science and Technology Indicators database, July 2015
Table 46. Percentage of Higher education expenditure on R&D (HERD)financed by industry
Percentage
2000 2008 2009 2010 2011 2012 2013
Australia 5.3 5.8 .. 4.9 .. 4.7 ..
Austria .. .. 5.2 .. 5.2 .. ..
Belgium 11.8 10.6 11.0 10.1 10.7 .. ..
Canada 9.5 8.2 8.3 7.5 8.2 8.1 8.1p
Chile .. 7.3 5.9 6.4 5.5 5.4 4.4p
Czech Republic 1.1 0.6 1.1 1.1 1.0 0.8 2.0
Denmark 2.0 .. 3.6 3.1 3.4 2.7 2.7c,p
Estonia 7.4 4.4 4.3 4.2 3.5 3.5 4.4
Finland 5.6 7.2 6.4 5.7 5.5 5.1 5.0
France 2.7a 2.2 1.8 2.0 2.6 2.7 ..
Germany 11.6 15.1 14.2 13.9 14.0 14.0 14.2c,p
Greece .. .. .. .. 9.0a 7.9 5.5
Hungary 5.5v 14.7v 15.5v 13.6v 11.3v 9.5v 8.6v
Iceland .. 13.7 8.9 .. 2.0a .. 4.7a
Ireland 5.3 3.0 2.7c 2.3 2.2c 1.9c 1.6p
Israel1 3.7d,g 9.7d 10.4d 10.1d 10.2d 11.5d ..
Italy .. 1.2 1.1 1.1 1.3 1.1 ..
Japan 2.5 3.0a 2.5 2.6 2.7 2.7 2.6
Korea 15.9g 12.0 11.3 11.3 11.0 11.0 12.3
Luxembourg .. .. 0.2 0.1 0.7 0.9 0.9c,p
Mexico 2.0 12.7 14.0 0.4 1.6 .. ..
Netherlands .. .. 8.2 .. 8.2 8.3 7.6p
New Zealand .. .. 5.2 .. 4.1 .. 4.0
Norway .. .. 3.8 .. 4.0 .. 4.1
Poland 7.8 3.8 3.3 2.9 2.6 2.1 3.2
Portugal 1.0c 0.9a 0.9 0.6 1.9 1.3 ..
Slovak Republic 0.3a 2.5 2.1 2.3 3.5 3.3 2.6
Slovenia 7.6 10.1 9.2 12.0 12.5a 11.2 11.4
Spain 6.9 8.8 8.0 7.9 8.0 7.3 6.6
Sweden .. .. 4.5 .. 4.0 .. 3.7
Switzerland 5.1 6.9 .. 9.1 .. 10.9 ..
Turkey 19.4 17.4a 16.0 16.2 14.6 13.9 13.9
United Kingdom 7.1 4.6 3.9 4.1 4.0 4.1 4.1c,p
United States 7.1j 5.7j 5.6j 4.7j 4.5j 4.7j 4.8j,p
EU28 (OECD estimates) 6.3b 6.8b 6.4b 6.4b 6.6b 6.4b 6.5b
OECD-Total 6.4b 6.5b 6.3b 5.8b 5.9b 5.9b 5.9b
Argentina 0.2c 0.5 0.5 0.3 0.2 0.2 0.3
China 32.4 34.6 36.7 33.2 35.3 33.4 33.8
Romania 6.5 2.5 3.8 4.3 5.7a 7.5 4.8
Russian Federation 27.3 28.6 22.4 24.5 24.0 27.2 27.6
Singapore 6.0 1.3 3.1 2.5 3.7 4.3 ..
South Africa .. 10.8 11.9 6.8 7.6 7.9 ..
Chinese Taipei 4.1 6.0 6.3 6.7 7.5 8.0 7.8
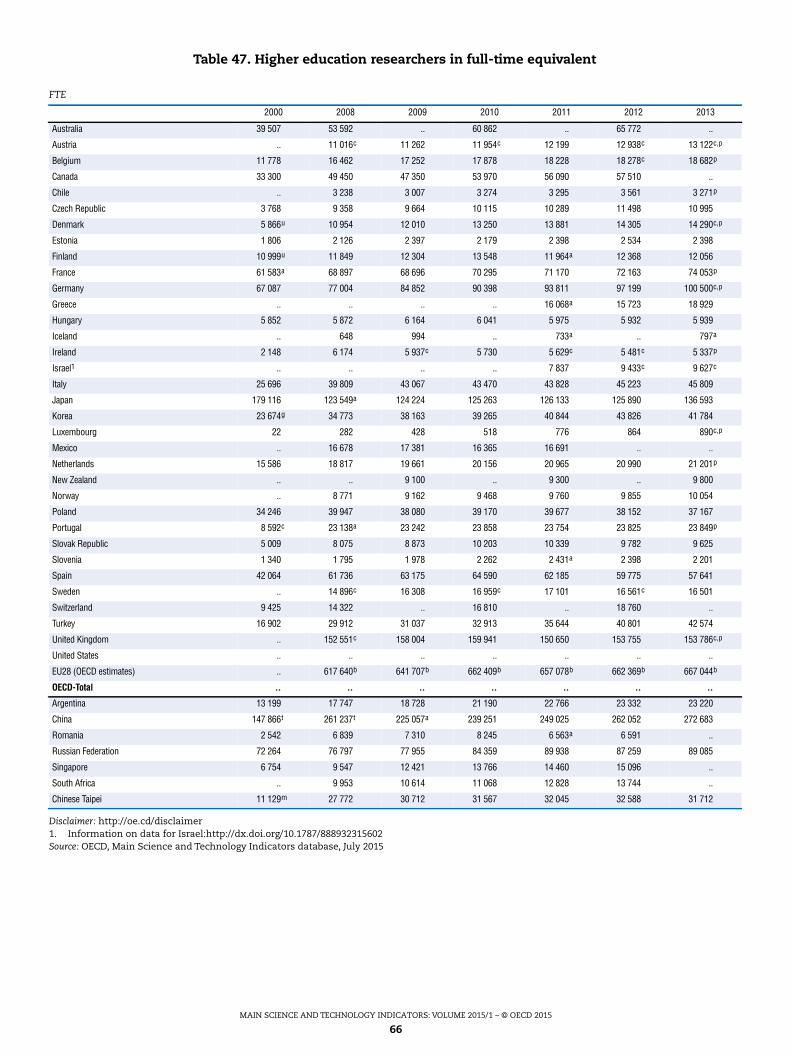
MAIN SCIENCE AND TECHNOLOGY INDICATORS: VOLUME 2015/1 – © OECD 2015
66
Disclaimer: http://oe.cd/disclaimer1. Information on data for Israel:http://dx.doi.org/10.1787/888932315602Source: OECD, Main Science and Technology Indicators database, July 2015
Table 47. Higher education researchers in full-time equivalent
FTE
2000 2008 2009 2010 2011 2012 2013
Australia 39 507 53 592 .. 60 862 .. 65 772 ..
Austria .. 11 016c 11 262 11 954c 12 199 12 938c 13 122c,p
Belgium 11 778 16 462 17 252 17 878 18 228 18 278c 18 682p
Canada 33 300 49 450 47 350 53 970 56 090 57 510 ..
Chile .. 3 238 3 007 3 274 3 295 3 561 3 271p
Czech Republic 3 768 9 358 9 664 10 115 10 289 11 498 10 995
Denmark 5 866u 10 954 12 010 13 250 13 881 14 305 14 290c,p
Estonia 1 806 2 126 2 397 2 179 2 398 2 534 2 398
Finland 10 999u 11 849 12 304 13 548 11 964a 12 368 12 056
France 61 583a 68 897 68 696 70 295 71 170 72 163 74 053p
Germany 67 087 77 004 84 852 90 398 93 811 97 199 100 500c,p
Greece .. .. .. .. 16 068a 15 723 18 929
Hungary 5 852 5 872 6 164 6 041 5 975 5 932 5 939
Iceland .. 648 994 .. 733a .. 797a
Ireland 2 148 6 174 5 937c 5 730 5 629c 5 481c 5 337p
Israel1 .. .. .. .. 7 837 9 433c 9 627c
Italy 25 696 39 809 43 067 43 470 43 828 45 223 45 809
Japan 179 116 123 549a 124 224 125 263 126 133 125 890 136 593
Korea 23 674g 34 773 38 163 39 265 40 844 43 826 41 784
Luxembourg 22 282 428 518 776 864 890c,p
Mexico .. 16 678 17 381 16 365 16 691 .. ..
Netherlands 15 586 18 817 19 661 20 156 20 965 20 990 21 201p
New Zealand .. .. 9 100 .. 9 300 .. 9 800
Norway .. 8 771 9 162 9 468 9 760 9 855 10 054
Poland 34 246 39 947 38 080 39 170 39 677 38 152 37 167
Portugal 8 592c 23 138a 23 242 23 858 23 754 23 825 23 849p
Slovak Republic 5 009 8 075 8 873 10 203 10 339 9 782 9 625
Slovenia 1 340 1 795 1 978 2 262 2 431a 2 398 2 201
Spain 42 064 61 736 63 175 64 590 62 185 59 775 57 641
Sweden .. 14 896c 16 308 16 959c 17 101 16 561c 16 501
Switzerland 9 425 14 322 .. 16 810 .. 18 760 ..
Turkey 16 902 29 912 31 037 32 913 35 644 40 801 42 574
United Kingdom .. 152 551c 158 004 159 941 150 650 153 755 153 786c,p
United States .. .. .. .. .. .. ..
EU28 (OECD estimates) .. 617 640b 641 707b 662 409b 657 078b 662 369b 667 044b
OECD-Total .. .. .. .. .. .. ..
Argentina 13 199 17 747 18 728 21 190 22 766 23 332 23 220
China 147 866t 261 237t 225 057a 239 251 249 025 262 052 272 683
Romania 2 542 6 839 7 310 8 245 6 563a 6 591 ..
Russian Federation 72 264 76 797 77 955 84 359 89 938 87 259 89 085
Singapore 6 754 9 547 12 421 13 766 14 460 15 096 ..
South Africa .. 9 953 10 614 11 068 12 828 13 744 ..
Chinese Taipei 11 129m 27 772 30 712 31 567 32 045 32 588 31 712
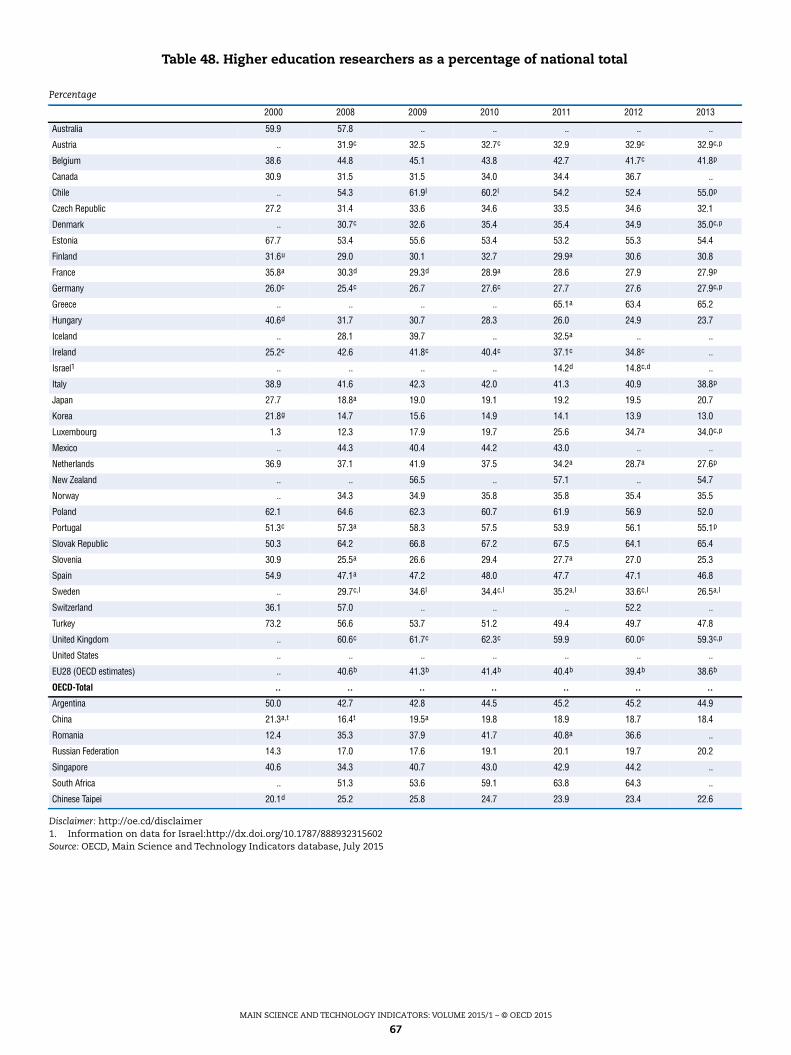
MAIN SCIENCE AND TECHNOLOGY INDICATORS: VOLUME 2015/1 – © OECD 2015
67
Disclaimer: http://oe.cd/disclaimer1. Information on data for Israel:http://dx.doi.org/10.1787/888932315602Source: OECD, Main Science and Technology Indicators database, July 2015
Table 48. Higher education researchers as a percentage of national total
Percentage
2000 2008 2009 2010 2011 2012 2013
Australia 59.9 57.8 .. .. .. .. ..
Austria .. 31.9c 32.5 32.7c 32.9 32.9c 32.9c,p
Belgium 38.6 44.8 45.1 43.8 42.7 41.7c 41.8p
Canada 30.9 31.5 31.5 34.0 34.4 36.7 ..
Chile .. 54.3 61.9l 60.2l 54.2 52.4 55.0p
Czech Republic 27.2 31.4 33.6 34.6 33.5 34.6 32.1
Denmark .. 30.7c 32.6 35.4 35.4 34.9 35.0c,p
Estonia 67.7 53.4 55.6 53.4 53.2 55.3 54.4
Finland 31.6u 29.0 30.1 32.7 29.9a 30.6 30.8
France 35.8a 30.3d 29.3d 28.9a 28.6 27.9 27.9p
Germany 26.0c 25.4c 26.7 27.6c 27.7 27.6 27.9c,p
Greece .. .. .. .. 65.1a 63.4 65.2
Hungary 40.6d 31.7 30.7 28.3 26.0 24.9 23.7
Iceland .. 28.1 39.7 .. 32.5a .. ..
Ireland 25.2c 42.6 41.8c 40.4c 37.1c 34.8c ..
Israel1 .. .. .. .. 14.2d 14.8c,d ..
Italy 38.9 41.6 42.3 42.0 41.3 40.9 38.8p
Japan 27.7 18.8a 19.0 19.1 19.2 19.5 20.7
Korea 21.8g 14.7 15.6 14.9 14.1 13.9 13.0
Luxembourg 1.3 12.3 17.9 19.7 25.6 34.7a 34.0c,p
Mexico .. 44.3 40.4 44.2 43.0 .. ..
Netherlands 36.9 37.1 41.9 37.5 34.2a 28.7a 27.6p
New Zealand .. .. 56.5 .. 57.1 .. 54.7
Norway .. 34.3 34.9 35.8 35.8 35.4 35.5
Poland 62.1 64.6 62.3 60.7 61.9 56.9 52.0
Portugal 51.3c 57.3a 58.3 57.5 53.9 56.1 55.1p
Slovak Republic 50.3 64.2 66.8 67.2 67.5 64.1 65.4
Slovenia 30.9 25.5a 26.6 29.4 27.7a 27.0 25.3
Spain 54.9 47.1a 47.2 48.0 47.7 47.1 46.8
Sweden .. 29.7c,l 34.6l 34.4c,l 35.2a,l 33.6c,l 26.5a,l
Switzerland 36.1 57.0 .. .. .. 52.2 ..
Turkey 73.2 56.6 53.7 51.2 49.4 49.7 47.8
United Kingdom .. 60.6c 61.7c 62.3c 59.9 60.0c 59.3c,p
United States .. .. .. .. .. .. ..
EU28 (OECD estimates) .. 40.6b 41.3b 41.4b 40.4b 39.4b 38.6b
OECD-Total .. .. .. .. .. .. ..
Argentina 50.0 42.7 42.8 44.5 45.2 45.2 44.9
China 21.3a,t 16.4t 19.5a 19.8 18.9 18.7 18.4
Romania 12.4 35.3 37.9 41.7 40.8a 36.6 ..
Russian Federation 14.3 17.0 17.6 19.1 20.1 19.7 20.2
Singapore 40.6 34.3 40.7 43.0 42.9 44.2 ..
South Africa .. 51.3 53.6 59.1 63.8 64.3 ..
Chinese Taipei 20.1d 25.2 25.8 24.7 23.9 23.4 22.6
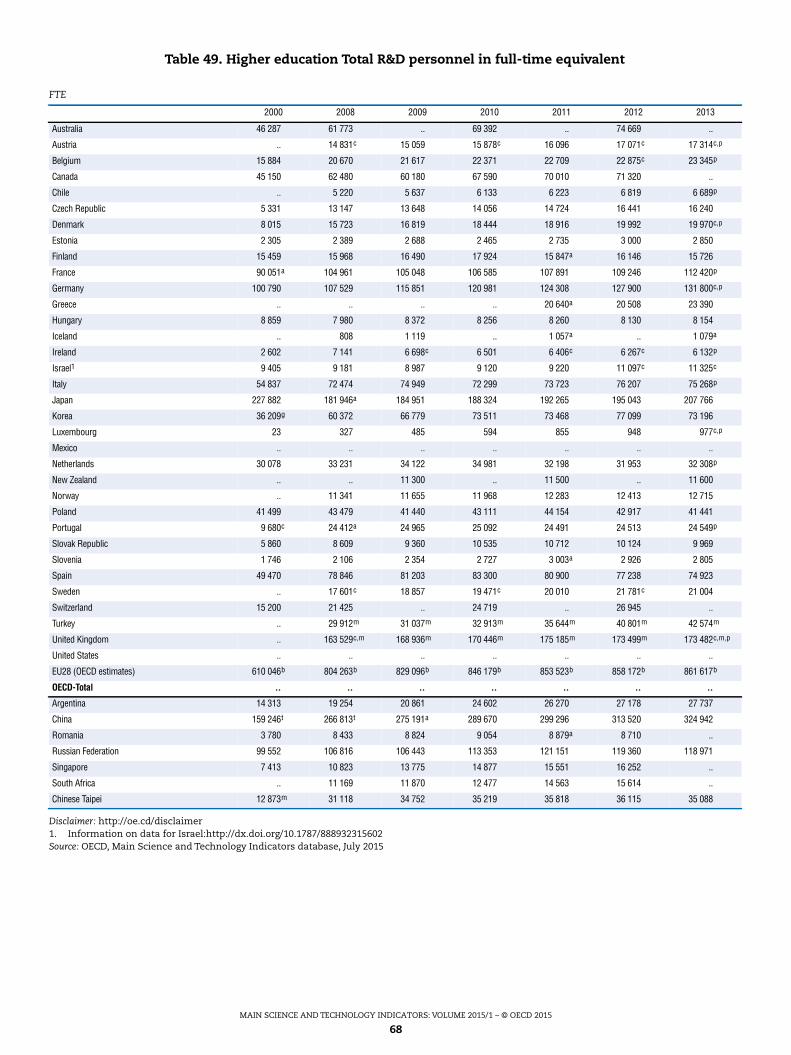
MAIN SCIENCE AND TECHNOLOGY INDICATORS: VOLUME 2015/1 – © OECD 2015
68
Disclaimer: http://oe.cd/disclaimer1. Information on data for Israel:http://dx.doi.org/10.1787/888932315602Source: OECD, Main Science and Technology Indicators database, July 2015
Table 49. Higher education Total R&D personnel in full-time equivalent
FTE
2000 2008 2009 2010 2011 2012 2013
Australia 46 287 61 773 .. 69 392 .. 74 669 ..
Austria .. 14 831c 15 059 15 878c 16 096 17 071c 17 314c,p
Belgium 15 884 20 670 21 617 22 371 22 709 22 875c 23 345p
Canada 45 150 62 480 60 180 67 590 70 010 71 320 ..
Chile .. 5 220 5 637 6 133 6 223 6 819 6 689p
Czech Republic 5 331 13 147 13 648 14 056 14 724 16 441 16 240
Denmark 8 015 15 723 16 819 18 444 18 916 19 992 19 970c,p
Estonia 2 305 2 389 2 688 2 465 2 735 3 000 2 850
Finland 15 459 15 968 16 490 17 924 15 847a 16 146 15 726
France 90 051a 104 961 105 048 106 585 107 891 109 246 112 420p
Germany 100 790 107 529 115 851 120 981 124 308 127 900 131 800c,p
Greece .. .. .. .. 20 640a 20 508 23 390
Hungary 8 859 7 980 8 372 8 256 8 260 8 130 8 154
Iceland .. 808 1 119 .. 1 057a .. 1 079a
Ireland 2 602 7 141 6 698c 6 501 6 406c 6 267c 6 132p
Israel1 9 405 9 181 8 987 9 120 9 220 11 097c 11 325c
Italy 54 837 72 474 74 949 72 299 73 723 76 207 75 268p
Japan 227 882 181 946a 184 951 188 324 192 265 195 043 207 766
Korea 36 209g 60 372 66 779 73 511 73 468 77 099 73 196
Luxembourg 23 327 485 594 855 948 977c,p
Mexico .. .. .. .. .. .. ..
Netherlands 30 078 33 231 34 122 34 981 32 198 31 953 32 308p
New Zealand .. .. 11 300 .. 11 500 .. 11 600
Norway .. 11 341 11 655 11 968 12 283 12 413 12 715
Poland 41 499 43 479 41 440 43 111 44 154 42 917 41 441
Portugal 9 680c 24 412a 24 965 25 092 24 491 24 513 24 549p
Slovak Republic 5 860 8 609 9 360 10 535 10 712 10 124 9 969
Slovenia 1 746 2 106 2 354 2 727 3 003a 2 926 2 805
Spain 49 470 78 846 81 203 83 300 80 900 77 238 74 923
Sweden .. 17 601c 18 857 19 471c 20 010 21 781c 21 004
Switzerland 15 200 21 425 .. 24 719 .. 26 945 ..
Turkey .. 29 912m 31 037m 32 913m 35 644m 40 801m 42 574m
United Kingdom .. 163 529c,m 168 936m 170 446m 175 185m 173 499m 173 482c,m,p
United States .. .. .. .. .. .. ..
EU28 (OECD estimates) 610 046b 804 263b 829 096b 846 179b 853 523b 858 172b 861 617b
OECD-Total .. .. .. .. .. .. ..
Argentina 14 313 19 254 20 861 24 602 26 270 27 178 27 737
China 159 246t 266 813t 275 191a 289 670 299 296 313 520 324 942
Romania 3 780 8 433 8 824 9 054 8 879a 8 710 ..
Russian Federation 99 552 106 816 106 443 113 353 121 151 119 360 118 971
Singapore 7 413 10 823 13 775 14 877 15 551 16 252 ..
South Africa .. 11 169 11 870 12 477 14 563 15 614 ..
Chinese Taipei 12 873m 31 118 34 752 35 219 35 818 36 115 35 088
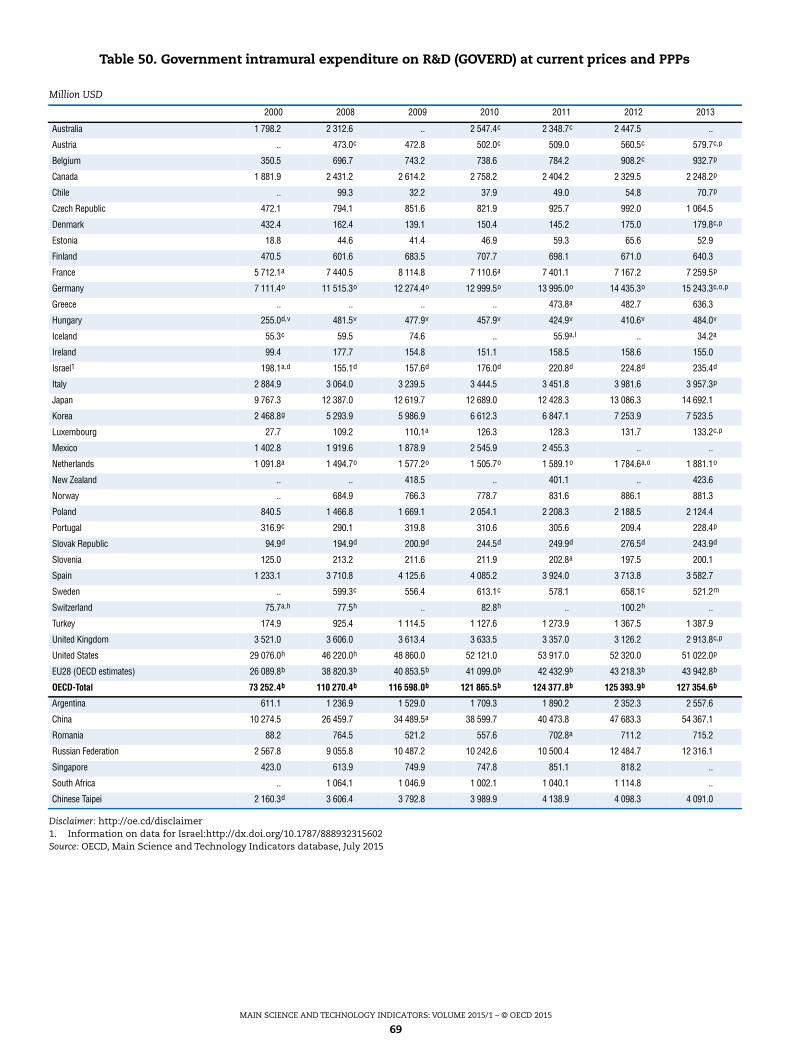
MAIN SCIENCE AND TECHNOLOGY INDICATORS: VOLUME 2015/1 – © OECD 2015
69
Disclaimer: http://oe.cd/disclaimer1. Information on data for Israel:http://dx.doi.org/10.1787/888932315602Source: OECD, Main Science and Technology Indicators database, July 2015
Table 50. Government intramural expenditure on R&D (GOVERD) at current prices and PPPs
Million USD
2000 2008 2009 2010 2011 2012 2013
Australia 1 798.2 2 312.6 .. 2 547.4c 2 348.7c 2 447.5 ..
Austria .. 473.0c 472.8 502.0c 509.0 560.5c 579.7c,p
Belgium 350.5 696.7 743.2 738.6 784.2 908.2c 932.7p
Canada 1 881.9 2 431.2 2 614.2 2 758.2 2 404.2 2 329.5 2 248.2p
Chile .. 99.3 32.2 37.9 49.0 54.8 70.7p
Czech Republic 472.1 794.1 851.6 821.9 925.7 992.0 1 064.5
Denmark 432.4 162.4 139.1 150.4 145.2 175.0 179.8c,p
Estonia 18.8 44.6 41.4 46.9 59.3 65.6 52.9
Finland 470.5 601.6 683.5 707.7 698.1 671.0 640.3
France 5 712.1a 7 440.5 8 114.8 7 110.6a 7 401.1 7 167.2 7 259.5p
Germany 7 111.4o 11 515.3o 12 274.4o 12 999.5o 13 995.0o 14 435.3o 15 243.3c,o,p
Greece .. .. .. .. 473.8a 482.7 636.3
Hungary 255.0d,v 481.5v 477.9v 457.9v 424.9v 410.6v 484.0v
Iceland 55.3c 59.5 74.6 .. 55.9a,l .. 34.2a
Ireland 99.4 177.7 154.8 151.1 158.5 158.6 155.0
Israel1 198.1a,d 155.1d 157.6d 176.0d 220.8d 224.8d 235.4d
Italy 2 884.9 3 064.0 3 239.5 3 444.5 3 451.8 3 981.6 3 957.3p
Japan 9 767.3 12 387.0 12 619.7 12 689.0 12 428.3 13 086.3 14 692.1
Korea 2 468.8g 5 293.9 5 986.9 6 612.3 6 847.1 7 253.9 7 523.5
Luxembourg 27.7 109.2 110.1a 126.3 128.3 131.7 133.2c,p
Mexico 1 402.8 1 919.6 1 878.9 2 545.9 2 455.3 .. ..
Netherlands 1 091.8a 1 494.7o 1 577.2o 1 505.7o 1 589.1o 1 784.6a,o 1 881.1o
New Zealand .. .. 418.5 .. 401.1 .. 423.6
Norway .. 684.9 766.3 778.7 831.6 886.1 881.3
Poland 840.5 1 466.8 1 669.1 2 054.1 2 208.3 2 188.5 2 124.4
Portugal 316.9c 290.1 319.8 310.6 305.6 209.4 228.4p
Slovak Republic 94.9d 194.9d 200.9d 244.5d 249.9d 276.5d 243.9d
Slovenia 125.0 213.2 211.6 211.9 202.8a 197.5 200.1
Spain 1 233.1 3 710.8 4 125.6 4 085.2 3 924.0 3 713.8 3 582.7
Sweden .. 599.3c 556.4 613.1c 578.1 658.1c 521.2m
Switzerland 75.7a,h 77.5h .. 82.8h .. 100.2h ..
Turkey 174.9 925.4 1 114.5 1 127.6 1 273.9 1 367.5 1 387.9
United Kingdom 3 521.0 3 606.0 3 613.4 3 633.5 3 357.0 3 126.2 2 913.8c,p
United States 29 076.0h 46 220.0h 48 860.0 52 121.0 53 917.0 52 320.0 51 022.0p
EU28 (OECD estimates) 26 089.8b 38 820.3b 40 853.5b 41 099.0b 42 432.9b 43 218.3b 43 942.8b
OECD-Total 73 252.4b 110 270.4b 116 598.0b 121 865.5b 124 377.8b 125 393.9b 127 354.6b
Argentina 611.1 1 236.9 1 529.0 1 709.3 1 890.2 2 352.3 2 557.6
China 10 274.5 26 459.7 34 489.5a 38 599.7 40 473.8 47 683.3 54 367.1
Romania 88.2 764.5 521.2 557.6 702.8a 711.2 715.2
Russian Federation 2 567.8 9 055.8 10 487.2 10 242.6 10 500.4 12 484.7 12 316.1
Singapore 423.0 613.9 749.9 747.8 851.1 818.2 ..
South Africa .. 1 064.1 1 046.9 1 002.1 1 040.1 1 114.8 ..
Chinese Taipei 2 160.3d 3 606.4 3 792.8 3 989.9 4 138.9 4 098.3 4 091.0
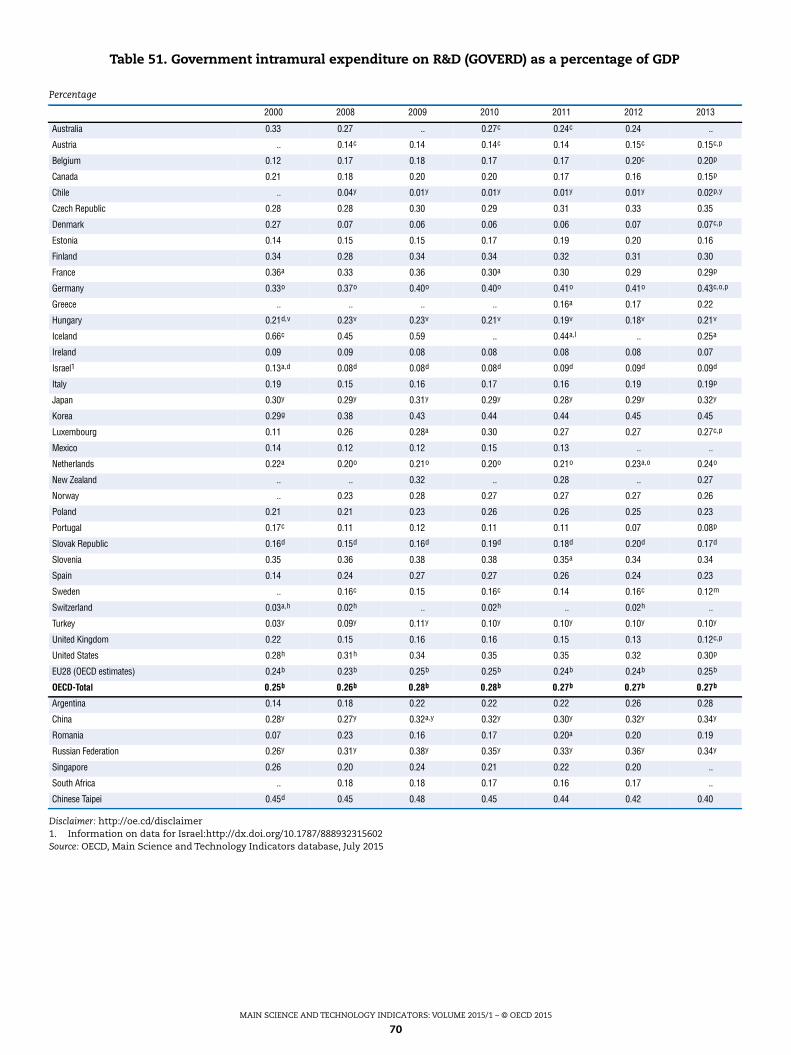
MAIN SCIENCE AND TECHNOLOGY INDICATORS: VOLUME 2015/1 – © OECD 2015
70
Disclaimer: http://oe.cd/disclaimer1. Information on data for Israel:http://dx.doi.org/10.1787/888932315602Source: OECD, Main Science and Technology Indicators database, July 2015
Table 51. Government intramural expenditure on R&D (GOVERD) as a percentage of GDP
Percentage
2000 2008 2009 2010 2011 2012 2013
Australia 0.33 0.27 .. 0.27c 0.24c 0.24 ..
Austria .. 0.14c 0.14 0.14c 0.14 0.15c 0.15c,p
Belgium 0.12 0.17 0.18 0.17 0.17 0.20c 0.20p
Canada 0.21 0.18 0.20 0.20 0.17 0.16 0.15p
Chile .. 0.04y 0.01y 0.01y 0.01y 0.01y 0.02p,y
Czech Republic 0.28 0.28 0.30 0.29 0.31 0.33 0.35
Denmark 0.27 0.07 0.06 0.06 0.06 0.07 0.07c,p
Estonia 0.14 0.15 0.15 0.17 0.19 0.20 0.16
Finland 0.34 0.28 0.34 0.34 0.32 0.31 0.30
France 0.36a 0.33 0.36 0.30a 0.30 0.29 0.29p
Germany 0.33o 0.37o 0.40o 0.40o 0.41o 0.41o 0.43c,o,p
Greece .. .. .. .. 0.16a 0.17 0.22
Hungary 0.21d,v 0.23v 0.23v 0.21v 0.19v 0.18v 0.21v
Iceland 0.66c 0.45 0.59 .. 0.44a,l .. 0.25a
Ireland 0.09 0.09 0.08 0.08 0.08 0.08 0.07
Israel1 0.13a,d 0.08d 0.08d 0.08d 0.09d 0.09d 0.09d
Italy 0.19 0.15 0.16 0.17 0.16 0.19 0.19p
Japan 0.30y 0.29y 0.31y 0.29y 0.28y 0.29y 0.32y
Korea 0.29g 0.38 0.43 0.44 0.44 0.45 0.45
Luxembourg 0.11 0.26 0.28a 0.30 0.27 0.27 0.27c,p
Mexico 0.14 0.12 0.12 0.15 0.13 .. ..
Netherlands 0.22a 0.20o 0.21o 0.20o 0.21o 0.23a,o 0.24o
New Zealand .. .. 0.32 .. 0.28 .. 0.27
Norway .. 0.23 0.28 0.27 0.27 0.27 0.26
Poland 0.21 0.21 0.23 0.26 0.26 0.25 0.23
Portugal 0.17c 0.11 0.12 0.11 0.11 0.07 0.08p
Slovak Republic 0.16d 0.15d 0.16d 0.19d 0.18d 0.20d 0.17d
Slovenia 0.35 0.36 0.38 0.38 0.35a 0.34 0.34
Spain 0.14 0.24 0.27 0.27 0.26 0.24 0.23
Sweden .. 0.16c 0.15 0.16c 0.14 0.16c 0.12m
Switzerland 0.03a,h 0.02h .. 0.02h .. 0.02h ..
Turkey 0.03y 0.09y 0.11y 0.10y 0.10y 0.10y 0.10y
United Kingdom 0.22 0.15 0.16 0.16 0.15 0.13 0.12c,p
United States 0.28h 0.31h 0.34 0.35 0.35 0.32 0.30p
EU28 (OECD estimates) 0.24b 0.23b 0.25b 0.25b 0.24b 0.24b 0.25b
OECD-Total 0.25b 0.26b 0.28b 0.28b 0.27b 0.27b 0.27b
Argentina 0.14 0.18 0.22 0.22 0.22 0.26 0.28
China 0.28y 0.27y 0.32a,y 0.32y 0.30y 0.32y 0.34y
Romania 0.07 0.23 0.16 0.17 0.20a 0.20 0.19
Russian Federation 0.26y 0.31y 0.38y 0.35y 0.33y 0.36y 0.34y
Singapore 0.26 0.20 0.24 0.21 0.22 0.20 ..
South Africa .. 0.18 0.18 0.17 0.16 0.17 ..
Chinese Taipei 0.45d 0.45 0.48 0.45 0.44 0.42 0.40
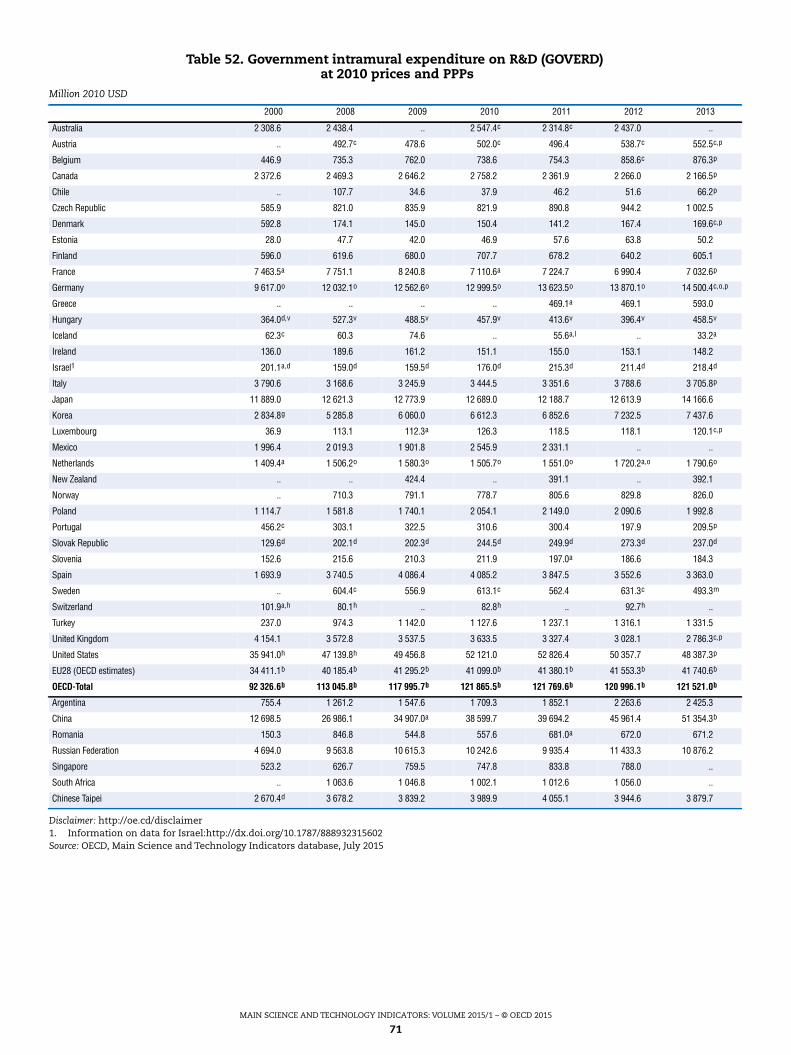
MAIN SCIENCE AND TECHNOLOGY INDICATORS: VOLUME 2015/1 – © OECD 2015
71
Disclaimer: http://oe.cd/disclaimer1. Information on data for Israel:http://dx.doi.org/10.1787/888932315602Source: OECD, Main Science and Technology Indicators database, July 2015
Table 52. Government intramural expenditure on R&D (GOVERD)at 2010 prices and PPPs
Million 2010 USD
2000 2008 2009 2010 2011 2012 2013
Australia 2 308.6 2 438.4 .. 2 547.4c 2 314.8c 2 437.0 ..
Austria .. 492.7c 478.6 502.0c 496.4 538.7c 552.5c,p
Belgium 446.9 735.3 762.0 738.6 754.3 858.6c 876.3p
Canada 2 372.6 2 469.3 2 646.2 2 758.2 2 361.9 2 266.0 2 166.5p
Chile .. 107.7 34.6 37.9 46.2 51.6 66.2p
Czech Republic 585.9 821.0 835.9 821.9 890.8 944.2 1 002.5
Denmark 592.8 174.1 145.0 150.4 141.2 167.4 169.6c,p
Estonia 28.0 47.7 42.0 46.9 57.6 63.8 50.2
Finland 596.0 619.6 680.0 707.7 678.2 640.2 605.1
France 7 463.5a 7 751.1 8 240.8 7 110.6a 7 224.7 6 990.4 7 032.6p
Germany 9 617.0o 12 032.1o 12 562.6o 12 999.5o 13 623.5o 13 870.1o 14 500.4c,o,p
Greece .. .. .. .. 469.1a 469.1 593.0
Hungary 364.0d,v 527.3v 488.5v 457.9v 413.6v 396.4v 458.5v
Iceland 62.3c 60.3 74.6 .. 55.6a,l .. 33.2a
Ireland 136.0 189.6 161.2 151.1 155.0 153.1 148.2
Israel1 201.1a,d 159.0d 159.5d 176.0d 215.3d 211.4d 218.4d
Italy 3 790.6 3 168.6 3 245.9 3 444.5 3 351.6 3 788.6 3 705.8p
Japan 11 889.0 12 621.3 12 773.9 12 689.0 12 188.7 12 613.9 14 166.6
Korea 2 834.8g 5 285.8 6 060.0 6 612.3 6 852.6 7 232.5 7 437.6
Luxembourg 36.9 113.1 112.3a 126.3 118.5 118.1 120.1c,p
Mexico 1 996.4 2 019.3 1 901.8 2 545.9 2 331.1 .. ..
Netherlands 1 409.4a 1 506.2o 1 580.3o 1 505.7o 1 551.0o 1 720.2a,o 1 790.6o
New Zealand .. .. 424.4 .. 391.1 .. 392.1
Norway .. 710.3 791.1 778.7 805.6 829.8 826.0
Poland 1 114.7 1 581.8 1 740.1 2 054.1 2 149.0 2 090.6 1 992.8
Portugal 456.2c 303.1 322.5 310.6 300.4 197.9 209.5p
Slovak Republic 129.6d 202.1d 202.3d 244.5d 249.9d 273.3d 237.0d
Slovenia 152.6 215.6 210.3 211.9 197.0a 186.6 184.3
Spain 1 693.9 3 740.5 4 086.4 4 085.2 3 847.5 3 552.6 3 363.0
Sweden .. 604.4c 556.9 613.1c 562.4 631.3c 493.3m
Switzerland 101.9a,h 80.1h .. 82.8h .. 92.7h ..
Turkey 237.0 974.3 1 142.0 1 127.6 1 237.1 1 316.1 1 331.5
United Kingdom 4 154.1 3 572.8 3 537.5 3 633.5 3 327.4 3 028.1 2 786.3c,p
United States 35 941.0h 47 139.8h 49 456.8 52 121.0 52 826.4 50 357.7 48 387.3p
EU28 (OECD estimates) 34 411.1b 40 185.4b 41 295.2b 41 099.0b 41 380.1b 41 553.3b 41 740.6b
OECD-Total 92 326.6b 113 045.8b 117 995.7b 121 865.5b 121 769.6b 120 996.1b 121 521.0b
Argentina 755.4 1 261.2 1 547.6 1 709.3 1 852.1 2 263.6 2 425.3
China 12 698.5 26 986.1 34 907.0a 38 599.7 39 694.2 45 961.4 51 354.3b
Romania 150.3 846.8 544.8 557.6 681.0a 672.0 671.2
Russian Federation 4 694.0 9 563.8 10 615.3 10 242.6 9 935.4 11 433.3 10 876.2
Singapore 523.2 626.7 759.5 747.8 833.8 788.0 ..
South Africa .. 1 063.6 1 046.8 1 002.1 1 012.6 1 056.0 ..
Chinese Taipei 2 670.4d 3 678.2 3 839.2 3 989.9 4 055.1 3 944.6 3 879.7
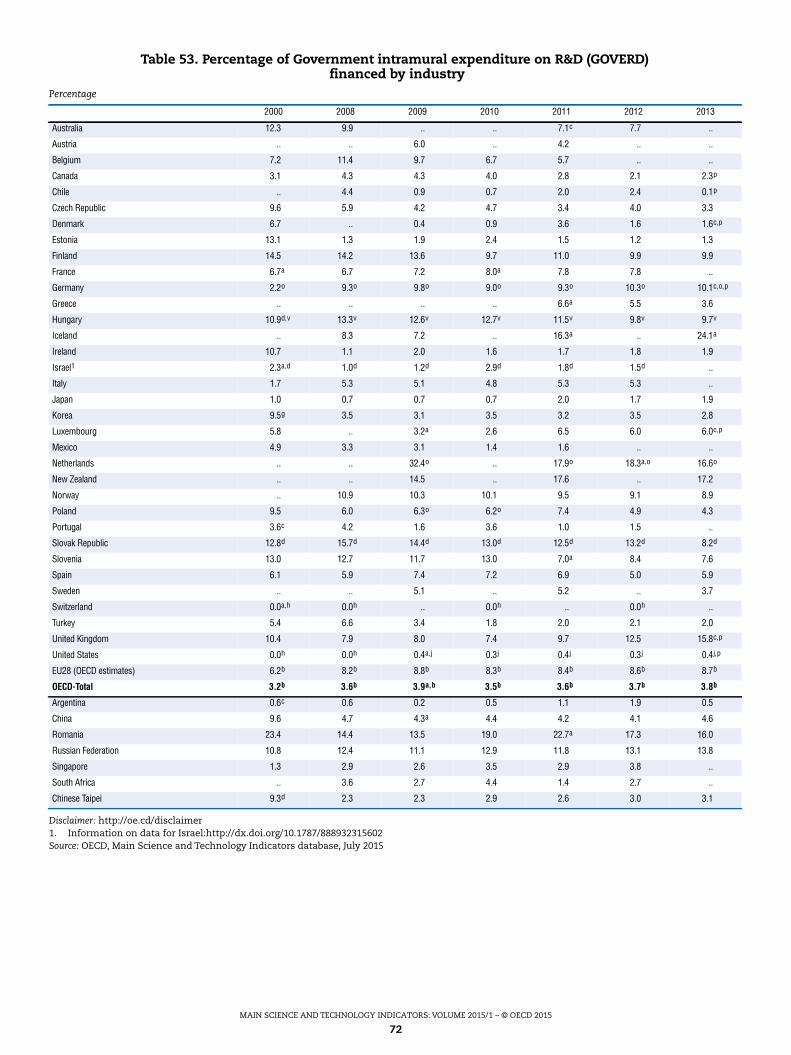
MAIN SCIENCE AND TECHNOLOGY INDICATORS: VOLUME 2015/1 – © OECD 2015
72
Disclaimer: http://oe.cd/disclaimer1. Information on data for Israel:http://dx.doi.org/10.1787/888932315602Source: OECD, Main Science and Technology Indicators database, July 2015
Table 53. Percentage of Government intramural expenditure on R&D (GOVERD)financed by industry
Percentage
2000 2008 2009 2010 2011 2012 2013
Australia 12.3 9.9 .. .. 7.1c 7.7 ..
Austria .. .. 6.0 .. 4.2 .. ..
Belgium 7.2 11.4 9.7 6.7 5.7 .. ..
Canada 3.1 4.3 4.3 4.0 2.8 2.1 2.3p
Chile .. 4.4 0.9 0.7 2.0 2.4 0.1p
Czech Republic 9.6 5.9 4.2 4.7 3.4 4.0 3.3
Denmark 6.7 .. 0.4 0.9 3.6 1.6 1.6c,p
Estonia 13.1 1.3 1.9 2.4 1.5 1.2 1.3
Finland 14.5 14.2 13.6 9.7 11.0 9.9 9.9
France 6.7a 6.7 7.2 8.0a 7.8 7.8 ..
Germany 2.2o 9.3o 9.8o 9.0o 9.3o 10.3o 10.1c,o,p
Greece .. .. .. .. 6.6a 5.5 3.6
Hungary 10.9d,v 13.3v 12.6v 12.7v 11.5v 9.8v 9.7v
Iceland .. 8.3 7.2 .. 16.3a .. 24.1a
Ireland 10.7 1.1 2.0 1.6 1.7 1.8 1.9
Israel1 2.3a,d 1.0d 1.2d 2.9d 1.8d 1.5d ..
Italy 1.7 5.3 5.1 4.8 5.3 5.3 ..
Japan 1.0 0.7 0.7 0.7 2.0 1.7 1.9
Korea 9.5g 3.5 3.1 3.5 3.2 3.5 2.8
Luxembourg 5.8 .. 3.2a 2.6 6.5 6.0 6.0c,p
Mexico 4.9 3.3 3.1 1.4 1.6 .. ..
Netherlands .. .. 32.4o .. 17.9o 18.3a,o 16.6o
New Zealand .. .. 14.5 .. 17.6 .. 17.2
Norway .. 10.9 10.3 10.1 9.5 9.1 8.9
Poland 9.5 6.0 6.3o 6.2o 7.4 4.9 4.3
Portugal 3.6c 4.2 1.6 3.6 1.0 1.5 ..
Slovak Republic 12.8d 15.7d 14.4d 13.0d 12.5d 13.2d 8.2d
Slovenia 13.0 12.7 11.7 13.0 7.0a 8.4 7.6
Spain 6.1 5.9 7.4 7.2 6.9 5.0 5.9
Sweden .. .. 5.1 .. 5.2 .. 3.7
Switzerland 0.0a,h 0.0h .. 0.0h .. 0.0h ..
Turkey 5.4 6.6 3.4 1.8 2.0 2.1 2.0
United Kingdom 10.4 7.9 8.0 7.4 9.7 12.5 15.8c,p
United States 0.0h 0.0h 0.4a,j 0.3j 0.4j 0.3j 0.4j,p
EU28 (OECD estimates) 6.2b 8.2b 8.8b 8.3b 8.4b 8.6b 8.7b
OECD-Total 3.2b 3.6b 3.9a,b 3.5b 3.6b 3.7b 3.8b
Argentina 0.6c 0.6 0.2 0.5 1.1 1.9 0.5
China 9.6 4.7 4.3a 4.4 4.2 4.1 4.6
Romania 23.4 14.4 13.5 19.0 22.7a 17.3 16.0
Russian Federation 10.8 12.4 11.1 12.9 11.8 13.1 13.8
Singapore 1.3 2.9 2.6 3.5 2.9 3.8 ..
South Africa .. 3.6 2.7 4.4 1.4 2.7 ..
Chinese Taipei 9.3d 2.3 2.3 2.9 2.6 3.0 3.1
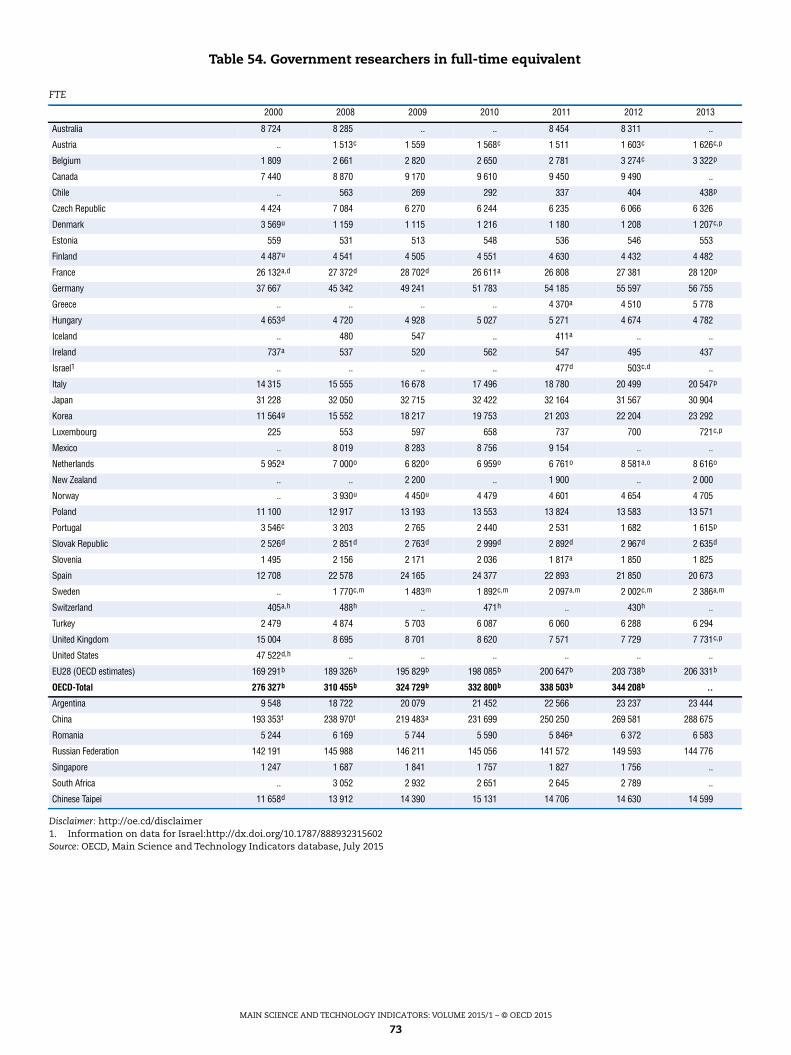
MAIN SCIENCE AND TECHNOLOGY INDICATORS: VOLUME 2015/1 – © OECD 2015
73
Disclaimer: http://oe.cd/disclaimer1. Information on data for Israel:http://dx.doi.org/10.1787/888932315602Source: OECD, Main Science and Technology Indicators database, July 2015
Table 54. Government researchers in full-time equivalent
FTE
2000 2008 2009 2010 2011 2012 2013
Australia 8 724 8 285 .. .. 8 454 8 311 ..
Austria .. 1 513c 1 559 1 568c 1 511 1 603c 1 626c,p
Belgium 1 809 2 661 2 820 2 650 2 781 3 274c 3 322p
Canada 7 440 8 870 9 170 9 610 9 450 9 490 ..
Chile .. 563 269 292 337 404 438p
Czech Republic 4 424 7 084 6 270 6 244 6 235 6 066 6 326
Denmark 3 569u 1 159 1 115 1 216 1 180 1 208 1 207c,p
Estonia 559 531 513 548 536 546 553
Finland 4 487u 4 541 4 505 4 551 4 630 4 432 4 482
France 26 132a,d 27 372d 28 702d 26 611a 26 808 27 381 28 120p
Germany 37 667 45 342 49 241 51 783 54 185 55 597 56 755
Greece .. .. .. .. 4 370a 4 510 5 778
Hungary 4 653d 4 720 4 928 5 027 5 271 4 674 4 782
Iceland .. 480 547 .. 411a .. ..
Ireland 737a 537 520 562 547 495 437
Israel1 .. .. .. .. 477d 503c,d ..
Italy 14 315 15 555 16 678 17 496 18 780 20 499 20 547p
Japan 31 228 32 050 32 715 32 422 32 164 31 567 30 904
Korea 11 564g 15 552 18 217 19 753 21 203 22 204 23 292
Luxembourg 225 553 597 658 737 700 721c,p
Mexico .. 8 019 8 283 8 756 9 154 .. ..
Netherlands 5 952a 7 000o 6 820o 6 959o 6 761o 8 581a,o 8 616o
New Zealand .. .. 2 200 .. 1 900 .. 2 000
Norway .. 3 930u 4 450u 4 479 4 601 4 654 4 705
Poland 11 100 12 917 13 193 13 553 13 824 13 583 13 571
Portugal 3 546c 3 203 2 765 2 440 2 531 1 682 1 615p
Slovak Republic 2 526d 2 851d 2 763d 2 999d 2 892d 2 967d 2 635d
Slovenia 1 495 2 156 2 171 2 036 1 817a 1 850 1 825
Spain 12 708 22 578 24 165 24 377 22 893 21 850 20 673
Sweden .. 1 770c,m 1 483m 1 892c,m 2 097a,m 2 002c,m 2 386a,m
Switzerland 405a,h 488h .. 471h .. 430h ..
Turkey 2 479 4 874 5 703 6 087 6 060 6 288 6 294
United Kingdom 15 004 8 695 8 701 8 620 7 571 7 729 7 731c,p
United States 47 522d,h .. .. .. .. .. ..
EU28 (OECD estimates) 169 291b 189 326b 195 829b 198 085b 200 647b 203 738b 206 331b
OECD-Total 276 327b 310 455b 324 729b 332 800b 338 503b 344 208b ..
Argentina 9 548 18 722 20 079 21 452 22 566 23 237 23 444
China 193 353t 238 970t 219 483a 231 699 250 250 269 581 288 675
Romania 5 244 6 169 5 744 5 590 5 846a 6 372 6 583
Russian Federation 142 191 145 988 146 211 145 056 141 572 149 593 144 776
Singapore 1 247 1 687 1 841 1 757 1 827 1 756 ..
South Africa .. 3 052 2 932 2 651 2 645 2 789 ..
Chinese Taipei 11 658d 13 912 14 390 15 131 14 706 14 630 14 599
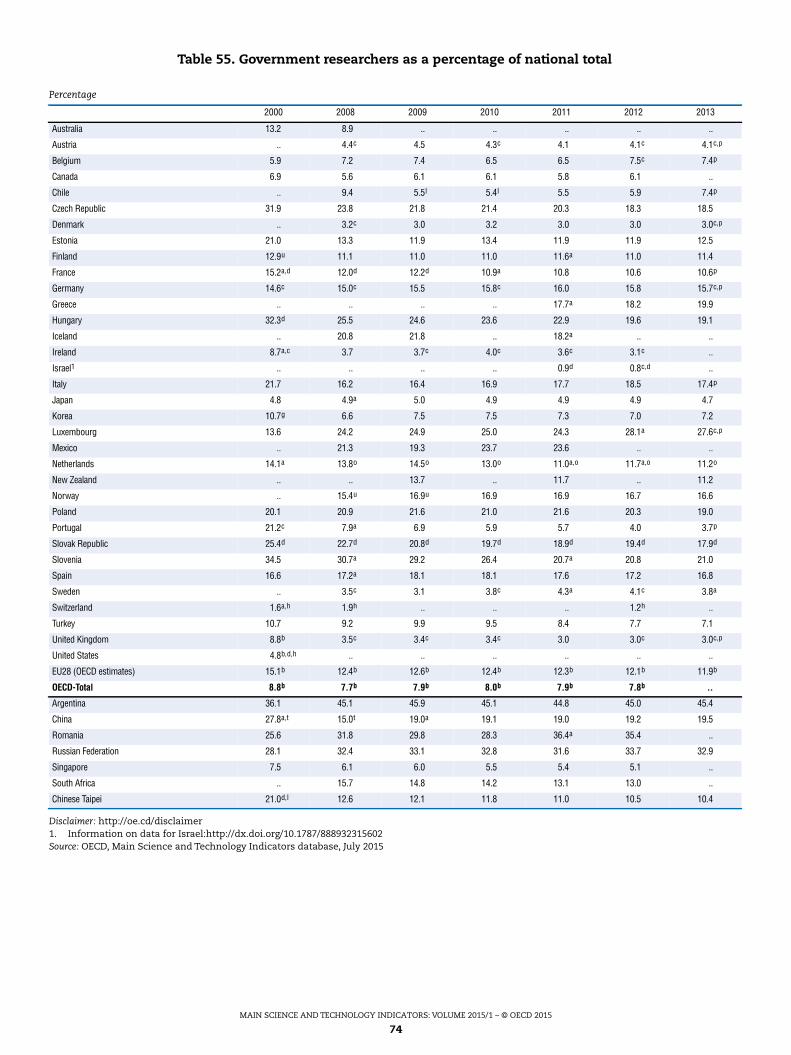
MAIN SCIENCE AND TECHNOLOGY INDICATORS: VOLUME 2015/1 – © OECD 2015
74
Disclaimer: http://oe.cd/disclaimer1. Information on data for Israel:http://dx.doi.org/10.1787/888932315602Source: OECD, Main Science and Technology Indicators database, July 2015
Table 55. Government researchers as a percentage of national total
Percentage
2000 2008 2009 2010 2011 2012 2013
Australia 13.2 8.9 .. .. .. .. ..
Austria .. 4.4c 4.5 4.3c 4.1 4.1c 4.1c,p
Belgium 5.9 7.2 7.4 6.5 6.5 7.5c 7.4p
Canada 6.9 5.6 6.1 6.1 5.8 6.1 ..
Chile .. 9.4 5.5l 5.4l 5.5 5.9 7.4p
Czech Republic 31.9 23.8 21.8 21.4 20.3 18.3 18.5
Denmark .. 3.2c 3.0 3.2 3.0 3.0 3.0c,p
Estonia 21.0 13.3 11.9 13.4 11.9 11.9 12.5
Finland 12.9u 11.1 11.0 11.0 11.6a 11.0 11.4
France 15.2a,d 12.0d 12.2d 10.9a 10.8 10.6 10.6p
Germany 14.6c 15.0c 15.5 15.8c 16.0 15.8 15.7c,p
Greece .. .. .. .. 17.7a 18.2 19.9
Hungary 32.3d 25.5 24.6 23.6 22.9 19.6 19.1
Iceland .. 20.8 21.8 .. 18.2a .. ..
Ireland 8.7a,c 3.7 3.7c 4.0c 3.6c 3.1c ..
Israel1 .. .. .. .. 0.9d 0.8c,d ..
Italy 21.7 16.2 16.4 16.9 17.7 18.5 17.4p
Japan 4.8 4.9a 5.0 4.9 4.9 4.9 4.7
Korea 10.7g 6.6 7.5 7.5 7.3 7.0 7.2
Luxembourg 13.6 24.2 24.9 25.0 24.3 28.1a 27.6c,p
Mexico .. 21.3 19.3 23.7 23.6 .. ..
Netherlands 14.1a 13.8o 14.5o 13.0o 11.0a,o 11.7a,o 11.2o
New Zealand .. .. 13.7 .. 11.7 .. 11.2
Norway .. 15.4u 16.9u 16.9 16.9 16.7 16.6
Poland 20.1 20.9 21.6 21.0 21.6 20.3 19.0
Portugal 21.2c 7.9a 6.9 5.9 5.7 4.0 3.7p
Slovak Republic 25.4d 22.7d 20.8d 19.7d 18.9d 19.4d 17.9d
Slovenia 34.5 30.7a 29.2 26.4 20.7a 20.8 21.0
Spain 16.6 17.2a 18.1 18.1 17.6 17.2 16.8
Sweden .. 3.5c 3.1 3.8c 4.3a 4.1c 3.8a
Switzerland 1.6a,h 1.9h .. .. .. 1.2h ..
Turkey 10.7 9.2 9.9 9.5 8.4 7.7 7.1
United Kingdom 8.8b 3.5c 3.4c 3.4c 3.0 3.0c 3.0c,p
United States 4.8b,d,h .. .. .. .. .. ..
EU28 (OECD estimates) 15.1b 12.4b 12.6b 12.4b 12.3b 12.1b 11.9b
OECD-Total 8.8b 7.7b 7.9b 8.0b 7.9b 7.8b ..
Argentina 36.1 45.1 45.9 45.1 44.8 45.0 45.4
China 27.8a,t 15.0t 19.0a 19.1 19.0 19.2 19.5
Romania 25.6 31.8 29.8 28.3 36.4a 35.4 ..
Russian Federation 28.1 32.4 33.1 32.8 31.6 33.7 32.9
Singapore 7.5 6.1 6.0 5.5 5.4 5.1 ..
South Africa .. 15.7 14.8 14.2 13.1 13.0 ..
Chinese Taipei 21.0d,l 12.6 12.1 11.8 11.0 10.5 10.4
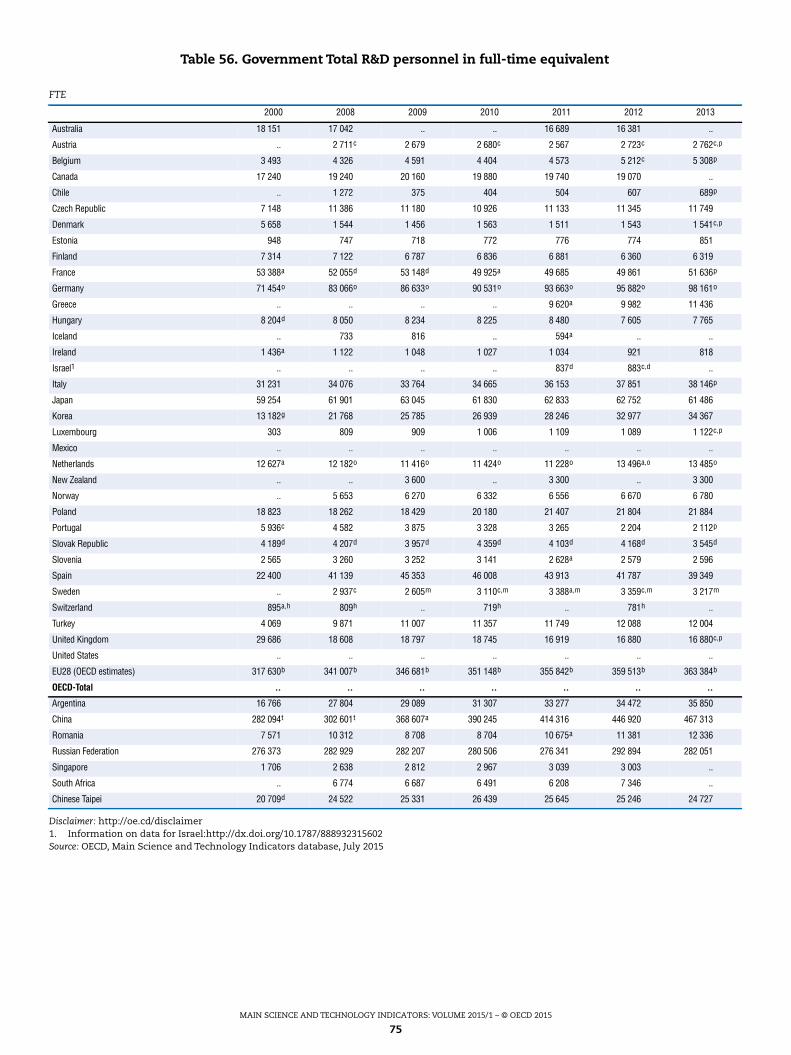
MAIN SCIENCE AND TECHNOLOGY INDICATORS: VOLUME 2015/1 – © OECD 2015
75
Disclaimer: http://oe.cd/disclaimer1. Information on data for Israel:http://dx.doi.org/10.1787/888932315602Source: OECD, Main Science and Technology Indicators database, July 2015
Table 56. Government Total R&D personnel in full-time equivalent
FTE
2000 2008 2009 2010 2011 2012 2013
Australia 18 151 17 042 .. .. 16 689 16 381 ..
Austria .. 2 711c 2 679 2 680c 2 567 2 723c 2 762c,p
Belgium 3 493 4 326 4 591 4 404 4 573 5 212c 5 308p
Canada 17 240 19 240 20 160 19 880 19 740 19 070 ..
Chile .. 1 272 375 404 504 607 689p
Czech Republic 7 148 11 386 11 180 10 926 11 133 11 345 11 749
Denmark 5 658 1 544 1 456 1 563 1 511 1 543 1 541c,p
Estonia 948 747 718 772 776 774 851
Finland 7 314 7 122 6 787 6 836 6 881 6 360 6 319
France 53 388a 52 055d 53 148d 49 925a 49 685 49 861 51 636p
Germany 71 454o 83 066o 86 633o 90 531o 93 663o 95 882o 98 161o
Greece .. .. .. .. 9 620a 9 982 11 436
Hungary 8 204d 8 050 8 234 8 225 8 480 7 605 7 765
Iceland .. 733 816 .. 594a .. ..
Ireland 1 436a 1 122 1 048 1 027 1 034 921 818
Israel1 .. .. .. .. 837d 883c,d ..
Italy 31 231 34 076 33 764 34 665 36 153 37 851 38 146p
Japan 59 254 61 901 63 045 61 830 62 833 62 752 61 486
Korea 13 182g 21 768 25 785 26 939 28 246 32 977 34 367
Luxembourg 303 809 909 1 006 1 109 1 089 1 122c,p
Mexico .. .. .. .. .. .. ..
Netherlands 12 627a 12 182o 11 416o 11 424o 11 228o 13 496a,o 13 485o
New Zealand .. .. 3 600 .. 3 300 .. 3 300
Norway .. 5 653 6 270 6 332 6 556 6 670 6 780
Poland 18 823 18 262 18 429 20 180 21 407 21 804 21 884
Portugal 5 936c 4 582 3 875 3 328 3 265 2 204 2 112p
Slovak Republic 4 189d 4 207d 3 957d 4 359d 4 103d 4 168d 3 545d
Slovenia 2 565 3 260 3 252 3 141 2 628a 2 579 2 596
Spain 22 400 41 139 45 353 46 008 43 913 41 787 39 349
Sweden .. 2 937c 2 605m 3 110c,m 3 388a,m 3 359c,m 3 217m
Switzerland 895a,h 809h .. 719h .. 781h ..
Turkey 4 069 9 871 11 007 11 357 11 749 12 088 12 004
United Kingdom 29 686 18 608 18 797 18 745 16 919 16 880 16 880c,p
United States .. .. .. .. .. .. ..
EU28 (OECD estimates) 317 630b 341 007b 346 681b 351 148b 355 842b 359 513b 363 384b
OECD-Total .. .. .. .. .. .. ..
Argentina 16 766 27 804 29 089 31 307 33 277 34 472 35 850
China 282 094t 302 601t 368 607a 390 245 414 316 446 920 467 313
Romania 7 571 10 312 8 708 8 704 10 675a 11 381 12 336
Russian Federation 276 373 282 929 282 207 280 506 276 341 292 894 282 051
Singapore 1 706 2 638 2 812 2 967 3 039 3 003 ..
South Africa .. 6 774 6 687 6 491 6 208 7 346 ..
Chinese Taipei 20 709d 24 522 25 331 26 439 25 645 25 246 24 727
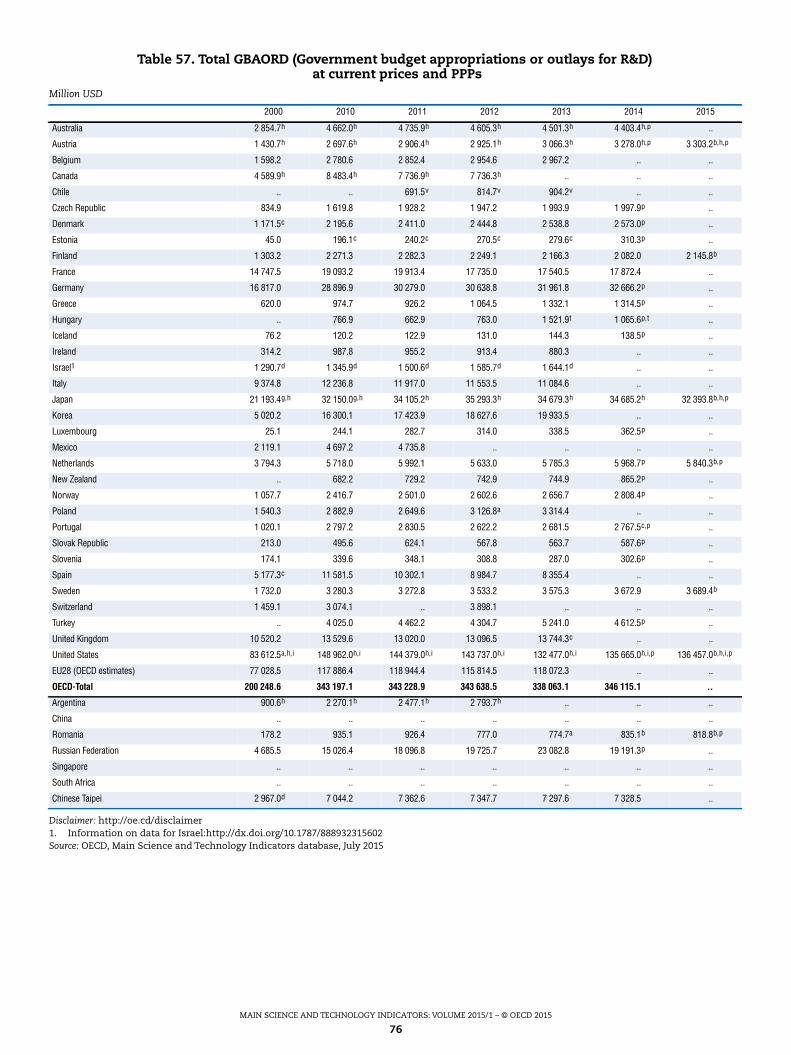
MAIN SCIENCE AND TECHNOLOGY INDICATORS: VOLUME 2015/1 – © OECD 2015
76
Disclaimer: http://oe.cd/disclaimer1. Information on data for Israel:http://dx.doi.org/10.1787/888932315602Source: OECD, Main Science and Technology Indicators database, July 2015
Table 57. Total GBAORD (Government budget appropriations or outlays for R&D)at current prices and PPPs
Million USD
2000 2010 2011 2012 2013 2014 2015
Australia 2 854.7h 4 662.0h 4 735.9h 4 605.3h 4 501.3h 4 403.4h,p ..
Austria 1 430.7h 2 697.6h 2 906.4h 2 925.1h 3 066.3h 3 278.0h,p 3 303.2b,h,p
Belgium 1 598.2 2 780.6 2 852.4 2 954.6 2 967.2 .. ..
Canada 4 589.9h 8 483.4h 7 736.9h 7 736.3h .. .. ..
Chile .. .. 691.5v 814.7v 904.2v .. ..
Czech Republic 834.9 1 619.8 1 928.2 1 947.2 1 993.9 1 997.9p ..
Denmark 1 171.5c 2 195.6 2 411.0 2 444.8 2 538.8 2 573.0p ..
Estonia 45.0 196.1c 240.2c 270.5c 279.6c 310.3p ..
Finland 1 303.2 2 271.3 2 282.3 2 249.1 2 166.3 2 082.0 2 145.8b
France 14 747.5 19 093.2 19 913.4 17 735.0 17 540.5 17 872.4 ..
Germany 16 817.0 28 896.9 30 279.0 30 638.8 31 961.8 32 666.2p ..
Greece 620.0 974.7 926.2 1 064.5 1 332.1 1 314.5p ..
Hungary .. 766.9 662.9 763.0 1 521.9t 1 065.6p,t ..
Iceland 76.2 120.2 122.9 131.0 144.3 138.5p ..
Ireland 314.2 987.8 955.2 913.4 880.3 .. ..
Israel1 1 290.7d 1 345.9d 1 500.6d 1 585.7d 1 644.1d .. ..
Italy 9 374.8 12 236.8 11 917.0 11 553.5 11 084.6 .. ..
Japan 21 193.4g,h 32 150.0g,h 34 105.2h 35 293.3h 34 679.3h 34 685.2h 32 393.8b,h,p
Korea 5 020.2 16 300.1 17 423.9 18 627.6 19 933.5 .. ..
Luxembourg 25.1 244.1 282.7 314.0 338.5 362.5p ..
Mexico 2 119.1 4 697.2 4 735.8 .. .. .. ..
Netherlands 3 794.3 5 718.0 5 992.1 5 633.0 5 785.3 5 968.7p 5 840.3b,p
New Zealand .. 682.2 729.2 742.9 744.9 865.2p ..
Norway 1 057.7 2 416.7 2 501.0 2 602.6 2 656.7 2 808.4p ..
Poland 1 540.3 2 882.9 2 649.6 3 126.8a 3 314.4 .. ..
Portugal 1 020.1 2 797.2 2 830.5 2 622.2 2 681.5 2 767.5c,p ..
Slovak Republic 213.0 495.6 624.1 567.8 563.7 587.6p ..
Slovenia 174.1 339.6 348.1 308.8 287.0 302.6p ..
Spain 5 177.3c 11 581.5 10 302.1 8 984.7 8 355.4 .. ..
Sweden 1 732.0 3 280.3 3 272.8 3 533.2 3 575.3 3 672.9 3 689.4b
Switzerland 1 459.1 3 074.1 .. 3 898.1 .. .. ..
Turkey .. 4 025.0 4 462.2 4 304.7 5 241.0 4 612.5p ..
United Kingdom 10 520.2 13 529.6 13 020.0 13 096.5 13 744.3c .. ..
United States 83 612.5a,h,i 148 962.0h,i 144 379.0h,i 143 737.0h,i 132 477.0h,i 135 665.0h,i,p 136 457.0b,h,i,p
EU28 (OECD estimates) 77 028.5 117 886.4 118 944.4 115 814.5 118 072.3 .. ..
OECD-Total 200 248.6 343 197.1 343 228.9 343 638.5 338 063.1 346 115.1 ..
Argentina 900.6h 2 270.1h 2 477.1h 2 793.7h .. .. ..
China .. .. .. .. .. .. ..
Romania 178.2 935.1 926.4 777.0 774.7a 835.1b 818.8b,p
Russian Federation 4 685.5 15 026.4 18 096.8 19 725.7 23 082.8 19 191.3p ..
Singapore .. .. .. .. .. .. ..
South Africa .. .. .. .. .. .. ..
Chinese Taipei 2 967.0d 7 044.2 7 362.6 7 347.7 7 297.6 7 328.5 ..
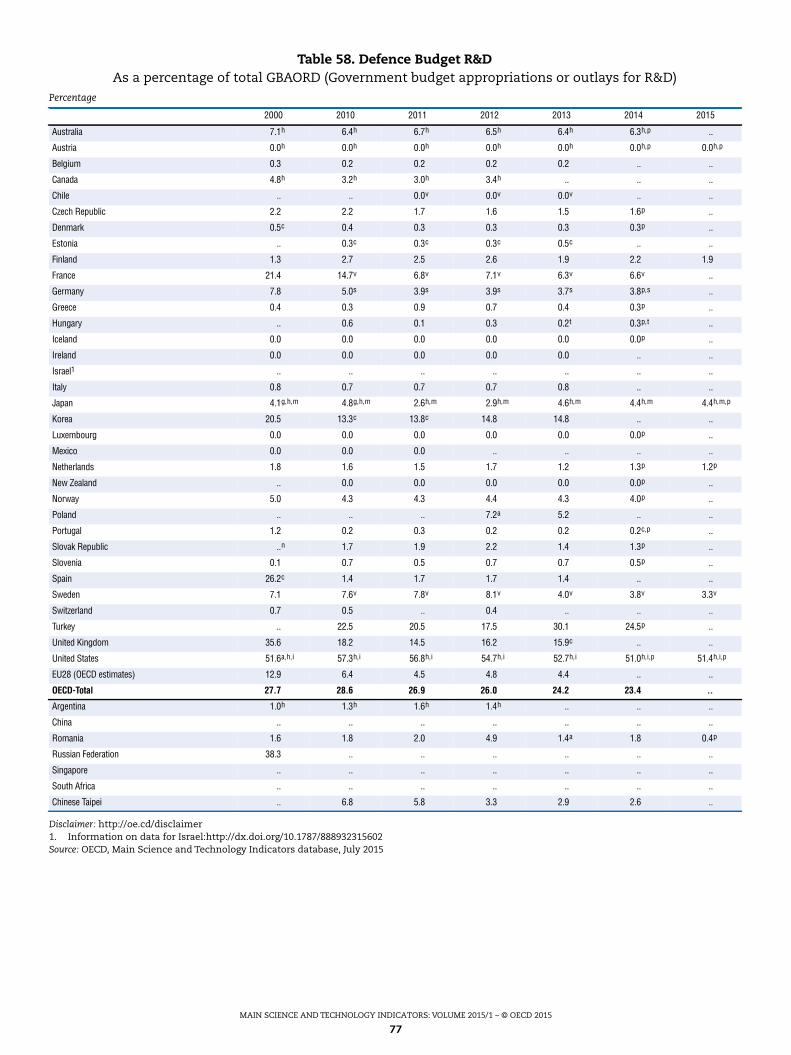
MAIN SCIENCE AND TECHNOLOGY INDICATORS: VOLUME 2015/1 – © OECD 2015
77
Disclaimer: http://oe.cd/disclaimer1. Information on data for Israel:http://dx.doi.org/10.1787/888932315602Source: OECD, Main Science and Technology Indicators database, July 2015
Table 58. Defence Budget R&DAs a percentage of total GBAORD (Government budget appropriations or outlays for R&D)
Percentage
2000 2010 2011 2012 2013 2014 2015
Australia 7.1h 6.4h 6.7h 6.5h 6.4h 6.3h,p ..
Austria 0.0h 0.0h 0.0h 0.0h 0.0h 0.0h,p 0.0h,p
Belgium 0.3 0.2 0.2 0.2 0.2 .. ..
Canada 4.8h 3.2h 3.0h 3.4h .. .. ..
Chile .. .. 0.0v 0.0v 0.0v .. ..
Czech Republic 2.2 2.2 1.7 1.6 1.5 1.6p ..
Denmark 0.5c 0.4 0.3 0.3 0.3 0.3p ..
Estonia .. 0.3c 0.3c 0.3c 0.5c .. ..
Finland 1.3 2.7 2.5 2.6 1.9 2.2 1.9
France 21.4 14.7v 6.8v 7.1v 6.3v 6.6v ..
Germany 7.8 5.0s 3.9s 3.9s 3.7s 3.8p,s ..
Greece 0.4 0.3 0.9 0.7 0.4 0.3p ..
Hungary .. 0.6 0.1 0.3 0.2t 0.3p,t ..
Iceland 0.0 0.0 0.0 0.0 0.0 0.0p ..
Ireland 0.0 0.0 0.0 0.0 0.0 .. ..
Israel1 .. .. .. .. .. .. ..
Italy 0.8 0.7 0.7 0.7 0.8 .. ..
Japan 4.1g,h,m 4.8g,h,m 2.6h,m 2.9h,m 4.6h,m 4.4h,m 4.4h,m,p
Korea 20.5 13.3c 13.8c 14.8 14.8 .. ..
Luxembourg 0.0 0.0 0.0 0.0 0.0 0.0p ..
Mexico 0.0 0.0 0.0 .. .. .. ..
Netherlands 1.8 1.6 1.5 1.7 1.2 1.3p 1.2p
New Zealand .. 0.0 0.0 0.0 0.0 0.0p ..
Norway 5.0 4.3 4.3 4.4 4.3 4.0p ..
Poland .. .. .. 7.2a 5.2 .. ..
Portugal 1.2 0.2 0.3 0.2 0.2 0.2c,p ..
Slovak Republic ..n 1.7 1.9 2.2 1.4 1.3p ..
Slovenia 0.1 0.7 0.5 0.7 0.7 0.5p ..
Spain 26.2c 1.4 1.7 1.7 1.4 .. ..
Sweden 7.1 7.6v 7.8v 8.1v 4.0v 3.8v 3.3v
Switzerland 0.7 0.5 .. 0.4 .. .. ..
Turkey .. 22.5 20.5 17.5 30.1 24.5p ..
United Kingdom 35.6 18.2 14.5 16.2 15.9c .. ..
United States 51.6a,h,i 57.3h,i 56.8h,i 54.7h,i 52.7h,i 51.0h,i,p 51.4h,i,p
EU28 (OECD estimates) 12.9 6.4 4.5 4.8 4.4 .. ..
OECD-Total 27.7 28.6 26.9 26.0 24.2 23.4 ..
Argentina 1.0h 1.3h 1.6h 1.4h .. .. ..
China .. .. .. .. .. .. ..
Romania 1.6 1.8 2.0 4.9 1.4a 1.8 0.4p
Russian Federation 38.3 .. .. .. .. .. ..
Singapore .. .. .. .. .. .. ..
South Africa .. .. .. .. .. .. ..
Chinese Taipei .. 6.8 5.8 3.3 2.9 2.6 ..
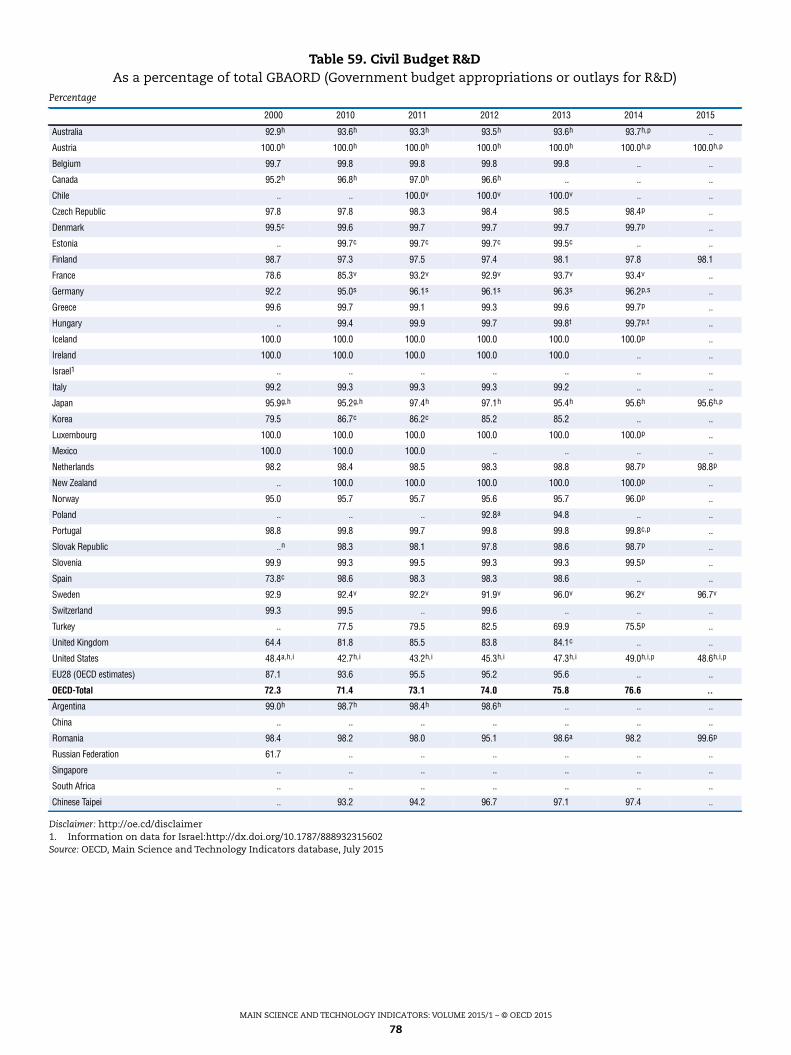
MAIN SCIENCE AND TECHNOLOGY INDICATORS: VOLUME 2015/1 – © OECD 2015
78
Disclaimer: http://oe.cd/disclaimer1. Information on data for Israel:http://dx.doi.org/10.1787/888932315602Source: OECD, Main Science and Technology Indicators database, July 2015
Table 59. Civil Budget R&DAs a percentage of total GBAORD (Government budget appropriations or outlays for R&D)
Percentage
2000 2010 2011 2012 2013 2014 2015
Australia 92.9h 93.6h 93.3h 93.5h 93.6h 93.7h,p ..
Austria 100.0h 100.0h 100.0h 100.0h 100.0h 100.0h,p 100.0h,p
Belgium 99.7 99.8 99.8 99.8 99.8 .. ..
Canada 95.2h 96.8h 97.0h 96.6h .. .. ..
Chile .. .. 100.0v 100.0v 100.0v .. ..
Czech Republic 97.8 97.8 98.3 98.4 98.5 98.4p ..
Denmark 99.5c 99.6 99.7 99.7 99.7 99.7p ..
Estonia .. 99.7c 99.7c 99.7c 99.5c .. ..
Finland 98.7 97.3 97.5 97.4 98.1 97.8 98.1
France 78.6 85.3v 93.2v 92.9v 93.7v 93.4v ..
Germany 92.2 95.0s 96.1s 96.1s 96.3s 96.2p,s ..
Greece 99.6 99.7 99.1 99.3 99.6 99.7p ..
Hungary .. 99.4 99.9 99.7 99.8t 99.7p,t ..
Iceland 100.0 100.0 100.0 100.0 100.0 100.0p ..
Ireland 100.0 100.0 100.0 100.0 100.0 .. ..
Israel1 .. .. .. .. .. .. ..
Italy 99.2 99.3 99.3 99.3 99.2 .. ..
Japan 95.9g,h 95.2g,h 97.4h 97.1h 95.4h 95.6h 95.6h,p
Korea 79.5 86.7c 86.2c 85.2 85.2 .. ..
Luxembourg 100.0 100.0 100.0 100.0 100.0 100.0p ..
Mexico 100.0 100.0 100.0 .. .. .. ..
Netherlands 98.2 98.4 98.5 98.3 98.8 98.7p 98.8p
New Zealand .. 100.0 100.0 100.0 100.0 100.0p ..
Norway 95.0 95.7 95.7 95.6 95.7 96.0p ..
Poland .. .. .. 92.8a 94.8 .. ..
Portugal 98.8 99.8 99.7 99.8 99.8 99.8c,p ..
Slovak Republic ..n 98.3 98.1 97.8 98.6 98.7p ..
Slovenia 99.9 99.3 99.5 99.3 99.3 99.5p ..
Spain 73.8c 98.6 98.3 98.3 98.6 .. ..
Sweden 92.9 92.4v 92.2v 91.9v 96.0v 96.2v 96.7v
Switzerland 99.3 99.5 .. 99.6 .. .. ..
Turkey .. 77.5 79.5 82.5 69.9 75.5p ..
United Kingdom 64.4 81.8 85.5 83.8 84.1c .. ..
United States 48.4a,h,i 42.7h,i 43.2h,i 45.3h,i 47.3h,i 49.0h,i,p 48.6h,i,p
EU28 (OECD estimates) 87.1 93.6 95.5 95.2 95.6 .. ..
OECD-Total 72.3 71.4 73.1 74.0 75.8 76.6 ..
Argentina 99.0h 98.7h 98.4h 98.6h .. .. ..
China .. .. .. .. .. .. ..
Romania 98.4 98.2 98.0 95.1 98.6a 98.2 99.6p
Russian Federation 61.7 .. .. .. .. .. ..
Singapore .. .. .. .. .. .. ..
South Africa .. .. .. .. .. .. ..
Chinese Taipei .. 93.2 94.2 96.7 97.1 97.4 ..
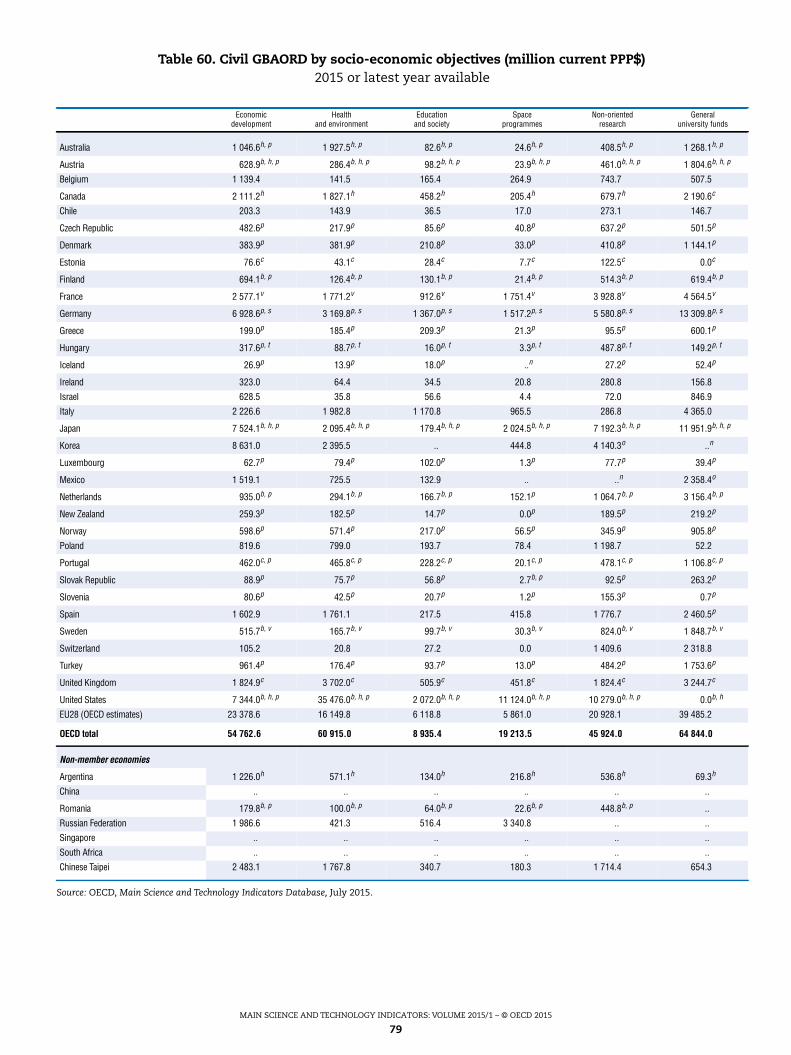
MAIN SCIENCE AND TECHNOLOGY INDICATORS: VOLUME 2015/1 – © OECD 2015
79
Source: OECD, Main Science and Technology Indicators Database, July 2015.
Table 60. Civil GBAORD by socio-economic objectives (million current PPP$)2015 or latest year available
Economicdevelopment
Healthand environment
Educationand society
Spaceprogrammes
Non-orientedresearch
Generaluniversity funds
Australia 1 046.6h, p 1 927.5h, p 82.6h, p 24.6h, p 408.5h, p 1 268.1h, p
Austria 628.9b, h, p 286.4b, h, p 98.2b, h, p 23.9b, h, p 461.0b, h, p 1 804.6b, h, p
Belgium 1 139.4 141.5 165.4 264.9 743.7 507.5
Canada 2 111.2h 1 827.1h 458.2h 205.4h 679.7h 2 190.6c
Chile 203.3 143.9 36.5 17.0 273.1 146.7
Czech Republic 482.6p 217.9p 85.6p 40.8p 637.2p 501.5p
Denmark 383.9p 381.9p 210.8p 33.0p 410.8p 1 144.1p
Estonia 76.6c 43.1c 28.4c 7.7c 122.5c 0.0c
Finland 694.1b, p 126.4b, p 130.1b, p 21.4b, p 514.3b, p 619.4b, p
France 2 577.1v 1 771.2v 912.6v 1 751.4v 3 928.8v 4 564.5v
Germany 6 928.6p, s 3 169.8p, s 1 367.0p, s 1 517.2p, s 5 580.8p, s 13 309.8p, s
Greece 199.0p 185.4p 209.3p 21.3p 95.5p 600.1p
Hungary 317.6p, t 88.7p, t 16.0p, t 3.3p, t 487.8p, t 149.2p, t
Iceland 26.9p 13.9p 18.0p ..n 27.2p 52.4p
Ireland 323.0 64.4 34.5 20.8 280.8 156.8
Israel 628.5 35.8 56.6 4.4 72.0 846.9
Italy 2 226.6 1 982.8 1 170.8 965.5 286.8 4 365.0
Japan 7 524.1b, h, p 2 095.4b, h, p 179.4b, h, p 2 024.5b, h, p 7 192.3b, h, p 11 951.9b, h, p
Korea 8 631.0 2 395.5 .. 444.8 4 140.3o ..n
Luxembourg 62.7p 79.4p 102.0p 1.3p 77.7p 39.4p
Mexico 1 519.1 725.5 132.9 .. ..n 2 358.4o
Netherlands 935.0b, p 294.1b, p 166.7b, p 152.1p 1 064.7b, p 3 156.4b, p
New Zealand 259.3p 182.5p 14.7p 0.0p 189.5p 219.2p
Norway 598.6p 571.4p 217.0p 56.5p 345.9p 905.8p
Poland 819.6 799.0 193.7 78.4 1 198.7 52.2
Portugal 462.0c, p 465.8c, p 228.2c, p 20.1c, p 478.1c, p 1 106.8c, p
Slovak Republic 88.9p 75.7p 56.8p 2.7b, p 92.5p 263.2p
Slovenia 80.6p 42.5p 20.7p 1.2p 155.3p 0.7p
Spain 1 602.9 1 761.1 217.5 415.8 1 776.7 2 460.5p
Sweden 515.7b, v 165.7b, v 99.7b, v 30.3b, v 824.0b, v 1 848.7b, v
Switzerland 105.2 20.8 27.2 0.0 1 409.6 2 318.8
Turkey 961.4p 176.4p 93.7p 13.0p 484.2p 1 753.6p
United Kingdom 1 824.9c 3 702.0c 505.9c 451.8c 1 824.4c 3 244.7c
United States 7 344.0b, h, p 35 476.0b, h, p 2 072.0b, h, p 11 124.0b, h, p 10 279.0b, h, p 0.0b, h
EU28 (OECD estimates) 23 378.6 16 149.8 6 118.8 5 861.0 20 928.1 39 485.2
OECD total 54 762.6 60 915.0 8 935.4 19 213.5 45 924.0 64 844.0
Non-member economies
Argentina 1 226.0h 571.1h 134.0h 216.8h 536.8h 69.3h
China .. .. .. .. .. ..
Romania 179.8b, p 100.0b, p 64.0b, p 22.6b, p 448.8b, p ..
Russian Federation 1 986.6 421.3 516.4 3 340.8 .. ..
Singapore .. .. .. .. .. ..
South Africa .. .. .. .. .. ..
Chinese Taipei 2 483.1 1 767.8 340.7 180.3 1 714.4 654.3
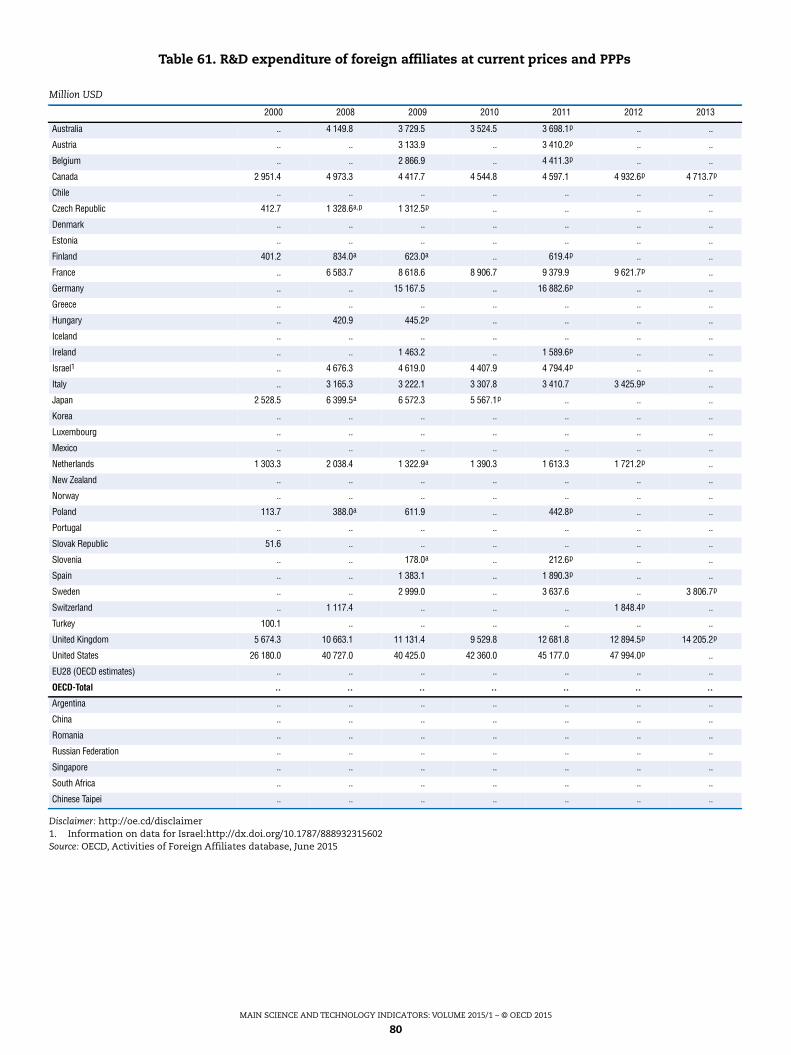
MAIN SCIENCE AND TECHNOLOGY INDICATORS: VOLUME 2015/1 – © OECD 2015
80
Disclaimer: http://oe.cd/disclaimer1. Information on data for Israel:http://dx.doi.org/10.1787/888932315602Source: OECD, Activities of Foreign Affiliates database, June 2015
Table 61. R&D expenditure of foreign affiliates at current prices and PPPs
Million USD
2000 2008 2009 2010 2011 2012 2013
Australia .. 4 149.8 3 729.5 3 524.5 3 698.1p .. ..
Austria .. .. 3 133.9 .. 3 410.2p .. ..
Belgium .. .. 2 866.9 .. 4 411.3p .. ..
Canada 2 951.4 4 973.3 4 417.7 4 544.8 4 597.1 4 932.6p 4 713.7p
Chile .. .. .. .. .. .. ..
Czech Republic 412.7 1 328.6a,p 1 312.5p .. .. .. ..
Denmark .. .. .. .. .. .. ..
Estonia .. .. .. .. .. .. ..
Finland 401.2 834.0a 623.0a .. 619.4p .. ..
France .. 6 583.7 8 618.6 8 906.7 9 379.9 9 621.7p ..
Germany .. .. 15 167.5 .. 16 882.6p .. ..
Greece .. .. .. .. .. .. ..
Hungary .. 420.9 445.2p .. .. .. ..
Iceland .. .. .. .. .. .. ..
Ireland .. .. 1 463.2 .. 1 589.6p .. ..
Israel1 .. 4 676.3 4 619.0 4 407.9 4 794.4p .. ..
Italy .. 3 165.3 3 222.1 3 307.8 3 410.7 3 425.9p ..
Japan 2 528.5 6 399.5a 6 572.3 5 567.1p .. .. ..
Korea .. .. .. .. .. .. ..
Luxembourg .. .. .. .. .. .. ..
Mexico .. .. .. .. .. .. ..
Netherlands 1 303.3 2 038.4 1 322.9a 1 390.3 1 613.3 1 721.2p ..
New Zealand .. .. .. .. .. .. ..
Norway .. .. .. .. .. .. ..
Poland 113.7 388.0a 611.9 .. 442.8p .. ..
Portugal .. .. .. .. .. .. ..
Slovak Republic 51.6 .. .. .. .. .. ..
Slovenia .. .. 178.0a .. 212.6p .. ..
Spain .. .. 1 383.1 .. 1 890.3p .. ..
Sweden .. .. 2 999.0 .. 3 637.6 .. 3 806.7p
Switzerland .. 1 117.4 .. .. .. 1 848.4p ..
Turkey 100.1 .. .. .. .. .. ..
United Kingdom 5 674.3 10 663.1 11 131.4 9 529.8 12 681.8 12 894.5p 14 205.2p
United States 26 180.0 40 727.0 40 425.0 42 360.0 45 177.0 47 994.0p ..
EU28 (OECD estimates) .. .. .. .. .. .. ..
OECD-Total .. .. .. .. .. .. ..
Argentina .. .. .. .. .. .. ..
China .. .. .. .. .. .. ..
Romania .. .. .. .. .. .. ..
Russian Federation .. .. .. .. .. .. ..
Singapore .. .. .. .. .. .. ..
South Africa .. .. .. .. .. .. ..
Chinese Taipei .. .. .. .. .. .. ..
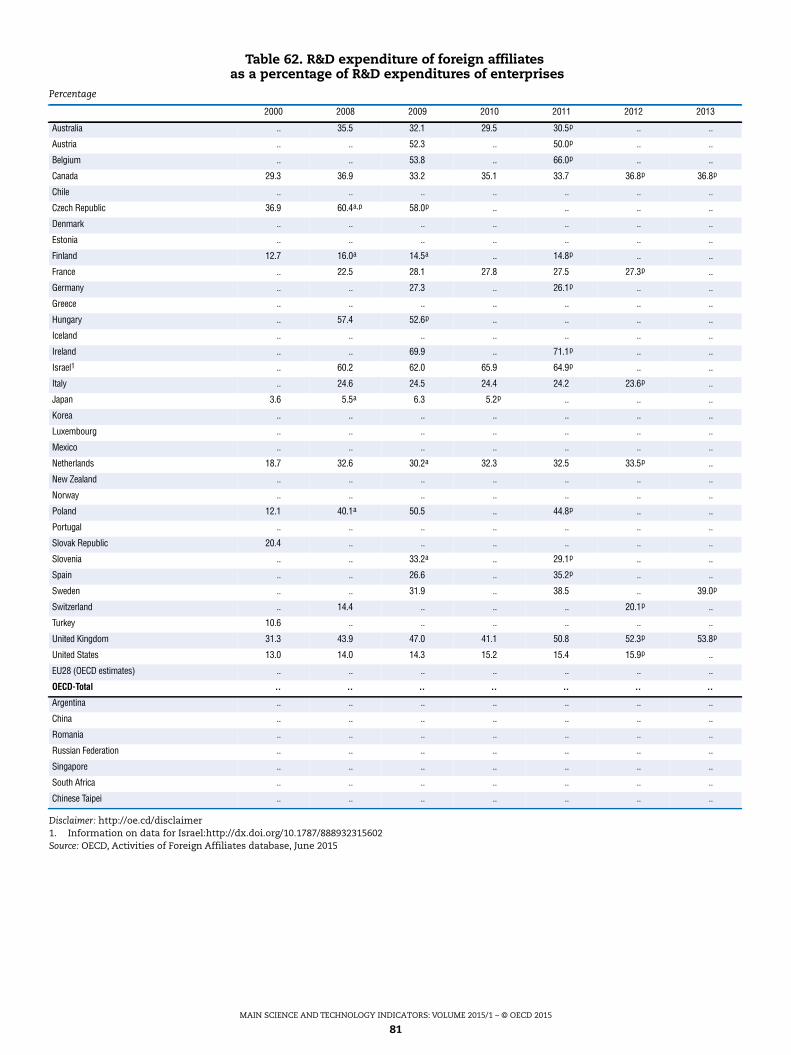
MAIN SCIENCE AND TECHNOLOGY INDICATORS: VOLUME 2015/1 – © OECD 2015
81
Disclaimer: http://oe.cd/disclaimer1. Information on data for Israel:http://dx.doi.org/10.1787/888932315602Source: OECD, Activities of Foreign Affiliates database, June 2015
Table 62. R&D expenditure of foreign affiliatesas a percentage of R&D expenditures of enterprises
Percentage
2000 2008 2009 2010 2011 2012 2013
Australia .. 35.5 32.1 29.5 30.5p .. ..
Austria .. .. 52.3 .. 50.0p .. ..
Belgium .. .. 53.8 .. 66.0p .. ..
Canada 29.3 36.9 33.2 35.1 33.7 36.8p 36.8p
Chile .. .. .. .. .. .. ..
Czech Republic 36.9 60.4a,p 58.0p .. .. .. ..
Denmark .. .. .. .. .. .. ..
Estonia .. .. .. .. .. .. ..
Finland 12.7 16.0a 14.5a .. 14.8p .. ..
France .. 22.5 28.1 27.8 27.5 27.3p ..
Germany .. .. 27.3 .. 26.1p .. ..
Greece .. .. .. .. .. .. ..
Hungary .. 57.4 52.6p .. .. .. ..
Iceland .. .. .. .. .. .. ..
Ireland .. .. 69.9 .. 71.1p .. ..
Israel1 .. 60.2 62.0 65.9 64.9p .. ..
Italy .. 24.6 24.5 24.4 24.2 23.6p ..
Japan 3.6 5.5a 6.3 5.2p .. .. ..
Korea .. .. .. .. .. .. ..
Luxembourg .. .. .. .. .. .. ..
Mexico .. .. .. .. .. .. ..
Netherlands 18.7 32.6 30.2a 32.3 32.5 33.5p ..
New Zealand .. .. .. .. .. .. ..
Norway .. .. .. .. .. .. ..
Poland 12.1 40.1a 50.5 .. 44.8p .. ..
Portugal .. .. .. .. .. .. ..
Slovak Republic 20.4 .. .. .. .. .. ..
Slovenia .. .. 33.2a .. 29.1p .. ..
Spain .. .. 26.6 .. 35.2p .. ..
Sweden .. .. 31.9 .. 38.5 .. 39.0p
Switzerland .. 14.4 .. .. .. 20.1p ..
Turkey 10.6 .. .. .. .. .. ..
United Kingdom 31.3 43.9 47.0 41.1 50.8 52.3p 53.8p
United States 13.0 14.0 14.3 15.2 15.4 15.9p ..
EU28 (OECD estimates) .. .. .. .. .. .. ..
OECD-Total .. .. .. .. .. .. ..
Argentina .. .. .. .. .. .. ..
China .. .. .. .. .. .. ..
Romania .. .. .. .. .. .. ..
Russian Federation .. .. .. .. .. .. ..
Singapore .. .. .. .. .. .. ..
South Africa .. .. .. .. .. .. ..
Chinese Taipei .. .. .. .. .. .. ..
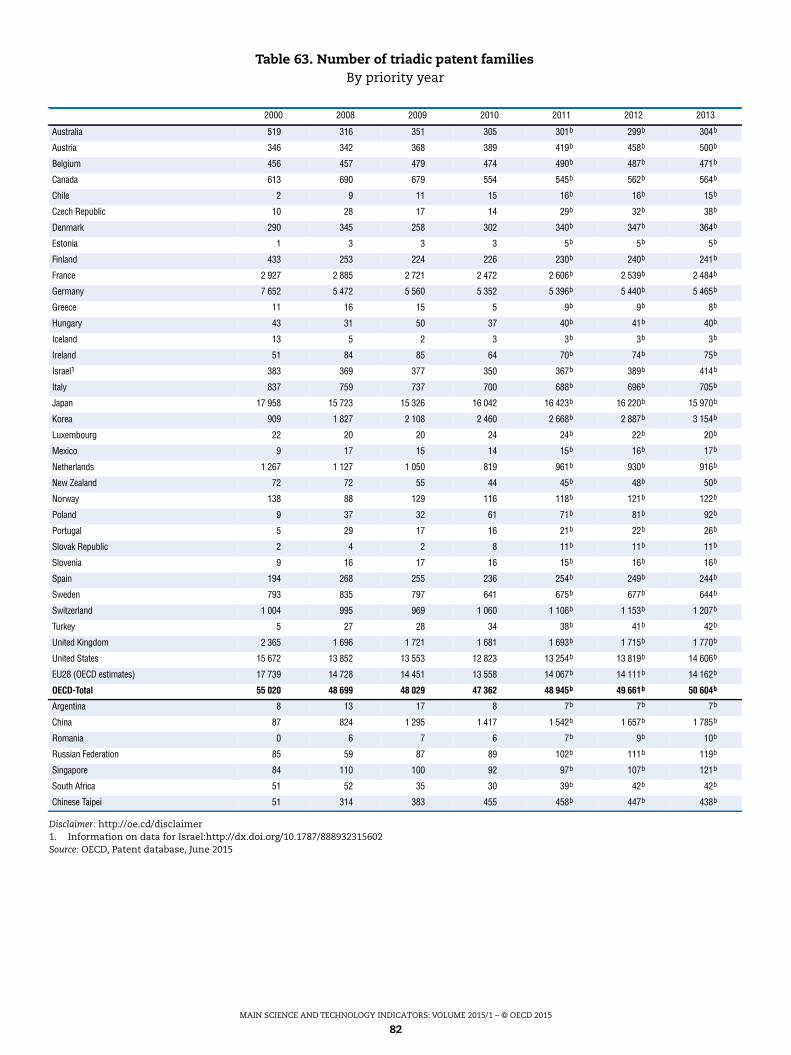
MAIN SCIENCE AND TECHNOLOGY INDICATORS: VOLUME 2015/1 – © OECD 2015
82
Disclaimer: http://oe.cd/disclaimer1. Information on data for Israel:http://dx.doi.org/10.1787/888932315602Source: OECD, Patent database, June 2015
Table 63. Number of triadic patent familiesBy priority year
2000 2008 2009 2010 2011 2012 2013
Australia 519 316 351 305 301b 299b 304b
Austria 346 342 368 389 419b 458b 500b
Belgium 456 457 479 474 490b 487b 471b
Canada 613 690 679 554 545b 562b 564b
Chile 2 9 11 15 16b 16b 15b
Czech Republic 10 28 17 14 29b 32b 38b
Denmark 290 345 258 302 340b 347b 364b
Estonia 1 3 3 3 5b 5b 5b
Finland 433 253 224 226 230b 240b 241b
France 2 927 2 885 2 721 2 472 2 606b 2 539b 2 484b
Germany 7 652 5 472 5 560 5 352 5 396b 5 440b 5 465b
Greece 11 16 15 5 9b 9b 8b
Hungary 43 31 50 37 40b 41b 40b
Iceland 13 5 2 3 3b 3b 3b
Ireland 51 84 85 64 70b 74b 75b
Israel1 383 369 377 350 367b 389b 414b
Italy 837 759 737 700 688b 696b 705b
Japan 17 958 15 723 15 326 16 042 16 423b 16 220b 15 970b
Korea 909 1 827 2 108 2 460 2 668b 2 887b 3 154b
Luxembourg 22 20 20 24 24b 22b 20b
Mexico 9 17 15 14 15b 16b 17b
Netherlands 1 267 1 127 1 050 819 961b 930b 916b
New Zealand 72 72 55 44 45b 48b 50b
Norway 138 88 129 116 118b 121b 122b
Poland 9 37 32 61 71b 81b 92b
Portugal 5 29 17 16 21b 22b 26b
Slovak Republic 2 4 2 8 11b 11b 11b
Slovenia 9 16 17 16 15b 16b 16b
Spain 194 268 255 236 254b 249b 244b
Sweden 793 835 797 641 675b 677b 644b
Switzerland 1 004 995 969 1 060 1 106b 1 153b 1 207b
Turkey 5 27 28 34 38b 41b 42b
United Kingdom 2 365 1 696 1 721 1 681 1 693b 1 715b 1 770b
United States 15 672 13 852 13 553 12 823 13 254b 13 819b 14 606b
EU28 (OECD estimates) 17 739 14 728 14 451 13 558 14 067b 14 111b 14 162b
OECD-Total 55 020 48 699 48 029 47 362 48 945b 49 661b 50 604b
Argentina 8 13 17 8 7b 7b 7b
China 87 824 1 295 1 417 1 542b 1 657b 1 785b
Romania 0 6 7 6 7b 9b 10b
Russian Federation 85 59 87 89 102b 111b 119b
Singapore 84 110 100 92 97b 107b 121b
South Africa 51 52 35 30 39b 42b 42b
Chinese Taipei 51 314 383 455 458b 447b 438b
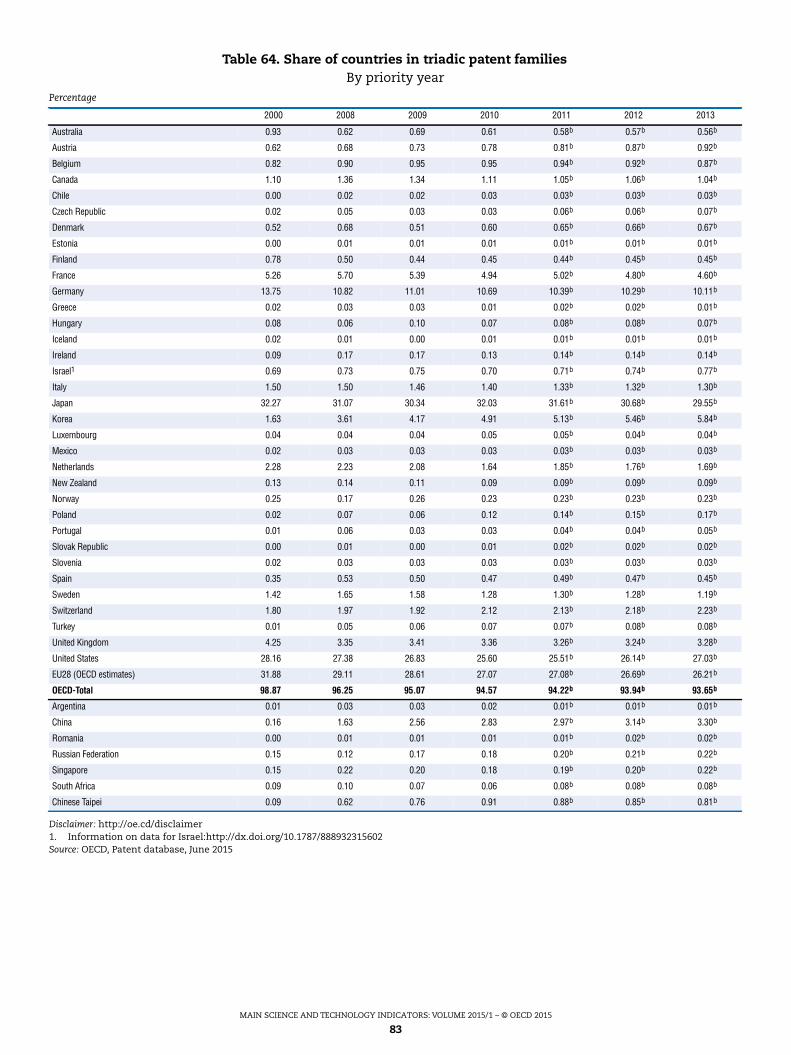
MAIN SCIENCE AND TECHNOLOGY INDICATORS: VOLUME 2015/1 – © OECD 2015
83
Disclaimer: http://oe.cd/disclaimer1. Information on data for Israel:http://dx.doi.org/10.1787/888932315602Source: OECD, Patent database, June 2015
Table 64. Share of countries in triadic patent familiesBy priority year
Percentage
2000 2008 2009 2010 2011 2012 2013
Australia 0.93 0.62 0.69 0.61 0.58b 0.57b 0.56b
Austria 0.62 0.68 0.73 0.78 0.81b 0.87b 0.92b
Belgium 0.82 0.90 0.95 0.95 0.94b 0.92b 0.87b
Canada 1.10 1.36 1.34 1.11 1.05b 1.06b 1.04b
Chile 0.00 0.02 0.02 0.03 0.03b 0.03b 0.03b
Czech Republic 0.02 0.05 0.03 0.03 0.06b 0.06b 0.07b
Denmark 0.52 0.68 0.51 0.60 0.65b 0.66b 0.67b
Estonia 0.00 0.01 0.01 0.01 0.01b 0.01b 0.01b
Finland 0.78 0.50 0.44 0.45 0.44b 0.45b 0.45b
France 5.26 5.70 5.39 4.94 5.02b 4.80b 4.60b
Germany 13.75 10.82 11.01 10.69 10.39b 10.29b 10.11b
Greece 0.02 0.03 0.03 0.01 0.02b 0.02b 0.01b
Hungary 0.08 0.06 0.10 0.07 0.08b 0.08b 0.07b
Iceland 0.02 0.01 0.00 0.01 0.01b 0.01b 0.01b
Ireland 0.09 0.17 0.17 0.13 0.14b 0.14b 0.14b
Israel1 0.69 0.73 0.75 0.70 0.71b 0.74b 0.77b
Italy 1.50 1.50 1.46 1.40 1.33b 1.32b 1.30b
Japan 32.27 31.07 30.34 32.03 31.61b 30.68b 29.55b
Korea 1.63 3.61 4.17 4.91 5.13b 5.46b 5.84b
Luxembourg 0.04 0.04 0.04 0.05 0.05b 0.04b 0.04b
Mexico 0.02 0.03 0.03 0.03 0.03b 0.03b 0.03b
Netherlands 2.28 2.23 2.08 1.64 1.85b 1.76b 1.69b
New Zealand 0.13 0.14 0.11 0.09 0.09b 0.09b 0.09b
Norway 0.25 0.17 0.26 0.23 0.23b 0.23b 0.23b
Poland 0.02 0.07 0.06 0.12 0.14b 0.15b 0.17b
Portugal 0.01 0.06 0.03 0.03 0.04b 0.04b 0.05b
Slovak Republic 0.00 0.01 0.00 0.01 0.02b 0.02b 0.02b
Slovenia 0.02 0.03 0.03 0.03 0.03b 0.03b 0.03b
Spain 0.35 0.53 0.50 0.47 0.49b 0.47b 0.45b
Sweden 1.42 1.65 1.58 1.28 1.30b 1.28b 1.19b
Switzerland 1.80 1.97 1.92 2.12 2.13b 2.18b 2.23b
Turkey 0.01 0.05 0.06 0.07 0.07b 0.08b 0.08b
United Kingdom 4.25 3.35 3.41 3.36 3.26b 3.24b 3.28b
United States 28.16 27.38 26.83 25.60 25.51b 26.14b 27.03b
EU28 (OECD estimates) 31.88 29.11 28.61 27.07 27.08b 26.69b 26.21b
OECD-Total 98.87 96.25 95.07 94.57 94.22b 93.94b 93.65b
Argentina 0.01 0.03 0.03 0.02 0.01b 0.01b 0.01b
China 0.16 1.63 2.56 2.83 2.97b 3.14b 3.30b
Romania 0.00 0.01 0.01 0.01 0.01b 0.02b 0.02b
Russian Federation 0.15 0.12 0.17 0.18 0.20b 0.21b 0.22b
Singapore 0.15 0.22 0.20 0.18 0.19b 0.20b 0.22b
South Africa 0.09 0.10 0.07 0.06 0.08b 0.08b 0.08b
Chinese Taipei 0.09 0.62 0.76 0.91 0.88b 0.85b 0.81b
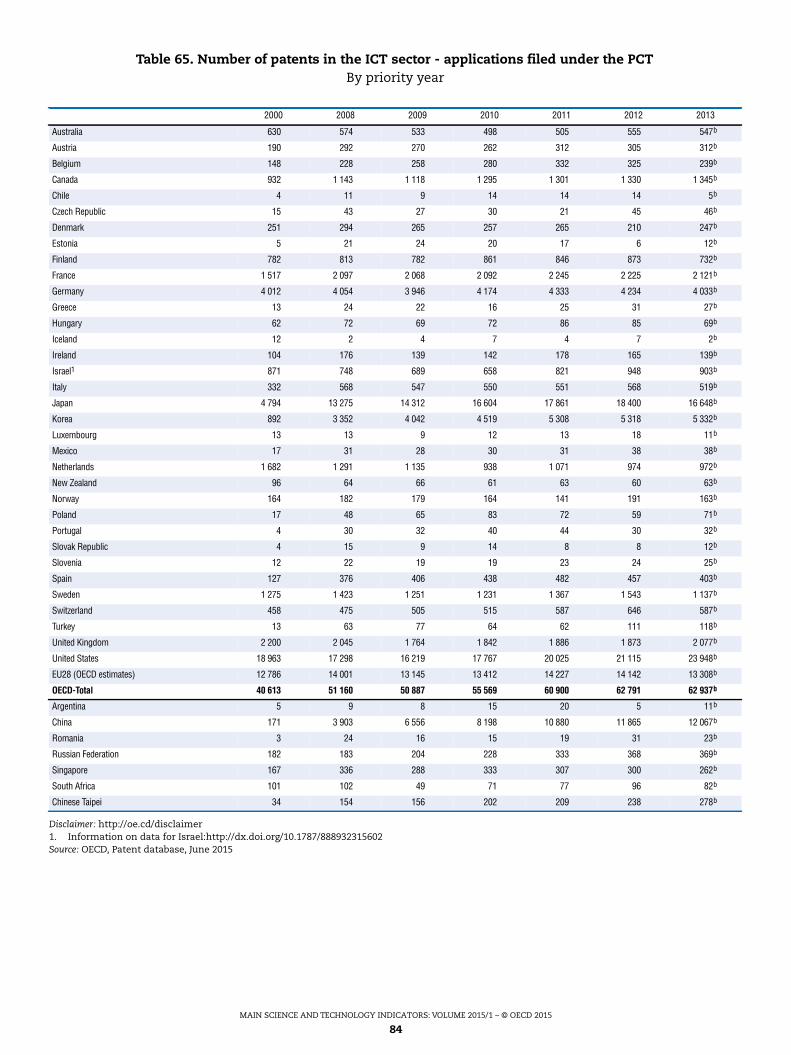
MAIN SCIENCE AND TECHNOLOGY INDICATORS: VOLUME 2015/1 – © OECD 2015
84
Disclaimer: http://oe.cd/disclaimer1. Information on data for Israel:http://dx.doi.org/10.1787/888932315602Source: OECD, Patent database, June 2015
Table 65. Number of patents in the ICT sector - applications filed under the PCTBy priority year
2000 2008 2009 2010 2011 2012 2013
Australia 630 574 533 498 505 555 547b
Austria 190 292 270 262 312 305 312b
Belgium 148 228 258 280 332 325 239b
Canada 932 1 143 1 118 1 295 1 301 1 330 1 345b
Chile 4 11 9 14 14 14 5b
Czech Republic 15 43 27 30 21 45 46b
Denmark 251 294 265 257 265 210 247b
Estonia 5 21 24 20 17 6 12b
Finland 782 813 782 861 846 873 732b
France 1 517 2 097 2 068 2 092 2 245 2 225 2 121b
Germany 4 012 4 054 3 946 4 174 4 333 4 234 4 033b
Greece 13 24 22 16 25 31 27b
Hungary 62 72 69 72 86 85 69b
Iceland 12 2 4 7 4 7 2b
Ireland 104 176 139 142 178 165 139b
Israel1 871 748 689 658 821 948 903b
Italy 332 568 547 550 551 568 519b
Japan 4 794 13 275 14 312 16 604 17 861 18 400 16 648b
Korea 892 3 352 4 042 4 519 5 308 5 318 5 332b
Luxembourg 13 13 9 12 13 18 11b
Mexico 17 31 28 30 31 38 38b
Netherlands 1 682 1 291 1 135 938 1 071 974 972b
New Zealand 96 64 66 61 63 60 63b
Norway 164 182 179 164 141 191 163b
Poland 17 48 65 83 72 59 71b
Portugal 4 30 32 40 44 30 32b
Slovak Republic 4 15 9 14 8 8 12b
Slovenia 12 22 19 19 23 24 25b
Spain 127 376 406 438 482 457 403b
Sweden 1 275 1 423 1 251 1 231 1 367 1 543 1 137b
Switzerland 458 475 505 515 587 646 587b
Turkey 13 63 77 64 62 111 118b
United Kingdom 2 200 2 045 1 764 1 842 1 886 1 873 2 077b
United States 18 963 17 298 16 219 17 767 20 025 21 115 23 948b
EU28 (OECD estimates) 12 786 14 001 13 145 13 412 14 227 14 142 13 308b
OECD-Total 40 613 51 160 50 887 55 569 60 900 62 791 62 937b
Argentina 5 9 8 15 20 5 11b
China 171 3 903 6 556 8 198 10 880 11 865 12 067b
Romania 3 24 16 15 19 31 23b
Russian Federation 182 183 204 228 333 368 369b
Singapore 167 336 288 333 307 300 262b
South Africa 101 102 49 71 77 96 82b
Chinese Taipei 34 154 156 202 209 238 278b
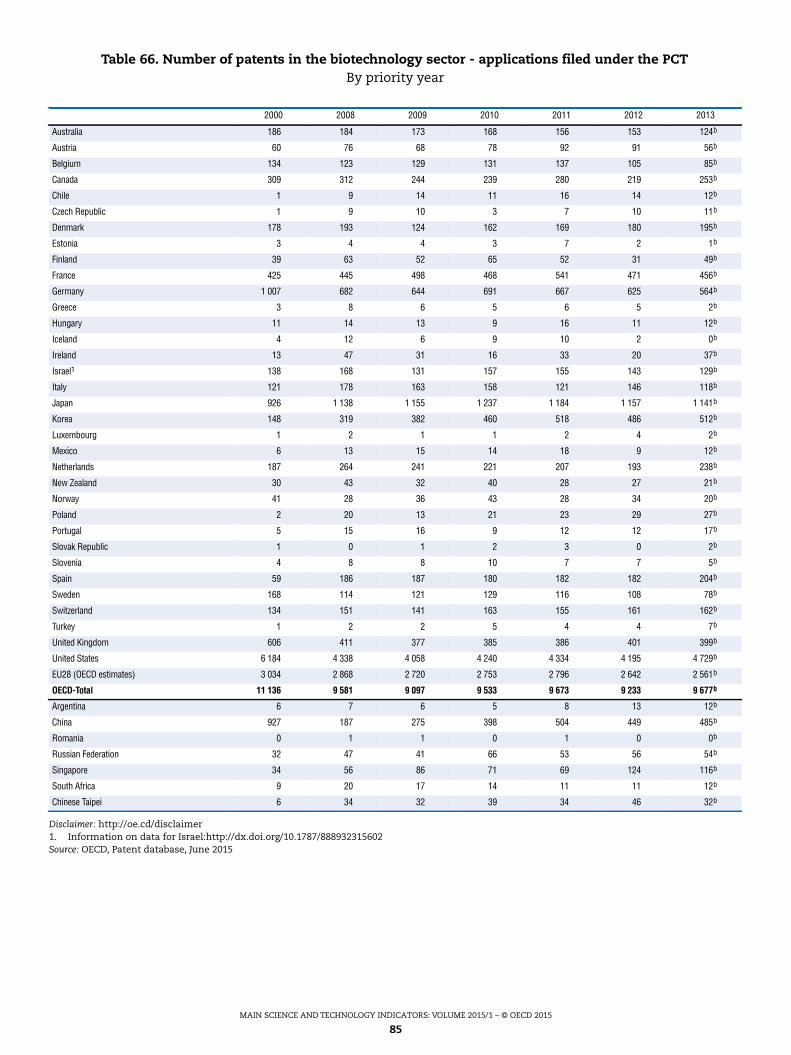
MAIN SCIENCE AND TECHNOLOGY INDICATORS: VOLUME 2015/1 – © OECD 2015
85
Disclaimer: http://oe.cd/disclaimer1. Information on data for Israel:http://dx.doi.org/10.1787/888932315602Source: OECD, Patent database, June 2015
Table 66. Number of patents in the biotechnology sector - applications filed under the PCTBy priority year
2000 2008 2009 2010 2011 2012 2013
Australia 186 184 173 168 156 153 124b
Austria 60 76 68 78 92 91 56b
Belgium 134 123 129 131 137 105 85b
Canada 309 312 244 239 280 219 253b
Chile 1 9 14 11 16 14 12b
Czech Republic 1 9 10 3 7 10 11b
Denmark 178 193 124 162 169 180 195b
Estonia 3 4 4 3 7 2 1b
Finland 39 63 52 65 52 31 49b
France 425 445 498 468 541 471 456b
Germany 1 007 682 644 691 667 625 564b
Greece 3 8 6 5 6 5 2b
Hungary 11 14 13 9 16 11 12b
Iceland 4 12 6 9 10 2 0b
Ireland 13 47 31 16 33 20 37b
Israel1 138 168 131 157 155 143 129b
Italy 121 178 163 158 121 146 118b
Japan 926 1 138 1 155 1 237 1 184 1 157 1 141b
Korea 148 319 382 460 518 486 512b
Luxembourg 1 2 1 1 2 4 2b
Mexico 6 13 15 14 18 9 12b
Netherlands 187 264 241 221 207 193 238b
New Zealand 30 43 32 40 28 27 21b
Norway 41 28 36 43 28 34 20b
Poland 2 20 13 21 23 29 27b
Portugal 5 15 16 9 12 12 17b
Slovak Republic 1 0 1 2 3 0 2b
Slovenia 4 8 8 10 7 7 5b
Spain 59 186 187 180 182 182 204b
Sweden 168 114 121 129 116 108 78b
Switzerland 134 151 141 163 155 161 162b
Turkey 1 2 2 5 4 4 7b
United Kingdom 606 411 377 385 386 401 399b
United States 6 184 4 338 4 058 4 240 4 334 4 195 4 729b
EU28 (OECD estimates) 3 034 2 868 2 720 2 753 2 796 2 642 2 561b
OECD-Total 11 136 9 581 9 097 9 533 9 673 9 233 9 677b
Argentina 6 7 6 5 8 13 12b
China 927 187 275 398 504 449 485b
Romania 0 1 1 0 1 0 0b
Russian Federation 32 47 41 66 53 56 54b
Singapore 34 56 86 71 69 124 116b
South Africa 9 20 17 14 11 11 12b
Chinese Taipei 6 34 32 39 34 46 32b
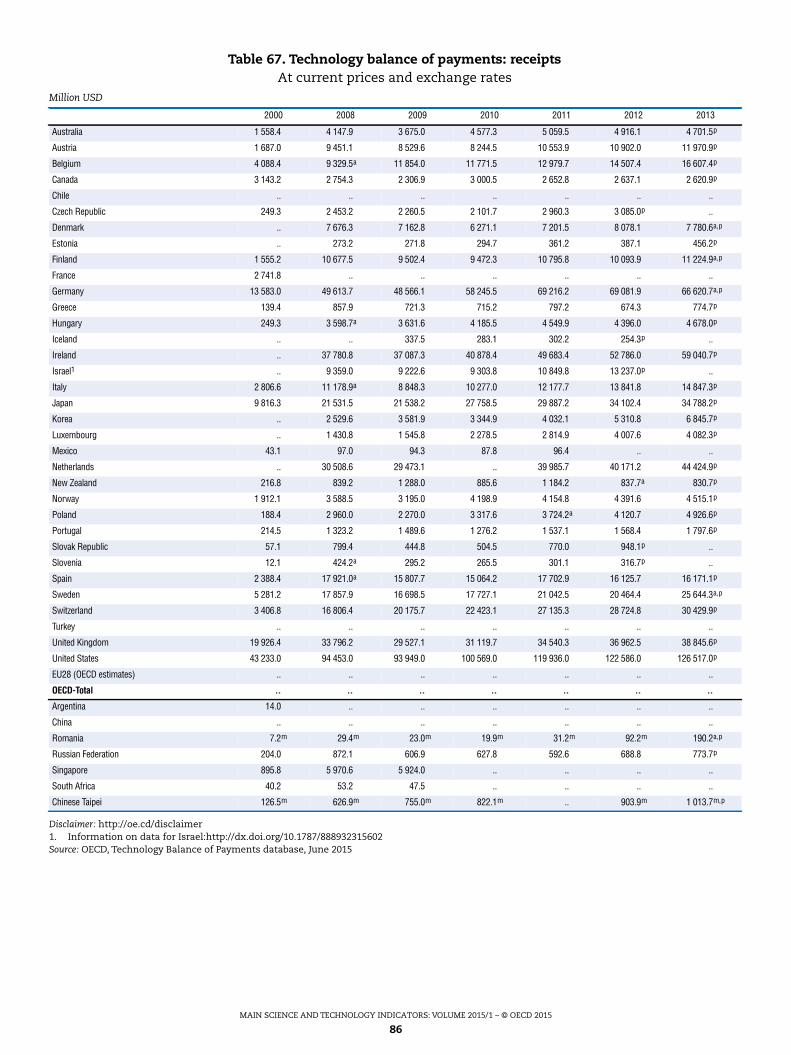
MAIN SCIENCE AND TECHNOLOGY INDICATORS: VOLUME 2015/1 – © OECD 2015
86
Disclaimer: http://oe.cd/disclaimer1. Information on data for Israel:http://dx.doi.org/10.1787/888932315602Source: OECD, Technology Balance of Payments database, June 2015
Table 67. Technology balance of payments: receiptsAt current prices and exchange rates
Million USD
2000 2008 2009 2010 2011 2012 2013
Australia 1 558.4 4 147.9 3 675.0 4 577.3 5 059.5 4 916.1 4 701.5p
Austria 1 687.0 9 451.1 8 529.6 8 244.5 10 553.9 10 902.0 11 970.9p
Belgium 4 088.4 9 329.5a 11 854.0 11 771.5 12 979.7 14 507.4 16 607.4p
Canada 3 143.2 2 754.3 2 306.9 3 000.5 2 652.8 2 637.1 2 620.9p
Chile .. .. .. .. .. .. ..
Czech Republic 249.3 2 453.2 2 260.5 2 101.7 2 960.3 3 085.0p ..
Denmark .. 7 676.3 7 162.8 6 271.1 7 201.5 8 078.1 7 780.6a,p
Estonia .. 273.2 271.8 294.7 361.2 387.1 456.2p
Finland 1 555.2 10 677.5 9 502.4 9 472.3 10 795.8 10 093.9 11 224.9a,p
France 2 741.8 .. .. .. .. .. ..
Germany 13 583.0 49 613.7 48 566.1 58 245.5 69 216.2 69 081.9 66 620.7a,p
Greece 139.4 857.9 721.3 715.2 797.2 674.3 774.7p
Hungary 249.3 3 598.7a 3 631.6 4 185.5 4 549.9 4 396.0 4 678.0p
Iceland .. .. 337.5 283.1 302.2 254.3p ..
Ireland .. 37 780.8 37 087.3 40 878.4 49 683.4 52 786.0 59 040.7p
Israel1 .. 9 359.0 9 222.6 9 303.8 10 849.8 13 237.0p ..
Italy 2 806.6 11 178.9a 8 848.3 10 277.0 12 177.7 13 841.8 14 847.3p
Japan 9 816.3 21 531.5 21 538.2 27 758.5 29 887.2 34 102.4 34 788.2p
Korea .. 2 529.6 3 581.9 3 344.9 4 032.1 5 310.8 6 845.7p
Luxembourg .. 1 430.8 1 545.8 2 278.5 2 814.9 4 007.6 4 082.3p
Mexico 43.1 97.0 94.3 87.8 96.4 .. ..
Netherlands .. 30 508.6 29 473.1 .. 39 985.7 40 171.2 44 424.9p
New Zealand 216.8 839.2 1 288.0 885.6 1 184.2 837.7a 830.7p
Norway 1 912.1 3 588.5 3 195.0 4 198.9 4 154.8 4 391.6 4 515.1p
Poland 188.4 2 960.0 2 270.0 3 317.6 3 724.2a 4 120.7 4 926.6p
Portugal 214.5 1 323.2 1 489.6 1 276.2 1 537.1 1 568.4 1 797.6p
Slovak Republic 57.1 799.4 444.8 504.5 770.0 948.1p ..
Slovenia 12.1 424.2a 295.2 265.5 301.1 316.7p ..
Spain 2 388.4 17 921.0a 15 807.7 15 064.2 17 702.9 16 125.7 16 171.1p
Sweden 5 281.2 17 857.9 16 698.5 17 727.1 21 042.5 20 464.4 25 644.3a,p
Switzerland 3 406.8 16 806.4 20 175.7 22 423.1 27 135.3 28 724.8 30 429.9p
Turkey .. .. .. .. .. .. ..
United Kingdom 19 926.4 33 796.2 29 527.1 31 119.7 34 540.3 36 962.5 38 845.6p
United States 43 233.0 94 453.0 93 949.0 100 569.0 119 936.0 122 586.0 126 517.0p
EU28 (OECD estimates) .. .. .. .. .. .. ..
OECD-Total .. .. .. .. .. .. ..
Argentina 14.0 .. .. .. .. .. ..
China .. .. .. .. .. .. ..
Romania 7.2m 29.4m 23.0m 19.9m 31.2m 92.2m 190.2a,p
Russian Federation 204.0 872.1 606.9 627.8 592.6 688.8 773.7p
Singapore 895.8 5 970.6 5 924.0 .. .. .. ..
South Africa 40.2 53.2 47.5 .. .. .. ..
Chinese Taipei 126.5m 626.9m 755.0m 822.1m .. 903.9m 1 013.7m,p
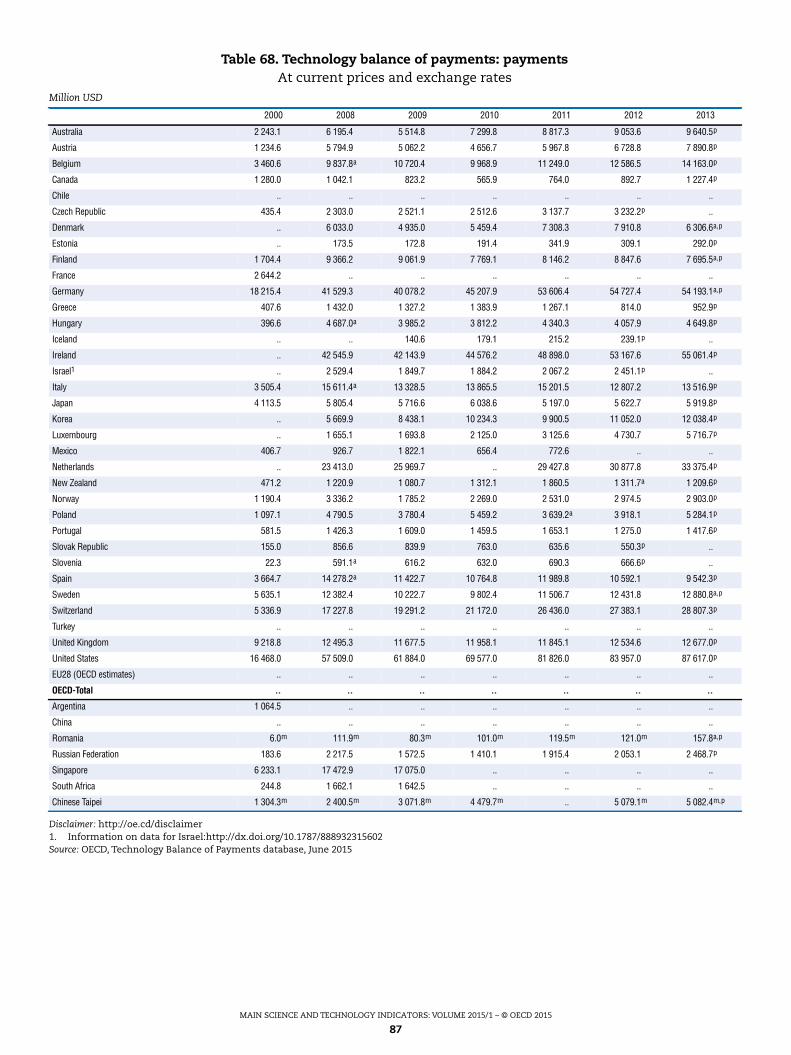
MAIN SCIENCE AND TECHNOLOGY INDICATORS: VOLUME 2015/1 – © OECD 2015
87
Disclaimer: http://oe.cd/disclaimer1. Information on data for Israel:http://dx.doi.org/10.1787/888932315602Source: OECD, Technology Balance of Payments database, June 2015
Table 68. Technology balance of payments: paymentsAt current prices and exchange rates
Million USD
2000 2008 2009 2010 2011 2012 2013
Australia 2 243.1 6 195.4 5 514.8 7 299.8 8 817.3 9 053.6 9 640.5p
Austria 1 234.6 5 794.9 5 062.2 4 656.7 5 967.8 6 728.8 7 890.8p
Belgium 3 460.6 9 837.8a 10 720.4 9 968.9 11 249.0 12 586.5 14 163.0p
Canada 1 280.0 1 042.1 823.2 565.9 764.0 892.7 1 227.4p
Chile .. .. .. .. .. .. ..
Czech Republic 435.4 2 303.0 2 521.1 2 512.6 3 137.7 3 232.2p ..
Denmark .. 6 033.0 4 935.0 5 459.4 7 308.3 7 910.8 6 306.6a,p
Estonia .. 173.5 172.8 191.4 341.9 309.1 292.0p
Finland 1 704.4 9 366.2 9 061.9 7 769.1 8 146.2 8 847.6 7 695.5a,p
France 2 644.2 .. .. .. .. .. ..
Germany 18 215.4 41 529.3 40 078.2 45 207.9 53 606.4 54 727.4 54 193.1a,p
Greece 407.6 1 432.0 1 327.2 1 383.9 1 267.1 814.0 952.9p
Hungary 396.6 4 687.0a 3 985.2 3 812.2 4 340.3 4 057.9 4 649.8p
Iceland .. .. 140.6 179.1 215.2 239.1p ..
Ireland .. 42 545.9 42 143.9 44 576.2 48 898.0 53 167.6 55 061.4p
Israel1 .. 2 529.4 1 849.7 1 884.2 2 067.2 2 451.1p ..
Italy 3 505.4 15 611.4a 13 328.5 13 865.5 15 201.5 12 807.2 13 516.9p
Japan 4 113.5 5 805.4 5 716.6 6 038.6 5 197.0 5 622.7 5 919.8p
Korea .. 5 669.9 8 438.1 10 234.3 9 900.5 11 052.0 12 038.4p
Luxembourg .. 1 655.1 1 693.8 2 125.0 3 125.6 4 730.7 5 716.7p
Mexico 406.7 926.7 1 822.1 656.4 772.6 .. ..
Netherlands .. 23 413.0 25 969.7 .. 29 427.8 30 877.8 33 375.4p
New Zealand 471.2 1 220.9 1 080.7 1 312.1 1 860.5 1 311.7a 1 209.6p
Norway 1 190.4 3 336.2 1 785.2 2 269.0 2 531.0 2 974.5 2 903.0p
Poland 1 097.1 4 790.5 3 780.4 5 459.2 3 639.2a 3 918.1 5 284.1p
Portugal 581.5 1 426.3 1 609.0 1 459.5 1 653.1 1 275.0 1 417.6p
Slovak Republic 155.0 856.6 839.9 763.0 635.6 550.3p ..
Slovenia 22.3 591.1a 616.2 632.0 690.3 666.6p ..
Spain 3 664.7 14 278.2a 11 422.7 10 764.8 11 989.8 10 592.1 9 542.3p
Sweden 5 635.1 12 382.4 10 222.7 9 802.4 11 506.7 12 431.8 12 880.8a,p
Switzerland 5 336.9 17 227.8 19 291.2 21 172.0 26 436.0 27 383.1 28 807.3p
Turkey .. .. .. .. .. .. ..
United Kingdom 9 218.8 12 495.3 11 677.5 11 958.1 11 845.1 12 534.6 12 677.0p
United States 16 468.0 57 509.0 61 884.0 69 577.0 81 826.0 83 957.0 87 617.0p
EU28 (OECD estimates) .. .. .. .. .. .. ..
OECD-Total .. .. .. .. .. .. ..
Argentina 1 064.5 .. .. .. .. .. ..
China .. .. .. .. .. .. ..
Romania 6.0m 111.9m 80.3m 101.0m 119.5m 121.0m 157.8a,p
Russian Federation 183.6 2 217.5 1 572.5 1 410.1 1 915.4 2 053.1 2 468.7p
Singapore 6 233.1 17 472.9 17 075.0 .. .. .. ..
South Africa 244.8 1 662.1 1 642.5 .. .. .. ..
Chinese Taipei 1 304.3m 2 400.5m 3 071.8m 4 479.7m .. 5 079.1m 5 082.4m,p
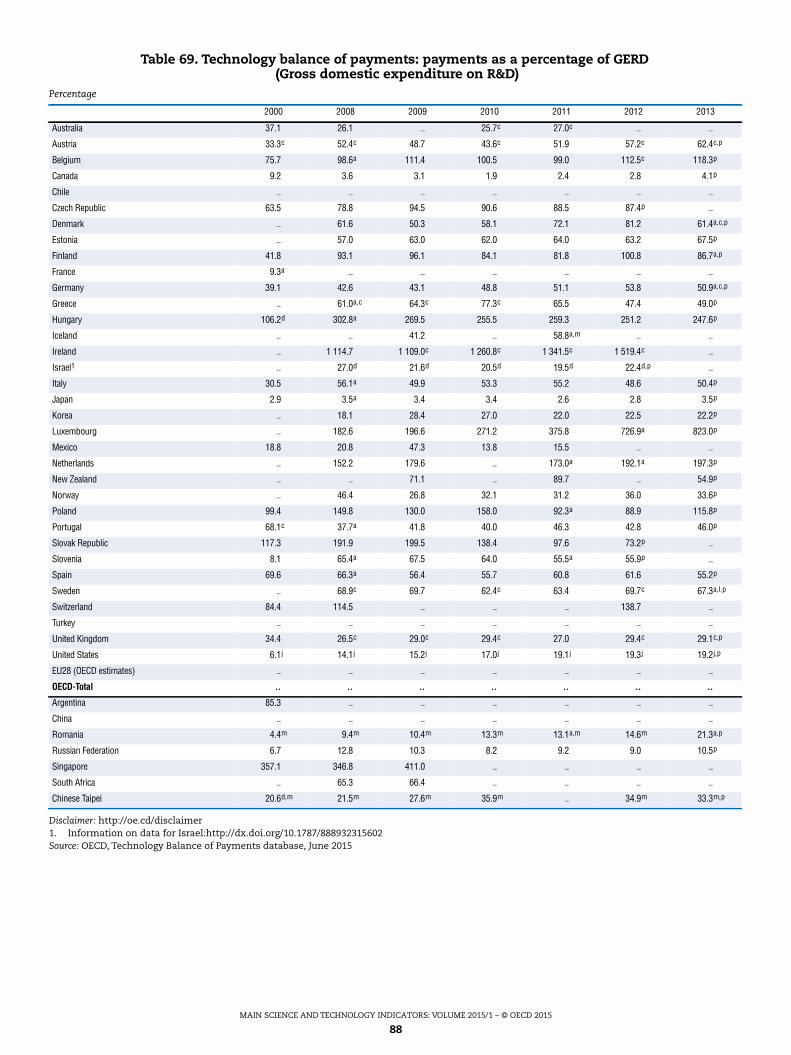
MAIN SCIENCE AND TECHNOLOGY INDICATORS: VOLUME 2015/1 – © OECD 2015
88
Disclaimer: http://oe.cd/disclaimer1. Information on data for Israel:http://dx.doi.org/10.1787/888932315602Source: OECD, Technology Balance of Payments database, June 2015
Table 69. Technology balance of payments: payments as a percentage of GERD(Gross domestic expenditure on R&D)
Percentage
2000 2008 2009 2010 2011 2012 2013
Australia 37.1 26.1 .. 25.7c 27.0c .. ..
Austria 33.3c 52.4c 48.7 43.6c 51.9 57.2c 62.4c,p
Belgium 75.7 98.6a 111.4 100.5 99.0 112.5c 118.3p
Canada 9.2 3.6 3.1 1.9 2.4 2.8 4.1p
Chile .. .. .. .. .. .. ..
Czech Republic 63.5 78.8 94.5 90.6 88.5 87.4p ..
Denmark .. 61.6 50.3 58.1 72.1 81.2 61.4a,c,p
Estonia .. 57.0 63.0 62.0 64.0 63.2 67.5p
Finland 41.8 93.1 96.1 84.1 81.8 100.8 86.7a,p
France 9.3a .. .. .. .. .. ..
Germany 39.1 42.6 43.1 48.8 51.1 53.8 50.9a,c,p
Greece .. 61.0a,c 64.3c 77.3c 65.5 47.4 49.0p
Hungary 106.2d 302.8a 269.5 255.5 259.3 251.2 247.6p
Iceland .. .. 41.2 .. 58.8a,m .. ..
Ireland .. 1 114.7 1 109.0c 1 260.8c 1 341.5c 1 519.4c ..
Israel1 .. 27.0d 21.6d 20.5d 19.5d 22.4d,p ..
Italy 30.5 56.1a 49.9 53.3 55.2 48.6 50.4p
Japan 2.9 3.5a 3.4 3.4 2.6 2.8 3.5p
Korea .. 18.1 28.4 27.0 22.0 22.5 22.2p
Luxembourg .. 182.6 196.6 271.2 375.8 726.9a 823.0p
Mexico 18.8 20.8 47.3 13.8 15.5 .. ..
Netherlands .. 152.2 179.6 .. 173.0a 192.1a 197.3p
New Zealand .. .. 71.1 .. 89.7 .. 54.9p
Norway .. 46.4 26.8 32.1 31.2 36.0 33.6p
Poland 99.4 149.8 130.0 158.0 92.3a 88.9 115.8p
Portugal 68.1c 37.7a 41.8 40.0 46.3 42.8 46.0p
Slovak Republic 117.3 191.9 199.5 138.4 97.6 73.2p ..
Slovenia 8.1 65.4a 67.5 64.0 55.5a 55.9p ..
Spain 69.6 66.3a 56.4 55.7 60.8 61.6 55.2p
Sweden .. 68.9c 69.7 62.4c 63.4 69.7c 67.3a,l,p
Switzerland 84.4 114.5 .. .. .. 138.7 ..
Turkey .. .. .. .. .. .. ..
United Kingdom 34.4 26.5c 29.0c 29.4c 27.0 29.4c 29.1c,p
United States 6.1j 14.1j 15.2j 17.0j 19.1j 19.3j 19.2j,p
EU28 (OECD estimates) .. .. .. .. .. .. ..
OECD-Total .. .. .. .. .. .. ..
Argentina 85.3 .. .. .. .. .. ..
China .. .. .. .. .. .. ..
Romania 4.4m 9.4m 10.4m 13.3m 13.1a,m 14.6m 21.3a,p
Russian Federation 6.7 12.8 10.3 8.2 9.2 9.0 10.5p
Singapore 357.1 346.8 411.0 .. .. .. ..
South Africa .. 65.3 66.4 .. .. .. ..
Chinese Taipei 20.6d,m 21.5m 27.6m 35.9m .. 34.9m 33.3m,p
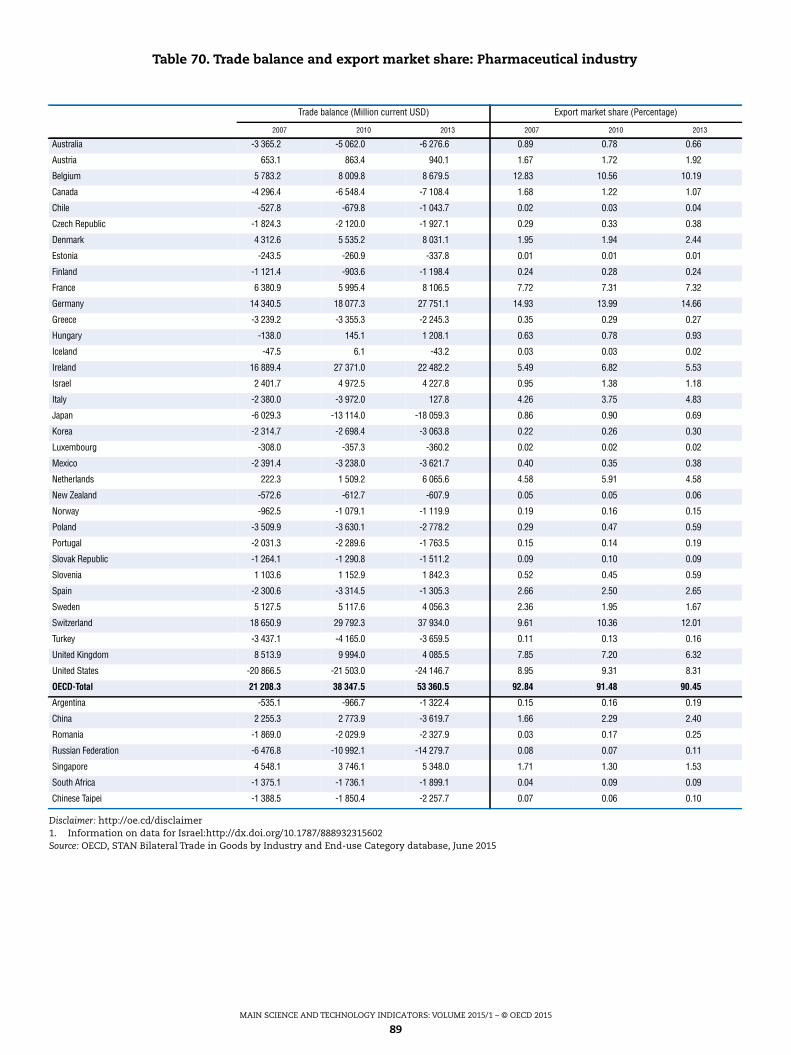
MAIN SCIENCE AND TECHNOLOGY INDICATORS: VOLUME 2015/1 – © OECD 2015
89
Disclaimer: http://oe.cd/disclaimer1. Information on data for Israel:http://dx.doi.org/10.1787/888932315602Source: OECD, STAN Bilateral Trade in Goods by Industry and End-use Category database, June 2015
Table 70. Trade balance and export market share: Pharmaceutical industry
Trade balance (Million current USD) Export market share (Percentage)
2007 2010 2013 2007 2010 2013
Australia -3 365.2 -5 062.0 -6 276.6 0.89 0.78 0.66
Austria 653.1 863.4 940.1 1.67 1.72 1.92
Belgium 5 783.2 8 009.8 8 679.5 12.83 10.56 10.19
Canada -4 296.4 -6 548.4 -7 108.4 1.68 1.22 1.07
Chile -527.8 -679.8 -1 043.7 0.02 0.03 0.04
Czech Republic -1 824.3 -2 120.0 -1 927.1 0.29 0.33 0.38
Denmark 4 312.6 5 535.2 8 031.1 1.95 1.94 2.44
Estonia -243.5 -260.9 -337.8 0.01 0.01 0.01
Finland -1 121.4 -903.6 -1 198.4 0.24 0.28 0.24
France 6 380.9 5 995.4 8 106.5 7.72 7.31 7.32
Germany 14 340.5 18 077.3 27 751.1 14.93 13.99 14.66
Greece -3 239.2 -3 355.3 -2 245.3 0.35 0.29 0.27
Hungary -138.0 145.1 1 208.1 0.63 0.78 0.93
Iceland -47.5 6.1 -43.2 0.03 0.03 0.02
Ireland 16 889.4 27 371.0 22 482.2 5.49 6.82 5.53
Israel 2 401.7 4 972.5 4 227.8 0.95 1.38 1.18
Italy -2 380.0 -3 972.0 127.8 4.26 3.75 4.83
Japan -6 029.3 -13 114.0 -18 059.3 0.86 0.90 0.69
Korea -2 314.7 -2 698.4 -3 063.8 0.22 0.26 0.30
Luxembourg -308.0 -357.3 -360.2 0.02 0.02 0.02
Mexico -2 391.4 -3 238.0 -3 621.7 0.40 0.35 0.38
Netherlands 222.3 1 509.2 6 065.6 4.58 5.91 4.58
New Zealand -572.6 -612.7 -607.9 0.05 0.05 0.06
Norway -962.5 -1 079.1 -1 119.9 0.19 0.16 0.15
Poland -3 509.9 -3 630.1 -2 778.2 0.29 0.47 0.59
Portugal -2 031.3 -2 289.6 -1 763.5 0.15 0.14 0.19
Slovak Republic -1 264.1 -1 290.8 -1 511.2 0.09 0.10 0.09
Slovenia 1 103.6 1 152.9 1 842.3 0.52 0.45 0.59
Spain -2 300.6 -3 314.5 -1 305.3 2.66 2.50 2.65
Sweden 5 127.5 5 117.6 4 056.3 2.36 1.95 1.67
Switzerland 18 650.9 29 792.3 37 934.0 9.61 10.36 12.01
Turkey -3 437.1 -4 165.0 -3 659.5 0.11 0.13 0.16
United Kingdom 8 513.9 9 994.0 4 085.5 7.85 7.20 6.32
United States -20 866.5 -21 503.0 -24 146.7 8.95 9.31 8.31
OECD-Total 21 208.3 38 347.5 53 360.5 92.84 91.48 90.45
Argentina -535.1 -966.7 -1 322.4 0.15 0.16 0.19
China 2 255.3 2 773.9 -3 619.7 1.66 2.29 2.40
Romania -1 869.0 -2 029.9 -2 327.9 0.03 0.17 0.25
Russian Federation -6 476.8 -10 992.1 -14 279.7 0.08 0.07 0.11
Singapore 4 548.1 3 746.1 5 348.0 1.71 1.30 1.53
South Africa -1 375.1 -1 736.1 -1 899.1 0.04 0.09 0.09
Chinese Taipei -1 388.5 -1 850.4 -2 257.7 0.07 0.06 0.10
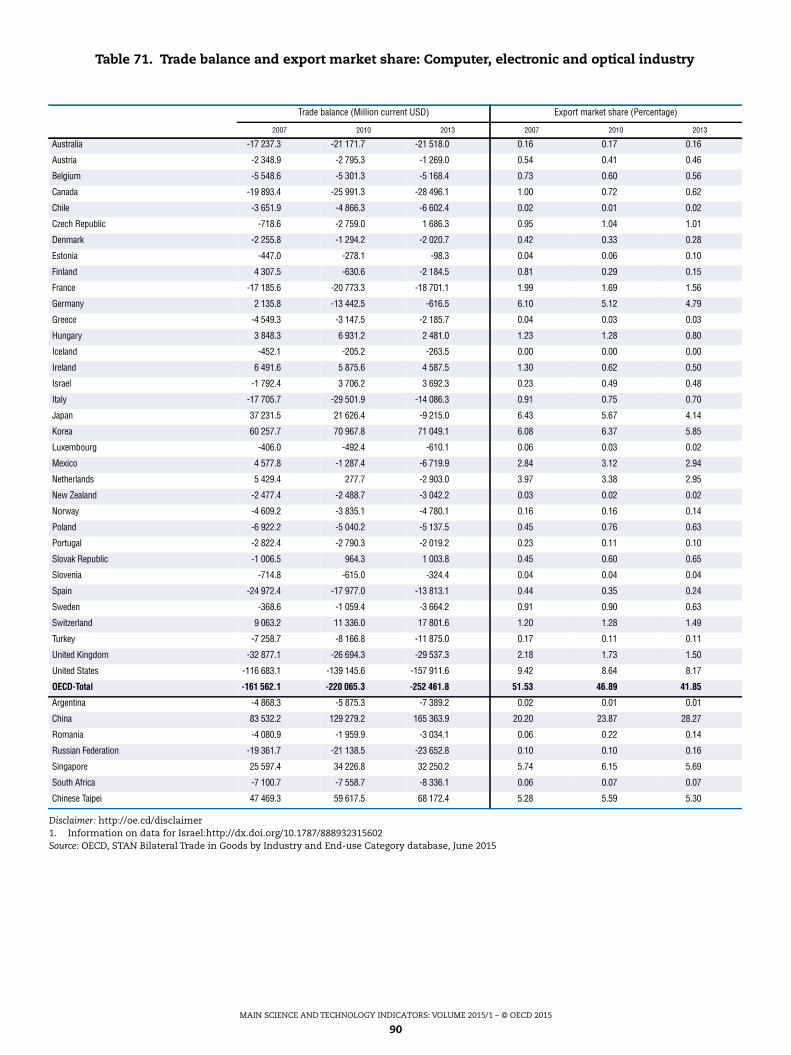
MAIN SCIENCE AND TECHNOLOGY INDICATORS: VOLUME 2015/1 – © OECD 2015
90
Disclaimer: http://oe.cd/disclaimer1. Information on data for Israel:http://dx.doi.org/10.1787/888932315602Source: OECD, STAN Bilateral Trade in Goods by Industry and End-use Category database, June 2015
Table 71. Trade balance and export market share: Computer, electronic and optical industry
Trade balance (Million current USD) Export market share (Percentage)
2007 2010 2013 2007 2010 2013
Australia -17 237.3 -21 171.7 -21 518.0 0.16 0.17 0.16
Austria -2 348.9 -2 795.3 -1 269.0 0.54 0.41 0.46
Belgium -5 548.6 -5 301.3 -5 168.4 0.73 0.60 0.56
Canada -19 893.4 -25 991.3 -28 496.1 1.00 0.72 0.62
Chile -3 651.9 -4 866.3 -6 602.4 0.02 0.01 0.02
Czech Republic -718.6 -2 759.0 1 686.3 0.95 1.04 1.01
Denmark -2 255.8 -1 294.2 -2 020.7 0.42 0.33 0.28
Estonia -447.0 -278.1 -98.3 0.04 0.06 0.10
Finland 4 307.5 -630.6 -2 184.5 0.81 0.29 0.15
France -17 185.6 -20 773.3 -18 701.1 1.99 1.69 1.56
Germany 2 135.8 -13 442.5 -616.5 6.10 5.12 4.79
Greece -4 549.3 -3 147.5 -2 185.7 0.04 0.03 0.03
Hungary 3 848.3 6 931.2 2 481.0 1.23 1.28 0.80
Iceland -452.1 -205.2 -263.5 0.00 0.00 0.00
Ireland 6 491.6 5 875.6 4 587.5 1.30 0.62 0.50
Israel -1 792.4 3 706.2 3 692.3 0.23 0.49 0.48
Italy -17 705.7 -29 501.9 -14 086.3 0.91 0.75 0.70
Japan 37 231.5 21 626.4 -9 215.0 6.43 5.67 4.14
Korea 60 257.7 70 967.8 71 049.1 6.08 6.37 5.85
Luxembourg -406.0 -492.4 -610.1 0.06 0.03 0.02
Mexico 4 577.8 -1 287.4 -6 719.9 2.84 3.12 2.94
Netherlands 5 429.4 277.7 -2 903.0 3.97 3.38 2.95
New Zealand -2 477.4 -2 488.7 -3 042.2 0.03 0.02 0.02
Norway -4 609.2 -3 835.1 -4 780.1 0.16 0.16 0.14
Poland -6 922.2 -5 040.2 -5 137.5 0.45 0.76 0.63
Portugal -2 822.4 -2 790.3 -2 019.2 0.23 0.11 0.10
Slovak Republic -1 006.5 964.3 1 003.8 0.45 0.60 0.65
Slovenia -714.8 -615.0 -324.4 0.04 0.04 0.04
Spain -24 972.4 -17 977.0 -13 813.1 0.44 0.35 0.24
Sweden -368.6 -1 059.4 -3 664.2 0.91 0.90 0.63
Switzerland 9 063.2 11 336.0 17 801.6 1.20 1.28 1.49
Turkey -7 258.7 -8 166.8 -11 875.0 0.17 0.11 0.11
United Kingdom -32 877.1 -26 694.3 -29 537.3 2.18 1.73 1.50
United States -116 683.1 -139 145.6 -157 911.6 9.42 8.64 8.17
OECD-Total -161 562.1 -220 065.3 -252 461.8 51.53 46.89 41.85
Argentina -4 868.3 -5 875.3 -7 389.2 0.02 0.01 0.01
China 83 532.2 129 279.2 165 363.9 20.20 23.87 28.27
Romania -4 080.9 -1 959.9 -3 034.1 0.06 0.22 0.14
Russian Federation -19 361.7 -21 138.5 -23 652.8 0.10 0.10 0.16
Singapore 25 597.4 34 226.8 32 250.2 5.74 6.15 5.69
South Africa -7 100.7 -7 558.7 -8 336.1 0.06 0.07 0.07
Chinese Taipei 47 469.3 59 617.5 68 172.4 5.28 5.59 5.30
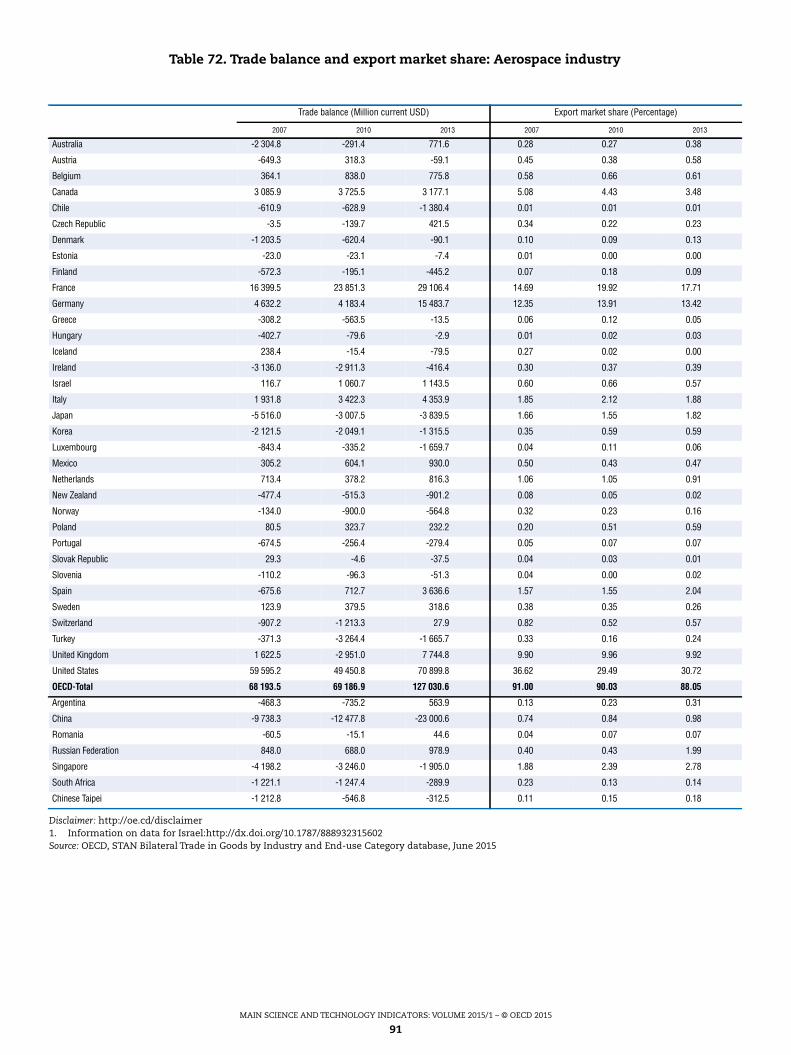
MAIN SCIENCE AND TECHNOLOGY INDICATORS: VOLUME 2015/1 – © OECD 2015
91
Disclaimer: http://oe.cd/disclaimer1. Information on data for Israel:http://dx.doi.org/10.1787/888932315602Source: OECD, STAN Bilateral Trade in Goods by Industry and End-use Category database, June 2015
Table 72. Trade balance and export market share: Aerospace industry
Trade balance (Million current USD) Export market share (Percentage)
2007 2010 2013 2007 2010 2013
Australia -2 304.8 -291.4 771.6 0.28 0.27 0.38
Austria -649.3 318.3 -59.1 0.45 0.38 0.58
Belgium 364.1 838.0 775.8 0.58 0.66 0.61
Canada 3 085.9 3 725.5 3 177.1 5.08 4.43 3.48
Chile -610.9 -628.9 -1 380.4 0.01 0.01 0.01
Czech Republic -3.5 -139.7 421.5 0.34 0.22 0.23
Denmark -1 203.5 -620.4 -90.1 0.10 0.09 0.13
Estonia -23.0 -23.1 -7.4 0.01 0.00 0.00
Finland -572.3 -195.1 -445.2 0.07 0.18 0.09
France 16 399.5 23 851.3 29 106.4 14.69 19.92 17.71
Germany 4 632.2 4 183.4 15 483.7 12.35 13.91 13.42
Greece -308.2 -563.5 -13.5 0.06 0.12 0.05
Hungary -402.7 -79.6 -2.9 0.01 0.02 0.03
Iceland 238.4 -15.4 -79.5 0.27 0.02 0.00
Ireland -3 136.0 -2 911.3 -416.4 0.30 0.37 0.39
Israel 116.7 1 060.7 1 143.5 0.60 0.66 0.57
Italy 1 931.8 3 422.3 4 353.9 1.85 2.12 1.88
Japan -5 516.0 -3 007.5 -3 839.5 1.66 1.55 1.82
Korea -2 121.5 -2 049.1 -1 315.5 0.35 0.59 0.59
Luxembourg -843.4 -335.2 -1 659.7 0.04 0.11 0.06
Mexico 305.2 604.1 930.0 0.50 0.43 0.47
Netherlands 713.4 378.2 816.3 1.06 1.05 0.91
New Zealand -477.4 -515.3 -901.2 0.08 0.05 0.02
Norway -134.0 -900.0 -564.8 0.32 0.23 0.16
Poland 80.5 323.7 232.2 0.20 0.51 0.59
Portugal -674.5 -256.4 -279.4 0.05 0.07 0.07
Slovak Republic 29.3 -4.6 -37.5 0.04 0.03 0.01
Slovenia -110.2 -96.3 -51.3 0.04 0.00 0.02
Spain -675.6 712.7 3 636.6 1.57 1.55 2.04
Sweden 123.9 379.5 318.6 0.38 0.35 0.26
Switzerland -907.2 -1 213.3 27.9 0.82 0.52 0.57
Turkey -371.3 -3 264.4 -1 665.7 0.33 0.16 0.24
United Kingdom 1 622.5 -2 951.0 7 744.8 9.90 9.96 9.92
United States 59 595.2 49 450.8 70 899.8 36.62 29.49 30.72
OECD-Total 68 193.5 69 186.9 127 030.6 91.00 90.03 88.05
Argentina -468.3 -735.2 563.9 0.13 0.23 0.31
China -9 738.3 -12 477.8 -23 000.6 0.74 0.84 0.98
Romania -60.5 -15.1 44.6 0.04 0.07 0.07
Russian Federation 848.0 688.0 978.9 0.40 0.43 1.99
Singapore -4 198.2 -3 246.0 -1 905.0 1.88 2.39 2.78
South Africa -1 221.1 -1 247.4 -289.9 0.23 0.13 0.14
Chinese Taipei -1 212.8 -546.8 -312.5 0.11 0.15 0.18

ISSN 2304-2761
Main Science and Technology Indicators: Volume 2015/1
© OECD 2015
93
General methodology
GENERAL METHODOLOGY
MAIN SCIENCE AND TECHNOLOGY INDICATORS: VOLUME 2015/1 – © OECD 2015
94
R&D data (Tables 1 to 60)
A. Definitions and coverage1. OECD standards
The data in this publication have been collected and presented in line with the standard
OECD methodology for R&D statistics entitled The Measurement of Scientific and Technological
Activities: Proposed Standard Practice for Surveys of Research and Experimental Development – Frascati
Manual 2002 (OECD).
2. The two types of data
Most R&D data are derived from retrospective surveys of the units actually carrying out
or “performing” R&D projects. Thus, the indicators in Tables 1 to 56 are based on the sum
of performers’ reports of their R&D expenditure and personnel on national territory
(i.e. excluding payments to international organisations and other performers abroad).
Personnel data are expressed in full-time equivalent (FTE) on R&D (i.e. a person working
half-time on R&D is counted as 0.5 person years) and headcount. Because of the
complexity of the surveys, it is difficult to obtain very up-to-date series. In the present
volume, some 2011 data are still provisional and data for later years are national estimates
or projections (these data are annotated).
Given the difficulty of estimating defence R&D figures which are compatible with GERD
(notably in industry), a number of countries have been unable to supply data and the
information is shown in Table 5 with only one decimal.
More up-to-date information on government support for R&D can be derived from
budgetary sources. The indicators in Tables 57 to 60 are based on Government Budget
Appropriations or Outlays for R&D as reported by the funding ministry or agency and
include payments to international organisations and other performers abroad.
The specifications of these two sets of R&D data vary significantly and the two types of
data should not be combined.
3. Fields of science
In general, the tables cover R&D in both natural sciences (including agricultural and medical
sciences) and engineering (NSE) and social sciences and humanities (SSH). A large number of
countries collect data on R&D activities in the business enterprise sector for NSE only.
4. Sectors of performance and sources of funds
Domestic R&D efforts (expenditure or personnel) are divided into four sectors of performance
for statistical purposes, business enterprise (industry), higher education, government and
private non-profit institutions (PNP).
R&D expenditure is subdivided into five sources of funds, from business enterprise (industry),
from government (public), from higher education, from PNPs and from abroad. By convention
and for international comparison purposes, public general university funds (GUF) are
allocated to the government sector as a source of funds. Since the amounts financed by the
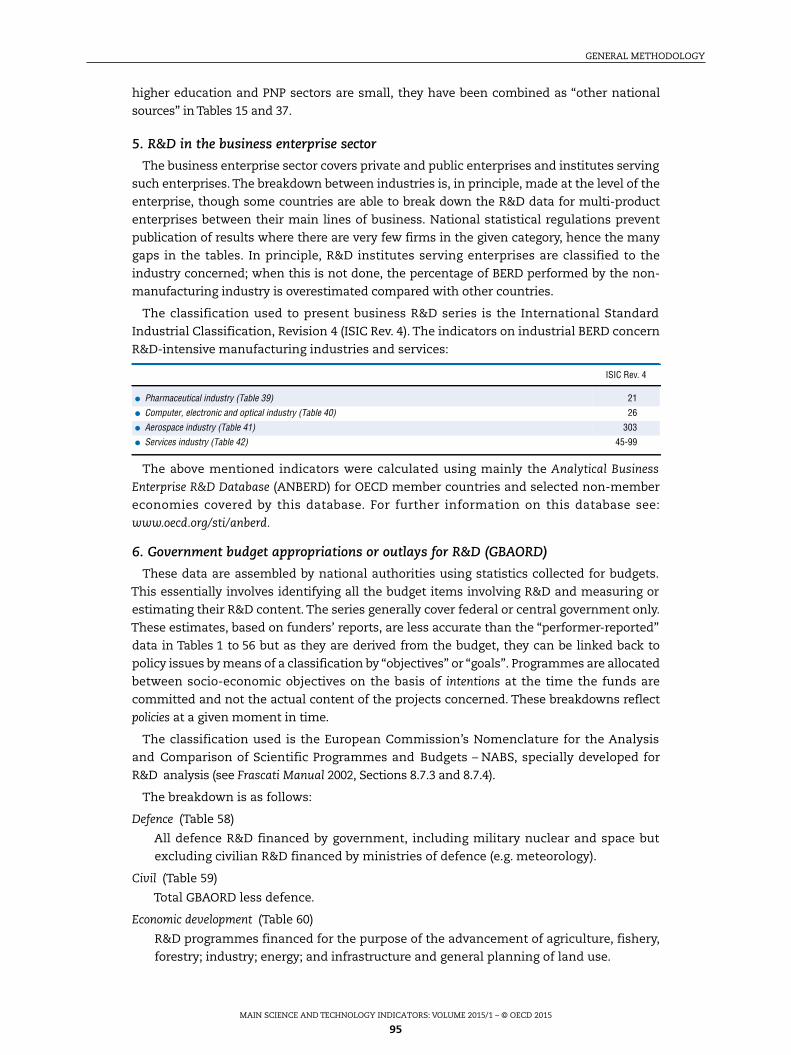
GENERAL METHODOLOGY
MAIN SCIENCE AND TECHNOLOGY INDICATORS: VOLUME 2015/1 – © OECD 2015
95
higher education and PNP sectors are small, they have been combined as “other national
sources” in Tables 15 and 37.
5. R&D in the business enterprise sector
The business enterprise sector covers private and public enterprises and institutes serving
such enterprises. The breakdown between industries is, in principle, made at the level of the
enterprise, though some countries are able to break down the R&D data for multi-product
enterprises between their main lines of business. National statistical regulations prevent
publication of results where there are very few firms in the given category, hence the many
gaps in the tables. In principle, R&D institutes serving enterprises are classified to the
industry concerned; when this is not done, the percentage of BERD performed by the non-
manufacturing industry is overestimated compared with other countries.
The classification used to present business R&D series is the International Standard
Industrial Classification, Revision 4 (ISIC Rev. 4). The indicators on industrial BERD concern
R&D-intensive manufacturing industries and services:
ISIC Rev. 4
● Pharmaceutical industry (Table 39)
45-99
The above mentioned indicators were calculated using mainly the Analytical Business
Enterprise R&D Database (ANBERD) for OECD member countries and selected non-member
economies covered by this database. For further information on this database see:
www.oecd.org/sti/anberd.
6. Government budget appropriations or outlays for R&D (GBAORD)
These data are assembled by national authorities using statistics collected for budgets.
This essentially involves identifying all the budget items involving R&D and measuring or
estimating their R&D content. The series generally cover federal or central government only.
These estimates, based on funders’ reports, are less accurate than the “performer-reported”
data in Tables 1 to 56 but as they are derived from the budget, they can be linked back to
policy issues by means of a classification by “objectives” or “goals”. Programmes are allocated
between socio-economic objectives on the basis of intentions at the time the funds are
committed and not the actual content of the projects concerned. These breakdowns reflect
policies at a given moment in time.
The classification used is the European Commission’s Nomenclature for the Analysis
and Comparison of Scientific Programmes and Budgets – NABS, specially developed for
R&D analysis (see Frascati Manual 2002, Sections 8.7.3 and 8.7.4).
The breakdown is as follows:
Defence (Table 58)
All defence R&D financed by government, including military nuclear and space but
excluding civilian R&D financed by ministries of defence (e.g. meteorology).
Civil (Table 59)
Total GBAORD less defence.
Economic development (Table 60)
R&D programmes financed for the purpose of the advancement of agriculture, fishery,
forestry; industry; energy; and infrastructure and general planning of land use.
21
● Computer, electronic and optical industry (Table 40) 26
● Aerospace industry (Table 41) 303
● Services industry (Table 42)
GENERAL METHODOLOGY
MAIN SCIENCE AND TECHNOLOGY INDICATORS: VOLUME 2015/1 – © OECD 2015
96
Health and environment (Table 60)
R&D programmes funded for the purpose of the protection and improvement of human
health; control and care of the environment; and for the exploration and exploitation
of earth.
Education and society (Table 60)
R&D programmes funded for the purpose of education; culture, recreation, religion and
mass media; and political and social systems, structure and processes.
Space (Table 60)
Civil space R&D programmes.
Non-oriented research (Table 60)
Research programmes financed in view of the advancement of knowledge.
General university funds (Table 60)
The estimated R&D content of “block grants” to the higher education sector. This
category is generally absent or underestimated for countries where only federal
government is included.
7. International comparability
Though all OECD countries generally collect and report R&D in line with the Frascati
Manual, some detailed national specifications may vary from OECD standards. These
differences are generally too small to affect the general indicators quoted in this
publication. The main exceptions are shown in Annex 1.
8. Expenditures in current dollars
National currency data have been converted to US$ using purchasing power parities (PPPs)
(Table C). The PPPs are those developed by the OECD National Accounts Division (for further
details see National Accounts of OECD Countries, as well as Eurostat-OECD Methodological Manual
on Purchasing Power Parities [PPPs], and the Internet PPP site: www.oecd.org/std/ppp), updated
for the most recent years by comparing the growth in prices (implicit GDP deflator) in each
country with that in the United States. These estimated parities are footnoted “b” in the
tables as are any data converted to current dollars using them.
For most of the non-OECD economies featured in MSTI, PPP rates provided by the
World Bank are used to convert data from national currency into PPPs. Only TBP data have
been converted using current exchange rates as these transactions are conducted on
international markets.
9. Expenditures in constant dollars
R&D expenditure series have been deflated using the implicit GDP deflator taken from
the OECD National Accounts Database updated for the most recent years by Secretariat
projections of changes in the GDP deflator, as published twice a year in the OECD Economic
Outlook (except in the case of Norway, where a deflator excluding trends in petroleum
prices has been used) (Table B). Any expenditures series calculated on the basis of these
estimated rates are footnoted “b”.
10. Comparisons with economic indicators
R&D expenditures are shown as a percentage of selected indicators drawn from the OECD
National Accounts Database updated for very recent years on the basis of the projections
published in the OECD Economic Outlook. Any ratios where such estimated economic series
GENERAL METHODOLOGY
MAIN SCIENCE AND TECHNOLOGY INDICATORS: VOLUME 2015/1 – © OECD 2015
97
are the denominator are footnoted “b” in the tables concerned. R&D personnel are shown
per thousand of selected indicators from the OECD National Accounts and Labour Force
Databases. The main indicators used are shown in Annex 2.
Impact of changes to GDP measurement on R&D intensity: the latest update to the System of
National Accounts (SNA), the SNA2008, recognised the role of R&D as an activity leading to
the creation of an intellectual asset. One implication of recognising R&D as an asset-
building activity is that the level of GDP will be revised upwards by a magnitude close to the
value of domestic business investment in R&D. This will then reduce the R&D intensity
ratio, as the numerator stays constant and the denominator increases to incorporate an
element that was previously missing from the GDP estimate. Figures and indicators for
countries which have not yet implemented a revision to their National Accounts figures to
take into account the role of R&D as investment – or for which revised data are not yet
available in the National Accounts of OECD Countries published by the OECD National
Accounts Division – are flagged with the note “y” (meaning “compiled according to the
System of National Accounts 1993”). Users should be careful when comparing the R&D
intensity of countries that have and have not capitalised R&D in their national accounts.
Likewise, they should avoid comparing previously published measures of R&D intensity
and more recent ones.
When possible, economic indicators for the non-member economies are also drawn from
the OECD databases. Alternatively, other international databases are used, such as the Eurostat
NewCronos Database (in the case of Romania, plus Bulgaria, Croatia, Cyprus, Latvia, Lithuania
and Malta for the EU zone totals), the International Monetary Fund, International Labour
Organisation and World Bank Databases, as well as various national data sources.
11. Zone totals
Zone totals have been calculated for the EU28 and the OECD for most tables. The OECD
zone includes all member countries of the OECD, i.e. Australia, Austria, Belgium, Canada,
Chile, Czech Republic, Denmark, Estonia, Finland, France, Germany, Greece, Hungary,
Iceland, Ireland, Israel, Italy, Japan, Korea, Luxembourg, Mexico, the Netherlands,
New Zealand, Norway, Poland, Portugal, Slovak Republic, Slovenia, Spain, Sweden,
Switzerland, Turkey, the United Kingdom and the United States. Zone totals for EU15 are
available in the electronic editions of this publication. In order to obtain a full set of data
for the OECD countries, the Secretariat has made a number of estimates to fill gaps and to
bring series up to date. These estimates were done using simple statistical routines or
information from national publications and observations of trends. Data points where
such estimates exceed 25% of the zone total have been suppressed. Israel, Korea and
Mexico are included in the OECD total as from 1991. The Czech Republic, Estonia, Hungary,
Poland, the Slovak Republic and Slovenia are included as from 1995. Chile is included in the
OECD total as from 2007. Luxembourg is included in the OECD and EU totals beginning 2000.
Croatia and Malta are included in the EU28 total beginning 2002. Data for non-OECD
countries used to calculate EU28 have been provided by the Statistical Office of the
European Commission (Eurostat).
OECD estimates for the EU15 and the EU28 zones may slightly differ from those
published by EUROSTAT. In this publication, in line with standard OECD practice, national
estimates are aggregated using USD Purchasing Power Parity indices (PPPs) instead of EUR
exchange rates applied by EUROSTAT. For example, the EU28 measure of GERD to GDP
intensity will be an average of EU countries’ GERD intensities, weighted by the share of
countries’ GDP to EU GDP in USD PPPs, as opposed to EUR-based GDP shares.
GENERAL METHODOLOGY
MAIN SCIENCE AND TECHNOLOGY INDICATORS: VOLUME 2015/1 – © OECD 2015
98
B. SourcesThe data are derived from national R&D surveys and budgets and are supplied to the
Secretariat via the Common OECD/ESTAT Core questionnaire.
R&D expenditures of foreign affiliates (Tables 61 and 62)
A. Definitions and coverageThese data are collected as part of the OECD Secretariat effort to measure globalisation
through the role of multinationals. Data on the activity of foreign affiliates are based on the
concept of controlling interest and the statistical test for data collection is that of a majority
interest (over 50% of shares that carry voting rights on a company’s board of management).
For further information on methodological and conceptual aspects of globalisation statistics,
see Handbook on Economic Globalisation Indicators (OECD, 2005). Data, in some cases, are not
directly comparable with standard business enterprise R&D. Details on national sources and
definitions are published in Measuring Globalisation, Activities of Multinationals, 2007. Data are
available online at www.oecd.org/sti/industryandglobalisation/amne.htm.
B. SourcesOECD Database on Activities of Foreign Affiliates (AFA), June 2015.
Patents (Tables 63 to 66)
A. Definitions and coverage1. Patents and patent families
A patent family is defined as a set of patents taken in various countries for protecting a
single invention. An inventor seeking protection files a first application (priority) generally in
his/her country of residence. Then, the inventor has a 12-month legal delay for applying or
not for protection of the original invention in other countries. Patent families, as opposed to
patents, are provided with the intention of improving international comparability (the “home
advantage” is suppressed; the values of the patents are more homogeneous).
The patent families presented in this publication refer to triadic families: i.e. a patent is
a member of the patent families if and only if it is filed at the European Patent Office (EPO),
the Japan Patent Office (JPO) and the US Patent and Trademark Office (USPTO).
In addition, the number of patent applications filed under the Patent Co-Operation
Treaty (PCT) is now provided for two specific sectors of interest: the ICT and biotechnology
sectors. These sectors are defined according to selected classes of the International Patent
Classification – IPC. The PCT procedure offers the possibility to seek patent rights in a large
number of countries by filing a single international application with a single patent office,
and then enter the national stage in the desired countries at a later date.
2. Presentation and availability
For patent counts, the choice of the country and date of reference among the set of
information included in patent documents is important. Patents are presented here
according to the country(ies) of residence of the inventor(s), giving thus a measure of
technological innovativeness of researchers and laboratories located in a country.
The priority date, the date of the first international filing of a patent, is chosen as a
reference date. It is the earliest available date and therefore the closest to the invention
date. Although the application date may provide more recent series, counts by application
date introduce a bias between residents and foreigners for a selected patent office with
GENERAL METHODOLOGY
MAIN SCIENCE AND TECHNOLOGY INDICATORS: VOLUME 2015/1 – © OECD 2015
99
respect to the priority date. Residents usually first file a patent application at their domestic
office, the extension of application to other countries takes one year following the
traditional procedure, and up to two and a half years for the PCT procedure.
However, counting patent families according to the earliest priority date increases the
drawback of traditional patent counts with respect to timeliness. The time lag between the
priority date and the availability of information on patent applications could be up to 4 years.
From priority years 2011 to 2013, patent families for individual countries are Secretariat
estimates, based on the latest trends on patent filings observed at the three offices.
Furthermore, because of changes in the rules and regulations at the USPTO, triadic patent
families before 2001 are based on USPTO granted patents.
The PCT procedure expanded after 1990 and is increasingly used by applicants from
all signatory states: since the early 2000s, most countries are well represented. For the
transition period (1990-2000), cross-country comparisons or time trends should be
interpreted with care. Data for 2013 are secretariat estimates.
A broader set of patent-related indicators is available on-line, along with methodological
issues, at www.oe.cd/ipstats, covering notably patents by main technology classes, as well as
indicators on international co-operation in patenting. For further details on patent data,
refer to the OECD Patent Statistics Manual, 2009.
B. SourcesThe data on patents at intellectual property offices (EPO, JPO, USPTO) are mainly derived
from EPO’s Worldwide Statistical Patent Database (PATSTAT, Spring 2015). The series on triadic
patent families have been compiled by the Secretariat. The series on PCT applications are
based on data published by the EPO.
Technology balance of payments (TBP) (Tables 67 to 69)
A. Definitions and coverageThe TBP registers the commercial transactions related to international technology transfers.
It consists of money paid or received for the acquisition and use of patents, licences,
trademarks, designs, know-how and closely related technical services (including technical
assistance) and for industrial R&D carried out abroad, etc.
Payments as a percentage of GERD (Table 69) give an indication of the share of imported
technology to domestic R&D efforts.
It has not been possible to produce zone totals for theTBP due to the lack of data and because
of the problem of excluding flows within the zones.
B. SourcesOECD Database on Technological Balance of Payments (TBP), June 2015.
International trade in highly R&D-intensive industries (Tables 70 to 72)
A. Definitions and coverageThese tables present indicators concerning international trade in goods by selected R&D
intensive industries. Data are presented in the International Standard Industrial
Classification Revision 4 (ISIC Rev. 4). In general, prior to 1988 underlying source data are
based on ISIC Revision 2.
These series are taken from the OECD’s Bilateral Trade in Goods by Industry and End-use Category
Database (BTDIxE), derived from the OECD’s International Trade Statistics and UNSD’s COMTRADE
GENERAL METHODOLOGY
MAIN SCIENCE AND TECHNOLOGY INDICATORS: VOLUME 2015/1 – © OECD 2015
100
Databases, which have been converted from the Harmonised System (HS) to International
Standard Industrial Classification (ISIC).
Industries concerned are the following:
ISIC Rev. 4
● Pharmaceutical industry (Table 70) 21
26
303
A note indicating breaks in series is assigned to the first available year of Revision 4 data.
Until 1992 inclusive, the data for Belgium include Luxembourg.
The zone total for EU15 (electronic editions) excludes intra-EU trade. The OECD total has
not been adjusted to exclude trade between member countries.
From 1996, calculation of the Export market shares is relative to total aggregate exports
of the declaring countries available in the OECD Bilateral Trade in Goods by Industry and End-
use Category Database (BTDIxE). Reporting countries included in BTDIxE but not presented
in this publication notably include Brazil, Hong Kong, India, Indonesia, Malaysia,
the Philippines, Saudi Arabia and Thailand. Prior to 1996, Export market share are based on
the share of OECD total exports.
B. SourcesOECD Bilateral Trade in Goods by Industry and End-use Category Database (BTDIxE), June 2015
(www.oecd.org/sti/btd).
● Computer, electronic and optical industry (Table 71)
● Aerospace industry (Table 72)
ISSN 2304-2761
Main Science and Technology Indicators: Volume 2015/1
© OECD 2015
101
ANNEX 1
National specifications
ANNEX 1. NATIONAL SPECIFICATIONS
MAIN SCIENCE AND TECHNOLOGY INDICATORS: VOLUME 2015/1 – © OECD 2015
102
OECD member countries● In 2001 in Australia, R&D in the business enterprise sector saw a significant increase due
to a change in government policy in regard to the R&D tax concession scheme
(introduction of the 175% premium (incremental) tax concession for additional investment
in R&D; introduction of an R&D tax offset for small companies in tax loss that undertake
R&D, enabling them to “cash out” their R&D tax losses; and a new treatment of R&D plant-
asset depreciation that allows a 125% deduction for effective life depreciation of assets
used in R&D activities (on a pro rata basis).
From 2011, Australia has included submission from agencies that have previously not
submitted R&D expenditure data. The agencies have been asked to provide retrospective
time series and this results in a break in series in 2002 in GBAORD data. From 1999,
Australia has prepared its Federal Budget details according to the principles of accrual
accounting, leading to a break in the series for GBAORD data.
Up to 1998, TBP data come from the business enterprise R&D survey, and only refer to
technical know-how. From 1999, TBP data are based on ABS’s quarterly Survey of
International Trade in Services, and include all TBP components.
Since 2006, a definition of foreign ownership has not been provided in the national survey
and R&D data on foreign affiliates have been accepted (by the Australian Bureau of Statistics)
as reported.
● Since 2009 in Austria, a large unit previously omitted has been included as an R&D
performer in the PNP sector.
From 2007 onwards, the former “post-secondary colleges for teacher training” (“Pädagogische
Akademien”) have become “Universities of Education” and are, consequently, surveyed as units
of the higher education sector (up to 2006, these units were covered in the government sector).
In the BE sector, the “research premium” is included in “funds from government”
beginning 2006. This measure was introduced for the first time for the calendar
year 2002, and for the 2002 and 2004 data, government funding for R&D via the “research
premium” was subsumed under “funds from enterprises”.
In 2004, Statistics Austria’s regular annual updating procedure of the R&D expenditure data
resulted in revisions showing a significant increase compared to previous estimates, mainly
due to the inclusion of results from the 2002 survey of the business enterprise sector.
As from 1995, TBP data cover royalties and license fees, technology-related services and
R&D performed abroad. Until 1991 inclusive, these data cover only royalties and license
fees. TBP data are published according to the new Balance of Payments and International
Investment Position Manual (BPM6) as from 2006.
● For Belgium, beginning with the 1998 data, two large non-profit organisations, formerly
included in the higher education sector, were reclassified in the government sector.
As from 1993 (1992 for the business enterprise sector), data are based on full surveys and
no longer on a combination of budget figures and survey findings.
The national total expenditures (Tables 1 to 4) are underestimated in 1987 and 1988, as is the
contribution of government (Table 14) as R&D financed by federative authorities (about 2-4%
ANNEX 1. NATIONAL SPECIFICATIONS
MAIN SCIENCE AND TECHNOLOGY INDICATORS: VOLUME 2015/1 – © OECD 2015
103
of GERD and 7-15% of government-financed GERD) is excluded. As a breakdown of this sum
by sector of performance is not available, the impact on the other R&D expenditure tables
cannot be estimated, though it probably affects R&D in the government and higher
education sectors.
As from 1995, TBP data are collected according to the OECD, IMF and Eurostat Manuals. Up
to 2001, data refer to the Belgium-Luxembourg Economic Union (BLEU). From 2002
onwards, data refer to Belgium only. TBP data are published according to the new BPM6
as from 2008.
● In Canada, as from 1988, included in the R&D expenditure of the higher education sector
are the estimated values for R&D in hospitals not covered by university reports and not
previously included.
As from 1989, non-federal sources are no longer excluded from General University Funds
in GBAORD.
● For Chile, from reference year 2009 in the business sector, innovation and R&D surveys
are separated and the survey sampling has been modified. Astronomical observatories
are surveyed and included in the PNP sector from 2009.
● For the Czech Republic, beginning 2005, there is a change in methodology for the collect
of R&D personnel data in FTE. Data are provided in FTE by the reporting units, and based
on new, more precise guidelines.
Between 2004 and 2008, some public research institutions were included in the business
enterprise sector because of their classification as non-financial enterprises (ISEKTOR 11)
in the European System of Accounts (ESA). These institutions have been re-classified into
the government sector and R&D expenditure and personnel data have been recalculated
for those years.
Up to 2004, TBP data come from the balance of payments of the Czech National bank.
From 2005, TBP data are prepared by the Czech Statistical office and come from the
quarterly trade in services survey, except for the item “sale/purchase of patents and
inventions” which continued to be collected by the central bank up to reference year 2008.
● In Denmark, from reference year 2007, the surveys are conducted by Statistics Denmark.
Modifications in the questionnaires have increased the response rate; this is particularly
noticeable in the business enterprise sector where survey response is now mandatory.
Additionally, due to changes in the administrative structure, a number of institutes,
previously classified in the government sector, were merged with universities.
Until 2002, the HE sector R&D expenditure was underestimated as R&D carried out in
hospital departments at the university-hospitals was included in the government sector.
As of 2002, the business enterprise survey specifically requests data on researchers, technicians
and other. Earlier data for R&D personnel by occupation are based on qualification.
As from 2001, a new principle concerning budgeting of commitments was introduced:
from 2001, commitments of grants are carried to the debit side at the time of entering
the commitment, where previously commitment of grants was carried to the debit side
at maturity. As from 1999, provincial and local government funding is included in the
GBAORD data (in particular funding in provincial hospitals), as well as funding from the
Danish National Research Foundation and the Danish Investment Fund. In 1983, 1988
and 1993, the method of assessing GBAORD data by socio-economic objectives changed,
leading to breaks in series.
TBP data are published according to the new BPM6 as from 2013.
ANNEX 1. NATIONAL SPECIFICATIONS
MAIN SCIENCE AND TECHNOLOGY INDICATORS: VOLUME 2015/1 – © OECD 2015
104
● In Finland, a new methodology was implemented in 2011 for calculating the R&D
coefficients. As a consequence, R&D personnel (measured in FTE) in the higher
education sector decreased. As from 2004, R&D personnel data are available according to
occupation. Previous breakdown was by formal qualification.
In 1998, due to a greater number of responses to the BE survey on the group level, the
questionnaire category funds from other foreign enterprises of the group have been
merged with business enterprise funds (own funds) thus reducing the share of funds
coming from abroad.
As from 1997, the higher education sector covers central university hospitals.
As from 1997 and the implementation of ISCED-97, also included in researchers are
holders of engineering degrees and graduates of vocational polytechnics, degrees which
are now classified in first stage tertiary education (ISCED 5A).
In 1991, the method of measuring R&D expenditures in the government and the higher
education sectors changed. Since 1994, PNP institutions are included in the government
sector in non-survey years.
Data on GBAORD have been revised back to 1991 because of changes in R&D coefficients
for certain research institutes. In 1991, there was an upward adjustment in the total due
to the inclusion of pension costs. As from 1995, funds from external sources of the state
research institutes are excluded from government appropriations. As from 1997, the
data covers appropriations for central university hospitals.
Until 1998 inclusive, TBP data refer to royalties and licence fees. As from 1999, data also
include architectural, engineering and other technical services, computer services and
R&D performed abroad. TBP data are published according to the new BPM6 as from 2013.
● In France, the National Centre for Scientific Research (CNRS) is included in the higher
education sector, whereas in other countries such as Italy for example, this type of
organisation is classified in the government sector. This affects comparisons of the
breakdown of R&D efforts by sector of performance.
The methodology of the public administrations survey was changed in 2010: the method
for measuring the resources devoted to R&D in ministries and some public organisations
has been modified, leading to a better identification of their financing activities. The
impact is notably a 900 million GOVERD drop and a 3 200 FTE personnel drop.
In 2007, a new methodology was introduced to correct for some double-counting in
source of funds for universities, and the higher education R&D expenditure data revised
for 2004. Also in 2007, the sampling method in the BE sector was modified and the
2004 data revised according to the new methodology.
Beginning with the 2006 survey, in order to better take into account SMEs, there is no
longer a cut-off point in the business enterprise sector of one full-time-equivalent on
R&D for an enterprise to be included in the survey population.
In 2001, coverage of the BE sector was expanded, and the data communicated by the
Ministry of Defence now cover research that was not considered R&D in earlier years.
In 2000, several methodological changes which improved the quality of the public sector
data have resulted in a break in series for that year: social charges and civil pensions are
better evaluated in universities’ research expenses; modification of responses from
some institutes to better harmonise with the corresponding multi-annual programme;
and implementation of a redesigned questionnaire. National sources estimate that the
ANNEX 1. NATIONAL SPECIFICATIONS
MAIN SCIENCE AND TECHNOLOGY INDICATORS: VOLUME 2015/1 – © OECD 2015
105
previous method would have produced a 1.6% increase in GERD, where the current
method results in 4%.
Due to changes in the methods used to evaluate domestic expenditure on defence, the
results of the 1998 surveys revealed significant modifications requiring new estimates
for 1997. This break in series relates also to the GBAORD data.
In 1997, the method used to measure R&D personnel in administrations has changed.
Between 1991 and 1992, France Télécom and GIAT Industries were transferred from the
government to the business enterprise sector following a change in their legal status.
● The data in this publication for Germany cover unified Germany from 1991 and Western
Germany only until 1990.
The method for calculating public-financed R&D in the business enterprise sector was
reviewed, resulting in the revision of business enterprise R&D and the national total
back to 1991.
In 1992, the methodology of the survey on resources devoted to R&D in the government
sector was changed.
From 1991, the data for the private non-profit sector have been included in the
government sector.
For 1997, the methodology of assessing GBAORD by socio-economic objective changed.
The 1997 total budget figure of the Federal Ministry of Education, Science, Research and
Technology was reduced, but the global reduction was not available by socio-economic
objective. Therefore, total GBAORD reflects the adjusted budget figure, and the sum of
the breakdown does not add to the total. This is also the case beginning with the
2001 GBAORD data.
Until 1985 inclusive, the TBP data for Germany cover transactions concerning patents,
licence, trademarks, models and designs. As from 1986, this data also covers technical
services, computer services and industrial R&D. TBP data are published according to the
new BPM6 as from 2013.
● In Greece, in 2011, methodological improvements and a better coverage resulted in breaks
in series: in the business enterprise sector, a new frame population was defined to cover
exhaustively all R&D-preforming firms; in the government sector, the coverage was
extended to also cover public hospitals as well as all institutions administered by the
Ministry of Culture; and in the higher education sector, all Technological Educational
Institutes (TEI) and post-secondary establishments were included. These methodological
changes were also applied to estimate the total GERD between 2008 and 2010.
The methods of assessing R&D in the higher education sector changed in 1983, 1989
and 1995.
As from 2008, GBAORD data are exclusively based on R&D funders. Part of the increase
in 2008 is also explained by a better identification of GBAORD for cultural activities.
● In Hungary, the breakdown of R&D expenditure data by sector of performance and by
source of funds is not complete. Beginning 2006, government-financed R&D, some of
which was not allocated to the appropriate sector, is now allocated, in particular to the
business enterprise sector. Prior to 2004, only defence R&D performed in the civil sector
is covered. Until 1993, business enterprise expenditure includes purchase of licenses and
know-how. As from 1994, the Central Technology Fund has been reclassified from the
business enterprise sector to the government sector.
ANNEX 1. NATIONAL SPECIFICATIONS
MAIN SCIENCE AND TECHNOLOGY INDICATORS: VOLUME 2015/1 – © OECD 2015
106
2013 and 2014 GBAORD data include multi-annual R&D projects which are not allocated
to the year in which they were budgeted.
Up to 2003, the source of TBP data was the balance of payment statistics compiled by the
Hungarian Central Bank, and data covered royalties and licence fees and sale/purchase of
patents and inventions only. Since 2004, TBP data have been collected by the Hungarian
Central Statistical Office from enterprise surveys on trade in services. TBP data also
include computer services, architectural, engineering and other technical services and
R&D carried out abroad. TBP data are published according to the new BPM6 as from 2008.
● In Iceland, from reference year 2013, the R&D data collection methodology has been
changed resulting in breaks in series. Main differences concern the redesign of the
questionnaire, the use of business registers in the sample selection mechanism, the
legal obligation for firms to respond, the definition of key R&D concepts in the
questionnaire and changes in the allocation of institutions into the business or the
government sectors. New sampling methods have caused a break in series in 2010 (or
in 2011 for sectors with no 2010 data).
From 2006, GBOARD data is compiled making better use of R&D information from the
state budget and is based on a better coverage of relevant R&D funding in major
recipients organisations. As from 1993, new methods for collecting and processing
budget data for GBAORD, result in a break in series.
● In Ireland, as of 2000, personnel data in the government sector were surveyed in FTE.
Prior to 2000, data were collected for human resources devoted to S&T in FTE, and the
R&D expenditure to total S&T expenditure ratio was applied.
The government data were revised back to 1992 inclusive, as some government
expenditures are no longer classified as R&D.
Prior to 2004, EU funds were included in GBAORD data.
● In Israel, from 2000 onwards, hospitals were transferred to the business sector from the
government and PNP sectors. Both the business enterprise and higher education surveys
were improved introducing a break in series in 2009 for the BERD financed by abroad and
by the business enterprise sector as well as a break in 2007 for the HERD financed by
abroad and by the higher education sector. Since 2001, the government sector is covered
by a survey. Before 2001, data on R&D expenditure in the government sector were
estimated through financial reports and interviews of accountants.
Data for the higher education sector are partly based on data from financial reports of the
universities. Before 2008, humanities and law are only partially covered in the higher
education sector.
Hospitals and medical centres are included in the PNP sector and in the government
sector, as are university hospitals.
The 2009 BERD survey has given more options to businesses to break down the data
(from 1993) by sources of funds. Consequently, there are breaks in series in 1993 for BERD
(as for GERD) financed by the business enterprises and by abroad.
The statistical data for Israel are supplied by and under the responsibility of the relevant
Israeli authorities or third party. The use of such data by the OECD is without prejudice
to the status of the Golan Heights, East Jerusalem and Israeli settlements in the West
Bank under the terms of international law.
● For Italy, in 2005 and 1997, new methods for estimating R&D in universities were
introduced, resulting in breaks in series in the higher education sector.
ANNEX 1. NATIONAL SPECIFICATIONS
MAIN SCIENCE AND TECHNOLOGY INDICATORS: VOLUME 2015/1 – © OECD 2015
107
Up until 1990, the national total expenditures on R&D are overestimated by more than
10% as they include extramural R&D expenditures. As from 1991, data on extramural
R&D expenditures are available separately and are excluded.
2010 GBAORD data are calculated with a new set of coefficients especially affecting the
data on non-oriented research programmes.
Up to reference year 2007, the source of TBP data was the balance of payment statistics
compiled by the Ufficio Italiano dei Cambi, based on the ITRS system (settlement data
collection system). On 1st January 2008, UIC ceased to exist and its functions have been
taken over by the Bank of Italy. The data are derived from a new data collection system,
mainly based on direct reporting from enterprises. Until 1991 inclusive, R&D performed
abroad is excluded.
● For Japan in 2008, the FTE coefficients for researchers in the higher education sector
were revised, producing a decrease in both R&D expenditure and personnel for this
sector and the national total.
Beginning with the 2002/03 survey (OECD data 2002), the coefficients supplied by the
Ministry of Education, Culture, Sports, Science and Technology were applied to doctoral
level students as well as teachers when calculating FTE for the HE sector, resulting in a
break in series for that year.
Before 1996, in the Higher Education sector expenditure and personnel data in FTE are
OECD estimates derived from official headcount-based data.
GBAORD data represent the budget for S&T and cover central government only.
From 2011 onwards, GBAORD for education and society data include a more accurate
measure of the budget of the National Institute for Cultural Heritage. Military
procurement contracts are excluded from defence GBAORD, and before 2010, GUF
excludes social sciences and humanities.
● In Korea, social sciences and humanities are excluded from the R&D data prior to 2007.
Since 2008, estimates have been done in GBAORD breakdown to fit NABS 2007.
For the TBP data, data for technology receipts and payments do not come from the same
source and are therefore not comparable. Technology receipts data come from the R&D
survey and are probably underestimated as all firms are not surveyed.Technology payments
data come from the balance of payments statistics compiled by the Bank of Korea.
● In Luxembourg, a better identification of R&D in software-related activities resulted in a
break in series in 2012 for BERD (and for GERD). From 2009, some budgetary items for the
Ministry of Research and other ministries are no longer included in the government’s
own R&D funds. The impact on GOVERD is less than a 7 million drop.
In 2004, the significant increase in R&D performed in the higher education sector is due
to the re-defined role of higher education in the national system of innovation and
research, in particular the newly created University of Luxembourg.
Government budget appropriations for space programs and GUF are included from 2006.
● Beginning with the 2004 data, Mexico’s business enterprise survey register was
increased to include large firms previously not identified as R&D providers. The first R&D
surveys based on the Frascati Manual covered the period 1992-93. Earlier data for R&D
performed in the government sector are based on broader national estimates, and thus
do not exactly correspond to the recommendations of the Frascati Manual.
● In the Netherlands, in 2012, the method for sampling enterprises included in ISIC
industries 84 to 99 (community, social and personal services) as well as the breakdown
of personnel data by occupation were modified in Dutch surveys leading to breaks in
ANNEX 1. NATIONAL SPECIFICATIONS
MAIN SCIENCE AND TECHNOLOGY INDICATORS: VOLUME 2015/1 – © OECD 2015
108
series in the business and the government sectors. In 2011, the method for producing
business enterprise data has changed: all observed enterprises are included whereas
before 2011, only enterprises with substantial R&D activities (i.e. with a minimum
number of R&D personnel) were incorporated. Subsequent changes affected the higher
education sector: before 1999, a large number of PhD candidates were formally employed
by research institutes financing their research. As from 1999, universities became the
formal employer of PhD candidates and their research activities moved from the
government sector to the higher education sector. Besides this, the R&D activities of the
Universities of Applied Sciences (HBO) were for the first time taken into account. Finally,
the R&D activities of the Academic hospitals were increasingly underestimated due to
the merging of the Academic hospitals and (parts) of the Faculties of Medicine of the
universities into so-called University Medical Centers (UMC’s). This started in 1998 and
meant for instance that staff of the Faculty of Medicine of the university became
employees of the UMC. So, data on R&D in the field of medical sciences were also revised.
As from 2000, newly-recruited researchers on the payroll of the Netherlands
Organisation for Scientific Research (NOW), previously included in the government
sector, were included with personnel in the higher education sector. In 1982 and 1990,
the methodology of the survey on R&D expenditure changed.
In 2003, Statistics Netherlands revised the panel of the R&D survey for the government
and PNP sectors, resulting in breaks in series for both sectors. Also beginning 2003, R&D
personnel in the PNP sector are grouped with government sector R&D personnel.
In 1994 and 1996, there were major expansions of the area covered by the business
enterprise sector survey; R&D expenditure and personnel data in the latter sector and in
the whole economy are thus not comparable with those for the previous years.
In 1990 and 1999, new methods of calculating GUF are used for GBAORD series.
● New Zealand revised the methods of collection and estimation of R&D data respectively
in 1984 (for the higher education sector), 1992 (for GUF), and 2001 (BERD and national
total and HE personnel).
GBAORD figures have been revised back to 2007, resulting in a break in series. From 2006
onwards, GBAORD data are collected from all government agencies, together with
analysis of selected budgetary information. Prior to that year, data were derived from the
budget estimate of the pool for science funding, together with figures on government
department’s operational research.
Up to 1997, TBP data came from the R&D survey conducted by the Ministry of Research,
Science and Technology. From 1999 onwards, the data are based on the quarterly
International Trade in Services and Royalties Survey carried out by Statistics New Zealand. All
TBP components are covered. TBP data are published according to the new BPM6 as
from 2012.
● In Norway in 2007, break in series with previous years because of a change in
compilation methods for health institutions. This affects both higher education sector
(university hospitals) and government sector (other hospitals).
In 1995, the survey sample was revised to improve coverage of small firms (10 to
50 employees) and non-manufacturing industries.
As of 1991, personnel in central administration units of higher education are not included,
however the cost of such personnel is included in other current R&D expenditure (in line
with the Frascati Manual).
ANNEX 1. NATIONAL SPECIFICATIONS
MAIN SCIENCE AND TECHNOLOGY INDICATORS: VOLUME 2015/1 – © OECD 2015
109
In 1987, own funds from public enterprises have been reclassified from funds from
government to the funds from the business enterprise sector. As from 1989, R&D
performed by PNP institutes has been included in the government sector.
The growth in resources devoted to R&D in 1984 is due to the expansion of the area
covered by the business enterprise sector survey.
The method for compiling GBAORD data changed in 1996. The series have been revised
retrospectively to exclude contract research, state enterprises and payments to the
European Commission.
Before 1988, TBP data cover only patent licensing and are consequently underestimated.
● For Poland, GBAORD data exclude European Commission funds since 2012.
Up to 1999, TBP data cover trade in techniques; transactions involving trademarks, patterns
and designs; services with a technical contents (including prospecting until 1995 and spatial
planning, town planning and architectonic work); R&D performed abroad. From 2000, all
categories are covered (acquisition/disposal of non-produced, non-financial assets, royalties
and licence fees, computer services, architectural, engineering and other technical services
and R&D services). TBP data are published according to the new BPM6 as from 2011.
● In Portugal, in 2008, the R&D personnel increased because of methodological improvements
in the different institutional sectors (government, higher education, as well as private non
profit institutions): the results of the individual survey forms were crossed with information
from other internal databases resulting notably in the inclusion of all permanent academic
staff and all researchers funded by the Ministry of Science, Technology and Higher
Education in 2008.
Due to methodological improvements in the 2008 R&D survey as well as complementary
information collected from internal databases, there is now a more complete and
accurate measure of R&D resources, both expenditure and personnel, in the higher
education sector. In particular, the large increase in higher education funded R&D is due
to the inclusion of more accurate data related to private higher education institutions.
Beginning with the 2007 survey, the following measures resulted in a significant increase
in Business enterprise R&D: the reintroduction of the fiscal incentive, SIFIDE; an increase
in the number of the firms performing R&D activities; and an updating of the Business
Enterprise Register.
New methodological procedures have been adopted for the 1997 survey so that only R&D
activities are covered in the survey. The classification of BERD by NACE (Rev. 1) was
introduced and the data have been revised back to 1995. Some of the PNP units have
been resectored in the business enterprise and higher education sectors.
In 1997, due to a new accounting method for structural funds from the European
Commission, funds from abroad and direct government financing are not comparable
with those of earlier years.
GBAORD data have been revised back to 2008 according to a new methodological exercise.
TBP data are published according to the new BPM6 as from 1996.
● For the Slovak Republic, data before 1994 refer to the Research and Development Base (RDB)
and cover the whole activity of institutions and not only R&D. Defence R&D was totally
excluded until 1997 and only partially included thereafter.
Since 2002, a new budget classification compatible with COFOG enables the identification
of government budget appropriations for defence R&D. The defence category includes
ANNEX 1. NATIONAL SPECIFICATIONS
MAIN SCIENCE AND TECHNOLOGY INDICATORS: VOLUME 2015/1 – © OECD 2015
110
R&D appropriations for defence, safety and security of the country. For earlier years,
defence R&D was included in the GBAORD total.
● For Slovenia, in 2011, the increase in R&D personnel and expenditure is notably
explained by both the improvement of non-response analysis and new administrative
sources to better identify R&D performers. Beginning reference year 2008, survey
coverage was expanded to include some innovative companies that were not previously
recognised as R&D performers.
● For Spain, beginning 2008, the R&D questionnaire includes a specific category for on-site
consultants undertaking R&D projects in the enterprise; as well as a specific category
within the breakdown of current costs.
Since 2004, loans for R&D that are returnable are not included in GBAORD, in order to
ensure international comparability.
From 2002, R&D expenditure and personnel data for the business enterprise sector
include the occasional and the systematic R&D.
R&D personnel data prior to 1989 are underestimated because the R&D personnel data
for the higher education sector only include researchers. In consequence, total R&D
personnel in Spain may be underestimated for these years by between 10 and 15%.
In 1992, there was an upward reestimation of the General University Funds causing a
break in series in the financing of HERD and GERD. In 1995, the sources of funds for R&D
in the higher education sector were reviewed; own funds are now separated from the
General University Funds where they were previously included.
In 1997, the defence objective in GBAORD almost doubled in magnitude due to an
exceptional contribution by the Ministry for Industry and Energy. The incorporation
in 1997 of the Spanish contribution to CERN has involved substantial changes in the
“energy” category.
Up to 1992, TBP data come from the annual survey into technological transfer in
companies conducted by the Ministry of Science and Technology (former Ministry of
Industry and Energy). From 1996 onwards, TBP data come from the balance of payments
statistics compiled by the Spanish Central Bank. All TBP items are covered. TBP data are
published according to the new BPM6 as from 2008.
● In Sweden, part of personnel data were reallocated from the category “technicians” to the
category “researchers” in 2013. In 2011 and 2009, the PNP sector decreased due to a new
sampling method. In 2011, for personnel data, the institutional coverage of the
Government sector was improved.
Beginning 2007, researchers in the business enterprise, government and PNP sectors
are now surveyed by occupation; prior to that year, university graduates were counted
in their place.
Until 2005, R&D data for Sweden were underestimated: R&D in the government sector
covered central government units only and companies between 10-49 employees were
excluded from the coverage. Moreover, prior to 1993 the surveys in the business
enterprise, government and private non-profit sectors excluded R&D in the social
sciences and humanities. Also beginning 2005, FTE on R&D in the higher education
sector reflects a change in survey method. Concerning the government sector,
beginning 2005, the data exclude R&D personnel from the County councils, resulting in
the personnel data being underestimated.
ANNEX 1. NATIONAL SPECIFICATIONS
MAIN SCIENCE AND TECHNOLOGY INDICATORS: VOLUME 2015/1 – © OECD 2015
111
As from 1997, funding from the Public Research Foundations, previously classified in the
PNP sector, is considered as funding from the government sector.
In 1995, some institutions from the PNP sector have been reclassified to the business
enterprise or the government sectors, and in the higher education sector, capital
expenditures are excluded.
As from 1998, GBAORD series refer to the calendar year (January-December) instead of
the period July-June which has been used until 1994. Budget appropriations for 1995
and 1996 are estimates based on the period July 1995-December 1996. Also from 1998,
funding from the Public Research Foundations is excluded from the GBAORD data.
Up to 1993, TBP data came from the R&D survey and referred to the transactions linked
to patents, licences, royalties and know-how. From 1998, the data are based on the
quarterly trade in services survey. All TBP components are covered. TBP data are
published according to the new BPM6 as from 2013.
● In Switzerland, the business enterprise sector comprises private enterprises only. Public
enterprises are included in the government sector.
As from the reference year 2000, the government sector no longer includes the
telecommunications companies that have been privatised (Swisscom).
As from 1998, the Federal Office of Agriculture and its research institutes no longer break
down their R&D by socio-economic objective but group all under “Agriculture”. For GBAORD,
this results in a break in series for both Agriculture and Health objectives, where half of the
funds previously declared under Health are now declared under Agriculture. Also in 1998,
the telecommunications field of the Federal Post office has become the private enterprise
Swisscom which is no longer included under the Infrastructure objective in GBAORD.
Before 1994, GBAORD did not include the public sector financed R&D mandates.
The TBP statistics are drawn from the Swiss balance of payments. They include sales and
purchases of intangible assets, technological services (construction services, commercial
and technical consulting), license and patent fees, including management fees, computer
and information services.
● Total R&D personnel data for Turkey (Tables 9 and 10) are underestimated because
personnel data for the higher education sector only include researchers.
● Beginning with the 2005 data, United Kingdom counts of researchers in full-time
equivalent on R&D reflect a more accurate measure of post-graduate students. Estimates
are based on the sum of student time allocated to different research activities (some
students may be involved in several research projects). Students who spend 50% or more
of their time on research activities are counted as one FTE; those for whom it is less than
50% are not counted.
In 2001, the government research agency, the Defence Evaluation and Research Agency
(DERA) was disestablished and two new organisations were created. Around one quarter
of DERA remained within the Ministry of Defence as a government agency, whilst the
remaining three quarters became a private limited company, resulting in a break in
series in both the government and business enterprise sectors as well as GBAORD.
Following work to enhance the estimates of R&D by PNP undertaken in 1996, estimates
for R&D performed by PNP sector were substantially revised downwards. The data for
previous years were revised accordingly.
Until 1994, in the business enterprise sector, R&D funding by business includes funds that
may have been collected from other national sources such as higher education or PNPs.
ANNEX 1. NATIONAL SPECIFICATIONS
MAIN SCIENCE AND TECHNOLOGY INDICATORS: VOLUME 2015/1 – © OECD 2015
112
A new method of estimating government-financed R&D in the higher education sector
was applied as from 1993.
Reclassification of institutes explains most of the growth of the R&D personnel in the
government sector between 1991 and 1992 and the decline in the following year.
As from 1991, the data for the government sector include an estimate for R&D
expenditures in the public health services.
Between 1985 and 1986, the “United Kingdom Atomic Energy Authority” was transferred
from the government sector to the business enterprise sector. Expenditure revisions
have been made back to 1985.
Due to lack of official data for the higher education sector, the OECD Secretariat has made
estimates for total researchers beginning 1999 and total R&D personnel beginning 1994.
As from 1995, the health objective in GBAORD has been broadened to include the total
net costs to National Health Service trusts of their involvement in R&D.
Oil company operations have been included in the United Kingdom TBP data as
from 1984. From 1996 onwards, the TBP data cover sale of patents and inventions, patent
licensing, trademark patterns and designs, technology-related services and R&D. TBP
data are published according to the new BPM6 as from 2003.
● For the United States, in the business sector, the funds from abroad previously included in
the business-financed BERD, are available separately since 2009. In the higher education
sector all fields of SSH are included from 2003 onwards.
Following a survey of Federally-Funded Research and Development Centers (FFRDCs)
in 2005, it was concluded that FFRDC R&D belongs in the government sector – rather than
the sector of the FFRDC administrator, as had been reported in the past. R&D expenditures
by FFRDCs were reclassified from the other three R&D performing sectors to the
government sector; previously published data were revised accordingly. Between 2003
and 2004, the method used to classify data by industry has been revised. This particularly
affects the ISIC category “wholesale trade” and consequently the BERD for total services.
US R&D data are generally comparable, but there are some areas of underestimation:
i) up to 2008, government sector R&D performance covers only federal government
activities; that by State and local government establishments is excluded;
ii) except for the government sector, the R&D data exclude capital expenditures; for the
business enterprise sector, depreciation is reported in place of gross capital expenditures.
Higher education (and national total) data were revised back to 1998 due to an improved
methodology that corrects for double-counting of R&D funds passed between institutions.
Breakdown by type of R&D (basic research, applied research, etc.) was also revised back
to 1998 in the business enterprise and higher education sectors due to improved estimation
procedures.
No data is available for total R&D personnel; only data for R&D scientists and engineers are
collected. The methodology for estimating researchers was changed as from 1985. In the
government, higher education and PNP sectors, the data since then refer to employed
doctoral scientists and engineers who report their primary work activity as research,
development or the management of R&D, plus, for the higher education sector, the number
of full-time equivalent graduate students with research assistantships averaging an
estimated 50% of their time engaged in R&D activities. As from 1985, researchers in the
ANNEX 1. NATIONAL SPECIFICATIONS
MAIN SCIENCE AND TECHNOLOGY INDICATORS: VOLUME 2015/1 – © OECD 2015
113
government sector exclude military personnel. As from 1987, higher education R&D
personnel also include those who report their primary work activity as design.
Due to lack of official data for the higher education sector, the total researchers figure is
an OECD estimate.
2009 GBAORD data also includes the one time incremental R&D funding legislated in the
American Recovery and Reinvestment Act of 2009. Beginning with the 2000 GBAORD
data, budgets for capital expenditure – “R&D plant” in national terminology – are included.
GBAORD data for earlier years relate to budgets for current costs only.
Up to 2000, the United States TBP data cover only royalties and licence fees. From 2001,
data also include “research, development and testing services”. Beginning 2006, new
statistics on total trade for several types of services are available for the first time. As
from 2006, TBP data include royalties and license fees related to industrial processes,
business format franchising fees, trademarks and other intangibles; research,
development and testing services; computer and data processing services; architectural,
engineering and other technical services; industrial engineering services.
Non-member economies● In Argentina, Frascati Manual definitions are followed. Since 1997, data for human resources
are strictly R&D. Before that, human resources data were expressed in terms of Science and
Technology Activities (STA), involving R&D and diffusion activities of S&T (library services,
training services, conferences, etc.). These have not been transferred to the OECD Database.
Since 2002, the source of funds data for private non-profit organisations, universities and
S&T public organisations are requested for R&D. Before 2002, these source of funds data
were requested in terms of STA. These data were converted into R&D by means of a
coefficient for each sector of performance. The main source of funds for science and
technology activities in Argentina is the National Budget.
● In China, the national breakdown by source of funds does not fully match with the
classification defined in the Frascati Manual. The R&D financed by the government, the
business enterprises and by abroad can be retrieved, but part of the expenditure has no
specific source of financing, i.e. self-raised funding (in particular for independent research
institutions), the funds from the higher education sector and left-over government grants
from previous years.
The government and higher education sectors cover all fields of NSE and SSH, while the
business enterprise sector only covers the fields of NSE. There are only few organisations
in the private non-profit sector. Hence no R&D survey has been carried out in this sector
and the data are not available.
From 2009, researcher data are collected according to the Frascati Manual definition of
researcher. Beforehand, this was only the case for independent research institutions,
while for the other sectors data were collected according to the UNESCO concept of
“scientist and engineer”.
In 2009, the survey coverage in the business and the government sectors has been
expanded.
Before 2000, all of the personnel data and 95% of the expenditure data in the business
enterprise sector are for large- and medium-sized enterprises only. Since 2000 however,
the survey covers almost all industries and all enterprises above a certain threshold.
In 2000 and 2004, a census of all enterprises was held, while in the intermediate years
data for small enterprises are estimated.
ANNEX 1. NATIONAL SPECIFICATIONS
MAIN SCIENCE AND TECHNOLOGY INDICATORS: VOLUME 2015/1 – © OECD 2015
114
Due to the reform of the S&T system, some government institutions have become
enterprises, and their R&D data have been added to the enterprise sector since 2000.
● In Romania, in 2011, R&D questionnaires have been redesigned for all sectors (and
merged with the Community Innovation Survey in the case of the business enterprise
sector). This has had an impact on the number of researchers in both the higher
education and business enterprise sectors. A substantial proportion of R&D expenditure
and R&D personnel reported in the data for the business enterprise sector are
performed/employed in public enterprises (57.4 and 62% respectively for the year 2003).
The higher education sector includes faculty hospitals. For some of these hospitals, as
well as for other types of medical centres, there are problems of delimitation between
R&D activities and health activities and in these cases no data is available on R&D
expenditures and personnel. The higher education sector does not include experimental
stations: given the specific nature of their activity, these are directly co-ordinated by the
Ministry of Agriculture, and therefore included in the business enterprise sector.
In 2003, a change in methodology for the allocation of GBAORD data by socio-economic
objectives has resulted in a break in series.
TBP data are published according to the new BPM6 as from 2013.
● In the Russian Federation, the business enterprise sector includes all organisations and
enterprises whose main activity is connected with the production of goods and services
for sale, including those owned by the state, and private non-profit institutions serving
the above-mentioned organisations. In practice however, R&D performed in this sector is
carried out mostly by industrial research institutes other than enterprises. This
particularity reflects the traditional organisation of Russian R&D.
Headcount data include full-time personnel only, and hence are underestimated, while
data in full-time equivalents (FTE) are calculated on the basis of both full-time and part-
time personnel. This explains why the FTE data are greater than the headcount data.
New budgetary procedures introduced in 2005 have resulted in items previously
classified as GBAORD being attributed to other headings and have affected the coverage
and breakdown by socio-economic objective.
● In Singapore, the Public Research Centres are located within the universities and draw
upon university expertise. They are closely linked with the universities and several have
“spun off” from university research groups. However, they are administratively separate
from the universities and funded by the Agency for Science, Technology and Research
(A*STAR) and industry. The centres have been included in the “Public Research Institutes
and Centres” category in the R&D survey since 1995. Until 1995, they were subsumed in
the higher education sector. This leads to a discontinuity in the statistics for the
government/public and higher education sectors between 1994 and 1995.
Data for TBP receipts do not include services with a technical content, unless covered
under “licensing of new technologies”.
● For the 2001/02 R&D survey in South Africa, no comprehensive business register was
available, nor was there any official register of the specific subset of those entities that
actually conduct R&D. However, lists of firms surveyed in previous R&D surveys, those
covered in previous technology audits, public listings of the top 200 companies in the
economy, as well as lists of firms that participate in public innovation and R&D support
programmes were available to the survey agency. These lists provided the basis for a
ANNEX 1. NATIONAL SPECIFICATIONS
MAIN SCIENCE AND TECHNOLOGY INDICATORS: VOLUME 2015/1 – © OECD 2015
115
purposive sample of all firms known to have R&D activities. There may however be an
underestimation of R&D expenditure by 10 to 15%.
● In Chinese Taipei, since 2003 the business sector includes R&D data of private
enterprises in the sectors of electricity, gas and water supply; construction; and services,
which were not surveyed before.
Postgraduate students engaged in R&D were not included in the higher education sector
until 2002.
Researchers must have a university degree or above.
TBP data do not include R&D performed abroad, services with a technical content, or
transactions involving trademarks, design, patterns (sale, licensing, franchising).

ISSN 2304-2761
Main Science and Technology Indicators: Volume 2015/1
© OECD 2015
117
ANNEX 2
Background economic indicators
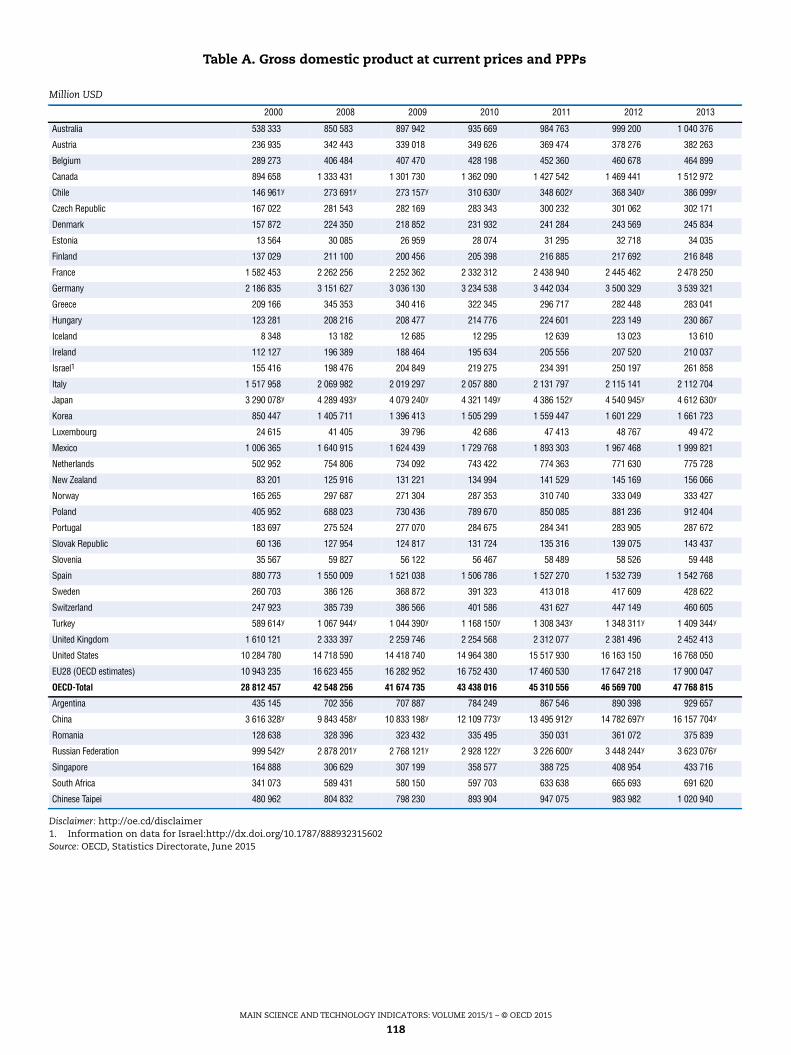
MAIN SCIENCE AND TECHNOLOGY INDICATORS: VOLUME 2015/1 – © OECD 2015
118
Disclaimer: http://oe.cd/disclaimer1. Information on data for Israel:http://dx.doi.org/10.1787/888932315602Source: OECD, Statistics Directorate, June 2015
Table A. Gross domestic product at current prices and PPPs
Million USD
2000 2008 2009 2010 2011 2012 2013
Australia 538 333 850 583 897 942 935 669 984 763 999 200 1 040 376
Austria 236 935 342 443 339 018 349 626 369 474 378 276 382 263
Belgium 289 273 406 484 407 470 428 198 452 360 460 678 464 899
Canada 894 658 1 333 431 1 301 730 1 362 090 1 427 542 1 469 441 1 512 972
Chile 146 961y 273 691y 273 157y 310 630y 348 602y 368 340y 386 099y
Czech Republic 167 022 281 543 282 169 283 343 300 232 301 062 302 171
Denmark 157 872 224 350 218 852 231 932 241 284 243 569 245 834
Estonia 13 564 30 085 26 959 28 074 31 295 32 718 34 035
Finland 137 029 211 100 200 456 205 398 216 885 217 692 216 848
France 1 582 453 2 262 256 2 252 362 2 332 312 2 438 940 2 445 462 2 478 250
Germany 2 186 835 3 151 627 3 036 130 3 234 538 3 442 034 3 500 329 3 539 321
Greece 209 166 345 353 340 416 322 345 296 717 282 448 283 041
Hungary 123 281 208 216 208 477 214 776 224 601 223 149 230 867
Iceland 8 348 13 182 12 685 12 295 12 639 13 023 13 610
Ireland 112 127 196 389 188 464 195 634 205 556 207 520 210 037
Israel1 155 416 198 476 204 849 219 275 234 391 250 197 261 858
Italy 1 517 958 2 069 982 2 019 297 2 057 880 2 131 797 2 115 141 2 112 704
Japan 3 290 078y 4 289 493y 4 079 240y 4 321 149y 4 386 152y 4 540 945y 4 612 630y
Korea 850 447 1 405 711 1 396 413 1 505 299 1 559 447 1 601 229 1 661 723
Luxembourg 24 615 41 405 39 796 42 686 47 413 48 767 49 472
Mexico 1 006 365 1 640 915 1 624 439 1 729 768 1 893 303 1 967 468 1 999 821
Netherlands 502 952 754 806 734 092 743 422 774 363 771 630 775 728
New Zealand 83 201 125 916 131 221 134 994 141 529 145 169 156 066
Norway 165 265 297 687 271 304 287 353 310 740 333 049 333 427
Poland 405 952 688 023 730 436 789 670 850 085 881 236 912 404
Portugal 183 697 275 524 277 070 284 675 284 341 283 905 287 672
Slovak Republic 60 136 127 954 124 817 131 724 135 316 139 075 143 437
Slovenia 35 567 59 827 56 122 56 467 58 489 58 526 59 448
Spain 880 773 1 550 009 1 521 038 1 506 786 1 527 270 1 532 739 1 542 768
Sweden 260 703 386 126 368 872 391 323 413 018 417 609 428 622
Switzerland 247 923 385 739 386 566 401 586 431 627 447 149 460 605
Turkey 589 614y 1 067 944y 1 044 390y 1 168 150y 1 308 343y 1 348 311y 1 409 344y
United Kingdom 1 610 121 2 333 397 2 259 746 2 254 568 2 312 077 2 381 496 2 452 413
United States 10 284 780 14 718 590 14 418 740 14 964 380 15 517 930 16 163 150 16 768 050
EU28 (OECD estimates) 10 943 235 16 623 455 16 282 952 16 752 430 17 460 530 17 647 218 17 900 047
OECD-Total 28 812 457 42 548 256 41 674 735 43 438 016 45 310 556 46 569 700 47 768 815
Argentina 435 145 702 356 707 887 784 249 867 546 890 398 929 657
China 3 616 328y 9 843 458y 10 833 198y 12 109 773y 13 495 912y 14 782 697y 16 157 704y
Romania 128 638 328 396 323 432 335 495 350 031 361 072 375 839
Russian Federation 999 542y 2 878 201y 2 768 121y 2 928 122y 3 226 600y 3 448 244y 3 623 076y
Singapore 164 888 306 629 307 199 358 577 388 725 408 954 433 716
South Africa 341 073 589 431 580 150 597 703 633 638 665 693 691 620
Chinese Taipei 480 962 804 832 798 230 893 904 947 075 983 982 1 020 940
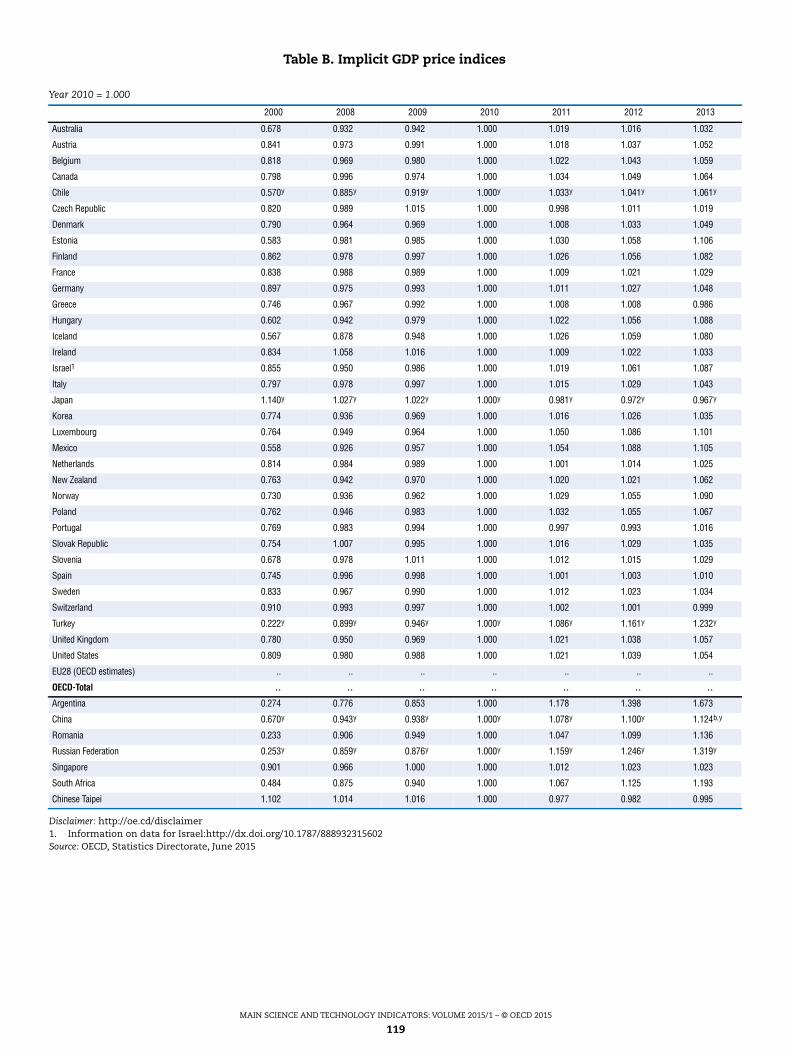
MAIN SCIENCE AND TECHNOLOGY INDICATORS: VOLUME 2015/1 – © OECD 2015
119
Disclaimer: http://oe.cd/disclaimer1. Information on data for Israel:http://dx.doi.org/10.1787/888932315602Source: OECD, Statistics Directorate, June 2015
Table B. Implicit GDP price indices
Year 2010 = 1.000
2000 2008 2009 2010 2011 2012 2013
Australia 0.678 0.932 0.942 1.000 1.019 1.016 1.032
Austria 0.841 0.973 0.991 1.000 1.018 1.037 1.052
Belgium 0.818 0.969 0.980 1.000 1.022 1.043 1.059
Canada 0.798 0.996 0.974 1.000 1.034 1.049 1.064
Chile 0.570y 0.885y 0.919y 1.000y 1.033y 1.041y 1.061y
Czech Republic 0.820 0.989 1.015 1.000 0.998 1.011 1.019
Denmark 0.790 0.964 0.969 1.000 1.008 1.033 1.049
Estonia 0.583 0.981 0.985 1.000 1.030 1.058 1.106
Finland 0.862 0.978 0.997 1.000 1.026 1.056 1.082
France 0.838 0.988 0.989 1.000 1.009 1.021 1.029
Germany 0.897 0.975 0.993 1.000 1.011 1.027 1.048
Greece 0.746 0.967 0.992 1.000 1.008 1.008 0.986
Hungary 0.602 0.942 0.979 1.000 1.022 1.056 1.088
Iceland 0.567 0.878 0.948 1.000 1.026 1.059 1.080
Ireland 0.834 1.058 1.016 1.000 1.009 1.022 1.033
Israel1 0.855 0.950 0.986 1.000 1.019 1.061 1.087
Italy 0.797 0.978 0.997 1.000 1.015 1.029 1.043
Japan 1.140y 1.027y 1.022y 1.000y 0.981y 0.972y 0.967y
Korea 0.774 0.936 0.969 1.000 1.016 1.026 1.035
Luxembourg 0.764 0.949 0.964 1.000 1.050 1.086 1.101
Mexico 0.558 0.926 0.957 1.000 1.054 1.088 1.105
Netherlands 0.814 0.984 0.989 1.000 1.001 1.014 1.025
New Zealand 0.763 0.942 0.970 1.000 1.020 1.021 1.062
Norway 0.730 0.936 0.962 1.000 1.029 1.055 1.090
Poland 0.762 0.946 0.983 1.000 1.032 1.055 1.067
Portugal 0.769 0.983 0.994 1.000 0.997 0.993 1.016
Slovak Republic 0.754 1.007 0.995 1.000 1.016 1.029 1.035
Slovenia 0.678 0.978 1.011 1.000 1.012 1.015 1.029
Spain 0.745 0.996 0.998 1.000 1.001 1.003 1.010
Sweden 0.833 0.967 0.990 1.000 1.012 1.023 1.034
Switzerland 0.910 0.993 0.997 1.000 1.002 1.001 0.999
Turkey 0.222y 0.899y 0.946y 1.000y 1.086y 1.161y 1.232y
United Kingdom 0.780 0.950 0.969 1.000 1.021 1.038 1.057
United States 0.809 0.980 0.988 1.000 1.021 1.039 1.054
EU28 (OECD estimates) .. .. .. .. .. .. ..
OECD-Total .. .. .. .. .. .. ..
Argentina 0.274 0.776 0.853 1.000 1.178 1.398 1.673
China 0.670y 0.943y 0.938y 1.000y 1.078y 1.100y 1.124b,y
Romania 0.233 0.906 0.949 1.000 1.047 1.099 1.136
Russian Federation 0.253y 0.859y 0.876y 1.000y 1.159y 1.246y 1.319y
Singapore 0.901 0.966 1.000 1.000 1.012 1.023 1.023
South Africa 0.484 0.875 0.940 1.000 1.067 1.125 1.193
Chinese Taipei 1.102 1.014 1.016 1.000 0.977 0.982 0.995
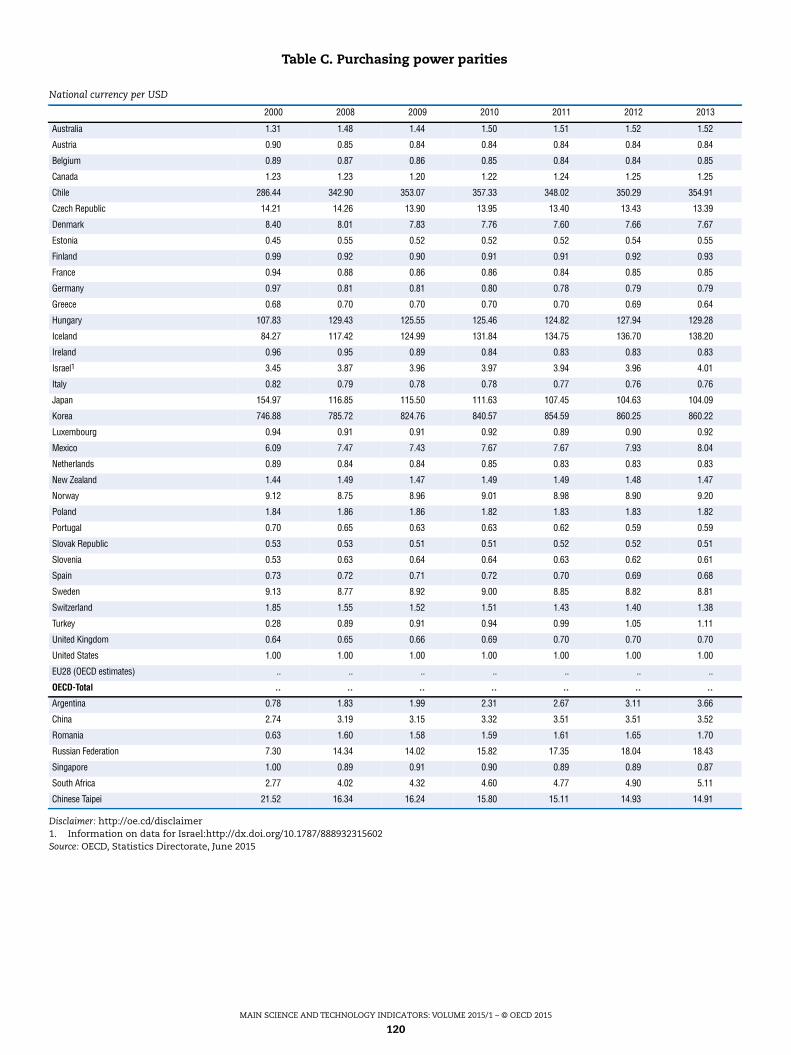
MAIN SCIENCE AND TECHNOLOGY INDICATORS: VOLUME 2015/1 – © OECD 2015
120
Disclaimer: http://oe.cd/disclaimer1. Information on data for Israel:http://dx.doi.org/10.1787/888932315602Source: OECD, Statistics Directorate, June 2015
Table C. Purchasing power parities
National currency per USD
2000 2008 2009 2010 2011 2012 2013
Australia 1.31 1.48 1.44 1.50 1.51 1.52 1.52
Austria 0.90 0.85 0.84 0.84 0.84 0.84 0.84
Belgium 0.89 0.87 0.86 0.85 0.84 0.84 0.85
Canada 1.23 1.23 1.20 1.22 1.24 1.25 1.25
Chile 286.44 342.90 353.07 357.33 348.02 350.29 354.91
Czech Republic 14.21 14.26 13.90 13.95 13.40 13.43 13.39
Denmark 8.40 8.01 7.83 7.76 7.60 7.66 7.67
Estonia 0.45 0.55 0.52 0.52 0.52 0.54 0.55
Finland 0.99 0.92 0.90 0.91 0.91 0.92 0.93
France 0.94 0.88 0.86 0.86 0.84 0.85 0.85
Germany 0.97 0.81 0.81 0.80 0.78 0.79 0.79
Greece 0.68 0.70 0.70 0.70 0.70 0.69 0.64
Hungary 107.83 129.43 125.55 125.46 124.82 127.94 129.28
Iceland 84.27 117.42 124.99 131.84 134.75 136.70 138.20
Ireland 0.96 0.95 0.89 0.84 0.83 0.83 0.83
Israel1 3.45 3.87 3.96 3.97 3.94 3.96 4.01
Italy 0.82 0.79 0.78 0.78 0.77 0.76 0.76
Japan 154.97 116.85 115.50 111.63 107.45 104.63 104.09
Korea 746.88 785.72 824.76 840.57 854.59 860.25 860.22
Luxembourg 0.94 0.91 0.91 0.92 0.89 0.90 0.92
Mexico 6.09 7.47 7.43 7.67 7.67 7.93 8.04
Netherlands 0.89 0.84 0.84 0.85 0.83 0.83 0.83
New Zealand 1.44 1.49 1.47 1.49 1.49 1.48 1.47
Norway 9.12 8.75 8.96 9.01 8.98 8.90 9.20
Poland 1.84 1.86 1.86 1.82 1.83 1.83 1.82
Portugal 0.70 0.65 0.63 0.63 0.62 0.59 0.59
Slovak Republic 0.53 0.53 0.51 0.51 0.52 0.52 0.51
Slovenia 0.53 0.63 0.64 0.64 0.63 0.62 0.61
Spain 0.73 0.72 0.71 0.72 0.70 0.69 0.68
Sweden 9.13 8.77 8.92 9.00 8.85 8.82 8.81
Switzerland 1.85 1.55 1.52 1.51 1.43 1.40 1.38
Turkey 0.28 0.89 0.91 0.94 0.99 1.05 1.11
United Kingdom 0.64 0.65 0.66 0.69 0.70 0.70 0.70
United States 1.00 1.00 1.00 1.00 1.00 1.00 1.00
EU28 (OECD estimates) .. .. .. .. .. .. ..
OECD-Total .. .. .. .. .. .. ..
Argentina 0.78 1.83 1.99 2.31 2.67 3.11 3.66
China 2.74 3.19 3.15 3.32 3.51 3.51 3.52
Romania 0.63 1.60 1.58 1.59 1.61 1.65 1.70
Russian Federation 7.30 14.34 14.02 15.82 17.35 18.04 18.43
Singapore 1.00 0.89 0.91 0.90 0.89 0.89 0.87
South Africa 2.77 4.02 4.32 4.60 4.77 4.90 5.11
Chinese Taipei 21.52 16.34 16.24 15.80 15.11 14.93 14.91
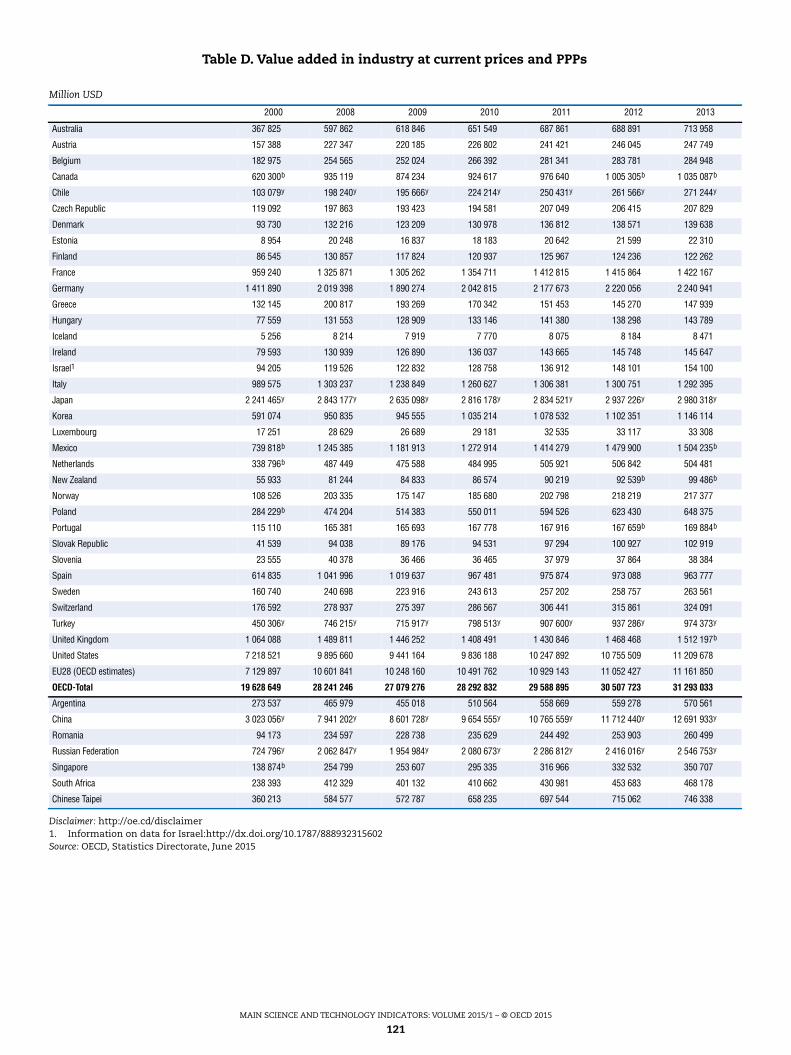
MAIN SCIENCE AND TECHNOLOGY INDICATORS: VOLUME 2015/1 – © OECD 2015
121
Disclaimer: http://oe.cd/disclaimer1. Information on data for Israel:http://dx.doi.org/10.1787/888932315602Source: OECD, Statistics Directorate, June 2015
Table D. Value added in industry at current prices and PPPs
Million USD
2000 2008 2009 2010 2011 2012 2013
Australia 367 825 597 862 618 846 651 549 687 861 688 891 713 958
Austria 157 388 227 347 220 185 226 802 241 421 246 045 247 749
Belgium 182 975 254 565 252 024 266 392 281 341 283 781 284 948
Canada 620 300b 935 119 874 234 924 617 976 640 1 005 305b 1 035 087b
Chile 103 079y 198 240y 195 666y 224 214y 250 431y 261 566y 271 244y
Czech Republic 119 092 197 863 193 423 194 581 207 049 206 415 207 829
Denmark 93 730 132 216 123 209 130 978 136 812 138 571 139 638
Estonia 8 954 20 248 16 837 18 183 20 642 21 599 22 310
Finland 86 545 130 857 117 824 120 937 125 967 124 236 122 262
France 959 240 1 325 871 1 305 262 1 354 711 1 412 815 1 415 864 1 422 167
Germany 1 411 890 2 019 398 1 890 274 2 042 815 2 177 673 2 220 056 2 240 941
Greece 132 145 200 817 193 269 170 342 151 453 145 270 147 939
Hungary 77 559 131 553 128 909 133 146 141 380 138 298 143 789
Iceland 5 256 8 214 7 919 7 770 8 075 8 184 8 471
Ireland 79 593 130 939 126 890 136 037 143 665 145 748 145 647
Israel1 94 205 119 526 122 832 128 758 136 912 148 101 154 100
Italy 989 575 1 303 237 1 238 849 1 260 627 1 306 381 1 300 751 1 292 395
Japan 2 241 465y 2 843 177y 2 635 098y 2 816 178y 2 834 521y 2 937 226y 2 980 318y
Korea 591 074 950 835 945 555 1 035 214 1 078 532 1 102 351 1 146 114
Luxembourg 17 251 28 629 26 689 29 181 32 535 33 117 33 308
Mexico 739 818b 1 245 385 1 181 913 1 272 914 1 414 279 1 479 900 1 504 235b
Netherlands 338 796b 487 449 475 588 484 995 505 921 506 842 504 481
New Zealand 55 933 81 244 84 833 86 574 90 219 92 539b 99 486b
Norway 108 526 203 335 175 147 185 680 202 798 218 219 217 377
Poland 284 229b 474 204 514 383 550 011 594 526 623 430 648 375
Portugal 115 110 165 381 165 693 167 778 167 916 167 659b 169 884b
Slovak Republic 41 539 94 038 89 176 94 531 97 294 100 927 102 919
Slovenia 23 555 40 378 36 466 36 465 37 979 37 864 38 384
Spain 614 835 1 041 996 1 019 637 967 481 975 874 973 088 963 777
Sweden 160 740 240 698 223 916 243 613 257 202 258 757 263 561
Switzerland 176 592 278 937 275 397 286 567 306 441 315 861 324 091
Turkey 450 306y 746 215y 715 917y 798 513y 907 600y 937 286y 974 373y
United Kingdom 1 064 088 1 489 811 1 446 252 1 408 491 1 430 846 1 468 468 1 512 197b
United States 7 218 521 9 895 660 9 441 164 9 836 188 10 247 892 10 755 509 11 209 678
EU28 (OECD estimates) 7 129 897 10 601 841 10 248 160 10 491 762 10 929 143 11 052 427 11 161 850
OECD-Total 19 628 649 28 241 246 27 079 276 28 292 832 29 588 895 30 507 723 31 293 033
Argentina 273 537 465 979 455 018 510 564 558 669 559 278 570 561
China 3 023 056y 7 941 202y 8 601 728y 9 654 555y 10 765 559y 11 712 440y 12 691 933y
Romania 94 173 234 597 228 738 235 629 244 492 253 903 260 499
Russian Federation 724 796y 2 062 847y 1 954 984y 2 080 673y 2 286 812y 2 416 016y 2 546 753y
Singapore 138 874b 254 799 253 607 295 335 316 966 332 532 350 707
South Africa 238 393 412 329 401 132 410 662 430 981 453 683 468 178
Chinese Taipei 360 213 584 577 572 787 658 235 697 544 715 062 746 338
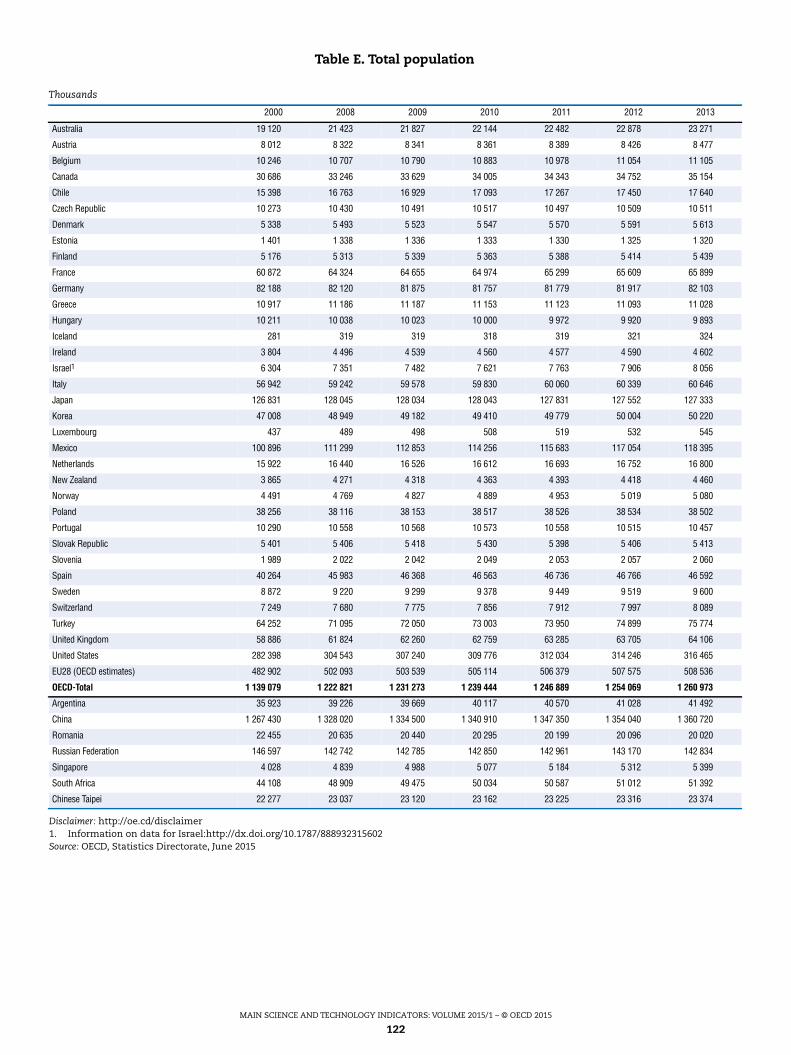
MAIN SCIENCE AND TECHNOLOGY INDICATORS: VOLUME 2015/1 – © OECD 2015
122
Disclaimer: http://oe.cd/disclaimer1. Information on data for Israel:http://dx.doi.org/10.1787/888932315602Source: OECD, Statistics Directorate, June 2015
Table E. Total population
Thousands
2000 2008 2009 2010 2011 2012 2013
Australia 19 120 21 423 21 827 22 144 22 482 22 878 23 271
Austria 8 012 8 322 8 341 8 361 8 389 8 426 8 477
Belgium 10 246 10 707 10 790 10 883 10 978 11 054 11 105
Canada 30 686 33 246 33 629 34 005 34 343 34 752 35 154
Chile 15 398 16 763 16 929 17 093 17 267 17 450 17 640
Czech Republic 10 273 10 430 10 491 10 517 10 497 10 509 10 511
Denmark 5 338 5 493 5 523 5 547 5 570 5 591 5 613
Estonia 1 401 1 338 1 336 1 333 1 330 1 325 1 320
Finland 5 176 5 313 5 339 5 363 5 388 5 414 5 439
France 60 872 64 324 64 655 64 974 65 299 65 609 65 899
Germany 82 188 82 120 81 875 81 757 81 779 81 917 82 103
Greece 10 917 11 186 11 187 11 153 11 123 11 093 11 028
Hungary 10 211 10 038 10 023 10 000 9 972 9 920 9 893
Iceland 281 319 319 318 319 321 324
Ireland 3 804 4 496 4 539 4 560 4 577 4 590 4 602
Israel1 6 304 7 351 7 482 7 621 7 763 7 906 8 056
Italy 56 942 59 242 59 578 59 830 60 060 60 339 60 646
Japan 126 831 128 045 128 034 128 043 127 831 127 552 127 333
Korea 47 008 48 949 49 182 49 410 49 779 50 004 50 220
Luxembourg 437 489 498 508 519 532 545
Mexico 100 896 111 299 112 853 114 256 115 683 117 054 118 395
Netherlands 15 922 16 440 16 526 16 612 16 693 16 752 16 800
New Zealand 3 865 4 271 4 318 4 363 4 393 4 418 4 460
Norway 4 491 4 769 4 827 4 889 4 953 5 019 5 080
Poland 38 256 38 116 38 153 38 517 38 526 38 534 38 502
Portugal 10 290 10 558 10 568 10 573 10 558 10 515 10 457
Slovak Republic 5 401 5 406 5 418 5 430 5 398 5 406 5 413
Slovenia 1 989 2 022 2 042 2 049 2 053 2 057 2 060
Spain 40 264 45 983 46 368 46 563 46 736 46 766 46 592
Sweden 8 872 9 220 9 299 9 378 9 449 9 519 9 600
Switzerland 7 249 7 680 7 775 7 856 7 912 7 997 8 089
Turkey 64 252 71 095 72 050 73 003 73 950 74 899 75 774
United Kingdom 58 886 61 824 62 260 62 759 63 285 63 705 64 106
United States 282 398 304 543 307 240 309 776 312 034 314 246 316 465
EU28 (OECD estimates) 482 902 502 093 503 539 505 114 506 379 507 575 508 536
OECD-Total 1 139 079 1 222 821 1 231 273 1 239 444 1 246 889 1 254 069 1 260 973
Argentina 35 923 39 226 39 669 40 117 40 570 41 028 41 492
China 1 267 430 1 328 020 1 334 500 1 340 910 1 347 350 1 354 040 1 360 720
Romania 22 455 20 635 20 440 20 295 20 199 20 096 20 020
Russian Federation 146 597 142 742 142 785 142 850 142 961 143 170 142 834
Singapore 4 028 4 839 4 988 5 077 5 184 5 312 5 399
South Africa 44 108 48 909 49 475 50 034 50 587 51 012 51 392
Chinese Taipei 22 277 23 037 23 120 23 162 23 225 23 316 23 374
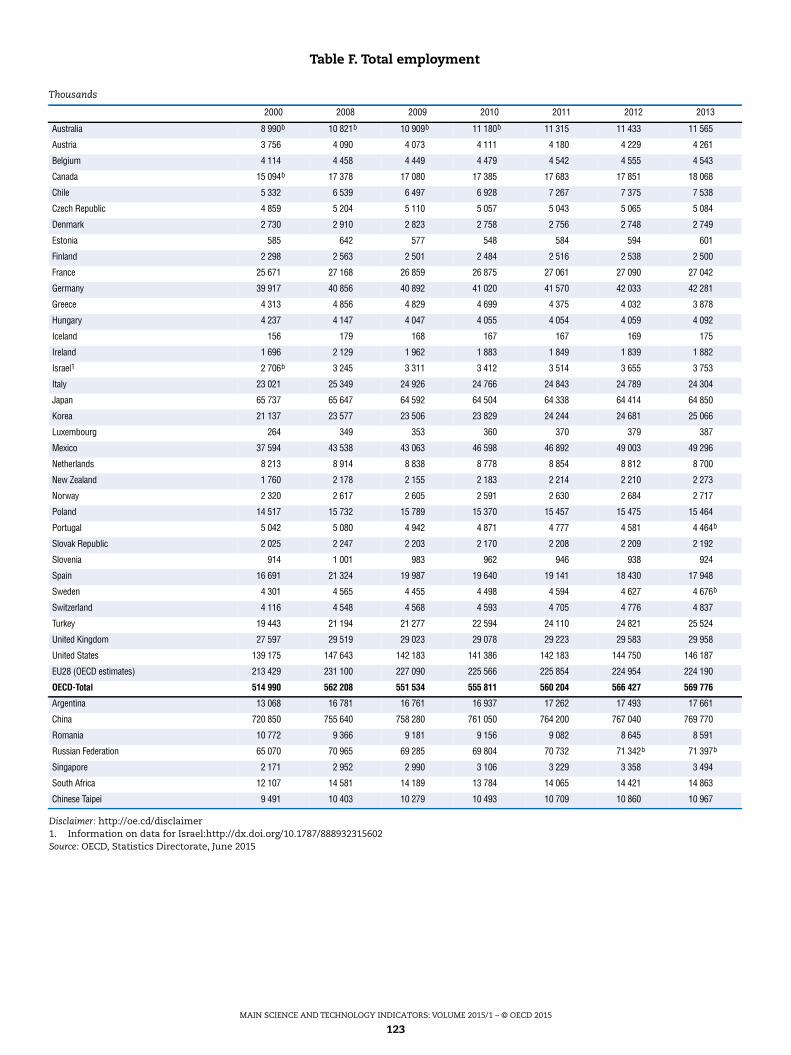
MAIN SCIENCE AND TECHNOLOGY INDICATORS: VOLUME 2015/1 – © OECD 2015
123
Disclaimer: http://oe.cd/disclaimer1. Information on data for Israel:http://dx.doi.org/10.1787/888932315602Source: OECD, Statistics Directorate, June 2015
Table F. Total employment
Thousands
2000 2008 2009 2010 2011 2012 2013
Australia 8 990b 10 821b 10 909b 11 180b 11 315 11 433 11 565
Austria 3 756 4 090 4 073 4 111 4 180 4 229 4 261
Belgium 4 114 4 458 4 449 4 479 4 542 4 555 4 543
Canada 15 094b 17 378 17 080 17 385 17 683 17 851 18 068
Chile 5 332 6 539 6 497 6 928 7 267 7 375 7 538
Czech Republic 4 859 5 204 5 110 5 057 5 043 5 065 5 084
Denmark 2 730 2 910 2 823 2 758 2 756 2 748 2 749
Estonia 585 642 577 548 584 594 601
Finland 2 298 2 563 2 501 2 484 2 516 2 538 2 500
France 25 671 27 168 26 859 26 875 27 061 27 090 27 042
Germany 39 917 40 856 40 892 41 020 41 570 42 033 42 281
Greece 4 313 4 856 4 829 4 699 4 375 4 032 3 878
Hungary 4 237 4 147 4 047 4 055 4 054 4 059 4 092
Iceland 156 179 168 167 167 169 175
Ireland 1 696 2 129 1 962 1 883 1 849 1 839 1 882
Israel1 2 706b 3 245 3 311 3 412 3 514 3 655 3 753
Italy 23 021 25 349 24 926 24 766 24 843 24 789 24 304
Japan 65 737 65 647 64 592 64 504 64 338 64 414 64 850
Korea 21 137 23 577 23 506 23 829 24 244 24 681 25 066
Luxembourg 264 349 353 360 370 379 387
Mexico 37 594 43 538 43 063 46 598 46 892 49 003 49 296
Netherlands 8 213 8 914 8 838 8 778 8 854 8 812 8 700
New Zealand 1 760 2 178 2 155 2 183 2 214 2 210 2 273
Norway 2 320 2 617 2 605 2 591 2 630 2 684 2 717
Poland 14 517 15 732 15 789 15 370 15 457 15 475 15 464
Portugal 5 042 5 080 4 942 4 871 4 777 4 581 4 464b
Slovak Republic 2 025 2 247 2 203 2 170 2 208 2 209 2 192
Slovenia 914 1 001 983 962 946 938 924
Spain 16 691 21 324 19 987 19 640 19 141 18 430 17 948
Sweden 4 301 4 565 4 455 4 498 4 594 4 627 4 676b
Switzerland 4 116 4 548 4 568 4 593 4 705 4 776 4 837
Turkey 19 443 21 194 21 277 22 594 24 110 24 821 25 524
United Kingdom 27 597 29 519 29 023 29 078 29 223 29 583 29 958
United States 139 175 147 643 142 183 141 386 142 183 144 750 146 187
EU28 (OECD estimates) 213 429 231 100 227 090 225 566 225 854 224 954 224 190
OECD-Total 514 990 562 208 551 534 555 811 560 204 566 427 569 776
Argentina 13 068 16 781 16 761 16 937 17 262 17 493 17 661
China 720 850 755 640 758 280 761 050 764 200 767 040 769 770
Romania 10 772 9 366 9 181 9 156 9 082 8 645 8 591
Russian Federation 65 070 70 965 69 285 69 804 70 732 71 342b 71 397b
Singapore 2 171 2 952 2 990 3 106 3 229 3 358 3 494
South Africa 12 107 14 581 14 189 13 784 14 065 14 421 14 863
Chinese Taipei 9 491 10 403 10 279 10 493 10 709 10 860 10 967
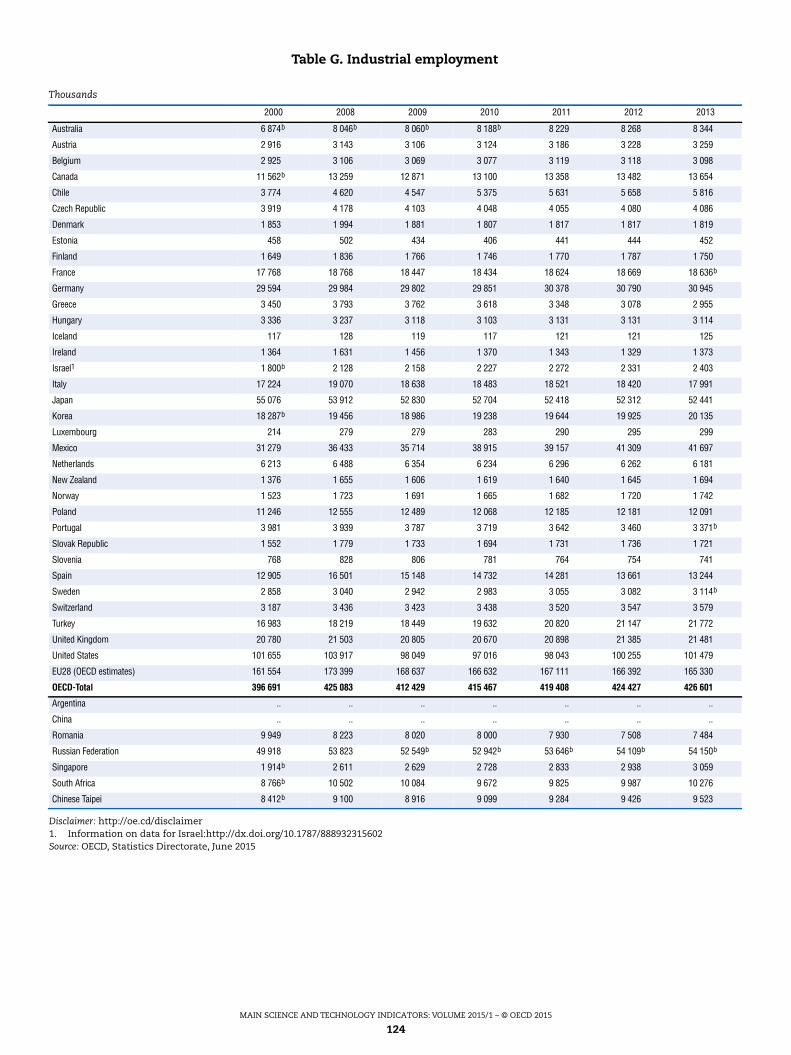
MAIN SCIENCE AND TECHNOLOGY INDICATORS: VOLUME 2015/1 – © OECD 2015
124
Disclaimer: http://oe.cd/disclaimer1. Information on data for Israel:http://dx.doi.org/10.1787/888932315602Source: OECD, Statistics Directorate, June 2015
Table G. Industrial employment
Thousands
2000 2008 2009 2010 2011 2012 2013
Australia 6 874b 8 046b 8 060b 8 188b 8 229 8 268 8 344
Austria 2 916 3 143 3 106 3 124 3 186 3 228 3 259
Belgium 2 925 3 106 3 069 3 077 3 119 3 118 3 098
Canada 11 562b 13 259 12 871 13 100 13 358 13 482 13 654
Chile 3 774 4 620 4 547 5 375 5 631 5 658 5 816
Czech Republic 3 919 4 178 4 103 4 048 4 055 4 080 4 086
Denmark 1 853 1 994 1 881 1 807 1 817 1 817 1 819
Estonia 458 502 434 406 441 444 452
Finland 1 649 1 836 1 766 1 746 1 770 1 787 1 750
France 17 768 18 768 18 447 18 434 18 624 18 669 18 636b
Germany 29 594 29 984 29 802 29 851 30 378 30 790 30 945
Greece 3 450 3 793 3 762 3 618 3 348 3 078 2 955
Hungary 3 336 3 237 3 118 3 103 3 131 3 131 3 114
Iceland 117 128 119 117 121 121 125
Ireland 1 364 1 631 1 456 1 370 1 343 1 329 1 373
Israel1 1 800b 2 128 2 158 2 227 2 272 2 331 2 403
Italy 17 224 19 070 18 638 18 483 18 521 18 420 17 991
Japan 55 076 53 912 52 830 52 704 52 418 52 312 52 441
Korea 18 287b 19 456 18 986 19 238 19 644 19 925 20 135
Luxembourg 214 279 279 283 290 295 299
Mexico 31 279 36 433 35 714 38 915 39 157 41 309 41 697
Netherlands 6 213 6 488 6 354 6 234 6 296 6 262 6 181
New Zealand 1 376 1 655 1 606 1 619 1 640 1 645 1 694
Norway 1 523 1 723 1 691 1 665 1 682 1 720 1 742
Poland 11 246 12 555 12 489 12 068 12 185 12 181 12 091
Portugal 3 981 3 939 3 787 3 719 3 642 3 460 3 371b
Slovak Republic 1 552 1 779 1 733 1 694 1 731 1 736 1 721
Slovenia 768 828 806 781 764 754 741
Spain 12 905 16 501 15 148 14 732 14 281 13 661 13 244
Sweden 2 858 3 040 2 942 2 983 3 055 3 082 3 114b
Switzerland 3 187 3 436 3 423 3 438 3 520 3 547 3 579
Turkey 16 983 18 219 18 449 19 632 20 820 21 147 21 772
United Kingdom 20 780 21 503 20 805 20 670 20 898 21 385 21 481
United States 101 655 103 917 98 049 97 016 98 043 100 255 101 479
EU28 (OECD estimates) 161 554 173 399 168 637 166 632 167 111 166 392 165 330
OECD-Total 396 691 425 083 412 429 415 467 419 408 424 427 426 601
Argentina .. .. .. .. .. .. ..
China .. .. .. .. .. .. ..
Romania 9 949 8 223 8 020 8 000 7 930 7 508 7 484
Russian Federation 49 918 53 823 52 549b 52 942b 53 646b 54 109b 54 150b
Singapore 1 914b 2 611 2 629 2 728 2 833 2 938 3 059
South Africa 8 766b 10 502 10 084 9 672 9 825 9 987 10 276
Chinese Taipei 8 412b 9 100 8 916 9 099 9 284 9 426 9 523
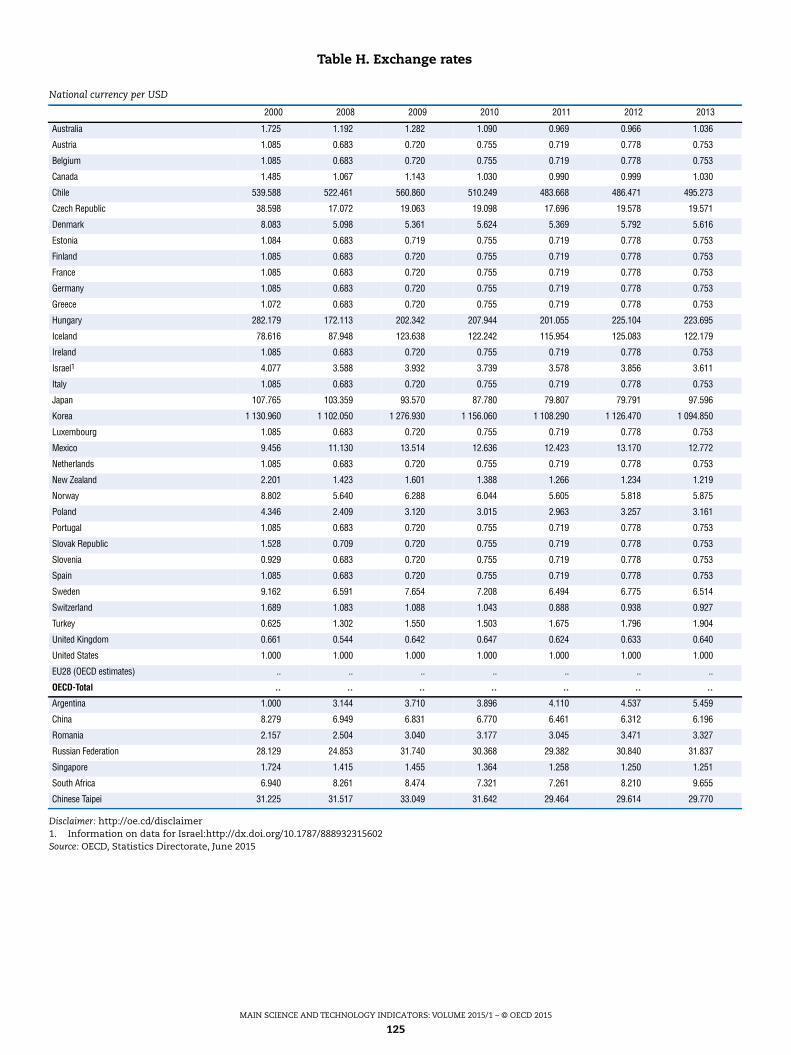
MAIN SCIENCE AND TECHNOLOGY INDICATORS: VOLUME 2015/1 – © OECD 2015
125
Disclaimer: http://oe.cd/disclaimer1. Information on data for Israel:http://dx.doi.org/10.1787/888932315602Source: OECD, Statistics Directorate, June 2015
Table H. Exchange rates
National currency per USD
2000 2008 2009 2010 2011 2012 2013
Australia 1.725 1.192 1.282 1.090 0.969 0.966 1.036
Austria 1.085 0.683 0.720 0.755 0.719 0.778 0.753
Belgium 1.085 0.683 0.720 0.755 0.719 0.778 0.753
Canada 1.485 1.067 1.143 1.030 0.990 0.999 1.030
Chile 539.588 522.461 560.860 510.249 483.668 486.471 495.273
Czech Republic 38.598 17.072 19.063 19.098 17.696 19.578 19.571
Denmark 8.083 5.098 5.361 5.624 5.369 5.792 5.616
Estonia 1.084 0.683 0.719 0.755 0.719 0.778 0.753
Finland 1.085 0.683 0.720 0.755 0.719 0.778 0.753
France 1.085 0.683 0.720 0.755 0.719 0.778 0.753
Germany 1.085 0.683 0.720 0.755 0.719 0.778 0.753
Greece 1.072 0.683 0.720 0.755 0.719 0.778 0.753
Hungary 282.179 172.113 202.342 207.944 201.055 225.104 223.695
Iceland 78.616 87.948 123.638 122.242 115.954 125.083 122.179
Ireland 1.085 0.683 0.720 0.755 0.719 0.778 0.753
Israel1 4.077 3.588 3.932 3.739 3.578 3.856 3.611
Italy 1.085 0.683 0.720 0.755 0.719 0.778 0.753
Japan 107.765 103.359 93.570 87.780 79.807 79.791 97.596
Korea 1 130.960 1 102.050 1 276.930 1 156.060 1 108.290 1 126.470 1 094.850
Luxembourg 1.085 0.683 0.720 0.755 0.719 0.778 0.753
Mexico 9.456 11.130 13.514 12.636 12.423 13.170 12.772
Netherlands 1.085 0.683 0.720 0.755 0.719 0.778 0.753
New Zealand 2.201 1.423 1.601 1.388 1.266 1.234 1.219
Norway 8.802 5.640 6.288 6.044 5.605 5.818 5.875
Poland 4.346 2.409 3.120 3.015 2.963 3.257 3.161
Portugal 1.085 0.683 0.720 0.755 0.719 0.778 0.753
Slovak Republic 1.528 0.709 0.720 0.755 0.719 0.778 0.753
Slovenia 0.929 0.683 0.720 0.755 0.719 0.778 0.753
Spain 1.085 0.683 0.720 0.755 0.719 0.778 0.753
Sweden 9.162 6.591 7.654 7.208 6.494 6.775 6.514
Switzerland 1.689 1.083 1.088 1.043 0.888 0.938 0.927
Turkey 0.625 1.302 1.550 1.503 1.675 1.796 1.904
United Kingdom 0.661 0.544 0.642 0.647 0.624 0.633 0.640
United States 1.000 1.000 1.000 1.000 1.000 1.000 1.000
EU28 (OECD estimates) .. .. .. .. .. .. ..
OECD-Total .. .. .. .. .. .. ..
Argentina 1.000 3.144 3.710 3.896 4.110 4.537 5.459
China 8.279 6.949 6.831 6.770 6.461 6.312 6.196
Romania 2.157 2.504 3.040 3.177 3.045 3.471 3.327
Russian Federation 28.129 24.853 31.740 30.368 29.382 30.840 31.837
Singapore 1.724 1.415 1.455 1.364 1.258 1.250 1.251
South Africa 6.940 8.261 8.474 7.321 7.261 8.210 9.655
Chinese Taipei 31.225 31.517 33.049 31.642 29.464 29.614 29.770

ISSN 2304-2761
Main Science and Technology Indicators: Volume 2015/1
© OECD 2015
127
ANNEX 3
List of indicators for the electronic publication
ANNEX 3. LIST OF INDICATORS FOR THE ELECTRONIC PUBLICATION
MAIN SCIENCE AND TECHNOLOGY INDICATORS: VOLUME 2015/1 – © OECD 2015
128
The electronic version of the MSTI publication contains, in addition to the indicators published in
this volume, most of those which were published in the previous version of the publication before its
revision. These are presented as of 1981.
1. Gross Domestic Expenditure on R&D – GERD (million national currency)
2. GERD (million current PPP $)
3. GERD as a percentage of GDP
4. GERD – (million 2010 dollars – constant prices and PPP)
5. GERD – Compound annual growth rate (constant prices)
6. GERD per capita population (current PPP $)
7. Estimated civil GERD as a percentage of GDP
8. Basic research expenditure as a percentage of GDP
9. Total researchers (FTE)
10. Total researchers – Compound annual growth rate
11. Total researchers per thousand total employment
12. Total researchers per thousand labour force
13. Total R&D personnel (FTE)
14. Total R&D personnel – Compound annual growth rate
15. Total R&D personnel per thousand employment
16. Total R&D personnel per thousand labour force
17. Industry-financed GERD as a percentage of GDP
18. Government-financed GERD as a percentage of GDP
19. Percentage of GERD financed by industry
20. Percentage of GERD financed by government
21. Percentage of GERD financed by other national sources
22. Percentage of GERD financed by abroad
23. Percentage of GERD performed by the business enterprise sector
24. Percentage of GERD performed by the higher education sector
25. Percentage of GERD performed by the government sector
26. Percentage of GERD performed by the private non-profit sector
27. Total researchers (headcount)
28. Women researchers (headcount)
29. Women researchers as a percentage of total researchers (headcount)
30. Business enterprise sector: Total researchers (headcount)
31. Business enterprise sector: Women researchers (headcount)
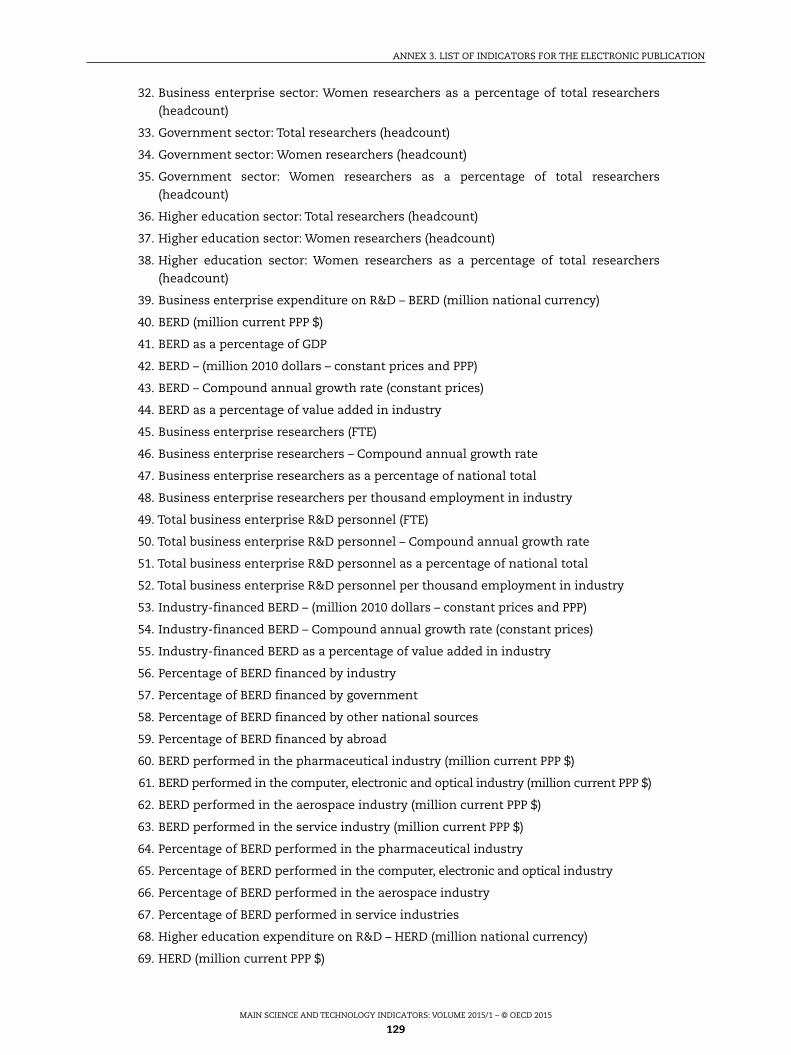
ANNEX 3. LIST OF INDICATORS FOR THE ELECTRONIC PUBLICATION
MAIN SCIENCE AND TECHNOLOGY INDICATORS: VOLUME 2015/1 – © OECD 2015
129
32. Business enterprise sector: Women researchers as a percentage of total researchers
(headcount)
33. Government sector: Total researchers (headcount)
34. Government sector: Women researchers (headcount)
35. Government sector: Women researchers as a percentage of total researchers
(headcount)
36. Higher education sector: Total researchers (headcount)
37. Higher education sector: Women researchers (headcount)
38. Higher education sector: Women researchers as a percentage of total researchers
(headcount)
39. Business enterprise expenditure on R&D – BERD (million national currency)
40. BERD (million current PPP $)
41. BERD as a percentage of GDP
42. BERD – (million 2010 dollars – constant prices and PPP)
43. BERD – Compound annual growth rate (constant prices)
44. BERD as a percentage of value added in industry
45. Business enterprise researchers (FTE)
46. Business enterprise researchers – Compound annual growth rate
47. Business enterprise researchers as a percentage of national total
48. Business enterprise researchers per thousand employment in industry
49. Total business enterprise R&D personnel (FTE)
50. Total business enterprise R&D personnel – Compound annual growth rate
51. Total business enterprise R&D personnel as a percentage of national total
52. Total business enterprise R&D personnel per thousand employment in industry
53. Industry-financed BERD – (million 2010 dollars – constant prices and PPP)
54. Industry-financed BERD – Compound annual growth rate (constant prices)
55. Industry-financed BERD as a percentage of value added in industry
56. Percentage of BERD financed by industry
57. Percentage of BERD financed by government
58. Percentage of BERD financed by other national sources
59. Percentage of BERD financed by abroad
60. BERD performed in the pharmaceutical industry (million current PPP $)
61. BERD performed in the computer, electronic and optical industry (million current PPP $)
62. BERD performed in the aerospace industry (million current PPP $)
63. BERD performed in the service industry (million current PPP $)
64. Percentage of BERD performed in the pharmaceutical industry
65. Percentage of BERD performed in the computer, electronic and optical industry
66. Percentage of BERD performed in the aerospace industry
67. Percentage of BERD performed in service industries
68. Higher education expenditure on R&D – HERD (million national currency)
69. HERD (million current PPP $)
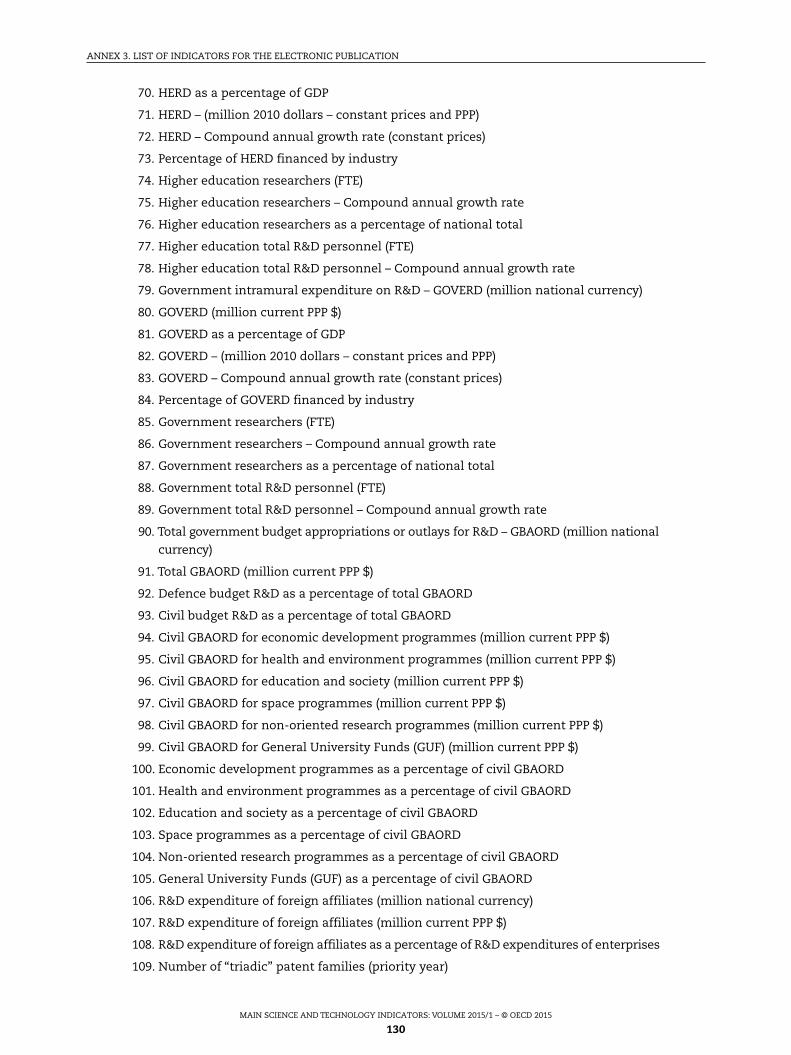
ANNEX 3. LIST OF INDICATORS FOR THE ELECTRONIC PUBLICATION
MAIN SCIENCE AND TECHNOLOGY INDICATORS: VOLUME 2015/1 – © OECD 2015
130
70. HERD as a percentage of GDP
71. HERD – (million 2010 dollars – constant prices and PPP)
72. HERD – Compound annual growth rate (constant prices)
73. Percentage of HERD financed by industry
74. Higher education researchers (FTE)
75. Higher education researchers – Compound annual growth rate
76. Higher education researchers as a percentage of national total
77. Higher education total R&D personnel (FTE)
78. Higher education total R&D personnel – Compound annual growth rate
79. Government intramural expenditure on R&D – GOVERD (million national currency)
80. GOVERD (million current PPP $)
81. GOVERD as a percentage of GDP
82. GOVERD – (million 2010 dollars – constant prices and PPP)
83. GOVERD – Compound annual growth rate (constant prices)
84. Percentage of GOVERD financed by industry
85. Government researchers (FTE)
86. Government researchers – Compound annual growth rate
87. Government researchers as a percentage of national total
88. Government total R&D personnel (FTE)
89. Government total R&D personnel – Compound annual growth rate
90. Total government budget appropriations or outlays for R&D – GBAORD (million national
currency)
91. Total GBAORD (million current PPP $)
92. Defence budget R&D as a percentage of total GBAORD
93. Civil budget R&D as a percentage of total GBAORD
94. Civil GBAORD for economic development programmes (million current PPP $)
95. Civil GBAORD for health and environment programmes (million current PPP $)
96. Civil GBAORD for education and society (million current PPP $)
97. Civil GBAORD for space programmes (million current PPP $)
98. Civil GBAORD for non-oriented research programmes (million current PPP $)
99. Civil GBAORD for General University Funds (GUF) (million current PPP $)
100. Economic development programmes as a percentage of civil GBAORD
101. Health and environment programmes as a percentage of civil GBAORD
102. Education and society as a percentage of civil GBAORD
103. Space programmes as a percentage of civil GBAORD
104. Non-oriented research programmes as a percentage of civil GBAORD
105. General University Funds (GUF) as a percentage of civil GBAORD
106. R&D expenditure of foreign affiliates (million national currency)
107. R&D expenditure of foreign affiliates (million current PPP $)
108. R&D expenditure of foreign affiliates as a percentage of R&D expenditures of enterprises
109. Number of “triadic” patent families (priority year)
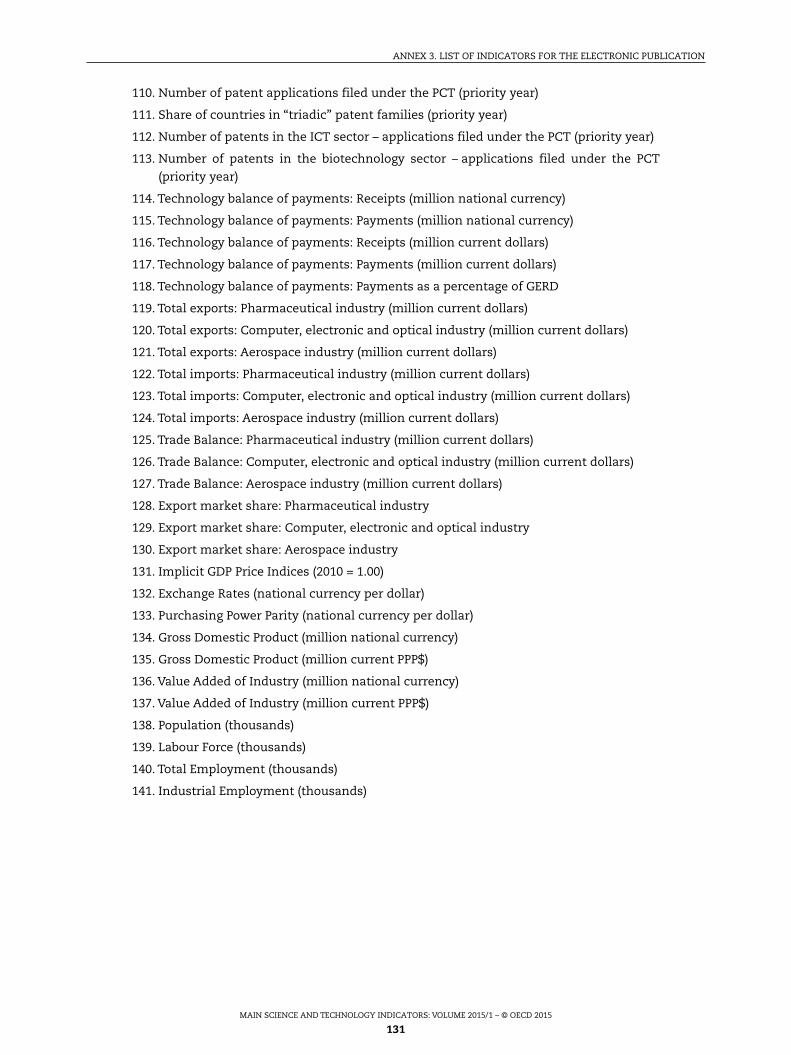
ANNEX 3. LIST OF INDICATORS FOR THE ELECTRONIC PUBLICATION
MAIN SCIENCE AND TECHNOLOGY INDICATORS: VOLUME 2015/1 – © OECD 2015
131
110. Number of patent applications filed under the PCT (priority year)
111. Share of countries in “triadic” patent families (priority year)
112. Number of patents in the ICT sector – applications filed under the PCT (priority year)
113. Number of patents in the biotechnology sector – applications filed under the PCT
(priority year)
114. Technology balance of payments: Receipts (million national currency)
115. Technology balance of payments: Payments (million national currency)
116. Technology balance of payments: Receipts (million current dollars)
117. Technology balance of payments: Payments (million current dollars)
118. Technology balance of payments: Payments as a percentage of GERD
119. Total exports: Pharmaceutical industry (million current dollars)
120. Total exports: Computer, electronic and optical industry (million current dollars)
121. Total exports: Aerospace industry (million current dollars)
122. Total imports: Pharmaceutical industry (million current dollars)
123. Total imports: Computer, electronic and optical industry (million current dollars)
124. Total imports: Aerospace industry (million current dollars)
125. Trade Balance: Pharmaceutical industry (million current dollars)
126. Trade Balance: Computer, electronic and optical industry (million current dollars)
127. Trade Balance: Aerospace industry (million current dollars)
128. Export market share: Pharmaceutical industry
129. Export market share: Computer, electronic and optical industry
130. Export market share: Aerospace industry
131. Implicit GDP Price Indices (2010 = 1.00)
132. Exchange Rates (national currency per dollar)
133. Purchasing Power Parity (national currency per dollar)
134. Gross Domestic Product (million national currency)
135. Gross Domestic Product (million current PPP$)
136. Value Added of Industry (million national currency)
137. Value Added of Industry (million current PPP$)
138. Population (thousands)
139. Labour Force (thousands)
140. Total Employment (thousands)
141. Industrial Employment (thousands)
ORGANISATION FOR ECONOMIC CO-OPERATIONAND DEVELOPMENT
The OECD is a unique forum where governments work together to address the economic, social and
environmental challenges of globalisation. The OECD is also at the forefront of efforts to understand and
to help governments respond to new developments and concerns, such as corporate governance, the
information economy and the challenges of an ageing population. The Organisation provides a setting
where governments can compare policy experiences, seek answers to common problems, identify good
practice and work to co-ordinate domestic and international policies.
The OECD member countries are: Australia, Austria, Belgium, Canada, Chile, the Czech Republic,
Denmark, Estonia, Finland, France, Germany, Greece, Hungary, Iceland, Ireland, Israel, Italy, Japan, Korea,
Luxembourg, Mexico, the Netherlands, New Zealand, Norway, Poland, Portugal, the Slovak Republic, Slovenia,
Spain, Sweden, Switzerland, Turkey, the United Kingdom and the United States. The European Union takes
part in the work of the OECD.
OECD Publishing disseminates widely the results of the Organisation’s statistics gathering and
research on economic, social and environmental issues, as well as the conventions, guidelines and
standards agreed by its members.
OECD PUBLISHING, 2, rue André-Pascal, 75775 PARIS CEDEX 16
(94 2015 01 1 P) ISSN 2304-2761 – 2015
AvAilAble on line
Main S
cience and Techno
log
y Indicato
rs2015/1
Main Science and Technology IndicatorsThis biannual publication provides a set of indicators that reflect the level and structure of the efforts undertaken by oeCD member countries and seven non-member economies (Argentina, China, Romania, Russian Federation, Singapore, South Africa, Chinese Taipei) in the field of science and technology. These data include final or provisional results as well as forecasts established by government authorities. The indicators cover the resources devoted to research and development, patent families, technology balance of payments and international trade in R&D-intensive industries. Also presented are the underlying economic series used to calculate these indicators. Series are presented for a reference year and for the last six years for which data are available.
AlSo AvAIlAble on lIne
The electronic data product provides longer time series: data from 1981 onwards are included. The database is in CSv format and allows users to extract and export data, prepare customised graphs and tables, and perform their own analysis. it is also available on line at www.oecd-ilibrary.org.
volume 2015/1
Main Science and Technology Indicators
volume 2015/1
Consult this publication on line at http://dx.doi.org/10.1787/msti-v2015-1-en.
This work is published on the oeCD ilibrary, which gathers all oeCD books, periodicals and statistical databases.visit www.oecd-ilibrary.org for more information.
ISSn 2304-27612015 Subscription (2 issues)
94 2015 01 1 p 9HRMDKE*chgbai+