Embed Size (px)
Citation preview
IISRAEL ENERGY AND BUSINESS CONFERENCE, 28 NOVEMBER 2011, Israel 1/ / / // / / / / / / / / / / / / / / / / / / / / / / / / / / /
CLEAN ENERGY
INVESTMENT
OUTLOOKISRAEL ENERGY AND BUSINESS CONFERENCE
28 NOVEMBER 2011
ETHAN ZINDLER
IISRAEL ENERGY AND BUSINESS CONFERENCE, 28 NOVEMBER 2011, Israel 2/ / / /
COPYRIGHT AND DISCLAIMER
This publication is the copyright of Bloomberg New Energy Finance. No portion of this document may be
photocopied, reproduced, scanned into an electronic system or transmitted, forwarded or distributed in any
way without prior consent of Bloomberg New Energy Finance.
The information contained in this publication is derived from carefully selected public sources we believe are
reasonable. We do not guarantee its accuracy or completeness and nothing in this document shall be
construed to be a representation of such a guarantee. Any opinions expressed reflect the current judgment of
the author of the relevant article or features, and does not necessarily reflect the opinion of Bloomberg New
Energy Finance. The opinions presented are subject to change without notice. Bloomberg New Energy
Finance accepts no responsibility for any liability arising from use of this document or its contents. Bloomberg
New Energy Finance does not consider itself to undertake Regulated Activities as defined in Section 22 of the
Financial Services and Markets Act 2000 and is not registered with the Financial Services Authority of the UK.
IISRAEL ENERGY AND BUSINESS CONFERENCE, 28 NOVEMBER 2011, Israel 3/ / / /
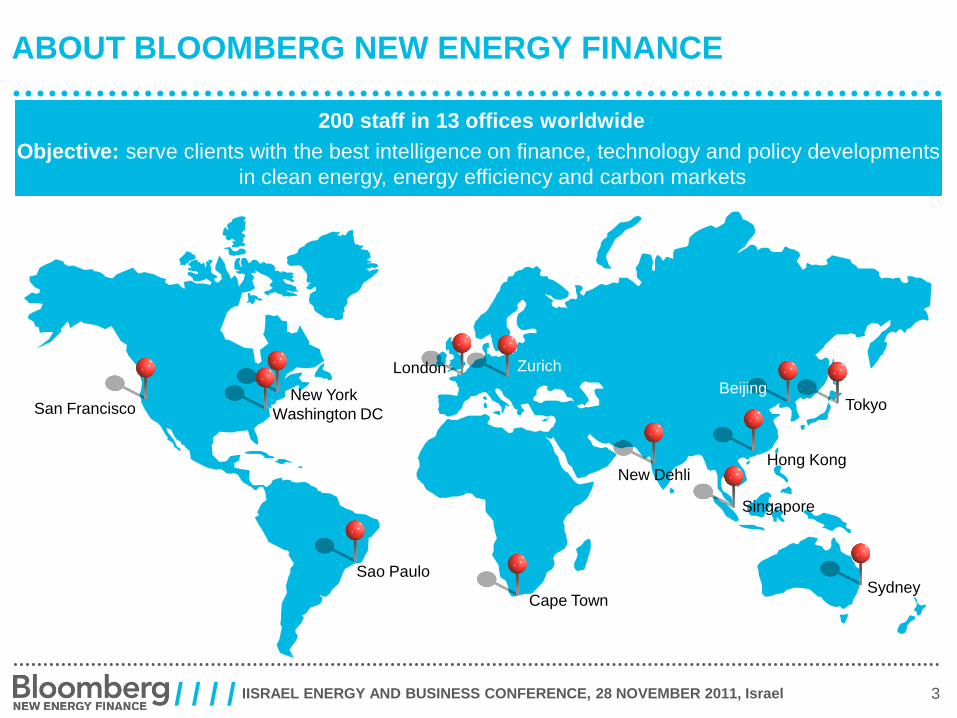
ABOUT BLOOMBERG NEW ENERGY FINANCE
San FranciscoNew York
Washington DC
Sao Paulo
Cape TownSydney
Hong KongNew Dehli
London
BeijingTokyo
200 staff in 13 offices worldwide
Objective: serve clients with the best intelligence on finance, technology and policy developments
in clean energy, energy efficiency and carbon markets
Zurich
Singapore
IISRAEL ENERGY AND BUSINESS CONFERENCE, 28 NOVEMBER 2011, Israel 4/ / / /
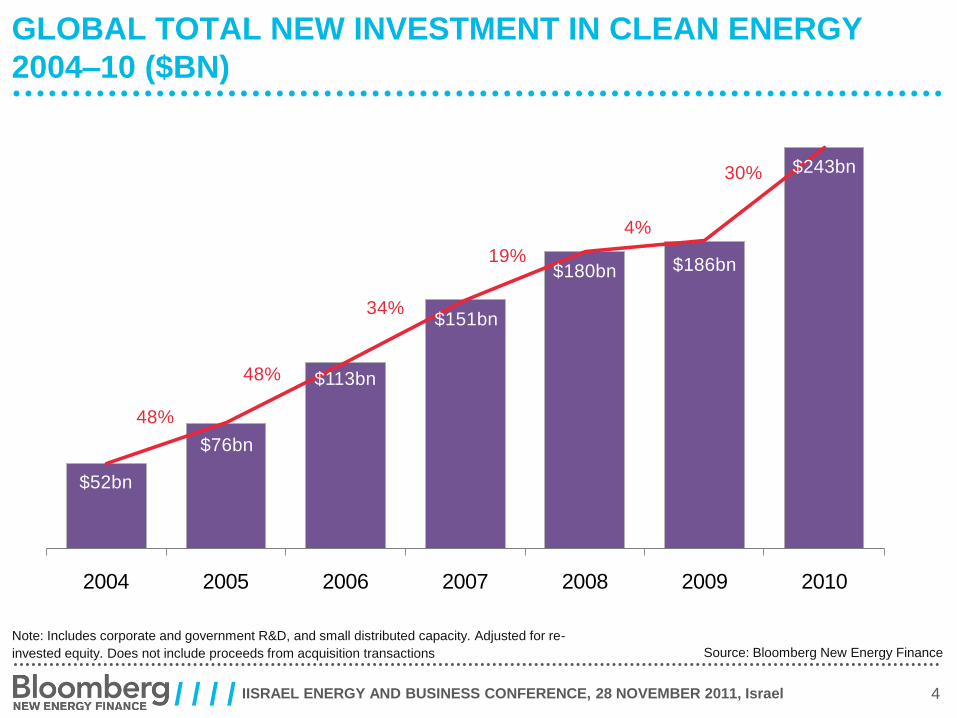
$52bn
$76bn
$113bn
$151bn
$180bn $186bn
$243bn
48%
48%
34%
19%
4%
30%
2004 2005 2006 2007 2008 2009 2010
GLOBAL TOTAL NEW INVESTMENT IN CLEAN ENERGY
2004–10 ($BN)
Source: Bloomberg New Energy Finance
Note: Includes corporate and government R&D, and small distributed capacity. Adjusted for re-
invested equity. Does not include proceeds from acquisition transactions
IISRAEL ENERGY AND BUSINESS CONFERENCE, 28 NOVEMBER 2011, Israel 5/ / / /
Source: Bloomberg New Energy Finance
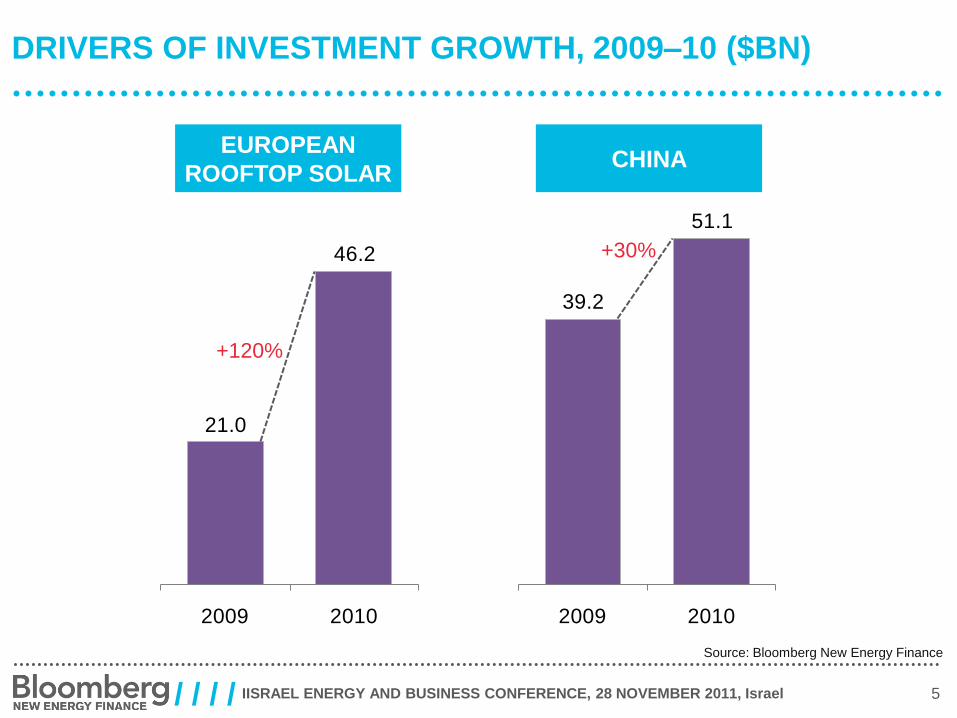
DRIVERS OF INVESTMENT GROWTH, 2009–10 ($BN)
CHINAEUROPEAN
ROOFTOP SOLAR
39.2
51.1
2009 2010
21.0
46.2
2009 2010
+120%
+30%
IISRAEL ENERGY AND BUSINESS CONFERENCE, 28 NOVEMBER 2011, Israel 6/ / / /
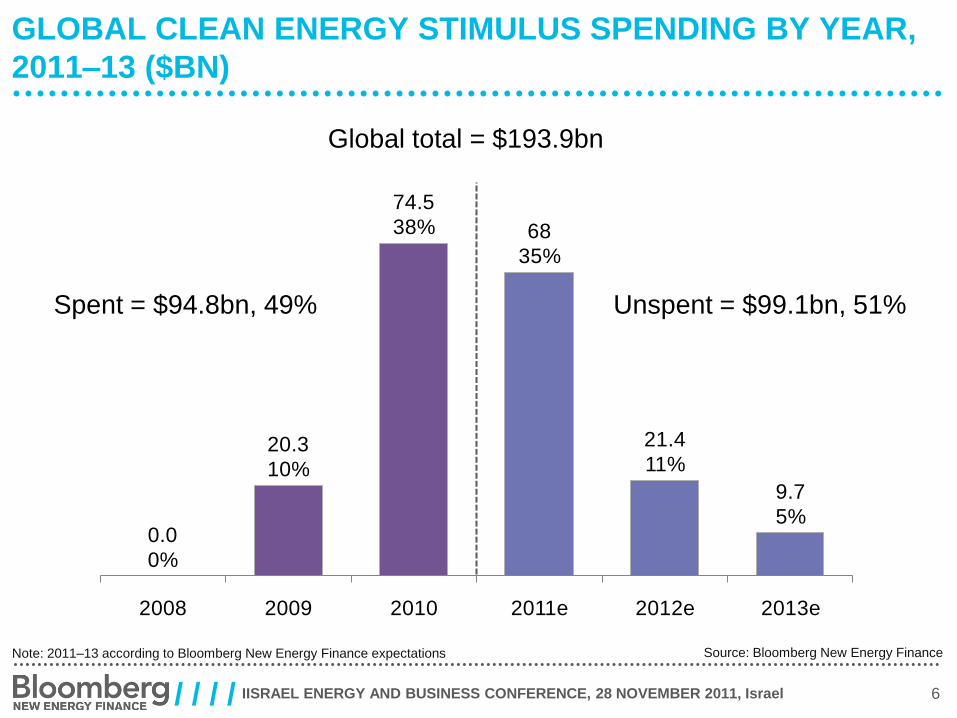
0.0
0%
20.3
10%
74.5
38% 68
35%
21.4
11%
9.7
5%
2008 2009 2010 2011e 2012e 2013e
GLOBAL CLEAN ENERGY STIMULUS SPENDING BY YEAR,
2011–13 ($BN)
Source: Bloomberg New Energy FinanceNote: 2011–13 according to Bloomberg New Energy Finance expectations
Spent = $94.8bn, 49% Unspent = $99.1bn, 51%
Global total = $193.9bn
IISRAEL ENERGY AND BUSINESS CONFERENCE, 28 NOVEMBER 2011, Israel 7/ / / /
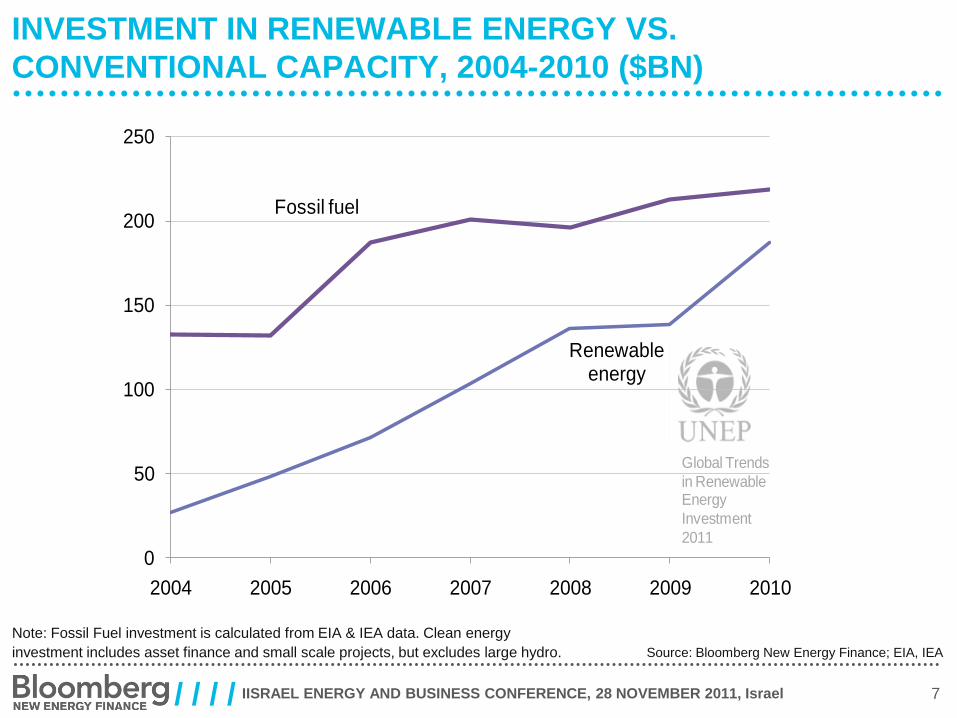
INVESTMENT IN RENEWABLE ENERGY VS.
CONVENTIONAL CAPACITY, 2004-2010 ($BN)
Source: Bloomberg New Energy Finance; EIA, IEA
Note: Fossil Fuel investment is calculated from EIA & IEA data. Clean energy
investment includes asset finance and small scale projects, but excludes large hydro.
15
31
55
80 82
6770
4
12
21
32
5155
72
2004 2005 2006 2007 2008 2009 2010
Developed Developing
3
1510 4
14 46 2
101
18 162
61 223
VC CorpRD&D
Totalinvestment
SDC*Assetfinance
GovR&D
Publicmarkets
new equity
M&A/B-O etc.
Total transactions
Re-invested
Totalcompany
investment
PE
Technology development
Equipment manufacturing/scale-up
Projects
Asset and company mergers, acquisitions, ref inancing, buy-outs etc.
Global Trends
in Sustainable Energy
Investment
2010
Global Trends
in Renewable Energy
Investment
2011
Fossil fuel
Renewable energy
0
50
100
150
200
250
2004 2005 2006 2007 2008 2009 2010
IISRAEL ENERGY AND BUSINESS CONFERENCE, 28 NOVEMBER 2011, Israel 8/ / / /
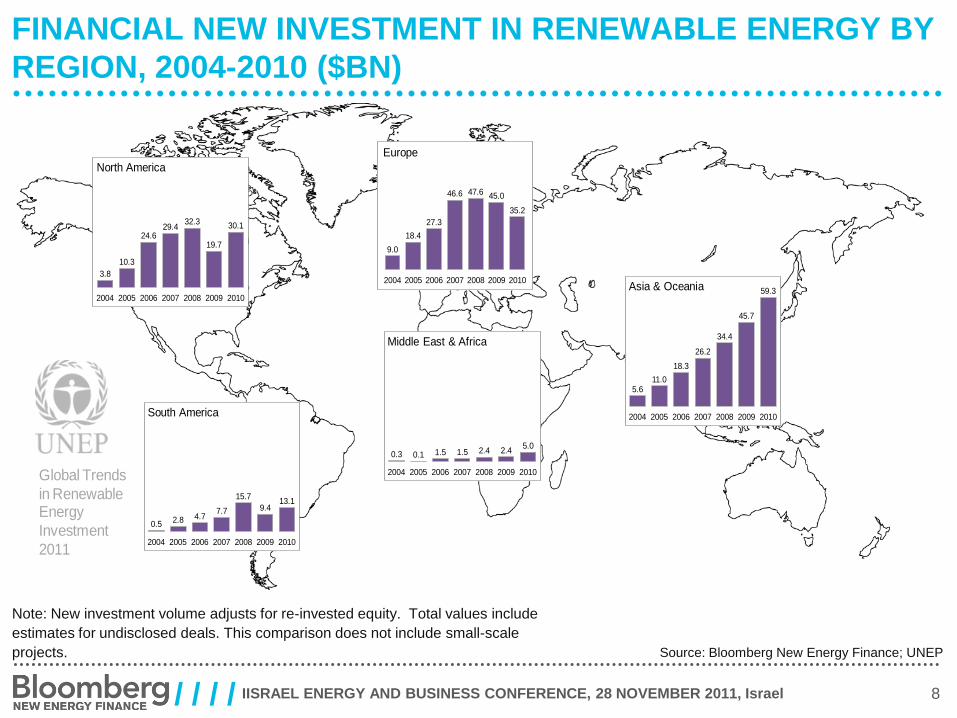
FINANCIAL NEW INVESTMENT IN RENEWABLE ENERGY BY
REGION, 2004-2010 ($BN)
Source: Bloomberg New Energy Finance; UNEP
Note: New investment volume adjusts for re-invested equity. Total values include
estimates for undisclosed deals. This comparison does not include small-scale
projects.
0.3 0.1 1.5 1.5 2.4 2.45.0
2004 2005 2006 2007 2008 2009 2010
Middle East & Africa
0.52.8 4.7
7.7
15.7
9.413.1
2004 2005 2006 2007 2008 2009 2010
South America
5.611.0
18.3
26.2
34.4
45.7
59.3
2004 2005 2006 2007 2008 2009 2010
Asia & Oceania3.8
10.3
24.629.4
32.3
19.7
30.1
2004 2005 2006 2007 2008 2009 2010
North America
9.0
18.4
27.3
46.6 47.6 45.0
35.2
2004 2005 2006 2007 2008 2009 2010
Europe
3
1510 4
14 46 2
101
18 162
61 223
VC CorpRD&D
Totalinvestment
SDC*Assetfinance
GovR&D
Publicmarkets
new equity
M&A/B-O etc.
Total transactions
Re-invested
Totalcompany
investment
PE
Technology development
Equipment manufacturing/scale-up
Projects
Asset and company mergers, acquisitions, ref inancing, buy-outs etc.
Global Trends
in Sustainable Energy
Investment
2010
Global Trends
in Renewable Energy
Investment
2011
IISRAEL ENERGY AND BUSINESS CONFERENCE, 28 NOVEMBER 2011, Israel 9/ / / /
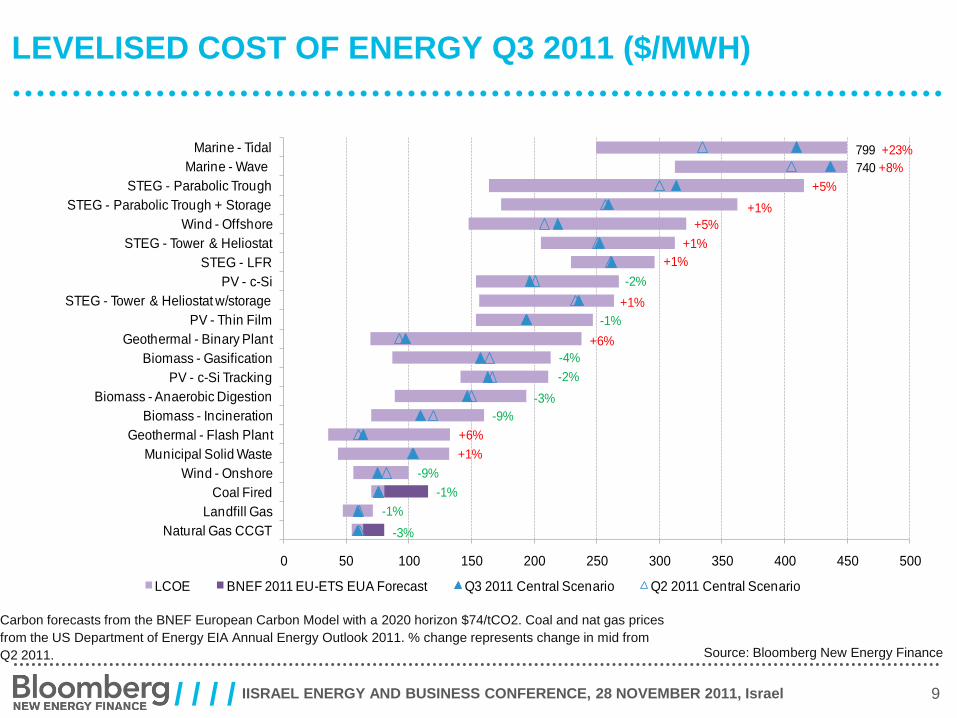
LEVELISED COST OF ENERGY Q3 2011 ($/MWH)
Source: Bloomberg New Energy Finance
Carbon forecasts from the BNEF European Carbon Model with a 2020 horizon $74/tCO2. Coal and nat gas prices
from the US Department of Energy EIA Annual Energy Outlook 2011. % change represents change in mid from
Q2 2011.
0 50 100 150 200 250 300 350 400 450 500
Natural Gas CCGT
Landfill Gas
Coal Fired
Wind - Onshore
Municipal Solid Waste
Geothermal - Flash Plant
Biomass - Incineration
Biomass - Anaerobic Digestion
PV - c-Si Tracking
Biomass - Gasification
Geothermal - Binary Plant
PV - Thin Film
STEG - Tower & Heliostat w/storage
PV - c-Si
STEG - LFR
STEG - Tower & Heliostat
Wind - Offshore
STEG - Parabolic Trough + Storage
STEG - Parabolic Trough
Marine - Wave
Marine - Tidal
LCOE BNEF 2011 EU-ETS EUA Forecast Q3 2011 Central Scenario Q2 2011 Central Scenario
+5%
+1%
+5%
+1%
-2%
+1%
-1%
+6%
+1%
-4%
-2%
-3%
-9%
+6%
+1%
-9%
-1%
-1%
-3%
799 +23%
740 +8%
IISRAEL ENERGY AND BUSINESS CONFERENCE, 28 NOVEMBER 2011, Israel 10/ / / /
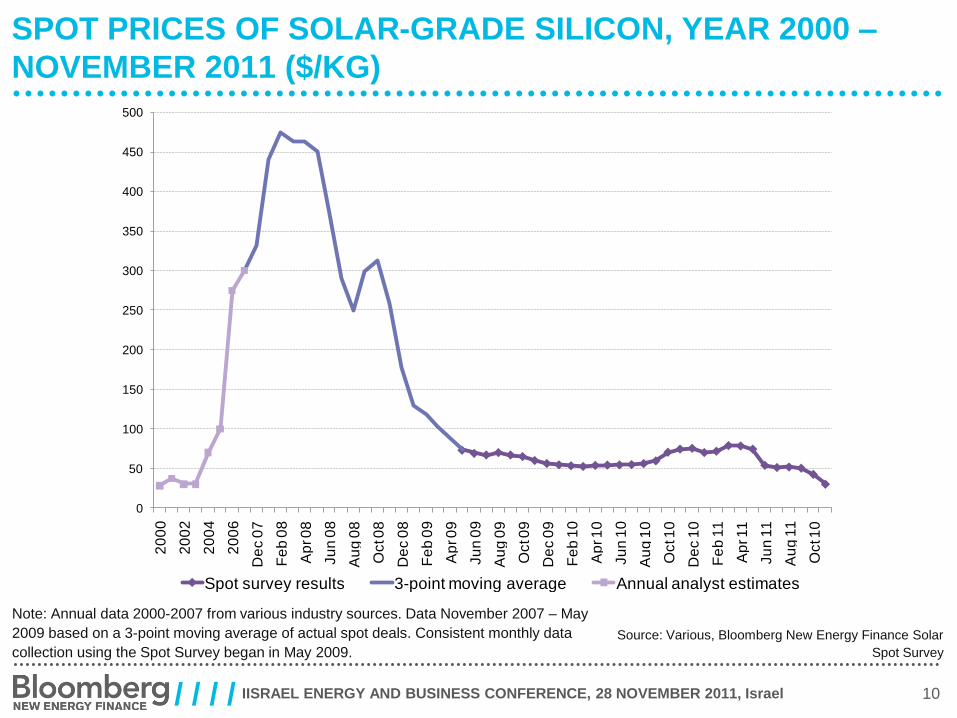
SPOT PRICES OF SOLAR-GRADE SILICON, YEAR 2000 –
NOVEMBER 2011 ($/KG)
Source: Various, Bloomberg New Energy Finance Solar
Spot Survey
Note: Annual data 2000-2007 from various industry sources. Data November 2007 – May
2009 based on a 3-point moving average of actual spot deals. Consistent monthly data
collection using the Spot Survey began in May 2009.
0
50
100
150
200
250
300
350
400
450
500
20
00
20
02
20
04
20
06
De
c 0
7
Fe
b 0
8
Ap
r 0
8
Ju
n 0
8
Au
g 0
8
Oct 0
8
De
c 0
8
Fe
b 0
9
Ap
r 0
9
Ju
n 0
9
Au
g 0
9
Oct 0
9
De
c 0
9
Fe
b 1
0
Ap
r 1
0
Ju
n 1
0
Au
g 1
0
Oct 1
0
De
c 1
0
Fe
b 1
1
Ap
r 11
Ju
n 1
1
Au
g 1
1
Oct 1
0
Spot survey results 3-point moving average Annual analyst estimates
IISRAEL ENERGY AND BUSINESS CONFERENCE, 28 NOVEMBER 2011, Israel 11/ / / /
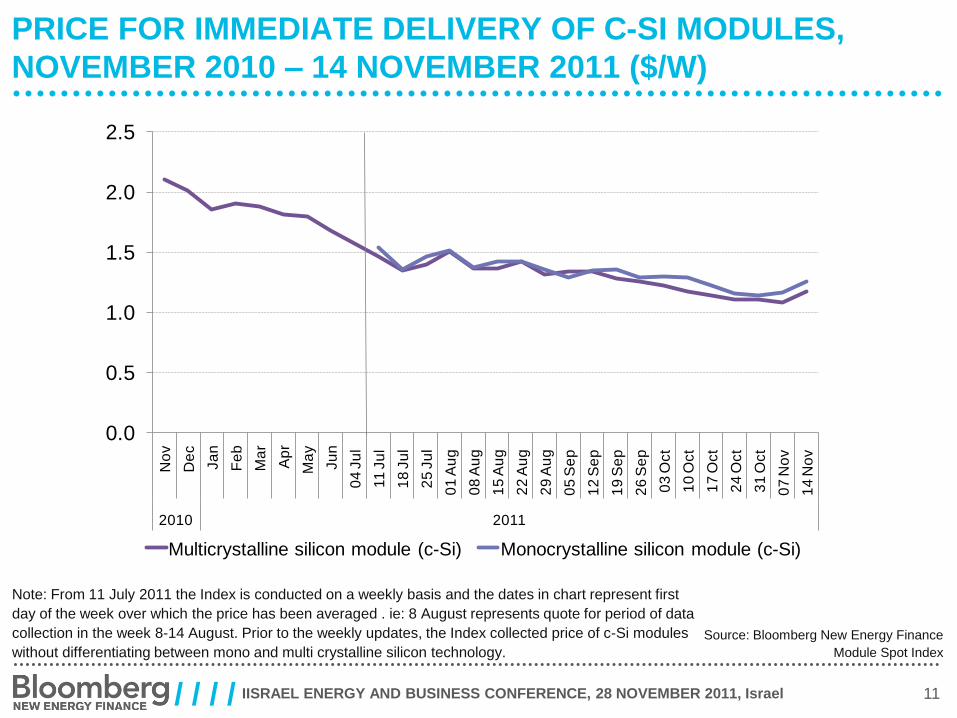
PRICE FOR IMMEDIATE DELIVERY OF C-SI MODULES,
NOVEMBER 2010 – 14 NOVEMBER 2011 ($/W)
Source: Bloomberg New Energy Finance
Module Spot Index
Note: From 11 July 2011 the Index is conducted on a weekly basis and the dates in chart represent first
day of the week over which the price has been averaged . ie: 8 August represents quote for period of data
collection in the week 8-14 August. Prior to the weekly updates, the Index collected price of c-Si modules
without differentiating between mono and multi crystalline silicon technology.
0.0
0.5
1.0
1.5
2.0
2.5
No
v
De
c
Ja
n
Fe
b
Ma
r
Ap
r
Ma
y
Ju
n
04
Ju
l
11
Ju
l
18
Ju
l
25
Ju
l
01
Au
g
08
Au
g
15
Au
g
22
Au
g
29
Au
g
05
Se
p
12
Se
p
19
Se
p
26
Se
p
03
Oct
10
Oct
17
Oct
24
Oct
31
Oct
07
No
v
14
No
v
2010 2011
Multicrystalline silicon module (c-Si) Monocrystalline silicon module (c-Si)
IISRAEL ENERGY AND BUSINESS CONFERENCE, 28 NOVEMBER 2011, Israel 12/ / / /
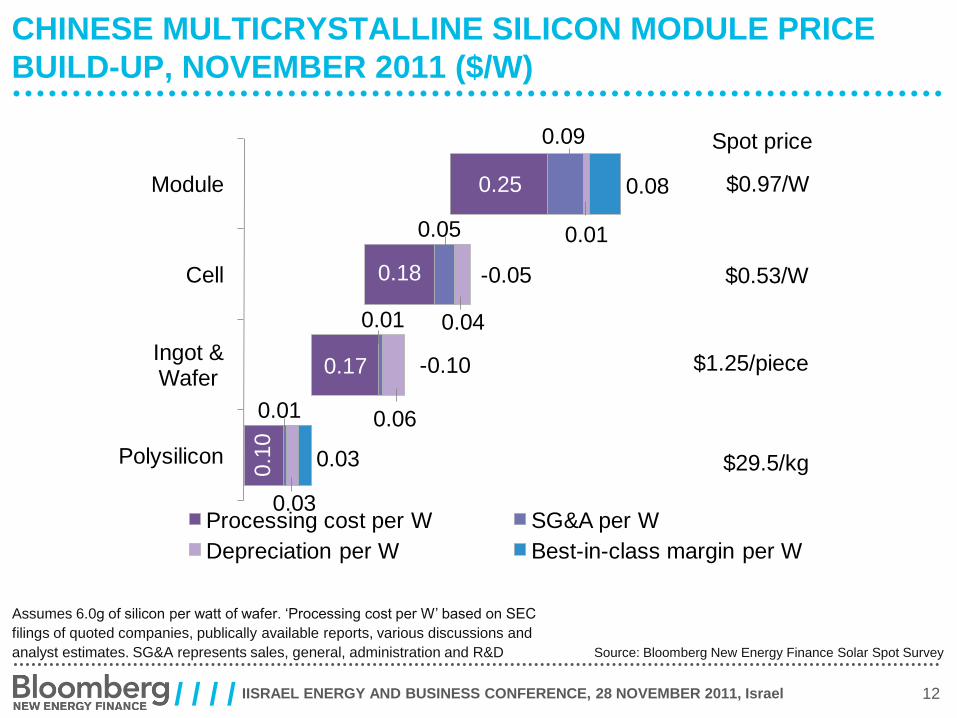
CHINESE MULTICRYSTALLINE SILICON MODULE PRICE
BUILD-UP, NOVEMBER 2011 ($/W)
Source: Bloomberg New Energy Finance Solar Spot Survey
Assumes 6.0g of silicon per watt of wafer. ‘Processing cost per W’ based on SEC
filings of quoted companies, publically available reports, various discussions and
analyst estimates. SG&A represents sales, general, administration and R&D
0.1
0
0.17
0.18
0.25
0.01
0.01
0.05
0.09
0.03
0.06
0.04
0.01
0.03
0.08
$29.5/kg
$1.25/piece
$0.53/W
$0.97/W
Polysilicon
Ingot & Wafer
Cell
Module
Processing cost per W SG&A per W
Depreciation per W Best-in-class margin per W
SSSS
-0.10
Spot price
-0.05
IISRAEL ENERGY AND BUSINESS CONFERENCE, 28 NOVEMBER 2011, Israel 13/ / / /
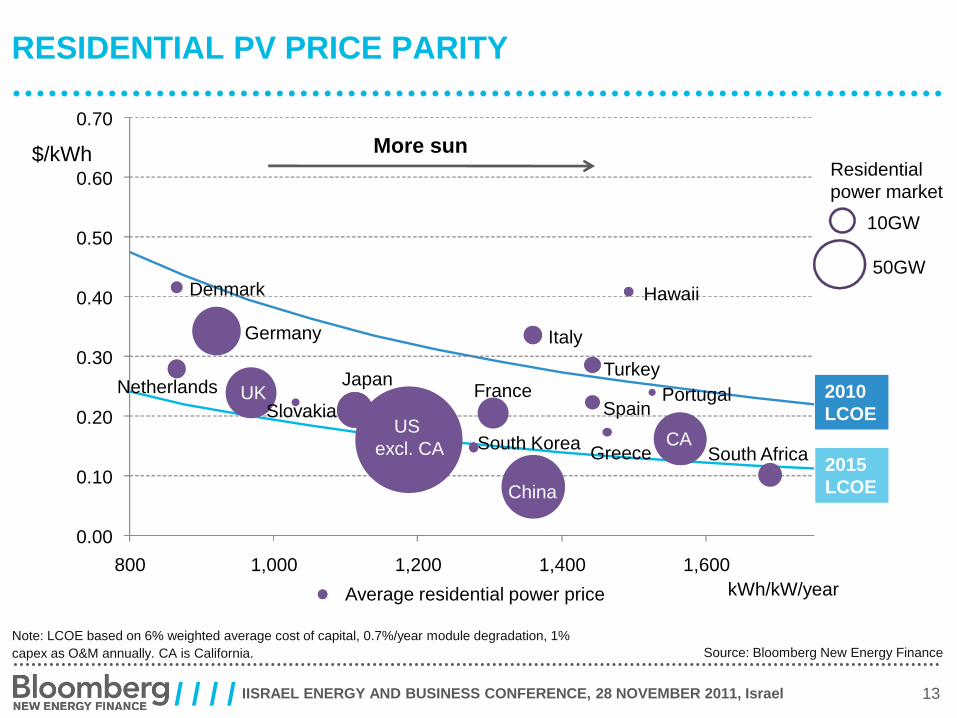
0.00
0.10
0.20
0.30
0.40
0.50
0.60
0.70
800 1,000 1,200 1,400 1,600
kWh/kW/year
2015
LCOE
Average residential power price
Japan
Spain
Germany
Denmark
France
Greece
Netherlands PortugalUKSlovakia
South KoreaUS
excl. CA
China
South Africa
10GW
50GW
Residential
power market
Hawaii
Italy
Turkey
$/kWh
RESIDENTIAL PV PRICE PARITY
Source: Bloomberg New Energy Finance
Note: LCOE based on 6% weighted average cost of capital, 0.7%/year module degradation, 1%
capex as O&M annually. CA is California.
2010
LCOE
Average residential power price
More sun
CACA
IISRAEL ENERGY AND BUSINESS CONFERENCE, 28 NOVEMBER 2011, Israel 14/ / / /
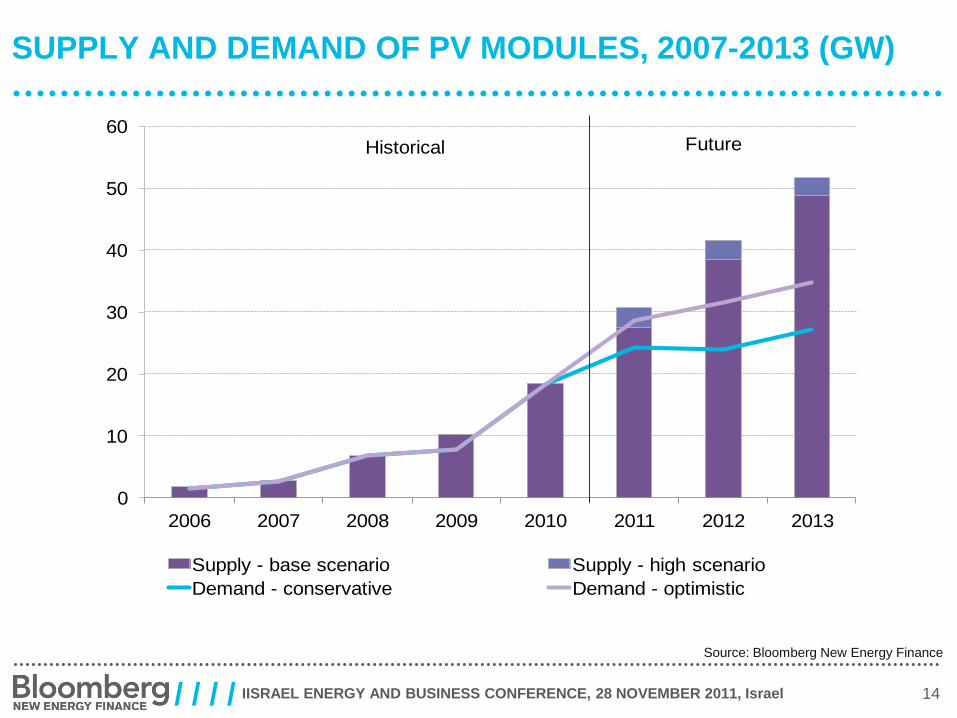
SUPPLY AND DEMAND OF PV MODULES, 2007-2013 (GW)
Source: Bloomberg New Energy Finance
0
10
20
30
40
50
60
2006 2007 2008 2009 2010 2011 2012 2013
Supply - base scenario Supply - high scenario
Demand - conservative Demand - optimistic
Historical Future
IISRAEL ENERGY AND BUSINESS CONFERENCE, 28 NOVEMBER 2011, Israel 15/ / / /
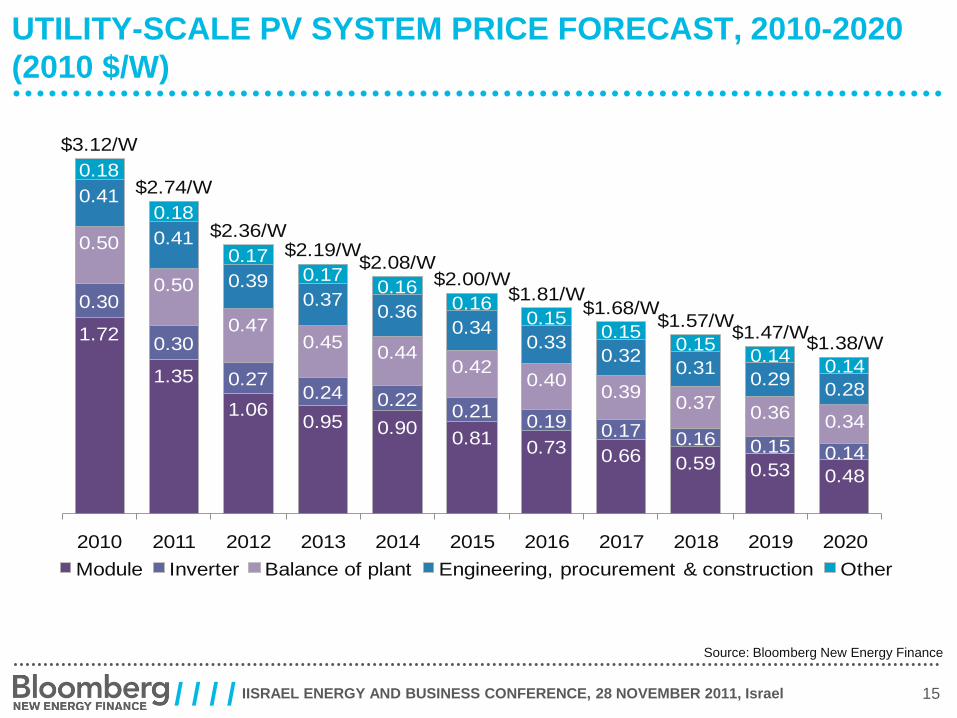
UTILITY-SCALE PV SYSTEM PRICE FORECAST, 2010-2020
(2010 $/W)
Source: Bloomberg New Energy Finance
1.72
1.35
1.060.95 0.90
0.810.73 0.66 0.59 0.53 0.48
0.30
0.30
0.270.24 0.22
0.210.19
0.17 0.16 0.15 0.14
0.50
0.50
0.470.45
0.440.42
0.400.39
0.370.36
0.34
0.41
0.41
0.390.37
0.360.34
0.330.32
0.310.29
0.28
0.18
0.18
0.170.17
0.160.16
0.150.15
0.150.14
0.14
$3.12/W
$2.74/W
$2.36/W$2.19/W
$2.08/W$2.00/W
$1.81/W$1.68/W
$1.57/W$1.47/W
$1.38/W
2010 2011 2012 2013 2014 2015 2016 2017 2018 2019 2020
Module Inverter Balance of plant Engineering, procurement & construction Other
IISRAEL ENERGY AND BUSINESS CONFERENCE, 28 NOVEMBER 2011, Israel 16/ / / /
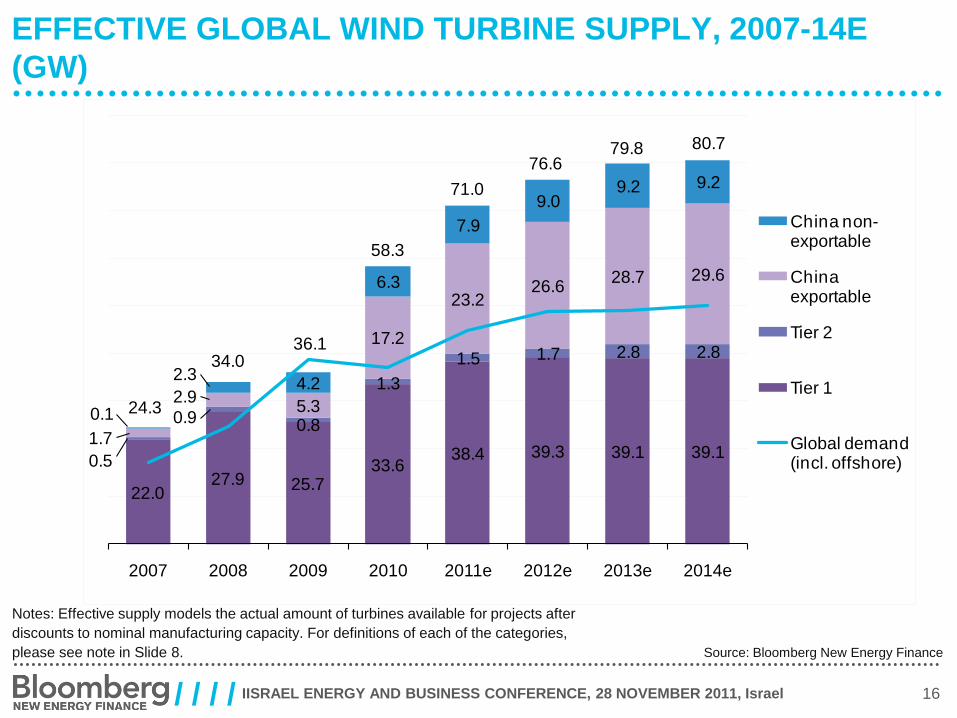
EFFECTIVE GLOBAL WIND TURBINE SUPPLY, 2007-14E
(GW)
Source: Bloomberg New Energy Finance
Notes: Effective supply models the actual amount of turbines available for projects after
discounts to nominal manufacturing capacity. For definitions of each of the categories,
please see note in Slide 8.
22.027.9 25.7
33.638.4 39.3 39.1 39.1
0.5
0.9 0.8
1.3
1.5 1.7 2.8 2.8
1.7
2.95.3
17.2
23.226.6
28.7 29.6
0.1
2.34.2
6.3
7.9
9.09.2 9.2
2007 2008 2009 2010 2011e 2012e 2013e 2014e
China non-exportable
China exportable
Tier 2
Tier 1
Global demand (incl. offshore)
71.0
76.679.8 80.7
58.3
36.134.0
24.3
IISRAEL ENERGY AND BUSINESS CONFERENCE, 28 NOVEMBER 2011, Israel 17/ / / /
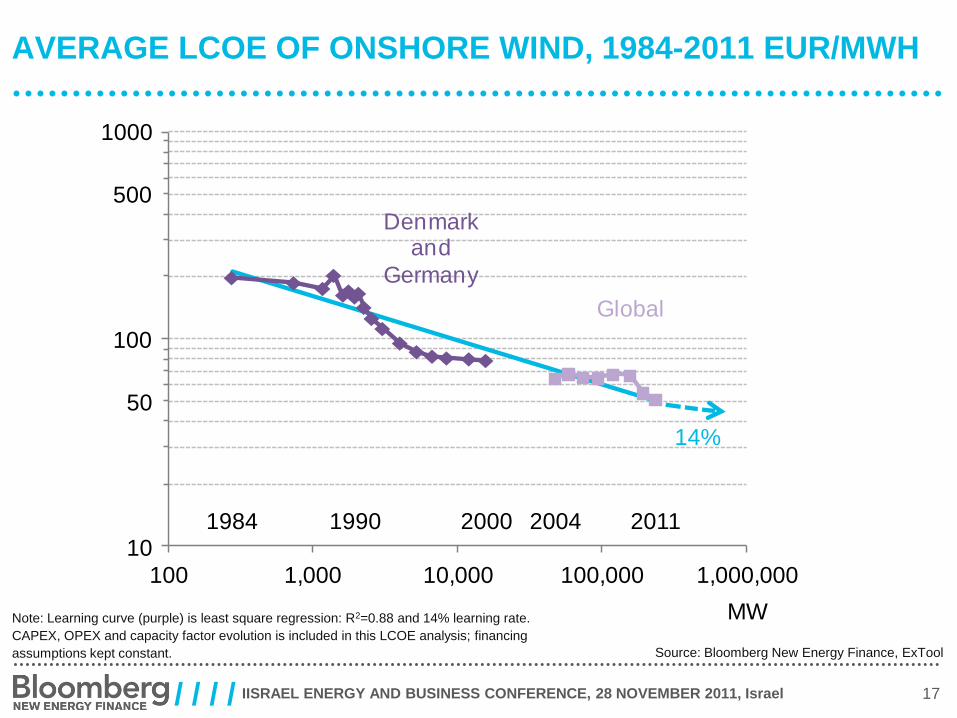
AVERAGE LCOE OF ONSHORE WIND, 1984-2011 EUR/MWH
Source: Bloomberg New Energy Finance, ExTool
Note: Learning curve (purple) is least square regression: R2=0.88 and 14% learning rate.
CAPEX, OPEX and capacity factor evolution is included in this LCOE analysis; financing
assumptions kept constant.
14%
Global
Denmark and
Germany
1984 1990 2000 2004 201110
50
100
500
1000
100 1,000 10,000 100,000 1,000,000
MW
IISRAEL ENERGY AND BUSINESS CONFERENCE, 28 NOVEMBER 2011, Israel 18/ / / /
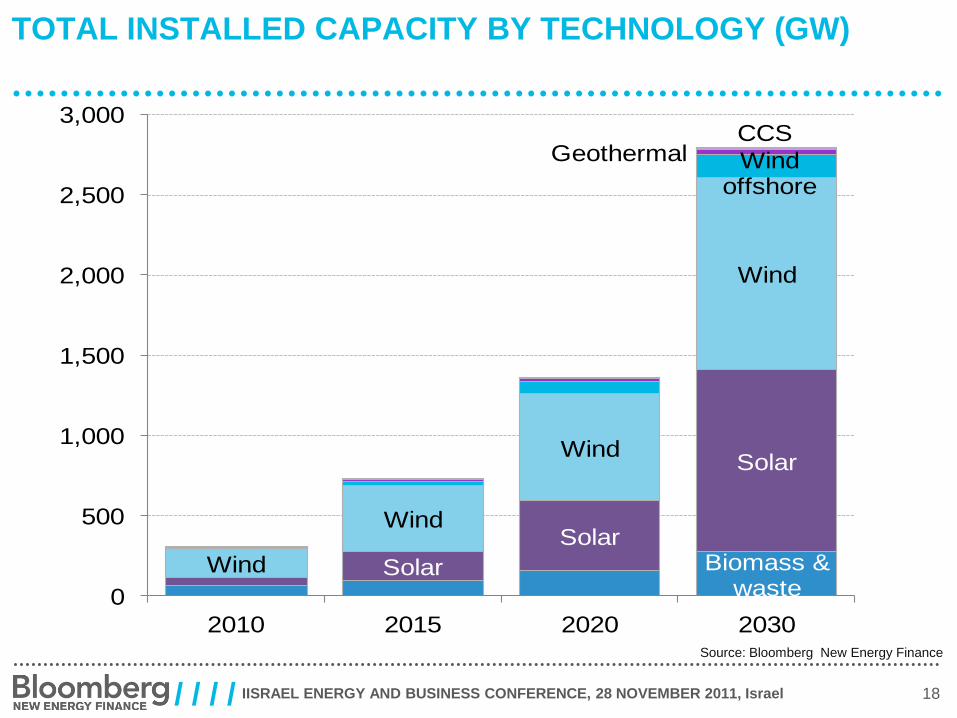
TOTAL INSTALLED CAPACITY BY TECHNOLOGY (GW)
Source: Bloomberg New Energy Finance
Biomass & waste
Solar
Solar
Solar
Wind
Wind
Wind
Wind
Wind offshore
GeothermalCCS
0
500
1,000
1,500
2,000
2,500
3,000
2010 2015 2020 2030
/ / / / / / / / / / / / / / / / / / / / / / / / / / / /
Subscription-based news, data
and analysis to support your
decisions in clean energy, power
and water and the carbon markets
MARKETS Renewable Energy
Carbon Markets
Energy Smart Technologies
Renewable Energy Certificates
Carbon Capture & Storage
Power
Water
Nuclear
SERVICESInsight: research, analysis & forecasting
Industry Intelligence: data & analytics
News & Briefing: daily, weekly & monthly
Applied Research: custom research & data mining
Knowledge Services: Summit, Leadership Forums, Executive Briefings &
workshops
THANK YOU
ETHAN ZINDLER, [email protected]
TWITTER: ETHANALL