Embed Size (px)
Citation preview
CLIMATE ATLAS IN FUKUOKA CITY Hirotoshi Yoda*
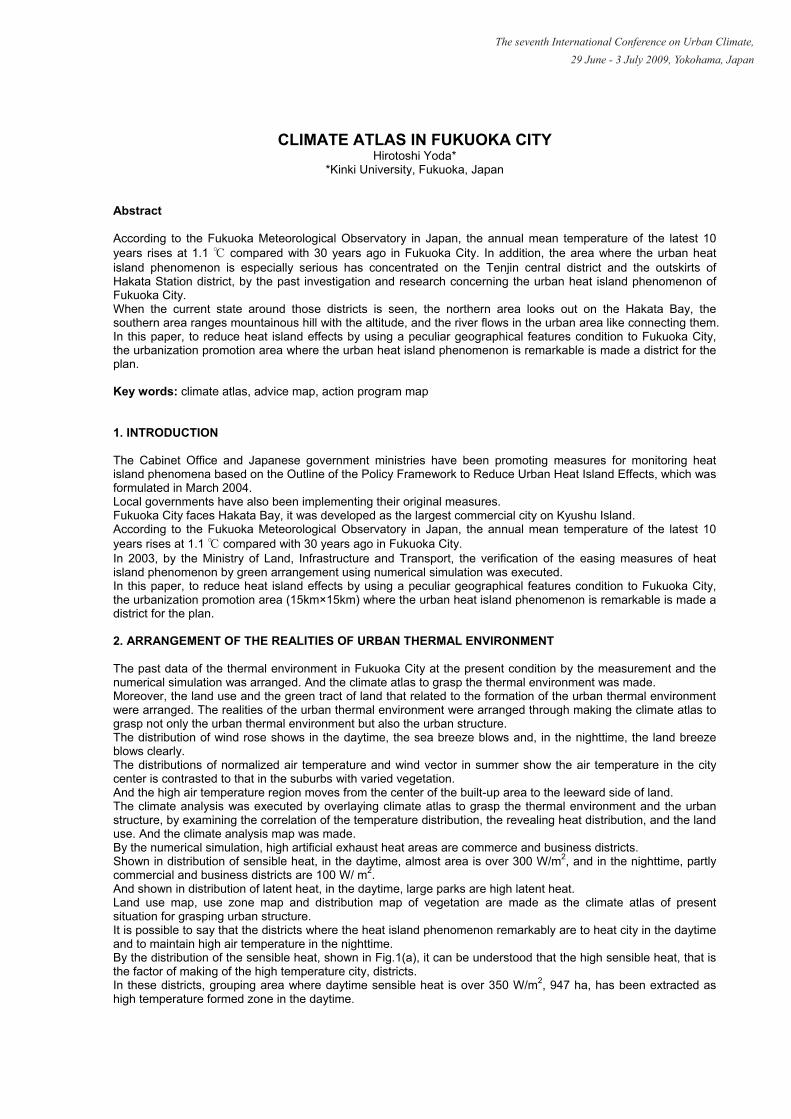
*Kinki University, Fukuoka, Japan Abstract According to the Fukuoka Meteorological Observatory in Japan, the annual mean temperature of the latest 10 years rises at 1.1 ℃ compared with 30 years ago in Fukuoka City. In addition, the area where the urban heat island phenomenon is especially serious has concentrated on the Tenjin central district and the outskirts of Hakata Station district, by the past investigation and research concerning the urban heat island phenomenon of Fukuoka City. When the current state around those districts is seen, the northern area looks out on the Hakata Bay, the southern area ranges mountainous hill with the altitude, and the river flows in the urban area like connecting them. In this paper, to reduce heat island effects by using a peculiar geographical features condition to Fukuoka City, the urbanization promotion area where the urban heat island phenomenon is remarkable is made a district for the plan. Key words: climate atlas, advice map, action program map 1. INTRODUCTION The Cabinet Office and Japanese government ministries have been promoting measures for monitoring heat island phenomena based on the Outline of the Policy Framework to Reduce Urban Heat Island Effects, which was formulated in March 2004. Local governments have also been implementing their original measures. Fukuoka City faces Hakata Bay, it was developed as the largest commercial city on Kyushu Island. According to the Fukuoka Meteorological Observatory in Japan, the annual mean temperature of the latest 10 years rises at 1.1 ℃ compared with 30 years ago in Fukuoka City. In 2003, by the Ministry of Land, Infrastructure and Transport, the verification of the easing measures of heat island phenomenon by green arrangement using numerical simulation was executed. In this paper, to reduce heat island effects by using a peculiar geographical features condition to Fukuoka City, the urbanization promotion area (15km×15km) where the urban heat island phenomenon is remarkable is made a district for the plan. 2. ARRANGEMENT OF THE REALITIES OF URBAN THERMAL ENVIRONMENT The past data of the thermal environment in Fukuoka City at the present condition by the measurement and the numerical simulation was arranged. And the climate atlas to grasp the thermal environment was made. Moreover, the land use and the green tract of land that related to the formation of the urban thermal environment were arranged. The realities of the urban thermal environment were arranged through making the climate atlas to grasp not only the urban thermal environment but also the urban structure. The distribution of wind rose shows in the daytime, the sea breeze blows and, in the nighttime, the land breeze blows clearly. The distributions of normalized air temperature and wind vector in summer show the air temperature in the city center is contrasted to that in the suburbs with varied vegetation. And the high air temperature region moves from the center of the built-up area to the leeward side of land. The climate analysis was executed by overlaying climate atlas to grasp the thermal environment and the urban structure, by examining the correlation of the temperature distribution, the revealing heat distribution, and the land use. And the climate analysis map was made. By the numerical simulation, high artificial exhaust heat areas are commerce and business districts. Shown in distribution of sensible heat, in the daytime, almost area is over 300 W/m2, and in the nighttime, partly commercial and business districts are 100 W/ m2. And shown in distribution of latent heat, in the daytime, large parks are high latent heat. Land use map, use zone map and distribution map of vegetation are made as the climate atlas of present situation for grasping urban structure. It is possible to say that the districts where the heat island phenomenon remarkably are to heat city in the daytime and to maintain high air temperature in the nighttime. By the distribution of the sensible heat, shown in Fig.1(a), it can be understood that the high sensible heat, that is the factor of making of the high temperature city, districts. In these districts, grouping area where daytime sensible heat is over 350 W/m2, 947 ha, has been extracted as high temperature formed zone in the daytime.
The seventh International Conference on Urban Climate, 29 June - 3 July 2009, Yokohama, Japan

By the air temperature measurements and the numerical simulation, shown in Fig.1(b), it can be understood that the high air temperature districts that spread to the Higashi Ward, the Minami Ward and the Jonan Ward around the Tenjin and Hakata Station. In these districts, grouping area where nighttime air temperature is over 29.5 ℃, 3740 ha, has been extracted as high temperature formed zone in the nighttime.
14:00
300
W/m2 0
over 350W/m2
Zone
22:00
over 29.5℃Zone
℃
34
21
(a) Area where daytime sensible heat is over 350 W/m2 (b) Area where nighttime air temp. is over 29.5 ℃
Fig. 1: The high temperature formed zone. It is possible to say that the districts where cool city hard to get warm in the daytime and low temperature in the nighttime. By the distribution of the sensible heat, shown in Fig.2(a), it can be understood that the districts where the heat load not given to the city compared with surroundings. In these districts, grouping area where daytime sensible heat is below 300 W/m2, 3798.2 ha, has been extracted as a low temperature formed zone in the daytime. By the distribution of the air temperature, shown in Fig.2(b), it can be understood that the districts where sensible heat and air temperature are lower than surroundings in daytime. In these districts, grouping area where nighttime air temperature is below 28.0 ℃, 4492.4 ha, has been extracted as a low temperature formed zone in the nighttime. The consecutive low air temperature regions, for example the river, are divided into heated area in the daytime and have the effect of reducing the high temperature region in the city.
14:00
300
W/m2 0
below 300W/m2
Zone
22:00
below 28.0℃Zone
℃
34
21
(a) Area where daytime sensible heat is below 300 W/m2 (b) Area where nighttime air temp. is below 28.0 ℃
Fig. 2: The low temperature formed zone. By the distribution of the sensible heat, shown in Fig.3, the districts where divide into high sensible heat area to zonal. In these districts, area where partitioning daytime grouped sensible heat is over 300 W/m2, 1372.8 ha, has been extracted as zone where partitioning high temperature formed zone.
The seventh International Conference on Urban Climate, 29 June - 3 July 2009, Yokohama, Japan

14:00
300
W/m2 0
below 300W/m2
and Partitioning High Sensible Heat
Zone
Area where partitioning daytime grouped sensible heat is over 300 W/m2
Fig. 3: The zone where partitioning high temperature formed zone. The relationship between urban thermal environmental characteristics and land use was analyzed. High temperature formed zone is consists of residential, commerce and traffic/utilities. Low temperature formed zone is consists of green, residential and vacant land/grass. Zone where partitioning high temperature formed zone is consists of residential, water and traffic/utilities. 3. MAKING ADVICE MAP AND ACTION PROGRAM MAP Fig.4 is shown the advice map for “The City Blowing Transparent Wind”. The commerce and business districts in the central of Fukuoka were especially clear to exist some problems of urban thermal environment through the analysis. In these districts, the thermal environment is worse by arterializations of land cover, accumulating of a concrete structure, and the artificial exhaust heat. Therefore, by making the advice map for the improvement of the thermal environment, the following items were proposed. - Zone where greening is promoted and planning city hard to get warm - Zone where green is maintained and created, and as supply source of cool air - Zone that secures green, and carries cool air from sea and mountain as “Wind path” Fig. 4 is the advice map for “The City Blowing Transparent Wind”. And as case study area, 3 areas are selected. They are the Hakata Area, the Ropponmatsu Area and the Higashi-naka Area.
Road where green network is formed
Spot where green that cools urban area is enhanced
Zone where green is conserved and created, and as supply source of cool air
Green where cool air is supplied to city
District where supply source of cool air is created
Zone that secures green, and carries cool air from sea and mountain as “Wind path”
Zone where greening is promoted and planning city hard to get warm
Ropponmatsu
Hakata
Higashi-naka
District where planning city hard to get warm is promoted
Urban area where greening in site, rooftop and wall are advanced
District where greening-intensive adding up urban development
District where rich green environment is conserved
Road where green-making as urban green frame
Road where green network is formed
Road where green network is advanced
Public facilities where emphatic greening is done
Facilities where positive greening is done
Node of green network
Spot where green is conserved and created
District where green that supplies cold air to urban area is conserved
District where land use that cools urban area is conserved (farmland)
District where land use that cools urban area is conserved (water surface)
District where green-making in seaside area is advanced
District where city planning that uses cold air from large-scale green is advanced
District where supply source of cool air is advanced
District where emphatic greening is advanced
River where maintenance is advanced as “wind path”District where city planning that makes use of wind is advanced
District where improvement of heat environment that makes use of river
Node of river and green network
Advice Map for “The City Blowing Transparent Wind”
Fig. 4: the advice map for “The City Blowing Transparent Wind”.
The seventh International Conference on Urban Climate, 29 June - 3 July 2009, Yokohama, Japan

The action to form the city for the improvement of thermal environment by the advice map was proposed. Fig.5 and Fig.6 show the Hakata Area. It is a central city enclosed by the Naka River, the Mikasa River and Hakata Bay, and the south of the Hakata-Meinohama line is an high- dense area where commerce/business district, and the north side is residential area. In advice map, it is greened on the site, on the rooftop and on the wall, the urban area made a high temperature is chiefly cooled, and the urban area is divided in green using road where green network is formed. In action program map, the open space with the road that becomes a green promenade is secured, the cool wind from rivers is used, and communal facilities and open spaces are positive greening. The Ropponmatsu Area is a hill ground enclosed by the Oohori Park and the Minami Park, and residential districts. It is a district that scattered the forest ground around the slope, and was enclosed by green comparatively. Moreover, it is a district where the conversion of the land use is expected as Kyushu University will move. In advice map, the city planning that makes the best use of cool air from large-scale greenery surroundings and slope woods is done. In action program map, an urban greening is advanced to secure green continuousness positively. The Higashi-naka Area is located around in the winding part in the Mikasa River and the river purification center is located in the south. In the surroundings, residential, commerce, industrial ground and farmland exist together. In advice map, the greenery using of parked maintenance in communal facilities and unused lands is secured, and the wind path is secured. In action program map, making to the park by parked maintenance of the sewage plant and the leased land assistance system of vacant land is advanced.
District where planning city hard to get warm is promoted
Road where green network is formed
Spot where green that cools urban area is enhanced
Green where cool air is supplied to city
Zone where greening is promoted and planning city hard to get warm
Zone where green is conserved and created, and as supply source of cool air
Zone that secures green, and carries cool air from sea and mountain as “Wind path”
Fig. 5: Advice map in Hakata Area.
Fig. 6: Action program map in Hakata Area. 4. CONCLUSIONS (1) By the measurement and the numerical simulation, the past thermal environment data were arranged in Fukuoka City and made climate atlas to understand the thermal environment. (2) Through examining the correlations of the air temperature or the sensible heat distributions by overlaying the climate atlas to understand the thermal environment and the one to understand the urban structure, the climate analysis maps were made. (3) As a result of the analysis, the commerce and business districts in the central of Fukuoka were especially clear to exist some problems of urban thermal environment. In these districts, the thermal environment is getting worse by arterializations of land cover, accumulating of a concrete structure, and the artificial exhaust heat. Therefore, the advice map for the improvement of the thermal environment was made. (4) The action program for improvement the urban thermal environment shown in the advice map was proposed. Acknowledgement The author would like to express thanks to the Tam Factory for Regional Landscape and Environment Co., Ltd. and Fukuoka City Hall. References The Cabinet Office and Japanese government ministries, 2004. Outline of the Policy Framework to Reduce Urban Heat Island Effects. Katayama, T. et al., 1990. Study on the effect of a river on thermal environment in summer in a sea-side city, Journal of Archit. Plann. Environ. Engng., AIJ 418, 1-9.
Urban point facilities
Maintaining forests not to get warm
Promoting greenery city center by road
Greening private land
Maintaining city parks
Strengthening system of promotion
Greening public facilities
The seventh International Conference on Urban Climate, 29 June - 3 July 2009, Yokohama, Japan