Embed Size (px)
Citation preview
Driving profitable growth through intelligent cargo handling
London, 30 November 2015
30 Nov 2014 2
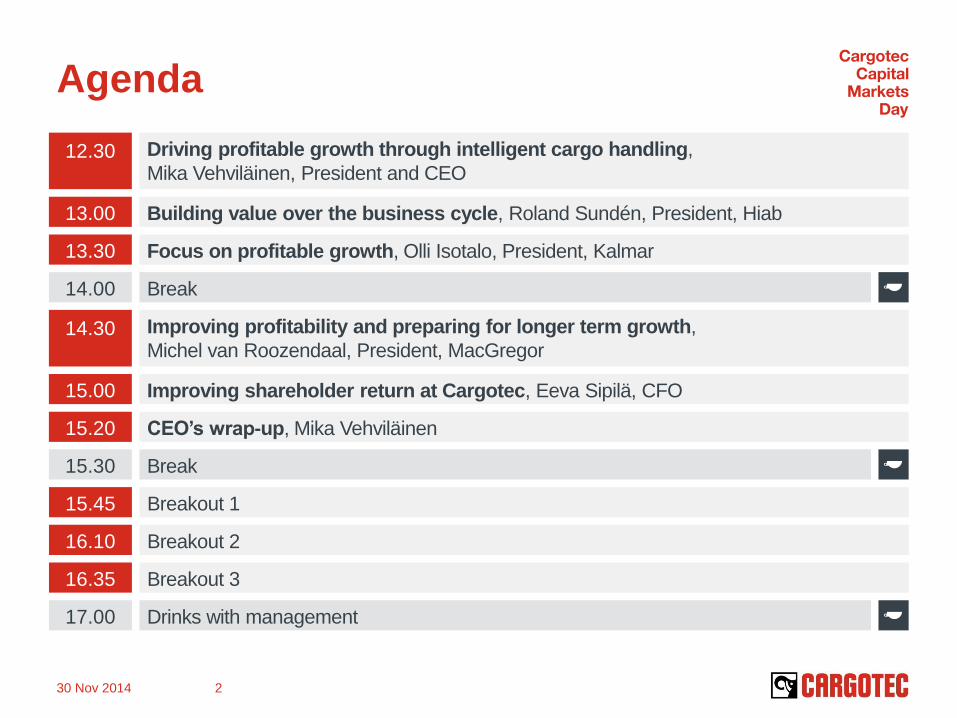
Agenda
12.30
13.00
13.30
Driving profitable growth through intelligent cargo handling,
Mika Vehviläinen, President and CEO
Building value over the business cycle, Roland Sundén, President, Hiab
Focus on profitable growth, Olli Isotalo, President, Kalmar
14.00 Break
14.30 Improving profitability and preparing for longer term growth,
Michel van Roozendaal, President, MacGregor
15.00 Improving shareholder return at Cargotec, Eeva Sipilä, CFO
15.20 CEO’s wrap-up, Mika Vehviläinen
15.30 Break
15.45 Breakout 1
16.10 Breakout 2
16.35 Breakout 3
17.00 Drinks with management
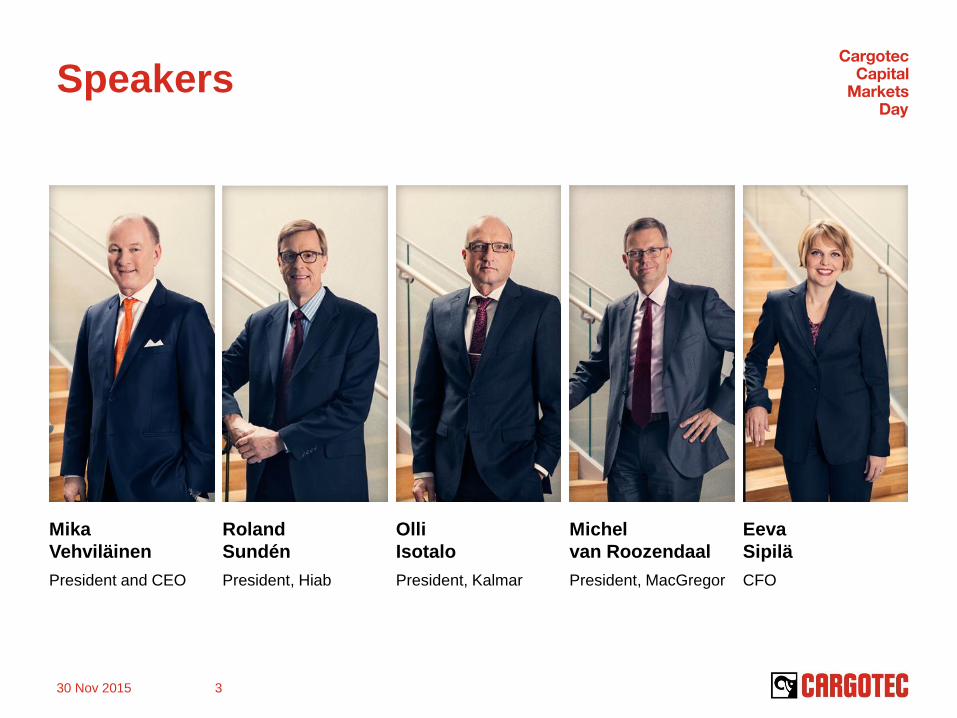
Speakers
30 Nov 2015 3
Mika
Vehviläinen
President and CEO
Roland
Sundén
President, Hiab
Olli
Isotalo
President, Kalmar
Michel
van Roozendaal
President, MacGregor
Eeva
Sipilä
CFO
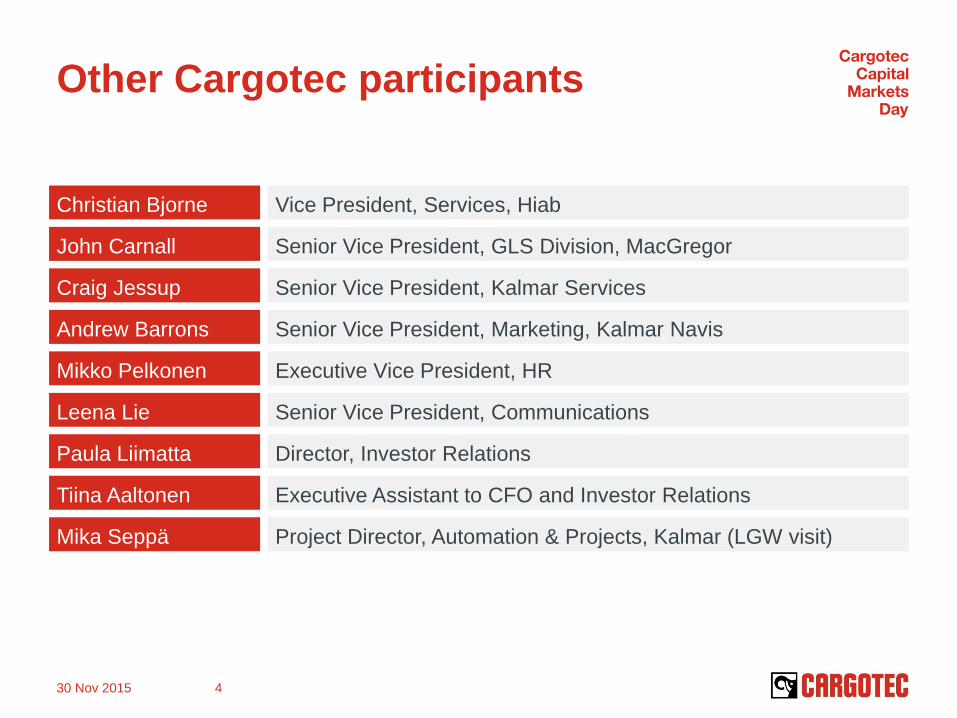
Other Cargotec participants
30 Nov 2015 4
Vice President, Services, Hiab Christian Bjorne
Senior Vice President, GLS Division, MacGregor John Carnall
Senior Vice President, Kalmar Services Craig Jessup
Senior Vice President, Marketing, Kalmar Navis Andrew Barrons
Executive Vice President, HR Mikko Pelkonen
Senior Vice President, Communications Leena Lie
Director, Investor Relations Paula Liimatta
Executive Assistant to CFO and Investor Relations Tiina Aaltonen
Project Director, Automation & Projects, Kalmar (LGW visit) Mika Seppä
Disclaimer
These presentations contain forward looking statements which involve risks
and uncertainty factors. These statements are not based on historical facts but
relate to the company’s future activities and performance. They include
statements about future strategies and anticipated benefits of these strategies.
These statements are subject to risks and uncertainties. Actual results may
differ substantially from those stated in any forward looking statement. This is
due to a number of factors, including the possibility that Cargotec may decide
not to implement these strategies and the possibility that the anticipated
benefits of implemented strategies are not achieved. Cargotec assumes no
obligation to update or revise any information included in this presentation.
30 November 2015 5
Driving profitable growth through
intelligent cargo handling Mika Vehviläinen, President and CEO
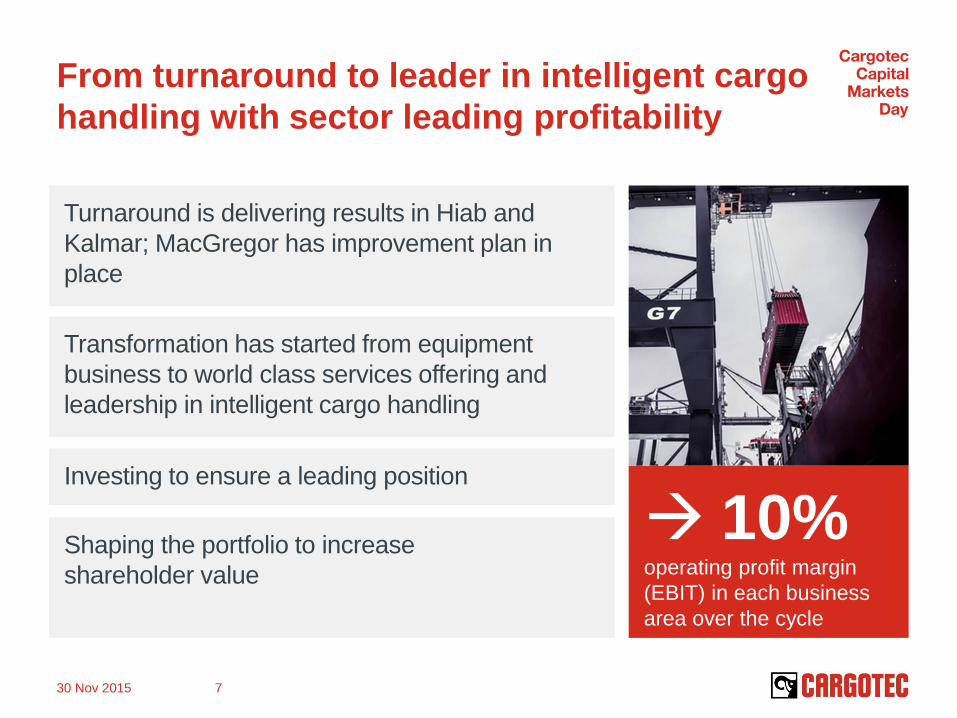
From turnaround to leader in intelligent cargo
handling with sector leading profitability
10% operating profit margin
(EBIT) in each business
area over the cycle
Turnaround is delivering results in Hiab and
Kalmar; MacGregor has improvement plan in
place
Transformation has started from equipment
business to world class services offering and
leadership in intelligent cargo handling
Investing to ensure a leading position
Shaping the portfolio to increase
shareholder value
30 Nov 2015 7
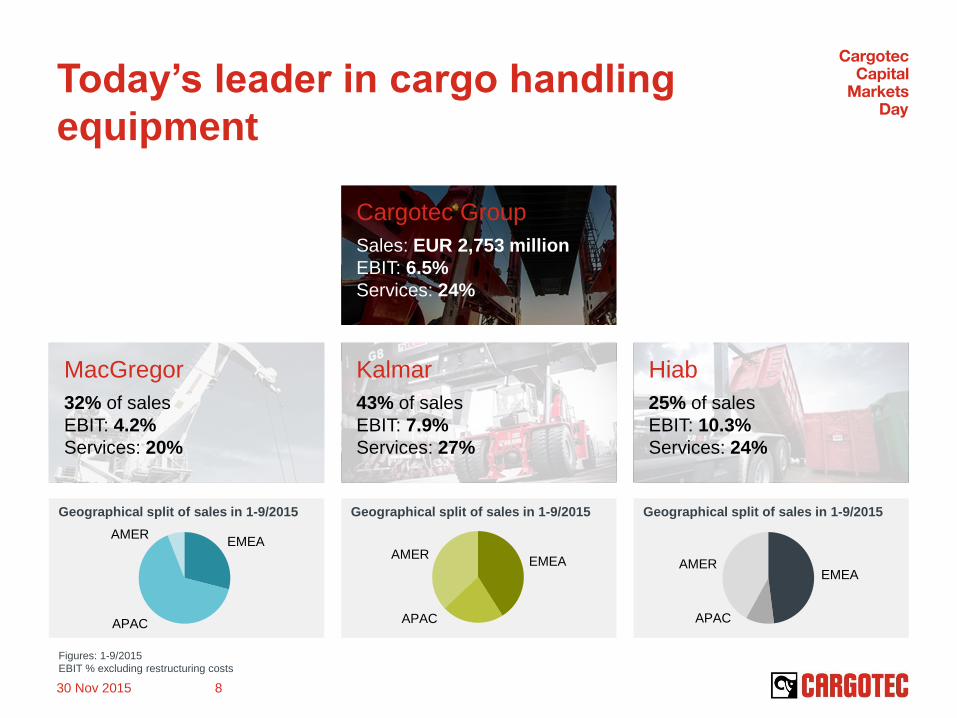
Cargotec Group
Sales: EUR 2,753 million
EBIT: 6.5%
Services: 24%
MacGregor
32% of sales
EBIT: 4.2%
Services: 20%
Geographical split of sales in 1-9/2015 Geographical split of sales in 1-9/2015 Geographical split of sales in 1-9/2015
Today’s leader in cargo handling
equipment
30 Nov 2015 8
EMEA
APAC
AMER
EMEA
APAC
AMER
EMEA
APAC
AMER
Figures: 1-9/2015
EBIT % excluding restructuring costs
Kalmar
43% of sales
EBIT: 7.9%
Services: 27%
Hiab
25% of sales
EBIT: 10.3%
Services: 24%
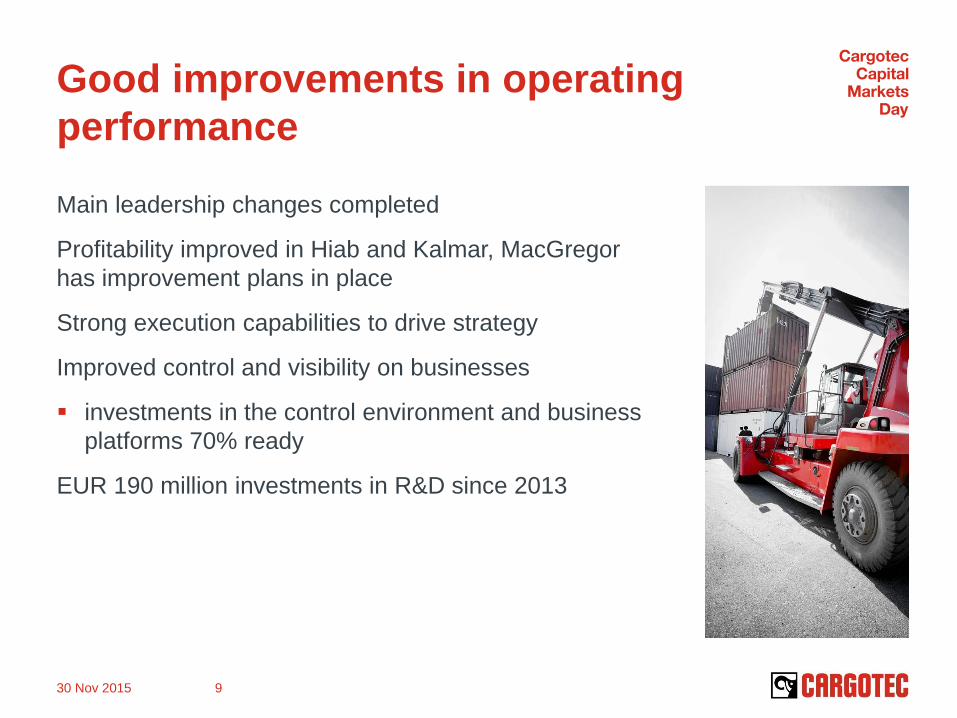
Good improvements in operating
performance
Main leadership changes completed
Profitability improved in Hiab and Kalmar, MacGregor
has improvement plans in place
Strong execution capabilities to drive strategy
Improved control and visibility on businesses
investments in the control environment and business
platforms 70% ready
EUR 190 million investments in R&D since 2013
30 Nov 2015 9
Building on
our strengths
#1 global market leader
in core segments
Growth businesses supported
by megatrends
Category defining brands
Industry leading innovations
30 Nov 2015 10
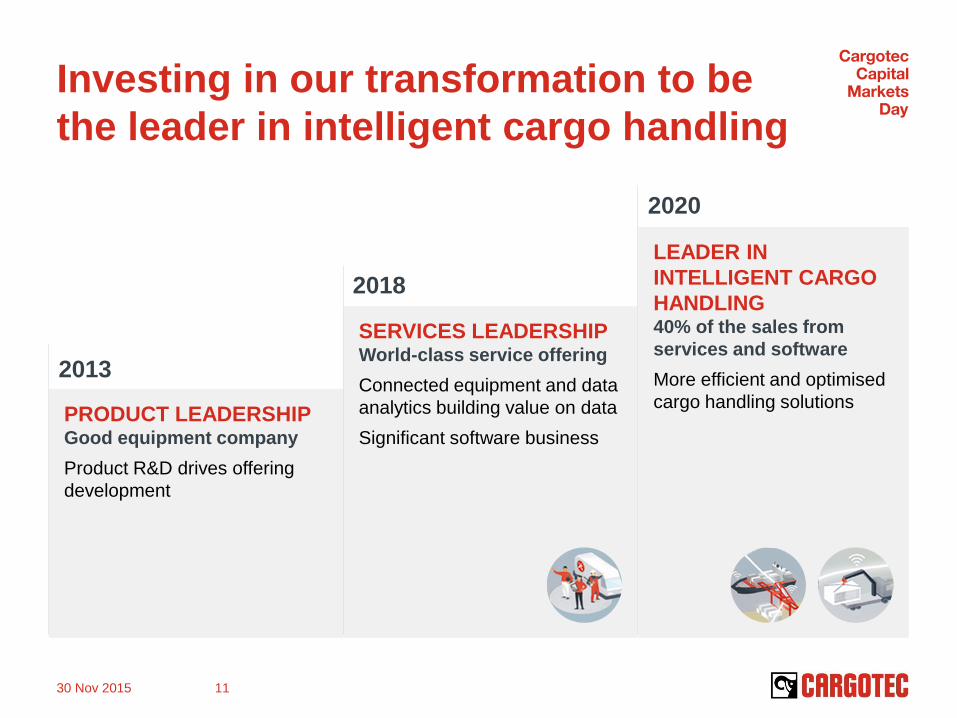
Investing in our transformation to be
the leader in intelligent cargo handling
30 Nov 2015 11
PRODUCT LEADERSHIP Good equipment company
Product R&D drives offering
development
SERVICES LEADERSHIP World-class service offering
Connected equipment and data
analytics building value on data
Significant software business
LEADER IN
INTELLIGENT CARGO
HANDLING 40% of the sales from
services and software
More efficient and optimised
cargo handling solutions
2020
2018
2013
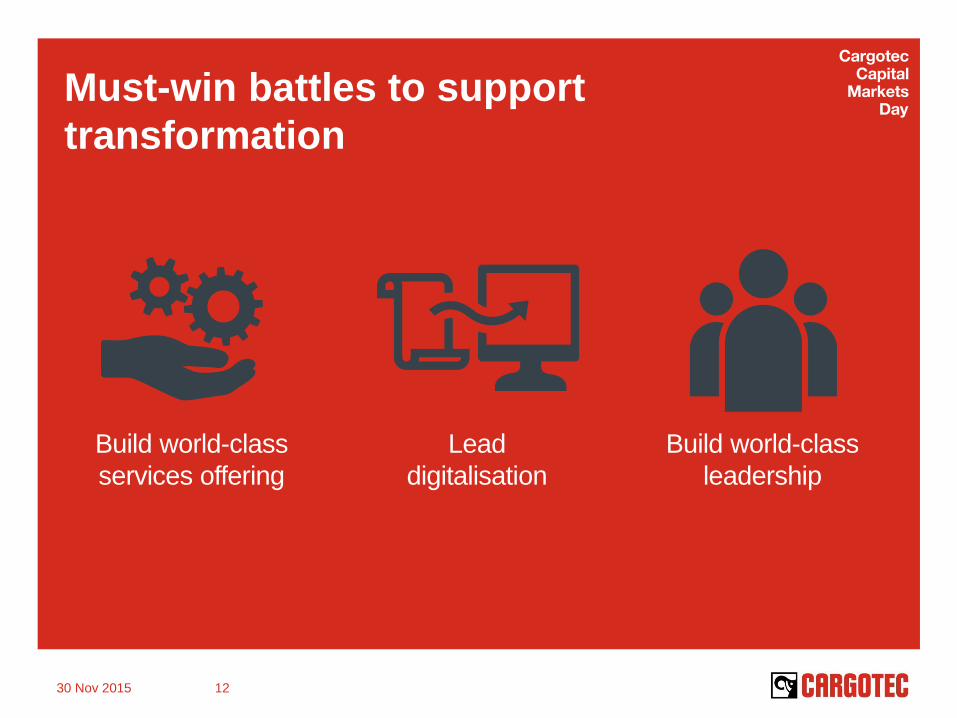
Must-win battles to support
transformation
Lead
digitalisation
Build world-class
leadership
Build world-class
services offering
30 Nov 2015 12
Cargotec has strong base for value
creation across its three business areas
Combining agility and focus with the scale and capabilities
of a larger group
Driving world class practises and capabilities in services,
digitalisation and leadership development
Shaping the underlying portfolio based on business
attractiveness, market structure and strategic direction
Investing more in high growth and/or high return
businesses
Filling gaps in technology and geographical footprint
Disposing non-strategic/low performing businesses
Right base to drive shareholder value of the company,
15% return on capital employed* over the cycle
30 Nov 2015 13
* ROCE pre-tax
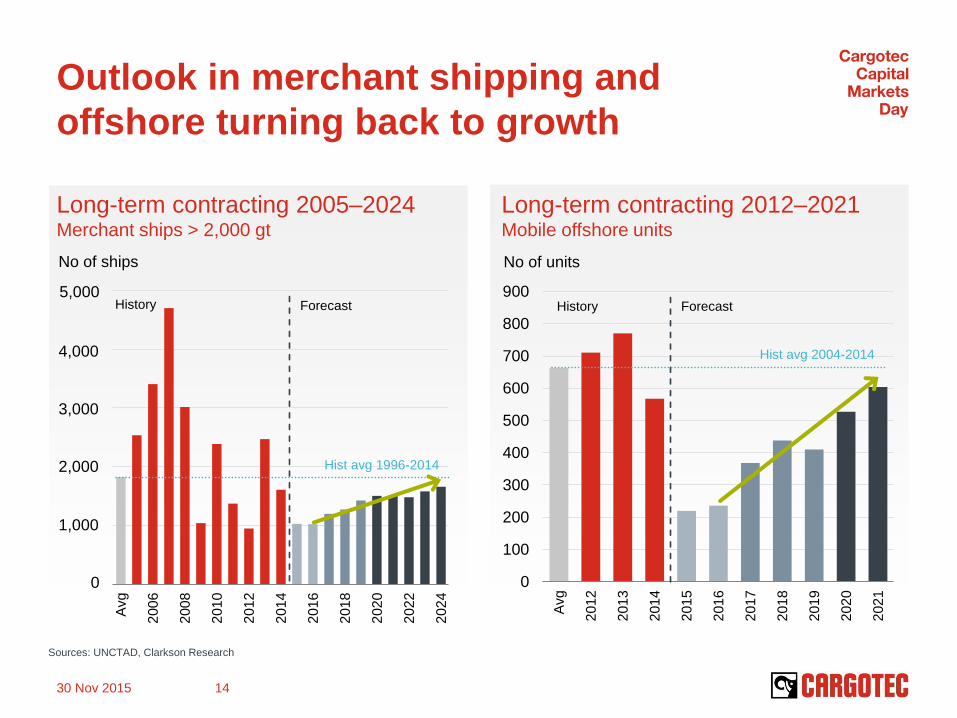
Outlook in merchant shipping and
offshore turning back to growth
Long-term contracting 2005–2024 Merchant ships > 2,000 gt
Avg
200
6
200
8
201
0
201
2
201
4
201
6
201
8
202
0
202
2
202
4
Long-term contracting 2012–2021 Mobile offshore units
0
100
200
300
400
500
600
700
800
900
Avg
201
2
201
3
201
4
201
5
201
6
201
7
201
8
201
9
202
0
202
1
30 Nov 2015 14
Sources: UNCTAD, Clarkson Research
No of units
Forecast History
Hist avg 2004-2014
No of ships
5,000
4,000
3,000
2,000
1,000
0
Hist avg 1996-2014
Forecast History
0
200
400
600
800
1 000
2012 2013 2014 2015 2016 2017 2018 2019
APAC EMEA AMER
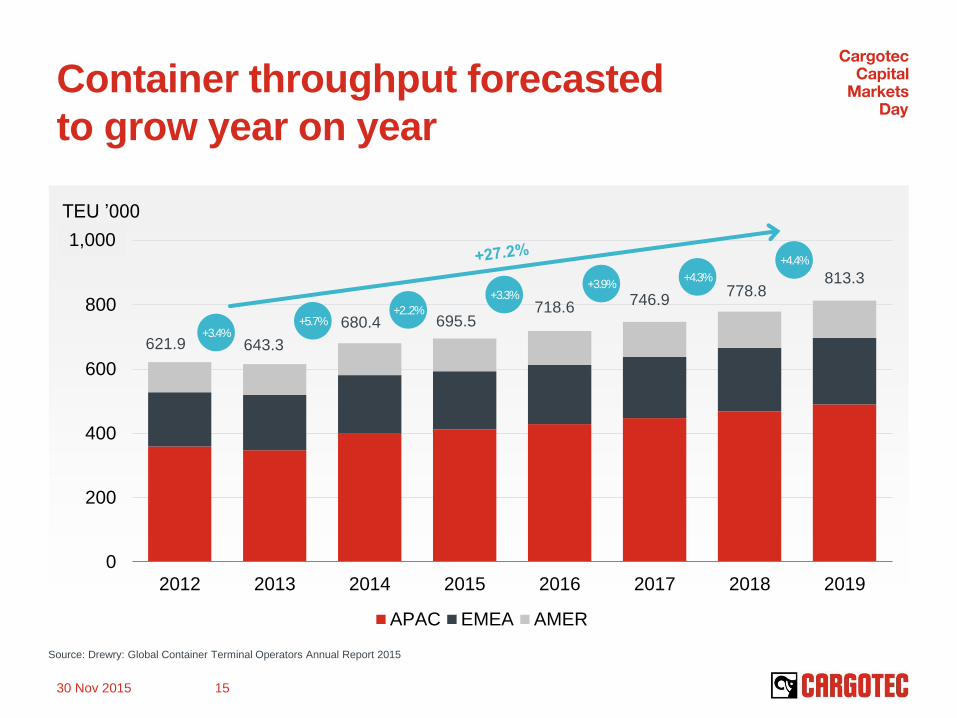
Container throughput forecasted
to grow year on year
Source: Drewry: Global Container Terminal Operators Annual Report 2015
621.9 643.3
680.4 695.5 718.6
746.9
813.3
+3.4% +5.7%
+2..2%
+3.3% +3.9%
+4.3%
1,000
778.8
+4.4%
TEU ’000
30 Nov 2015 15
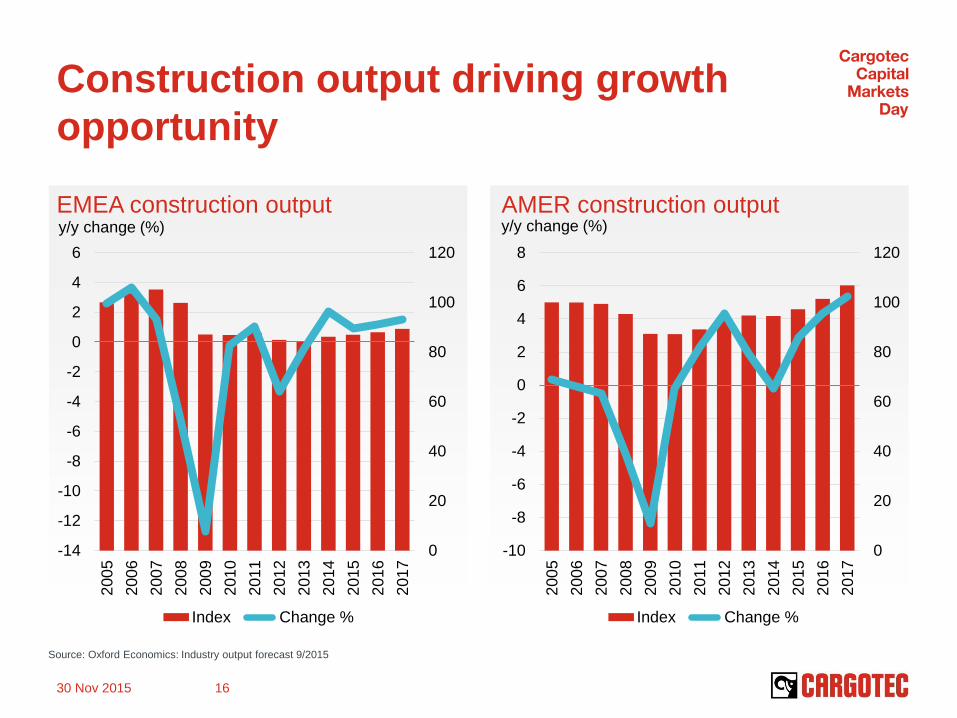
Construction output driving growth
opportunity
EMEA construction output AMER construction output
30 Nov 2015 16
y/y change (%) y/y change (%)
0
20
40
60
80
100
120
-14
-12
-10
-8
-6
-4
-2
0
2
4
6
200
5
200
6
200
7
200
8
200
9
201
0
201
1
201
2
201
3
201
4
201
5
201
6
201
7
Index Change %
0
20
40
60
80
100
120
-10
-8
-6
-4
-2
0
2
4
6
8
200
5
200
6
200
7
200
8
200
9
201
0
201
1
201
2
201
3
201
4
201
5
201
6
201
7
Index Change %
Source: Oxford Economics: Industry output forecast 9/2015
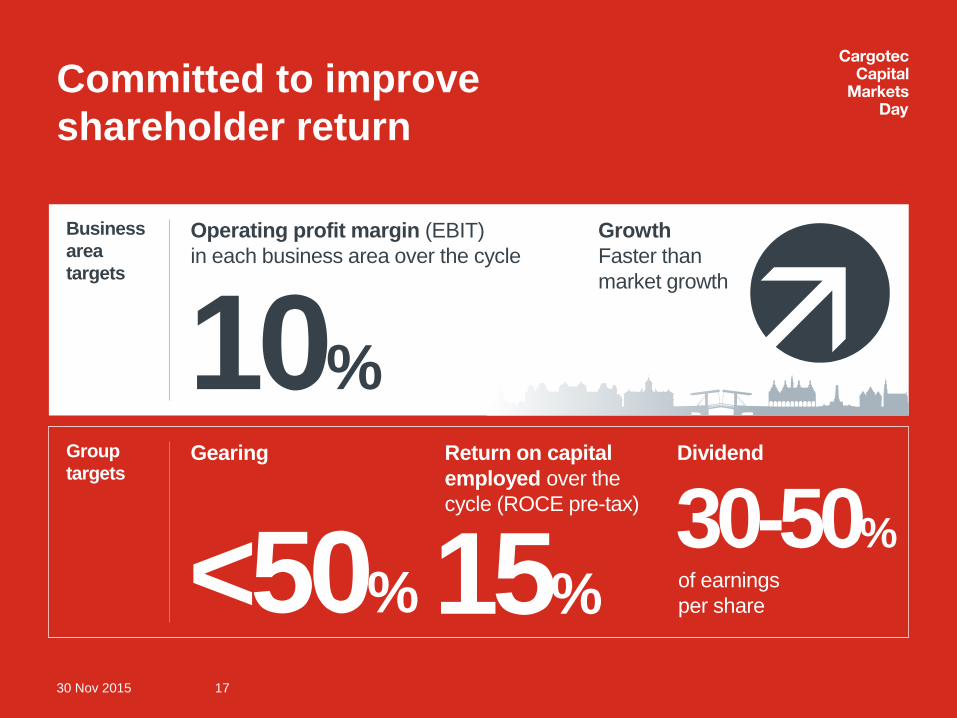
Committed to improve
shareholder return
30 Nov 2015 17
Gearing Dividend
of earnings
per share
Group
targets
<50% 30-50%
Operating profit margin (EBIT)
in each business area over the cycle
Growth
Faster than
market growth
Business
area
targets
10%
15%
Return on capital
employed over the
cycle (ROCE pre-tax)
30 Nov 2015 18
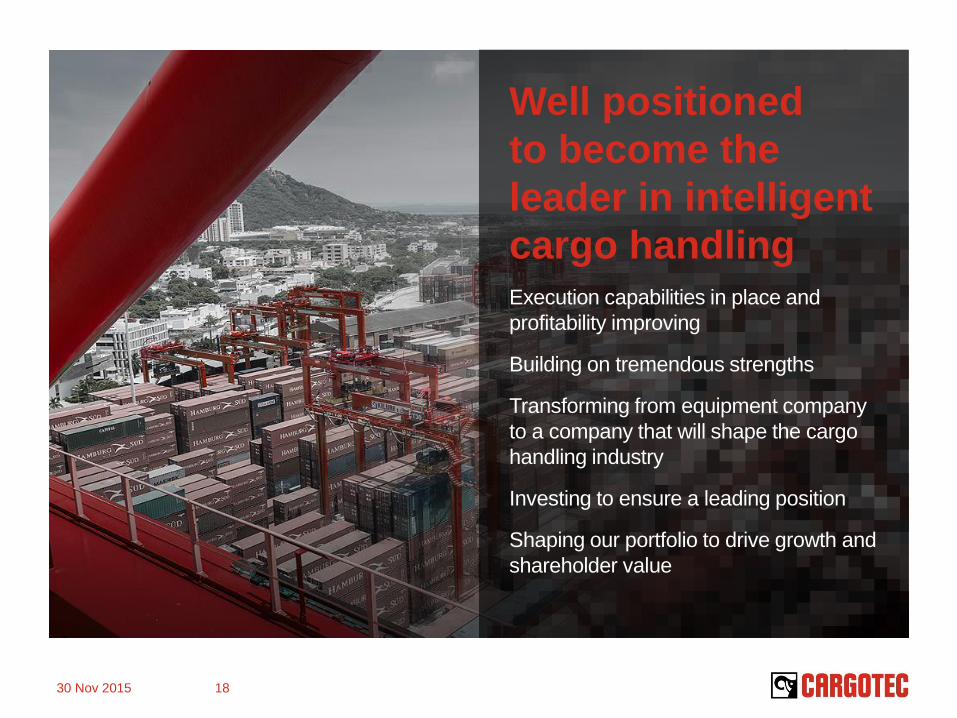
Well positioned
to become the
leader in intelligent
cargo handling Execution capabilities in place and
profitability improving
Building on tremendous strengths
Transforming from equipment company
to a company that will shape the cargo
handling industry
Investing to ensure a leading position
Shaping our portfolio to drive growth and
shareholder value

Questions
Building value over
the business cycle Roland Sundén
President, Hiab
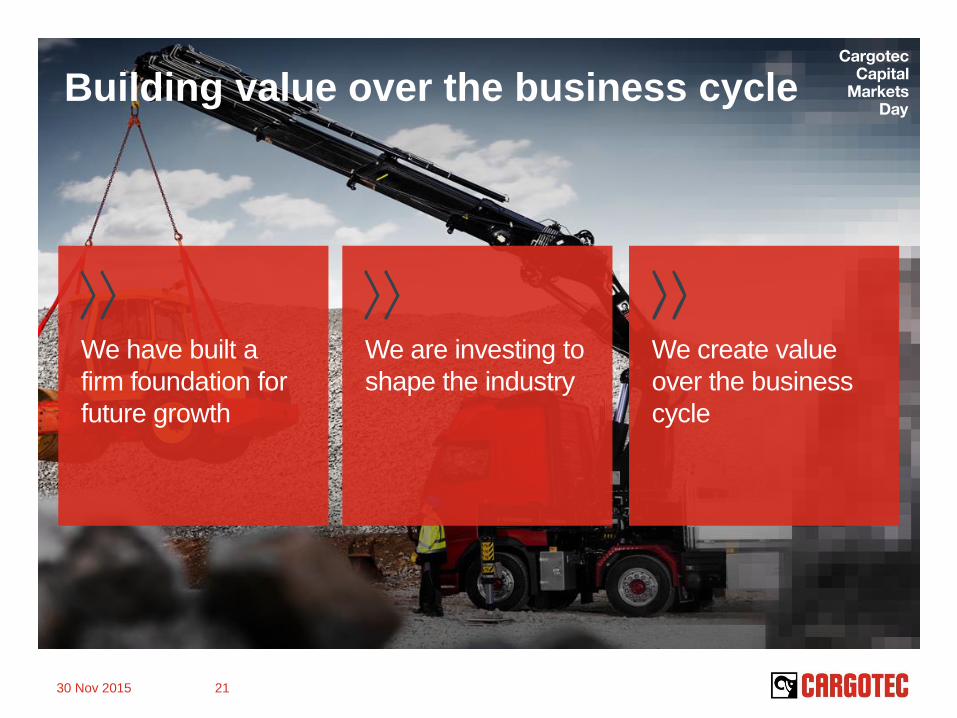
Building value over the business cycle
We are investing to
shape the industry
We have built a
firm foundation for
future growth
We create value
over the business
cycle
30 Nov 2015 21
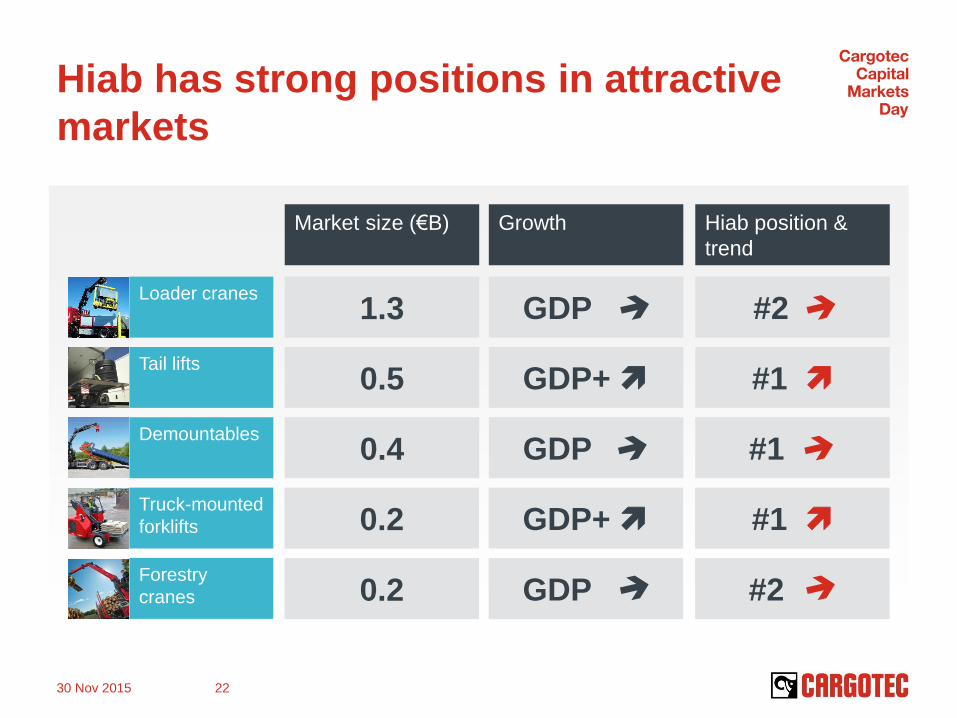
Hiab has strong positions in attractive
markets
30 Nov 2015 22
Loader cranes
Tail lifts
Demountables
Truck-mounted
forklifts
Forestry
cranes
Market size (€B) Growth Hiab position &
trend
1.3 GDP #2
0.5 GDP+
0.4 GDP
0.2 GDP+
0.2 GDP #2
#1
#1
#1
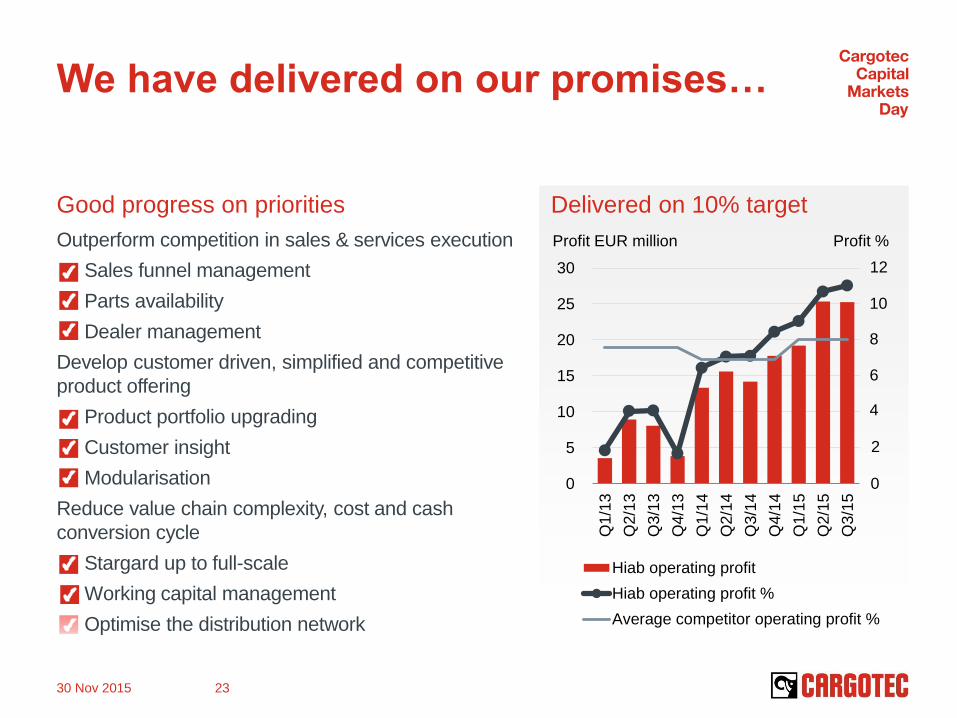
We have delivered on our promises…
Good progress on priorities
Outperform competition in sales & services execution
Sales funnel management
Parts availability
Dealer management
Develop customer driven, simplified and competitive
product offering
Product portfolio upgrading
Customer insight
Modularisation
Reduce value chain complexity, cost and cash
conversion cycle
Stargard up to full-scale
Working capital management
Optimise the distribution network
Delivered on 10% target
0
5
10
15
20
25
30
Q1/1
3
Q2/1
3
Q3/1
3
Q4/1
3
Q1/1
4
Q2/1
4
Q3/1
4
Q4/1
4
Q1/1
5
Q2/1
5
Q3/1
5
Hiab operating profit
Hiab operating profit %
Average competitor operating profit %
Profit EUR million Profit %
12
10
8
6
4
2
0
30 Nov 2015 23
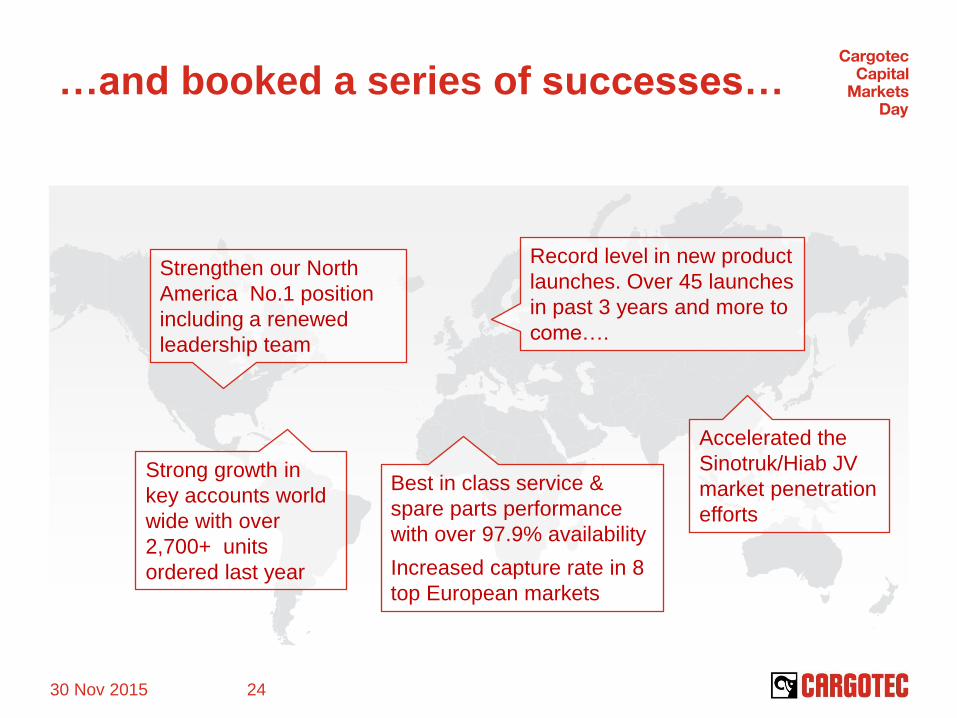
Strengthen our North
America No.1 position
including a renewed
leadership team
Accelerated the
Sinotruk/Hiab JV
market penetration
efforts
Record level in new product
launches. Over 45 launches
in past 3 years and more to
come….
…and booked a series of successes…
30 Nov 2015 24
Strong growth in
key accounts world
wide with over
2,700+ units
ordered last year
Best in class service &
spare parts performance
with over 97.9% availability
Increased capture rate in 8
top European markets
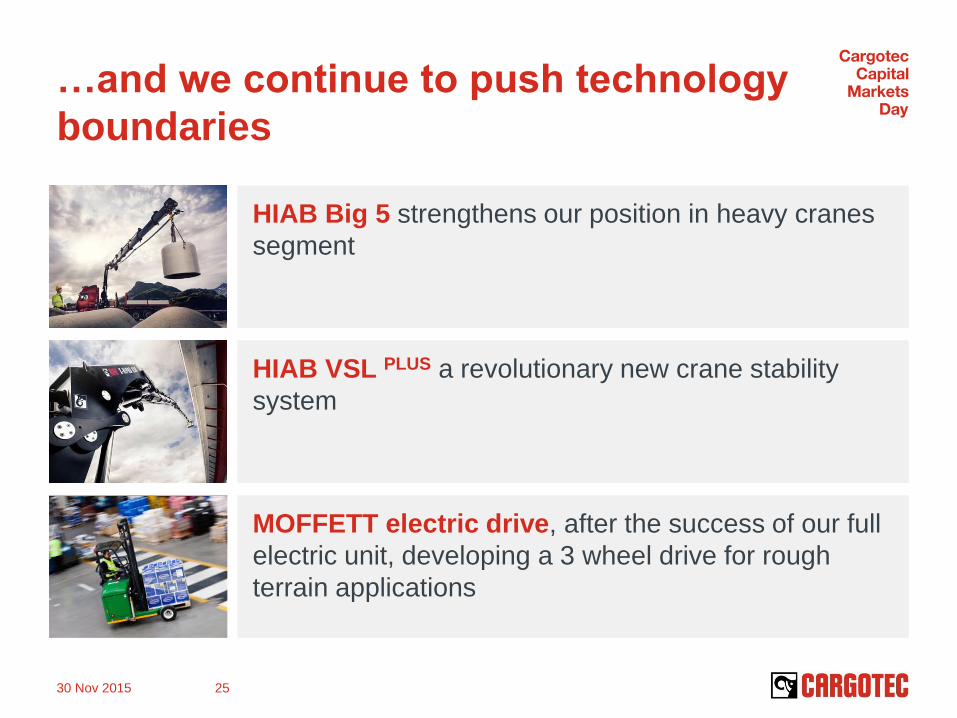
…and we continue to push technology
boundaries
MOFFETT electric drive, after the success of our full
electric unit, developing a 3 wheel drive for rough
terrain applications
HIAB Big 5 strengthens our position in heavy cranes
segment
HIAB VSL PLUS a revolutionary new crane stability
system
30 Nov 2015 25
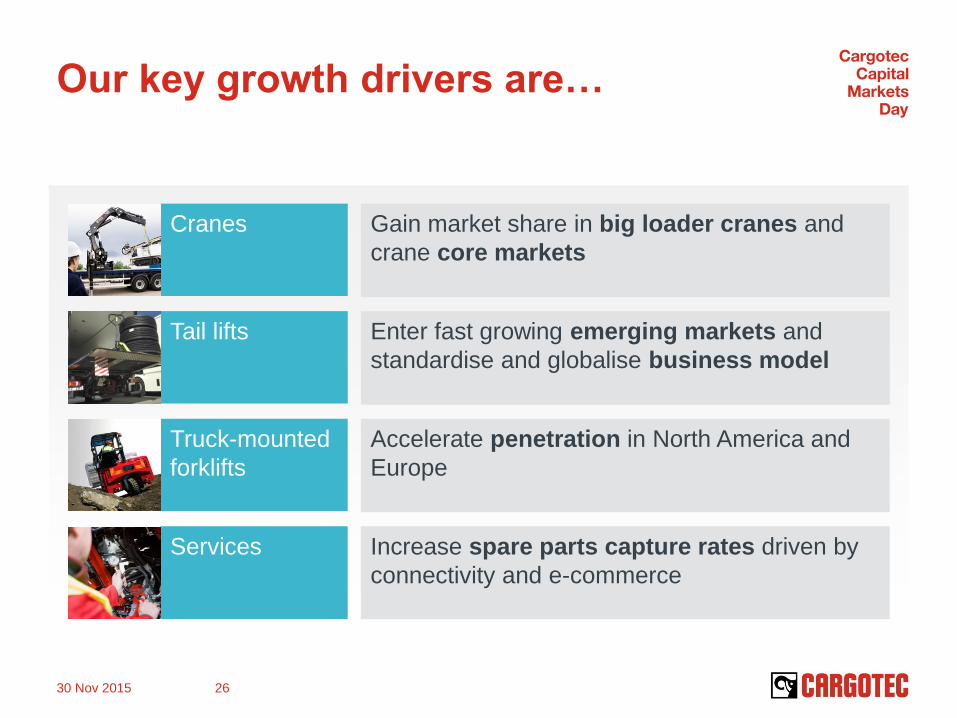
Our key growth drivers are…
Cranes
Tail lifts
Truck-mounted
forklifts
Services
Gain market share in big loader cranes and
crane core markets
Enter fast growing emerging markets and
standardise and globalise business model
Accelerate penetration in North America and
Europe
Increase spare parts capture rates driven by
connectivity and e-commerce
30 Nov 2015 26
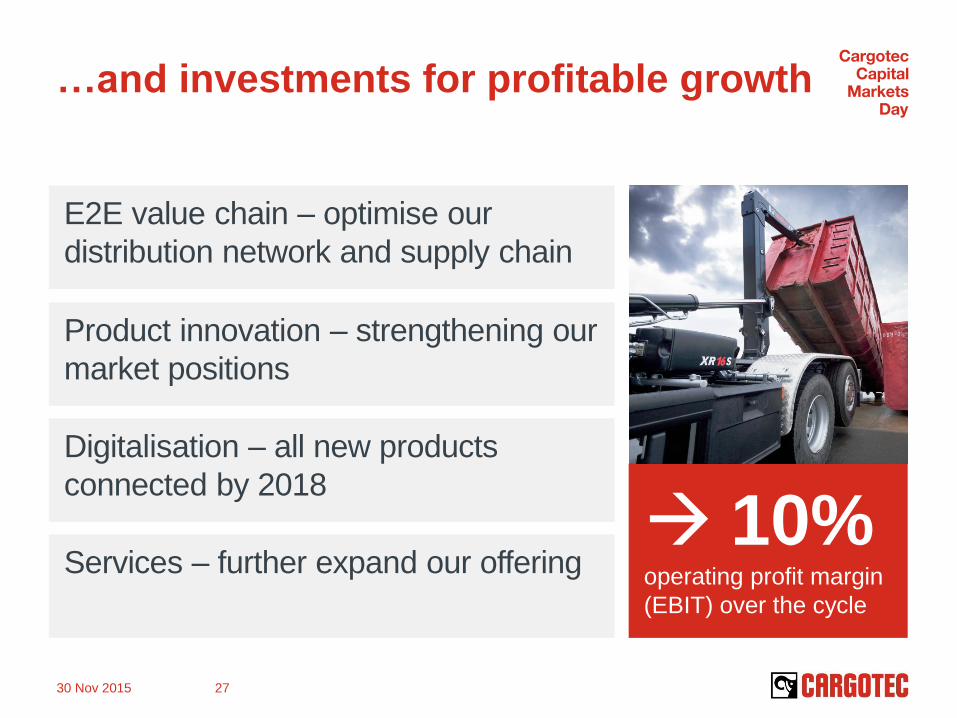
…and investments for profitable growth
10% operating profit margin
(EBIT) over the cycle
E2E value chain – optimise our
distribution network and supply chain
Product innovation – strengthening our
market positions
Digitalisation – all new products
connected by 2018
Services – further expand our offering
30 Nov 2015 27
Building value over the business cycle Conclusions
We are investing to
shape the industry –
E2E value chain,
innovation,
digitalisation and
services
We create value over
the business cycle –
10% operating profit
margin (EBIT)
We have built a firm
foundation – great
cash generation for
profitable growth
30 Nov 2015 28

Questions
Focus on profitable growth
Olli Isotalo, President, Kalmar
Focus on
profitable growth
Win in automation
Grow in software
Sustain global leadership
in mobile equipment
Digital services and spare
parts excellence
30 Nov 2015 31
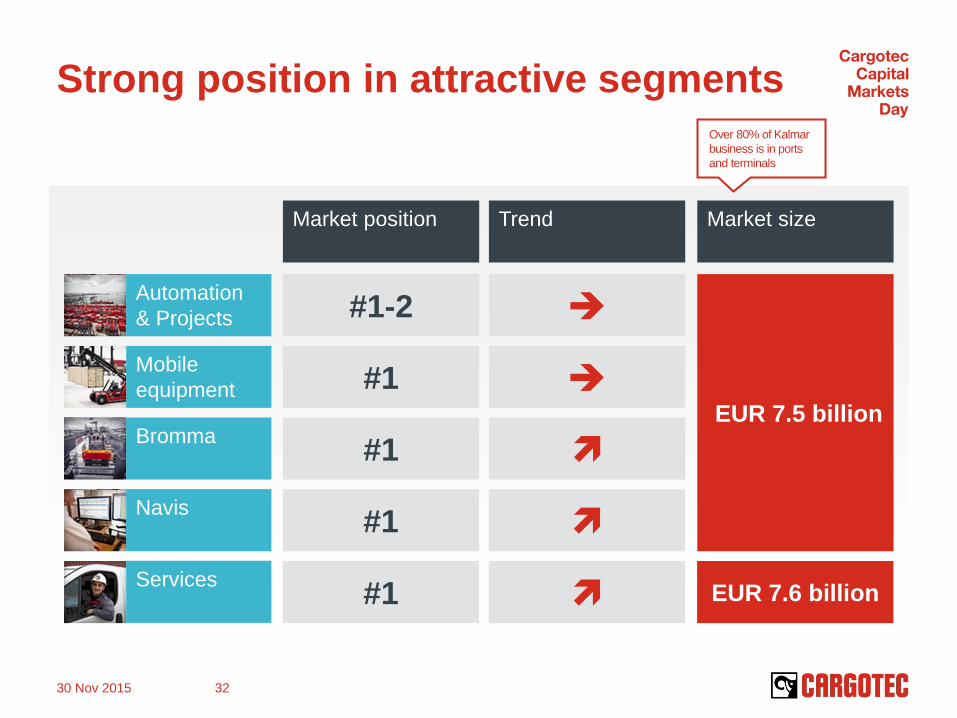
Strong position in attractive segments
Automation
& Projects
Mobile
equipment
Bromma
Navis
Services
Market position Trend Market size
#1-2
EUR 7.5 billion
#1
#1
#1
#1 EUR 7.6 billion
Over 80% of Kalmar
business is in ports
and terminals
30 Nov 2015 32
0
200
400
600
800
1 000
2012 2013 2014 2015 2016 2017 2018 2019
APAC EMEA AMER
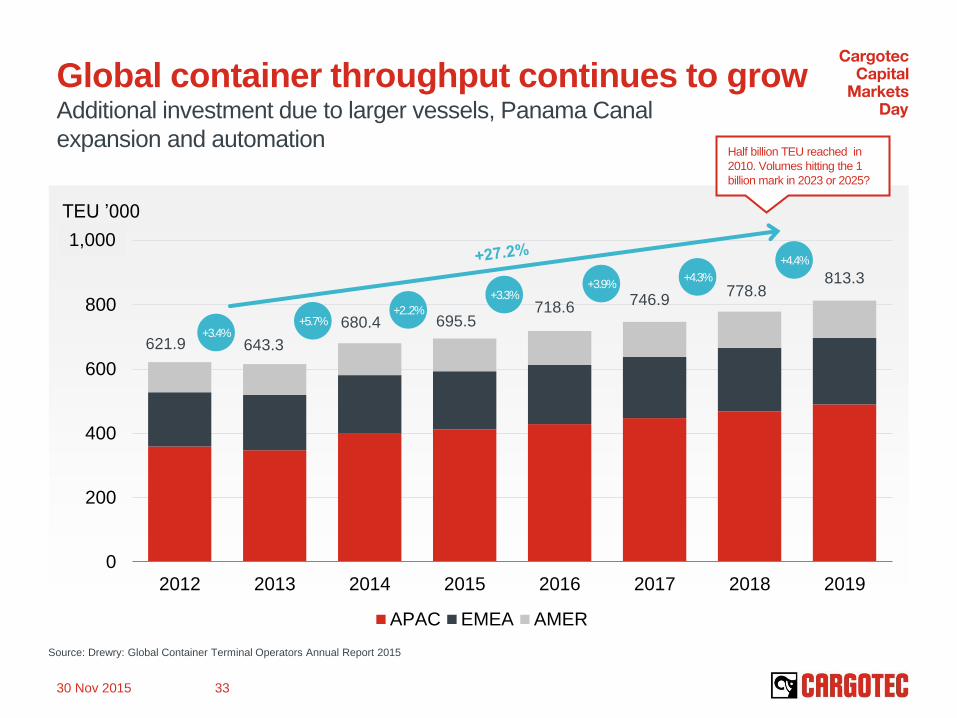
Global container throughput continues to grow Additional investment due to larger vessels, Panama Canal
expansion and automation
Source: Drewry: Global Container Terminal Operators Annual Report 2015
621.9 643.3
680.4 695.5 718.6
746.9
813.3
+3.4% +5.7%
+2..2%
+3.3% +3.9%
+4.3%
1,000
778.8
+4.4%
Half billion TEU reached in
2010. Volumes hitting the 1
billion mark in 2023 or 2025?
TEU ’000
30 Nov 2015 33
0
2
4
6
8
10
12
14
16
18
De
c 1
2
Ma
r 1
3
Ju
n 1
3
Se
p 1
3
De
c 1
3
Ma
r 1
4
Ju
n 1
4
Se
p 1
4
De
c 1
4
Ma
r 1
5
Ju
n 1
5
Se
p 1
5
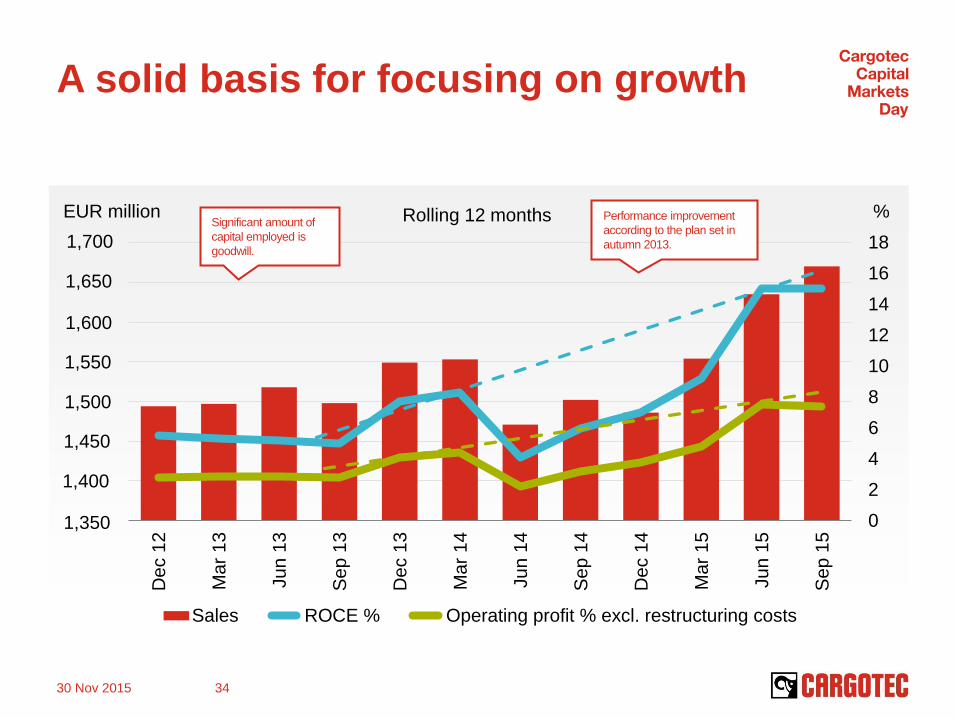
Sales ROCE % Operating profit % excl. restructuring costs
A solid basis for focusing on growth
EUR million % Rolling 12 months Significant amount of
capital employed is
goodwill.
Performance improvement
according to the plan set in
autumn 2013.
30 Nov 2015 34
1,700
1,650
1,600
1,550
1,500
1,450
1,400
1,350
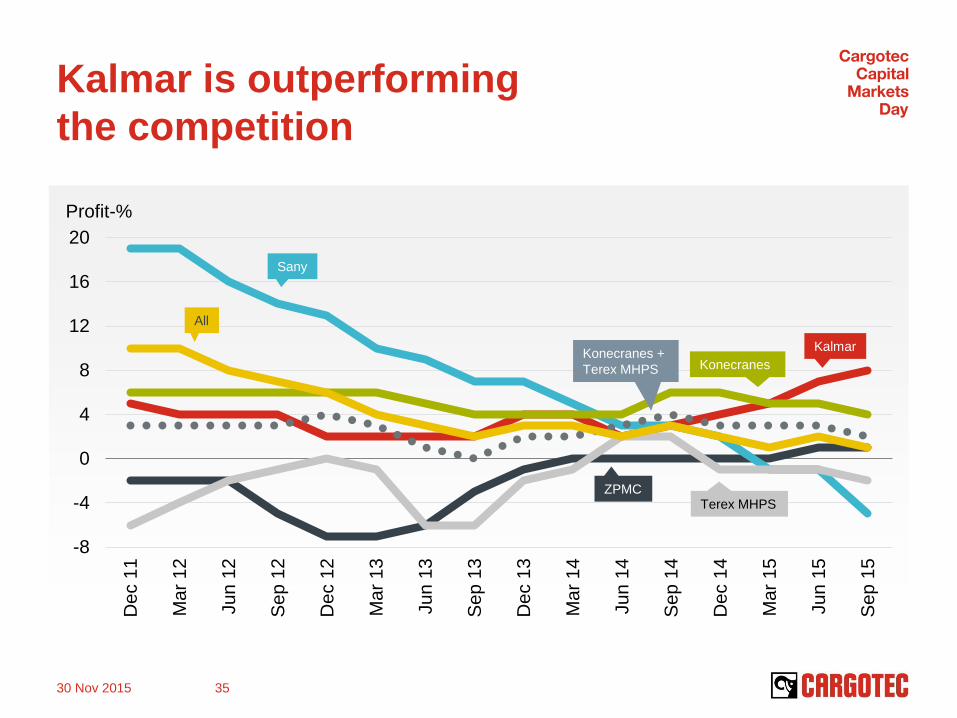
Kalmar is outperforming
the competition
30 Nov 2015 35
-8
-4
0
4
8
12
16
20
De
c 1
1
Ma
r 1
2
Ju
n 1
2
Se
p 1
2
De
c 1
2
Mar
13
Ju
n 1
3
Se
p 1
3
De
c 1
3
Ma
r 1
4
Ju
n 1
4
Se
p 1
4
De
c 1
4
Ma
r 1
5
Ju
n 1
5
Se
p 1
5
Profit-%
Kalmar
Konecranes
Sany
Terex MHPS
All
ZPMC
Konecranes +
Terex MHPS
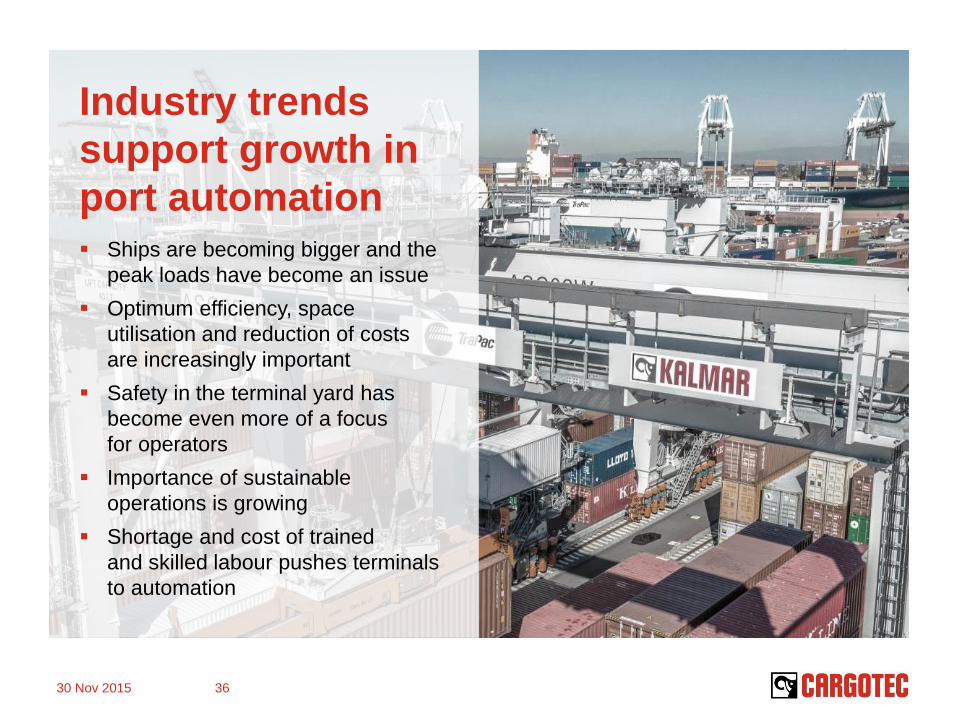
Industry trends
support growth in
port automation Ships are becoming bigger and the
peak loads have become an issue
Optimum efficiency, space
utilisation and reduction of costs
are increasingly important
Safety in the terminal yard has
become even more of a focus
for operators
Importance of sustainable
operations is growing
Shortage and cost of trained
and skilled labour pushes terminals
to automation
30 Nov 2015 36
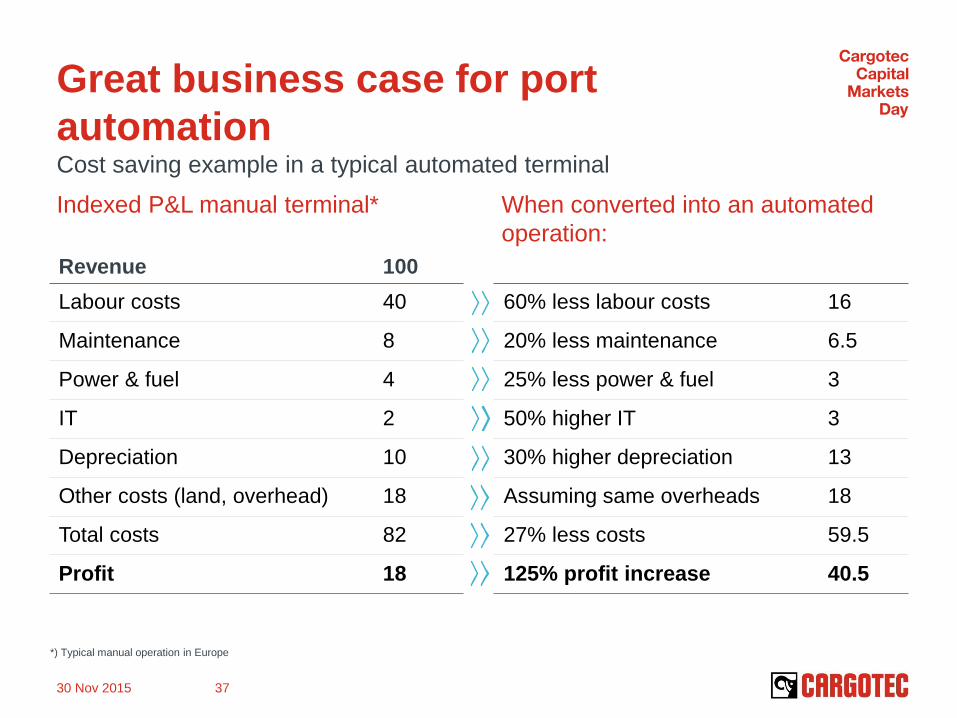
Great business case for port
automation Cost saving example in a typical automated terminal
Indexed P&L manual terminal*
Revenue 100
Labour costs 40
Maintenance 8
Power & fuel 4
IT 2
Depreciation 10
Other costs (land, overhead) 18
Total costs 82
Profit 18
When converted into an automated
operation:
*) Typical manual operation in Europe
60% less labour costs 16
20% less maintenance 6.5
25% less power & fuel 3
50% higher IT 3
30% higher depreciation 13
Assuming same overheads 18
27% less costs 59.5
125% profit increase 40.5
30 Nov 2015 37
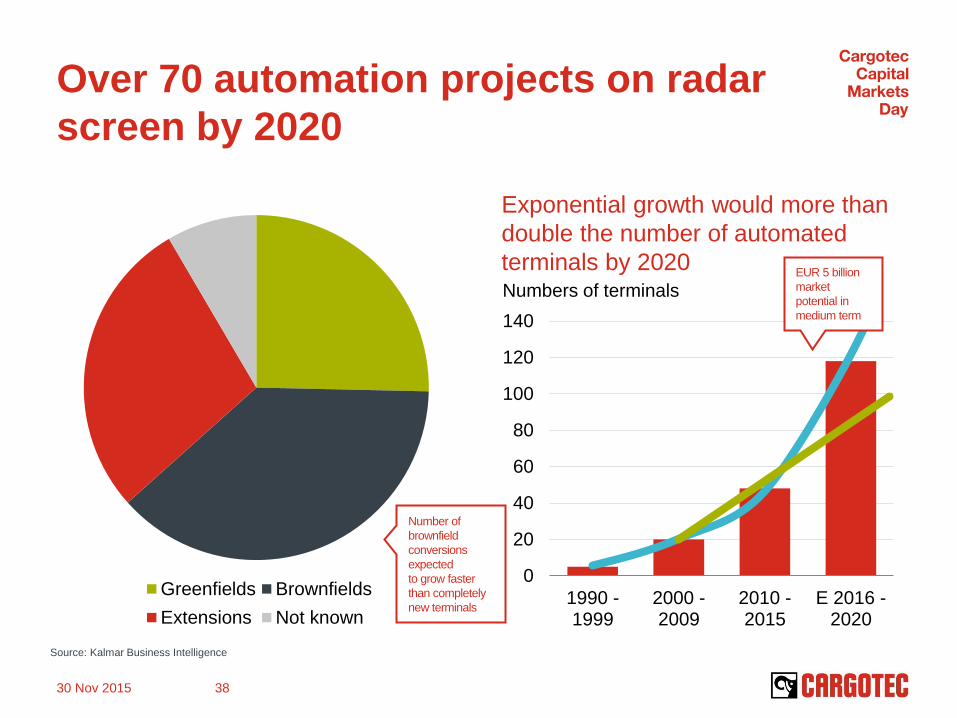
Over 70 automation projects on radar
screen by 2020
Greenfields Brownfields
Extensions Not known
0
20
40
60
80
100
120
140
1990 -1999
2000 -2009
2010 -2015
E 2016 -2020
Source: Kalmar Business Intelligence
Number of
brownfield
conversions
expected
to grow faster
than completely
new terminals
Exponential growth would more than
double the number of automated
terminals by 2020 EUR 5 billion
market
potential in
medium term
Numbers of terminals
30 Nov 2015 38
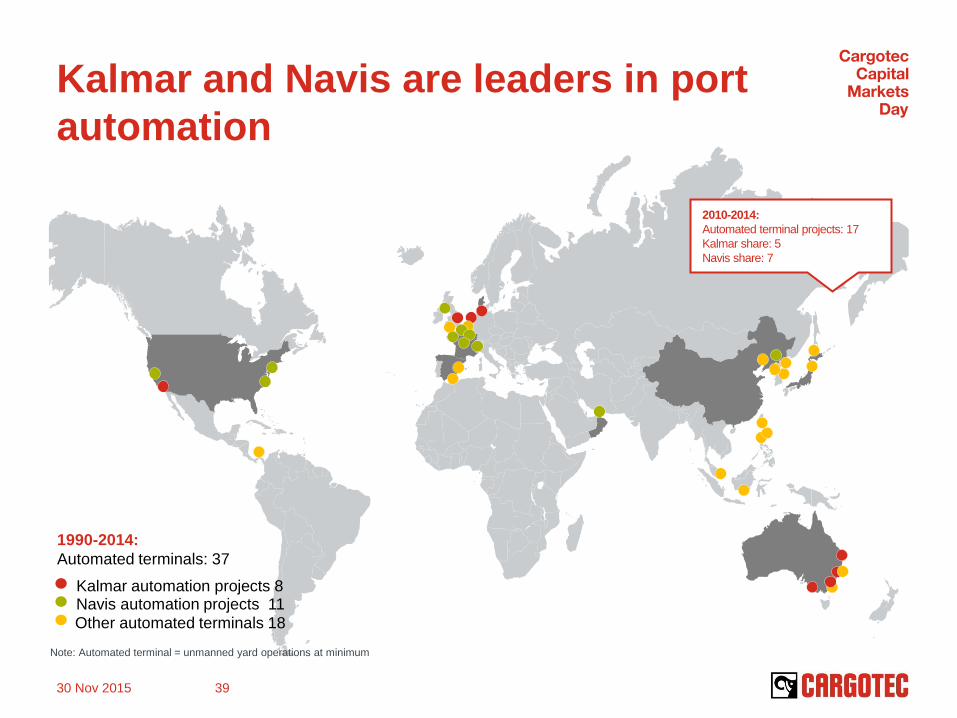
Kalmar and Navis are leaders in port
automation
Kalmar automation projects 8 Navis automation projects 11
Other automated terminals 18
1990-2014:
Automated terminals: 37
2010-2014:
Automated terminal projects: 17
Kalmar share: 5
Navis share: 7
Note: Automated terminal = unmanned yard operations at minimum
30 Nov 2015 39
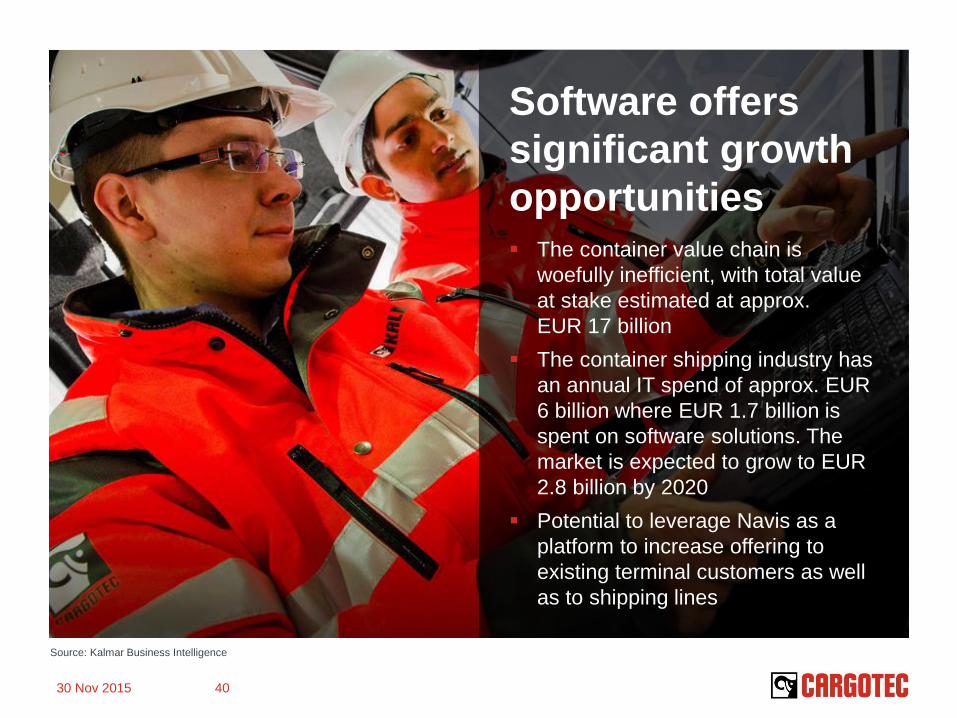
Software offers
significant growth
opportunities The container value chain is
woefully inefficient, with total value
at stake estimated at approx.
EUR 17 billion
The container shipping industry has
an annual IT spend of approx. EUR
6 billion where EUR 1.7 billion is
spent on software solutions. The
market is expected to grow to EUR
2.8 billion by 2020
Potential to leverage Navis as a
platform to increase offering to
existing terminal customers as well
as to shipping lines
Source: Kalmar Business Intelligence
30 Nov 2015 40
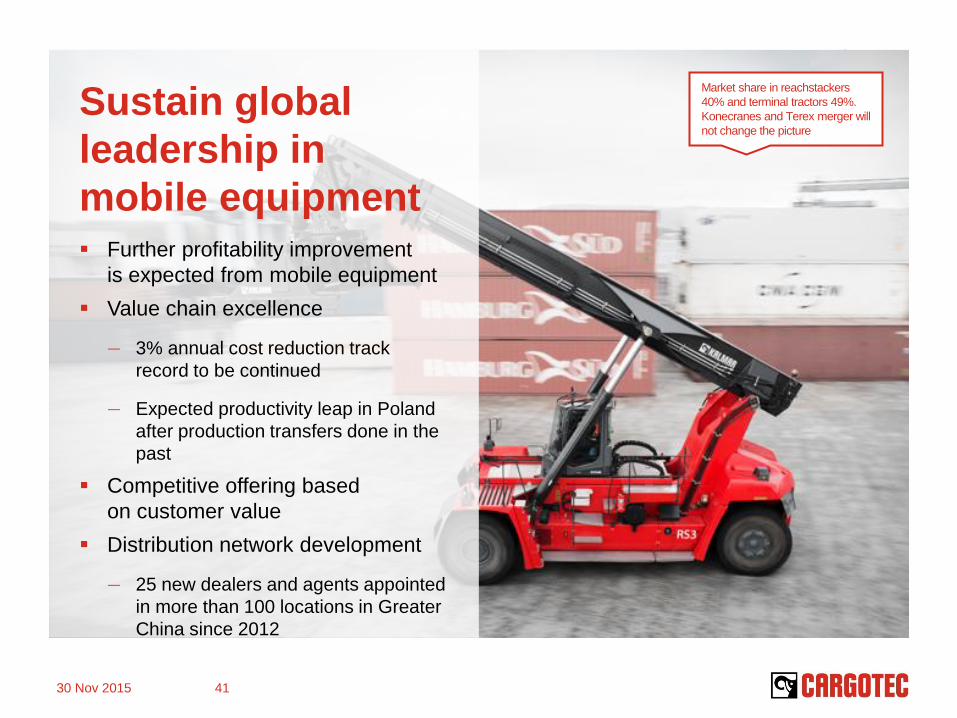
Sustain global
leadership in
mobile equipment Further profitability improvement
is expected from mobile equipment
Value chain excellence
— 3% annual cost reduction track
record to be continued
— Expected productivity leap in Poland
after production transfers done in the
past
Competitive offering based
on customer value
Distribution network development
— 25 new dealers and agents appointed
in more than 100 locations in Greater
China since 2012
Market share in reachstackers
40% and terminal tractors 49%.
Konecranes and Terex merger will
not change the picture
30 Nov 2015 41
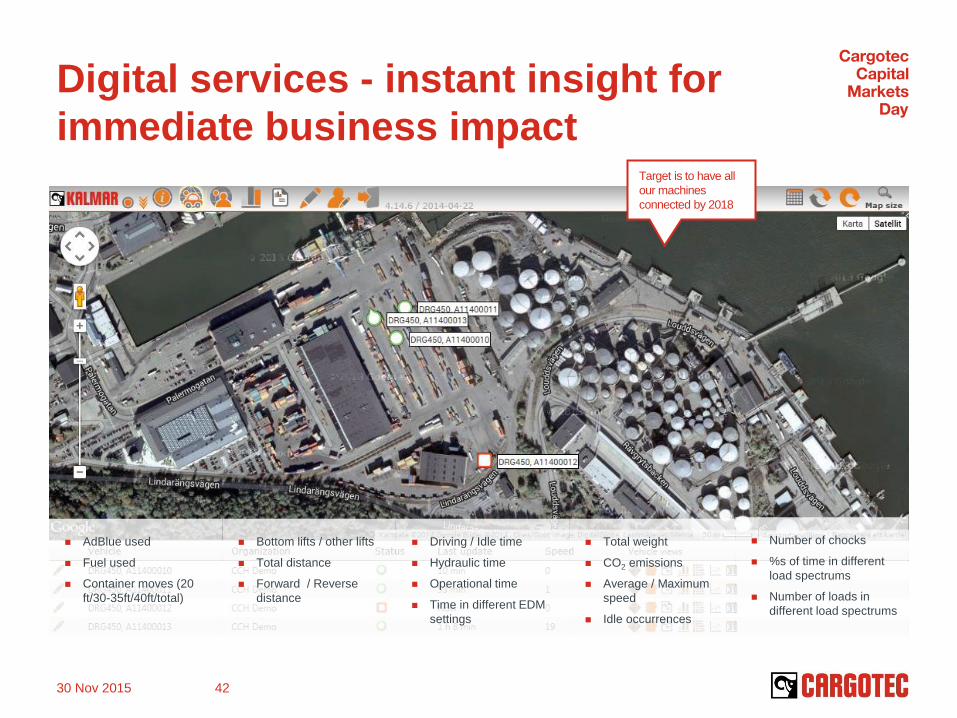
Digital services - instant insight for
immediate business impact Target is to have all
our machines
connected by 2018
AdBlue used
Fuel used
Container moves (20
ft/30-35ft/40ft/total)
Bottom lifts / other lifts
Total distance
Forward / Reverse
distance
Total weight
CO2 emissions
Average / Maximum
speed
Idle occurrences
Number of chocks
%s of time in different
load spectrums
Number of loads in
different load spectrums
Driving / Idle time
Hydraulic time
Operational time
Time in different EDM
settings
30 Nov 2015 42
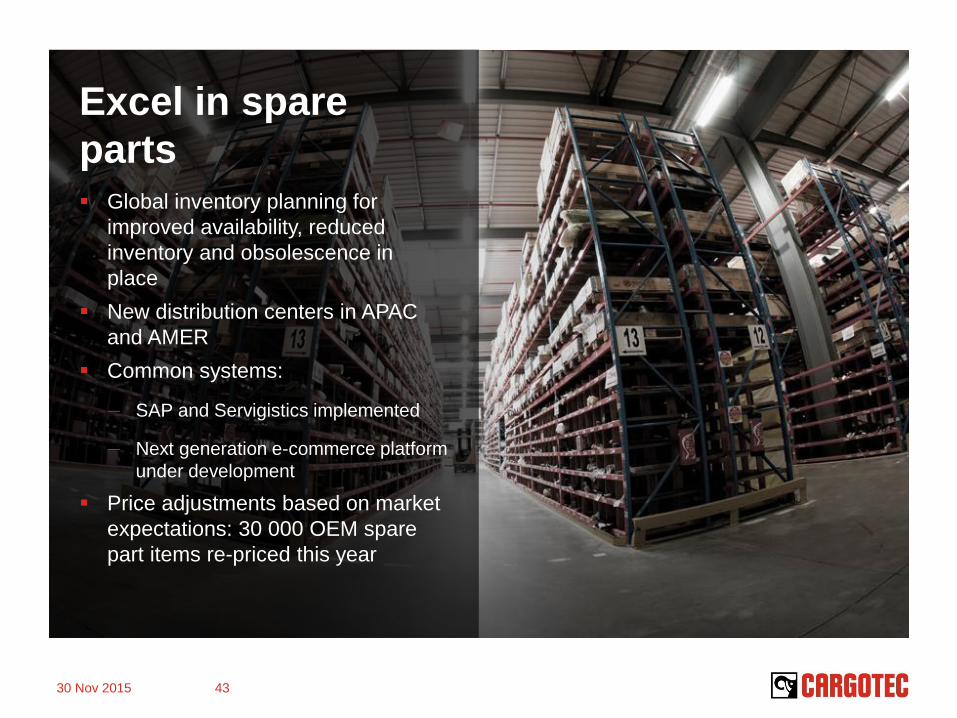
Excel in spare
parts Global inventory planning for
improved availability, reduced
inventory and obsolescence in
place
New distribution centers in APAC
and AMER
Common systems:
— SAP and Servigistics implemented
— Next generation e-commerce platform
under development
Price adjustments based on market
expectations: 30 000 OEM spare
part items re-priced this year
30 Nov 2015 43
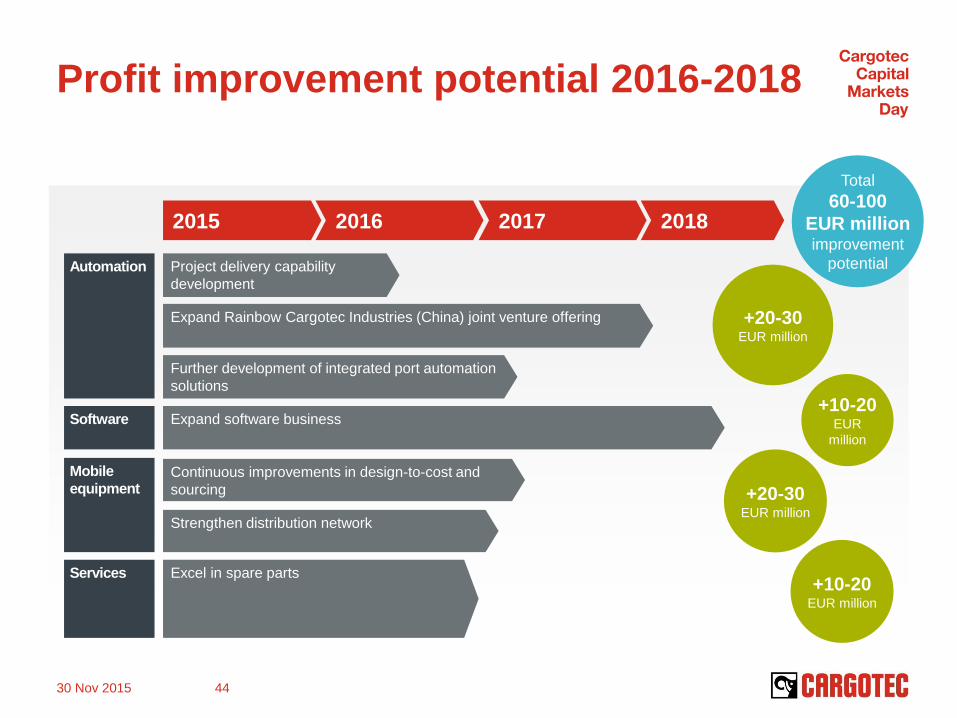
Profit improvement potential 2016-2018
2015 2016 2017 2018
Automation
Software
Mobile
equipment
Services Excel in spare parts
Project delivery capability
development
Expand Rainbow Cargotec Industries (China) joint venture offering
Continuous improvements in design-to-cost and
sourcing
Strengthen distribution network
Expand software business
Further development of integrated port automation
solutions
+20-30 EUR million
Total
60-100
EUR million improvement
potential
+10-20 EUR
million
+20-30 EUR million
+10-20 EUR million
30 Nov 2015 44
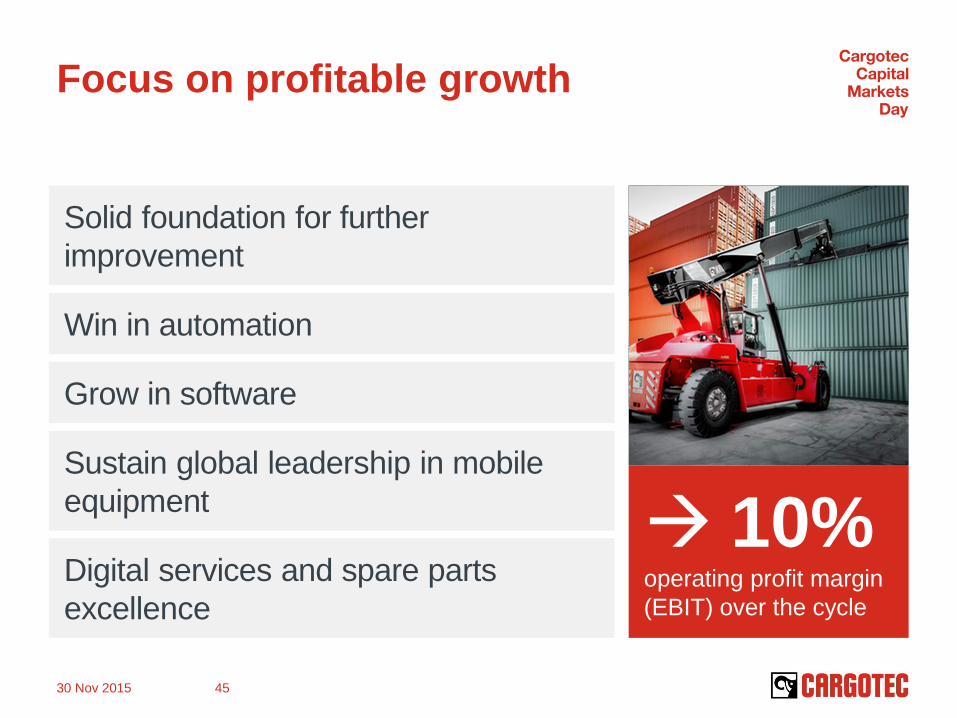
Focus on profitable growth
10% operating profit margin
(EBIT) over the cycle
Solid foundation for further
improvement
Win in automation
Grow in software
Sustain global leadership in mobile
equipment
Digital services and spare parts
excellence
30 Nov 2015 45

Questions
Improving profitability and preparing
for longer term growth Michel van Roozendaal, President, MacGregor
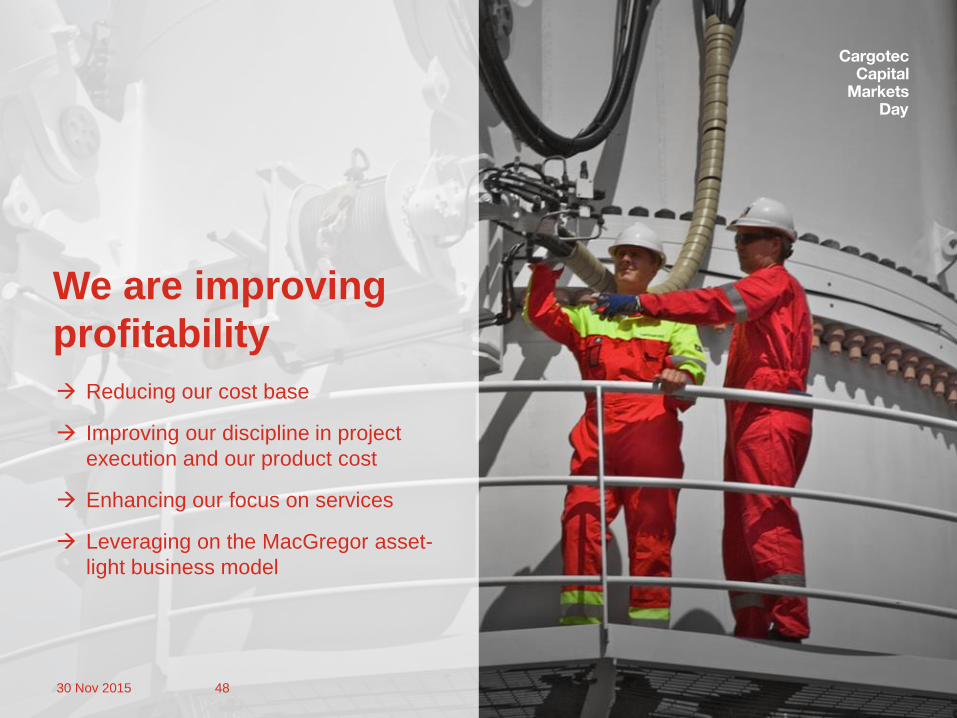
We are improving
profitability
Reducing our cost base
Improving our discipline in project
execution and our product cost
Enhancing our focus on services
Leveraging on the MacGregor asset-
light business model
30 Nov 2015 48
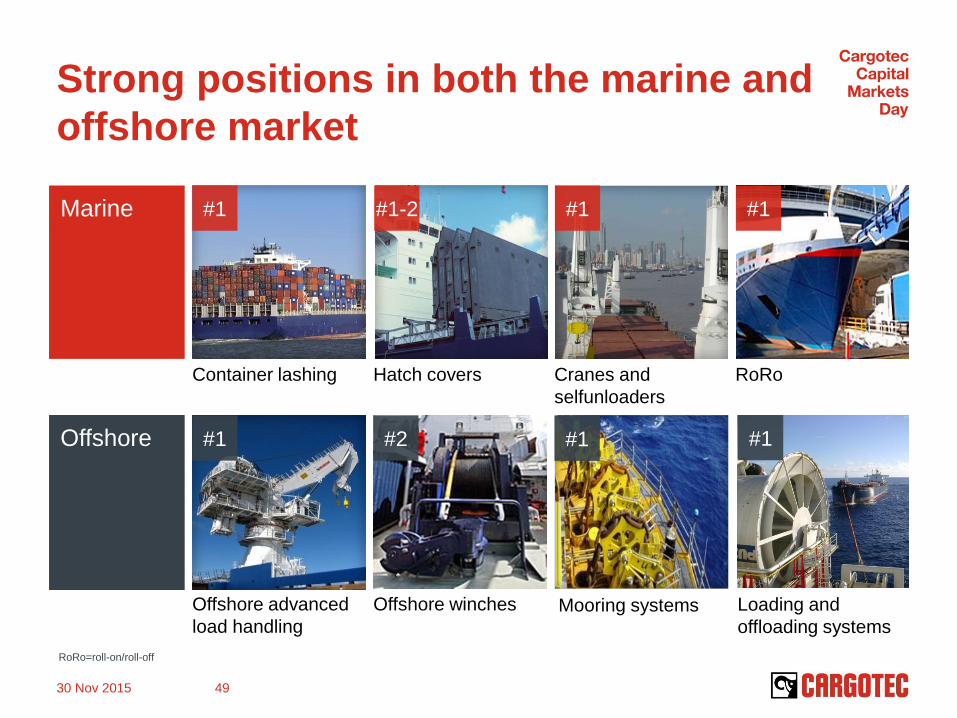
Marine
Strong positions in both the marine and
offshore market
30 Nov 2015 49
Hatch covers Container lashing
Offshore advanced
load handling
Offshore winches
Offshore
Cranes and
selfunloaders
RoRo
#1 #1-2
#1 #2
#1 #1
RoRo=roll-on/roll-off
Mooring systems
#1 #1
Loading and
offloading systems
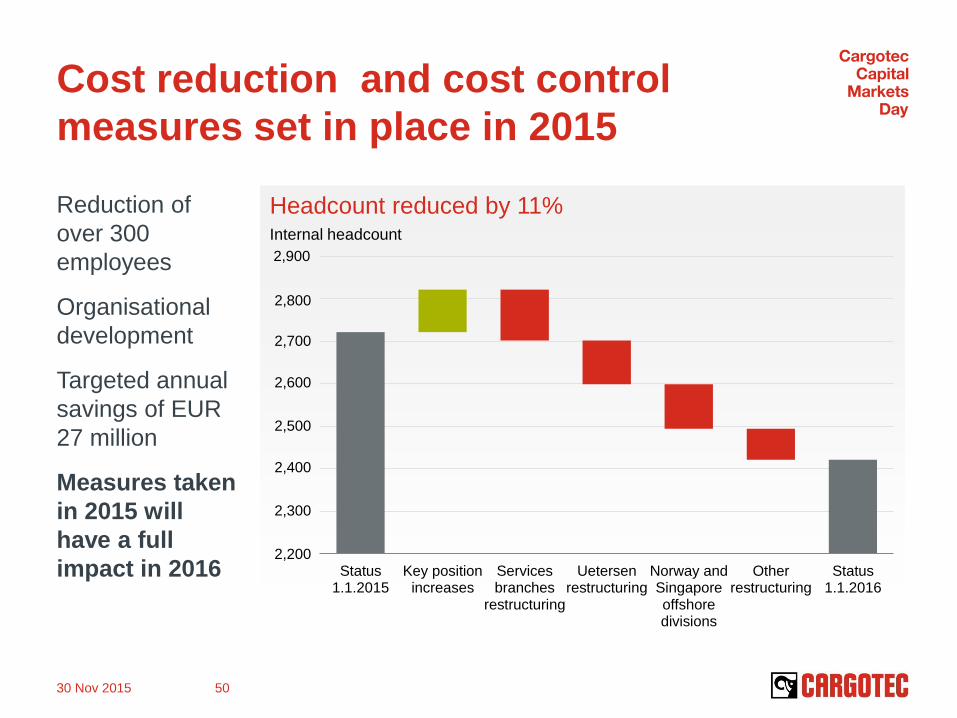
Cost reduction and cost control
measures set in place in 2015
Reduction of
over 300
employees
Organisational
development
Targeted annual
savings of EUR
27 million
Measures taken
in 2015 will
have a full
impact in 2016
30 Nov 2015 50
Headcount reduced by 11% Internal headcount
2,900
2,800
2,700
2,600
2,500
2,400
2,300
2,200 Status
1.1.2015Key position
increasesServicesbranches
restructuring
Uetersenrestructuring
Norway andSingaporeoffshoredivisions
Otherrestructuring
Status1.1.2016
Improving project execution and
reducing product cost
Project execution
Harmonised world class processes
Disciplined execution
Design-to-cost
Leverage on total MacGregor
volume
Align functionality with
requirements
Targeted savings of EUR 10 million
from design-to-cost will materialise
in 2016
30 Nov 2015 51
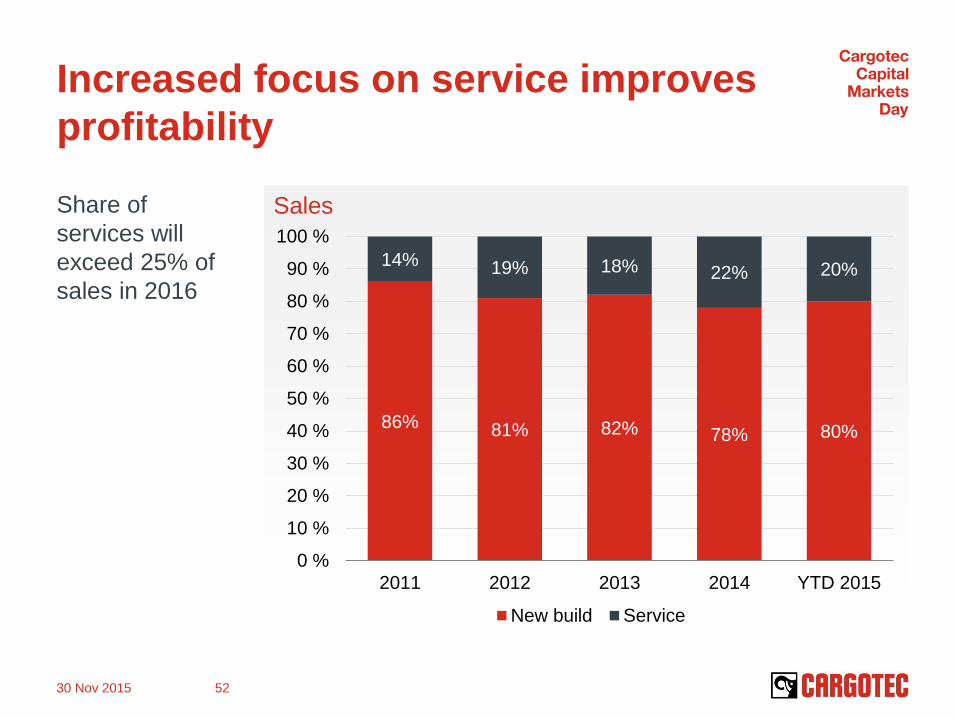
Sales
86% 81% 82% 78% 80%
14% 19% 18% 22% 20%
0 %
10 %
20 %
30 %
40 %
50 %
60 %
70 %
80 %
90 %
100 %
2011 2012 2013 2014 YTD 2015
New build Service
Increased focus on service improves
profitability
Share of
services will
exceed 25% of
sales in 2016
30 Nov 2015 52
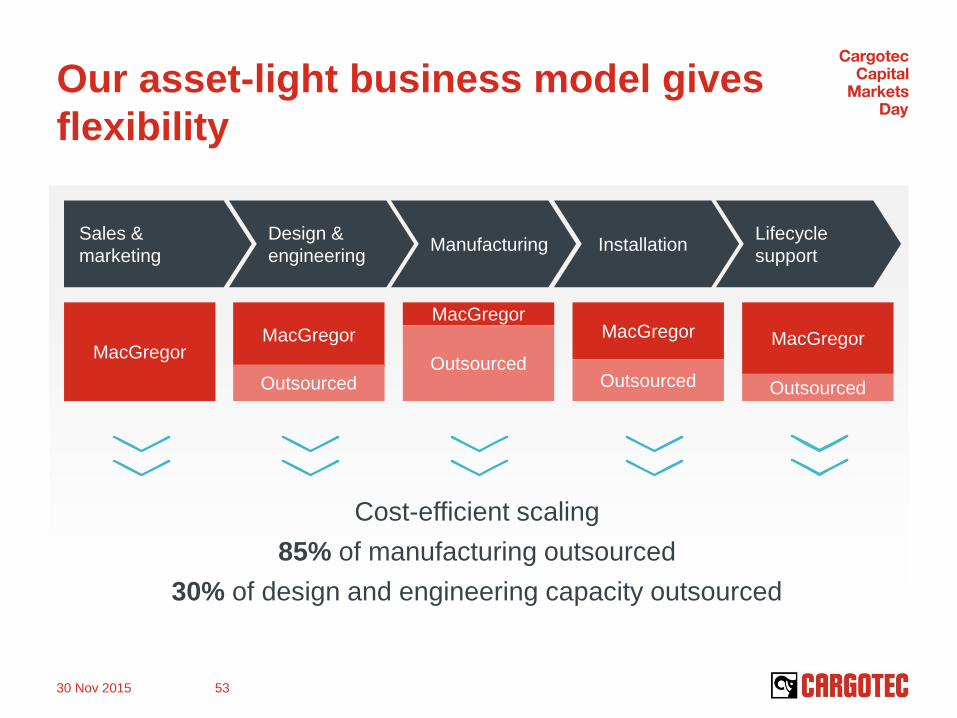
Our asset-light business model gives
flexibility
Cost-efficient scaling
85% of manufacturing outsourced
30% of design and engineering capacity outsourced
30 Nov 2015 53
MacGregor MacGregor
Manufacturing Installation Lifecycle
support
Sales &
marketing
Design &
engineering
MacGregor
Outsourced
MacGregor
Outsourced Outsourced
MacGregor
Outsourced
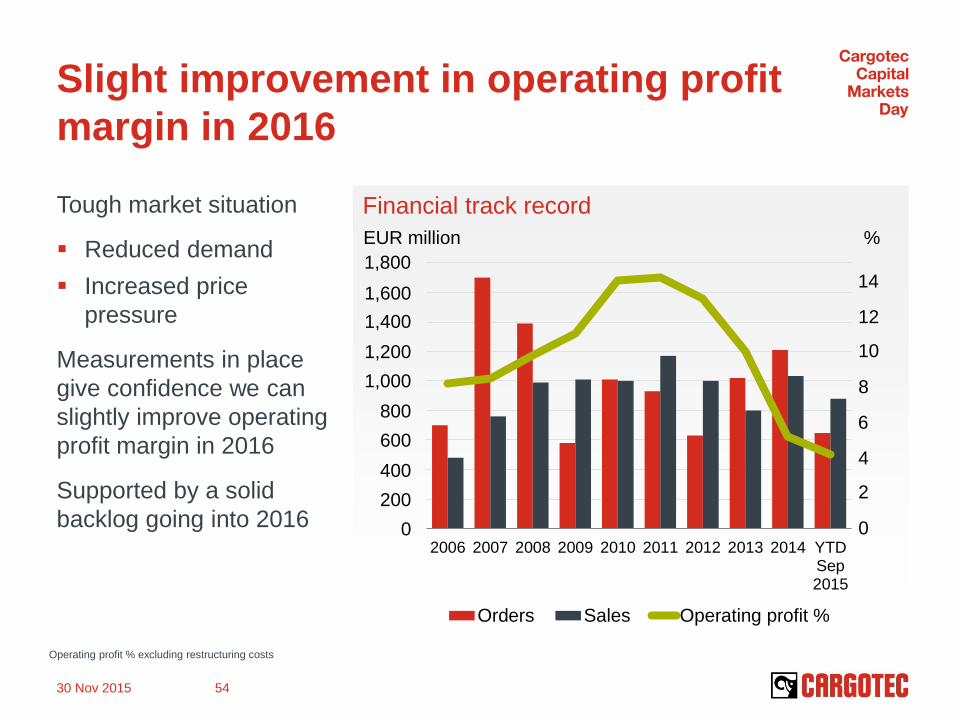
Financial track record
Slight improvement in operating profit
margin in 2016
Tough market situation
Reduced demand
Increased price
pressure
Measurements in place
give confidence we can
slightly improve operating
profit margin in 2016
Supported by a solid
backlog going into 2016
2006 2007 2008 2009 2010 2011 2012 2013 2014 YTDSep2015
Orders Sales Operating profit %
30 Nov 2015 54
Operating profit % excluding restructuring costs
1,800
1,600
1,400
1,200
1,000
800
600
400
200
0
EUR million %
14
12
10
8
6
4
2
0
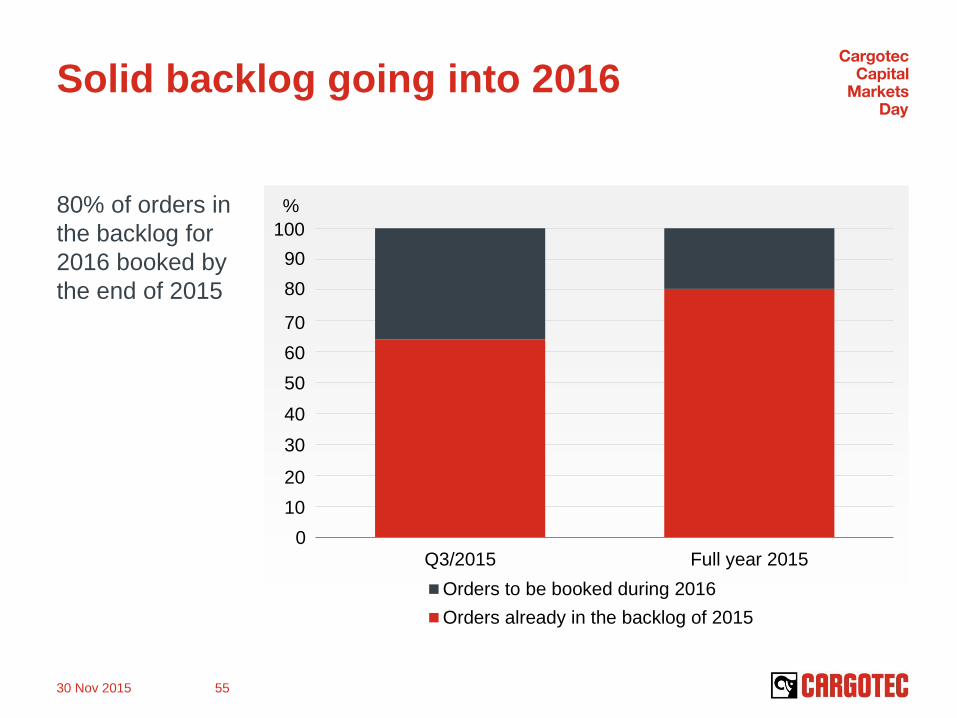
Solid backlog going into 2016
80% of orders in
the backlog for
2016 booked by
the end of 2015
Q3/2015 Full year 2015
Orders to be booked during 2016
Orders already in the backlog of 2015
30 Nov 2015 55
%
100
90
80
70
60
50
40
30
20
10
0
Preparing for
longer term growth
Focusing both on defensive
and offensive play
30 Nov 2015 56
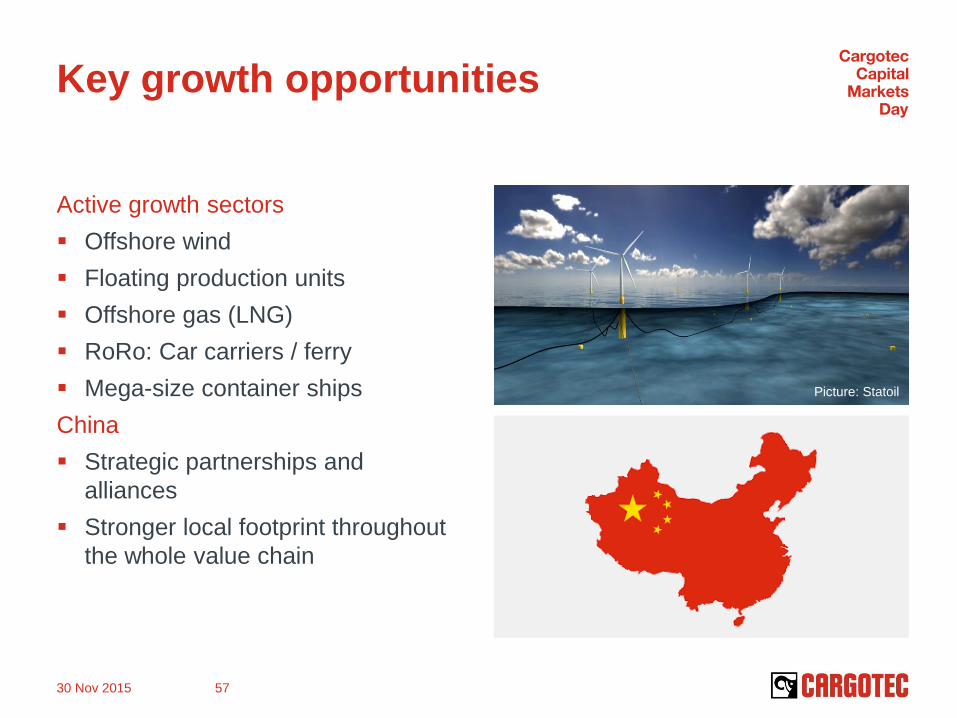
Key growth opportunities
Active growth sectors
Offshore wind
Floating production units
Offshore gas (LNG)
RoRo: Car carriers / ferry
Mega-size container ships
China
Strategic partnerships and
alliances
Stronger local footprint throughout
the whole value chain
30 Nov 2015 57
Picture: Statoil
30 Nov 2015 58
Growth through
services and
shiptype solutions
Services excellence by digitalisation
Leveraging our strong installed
base
Digitalised customer interface
Connectivity and data
management
Shiptype solutions
Shiptype focus to maximise
benefit of our wide portfolio
Boosting profitability of ship
operators
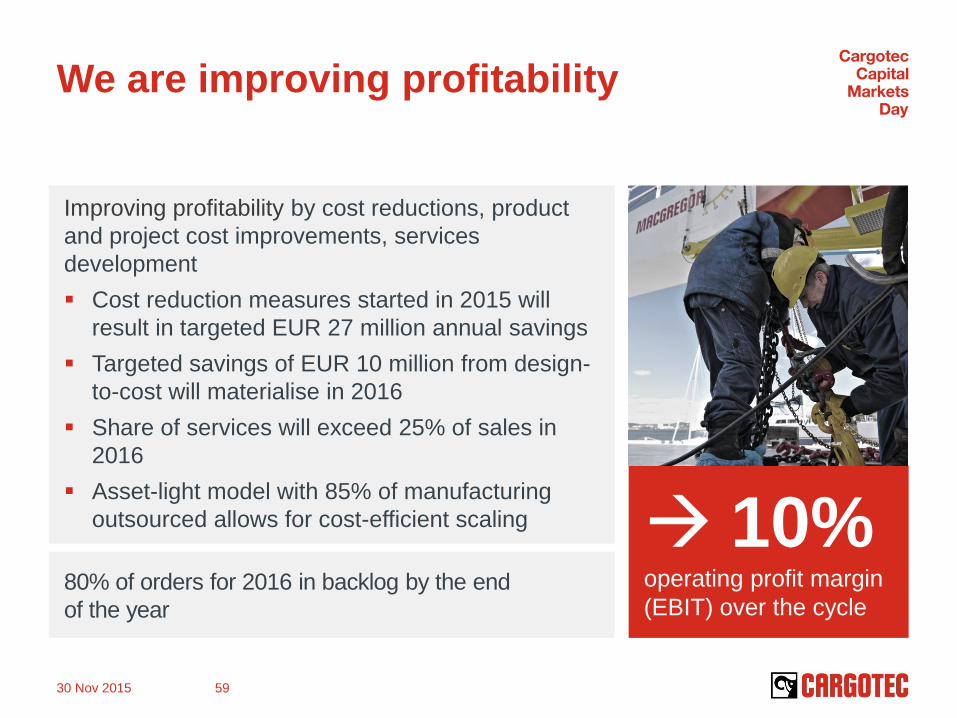
We are improving profitability
10% operating profit margin
(EBIT) over the cycle
Improving profitability by cost reductions, product
and project cost improvements, services
development
Cost reduction measures started in 2015 will
result in targeted EUR 27 million annual savings
Targeted savings of EUR 10 million from design-
to-cost will materialise in 2016
Share of services will exceed 25% of sales in
2016
Asset-light model with 85% of manufacturing
outsourced allows for cost-efficient scaling
80% of orders for 2016 in backlog by the end
of the year
30 Nov 2015 59

Questions
Improving shareholder return
at Cargotec CFO Eeva Sipilä
30 Nov 2015 62
Levers we are
working on to
improve shareholder
return at Cargotec
From turnaround to profitable growth
focus currently on Hiab and Kalmar
Further improving operating profit
margin
Further improving return on capital
(ROCE)
focus on further net working capital
efficiency improvement
Strengthened balance sheet enables
growth investments
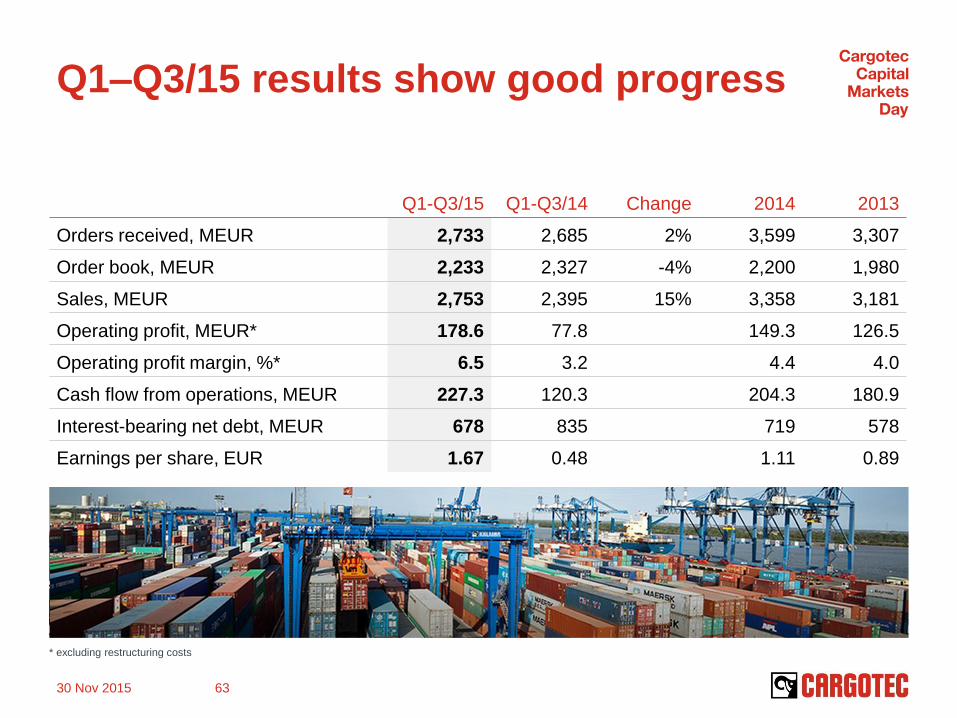
Q1–Q3/15 results show good progress
Q1-Q3/15 Q1-Q3/14 Change 2014 2013
Orders received, MEUR 2,733 2,685 2% 3,599 3,307
Order book, MEUR 2,233 2,327 -4% 2,200 1,980
Sales, MEUR 2,753 2,395 15% 3,358 3,181
Operating profit, MEUR* 178.6 77.8 149.3 126.5
Operating profit margin, %* 6.5 3.2 4.4 4.0
Cash flow from operations, MEUR 227.3 120.3 204.3 180.9
Interest-bearing net debt, MEUR 678 835 719 578
Earnings per share, EUR 1.67 0.48 1.11 0.89
30 Nov 2015 63
* excluding restructuring costs
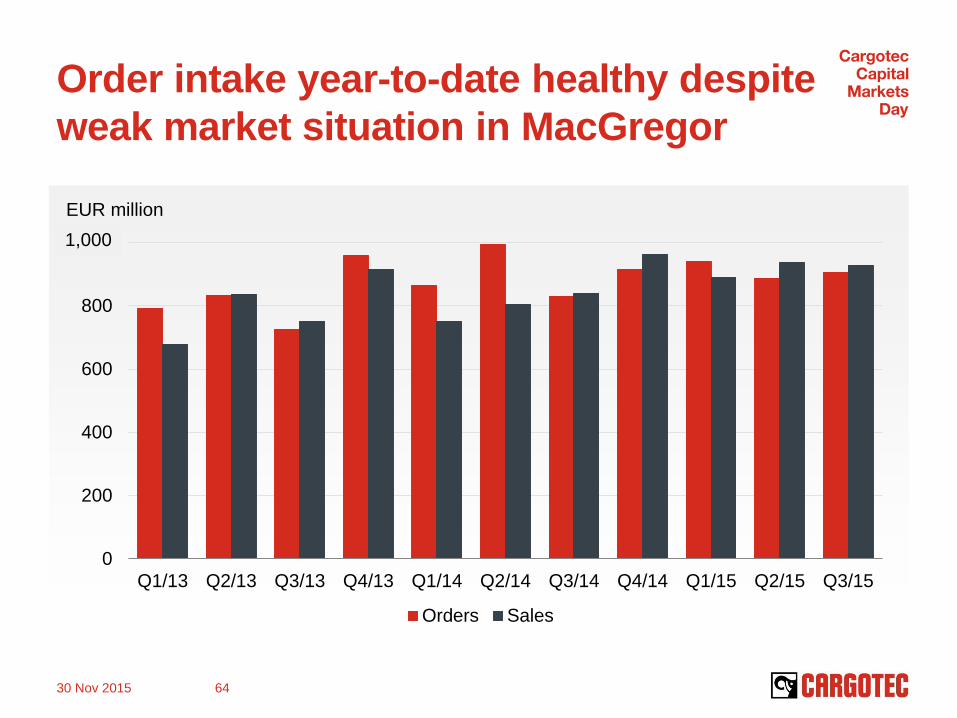
Order intake year-to-date healthy despite
weak market situation in MacGregor
0
200
400
600
800
1000
Q1/13 Q2/13 Q3/13 Q4/13 Q1/14 Q2/14 Q3/14 Q4/14 Q1/15 Q2/15 Q3/15
Orders Sales
30 Nov 2015 64
1,000
EUR million
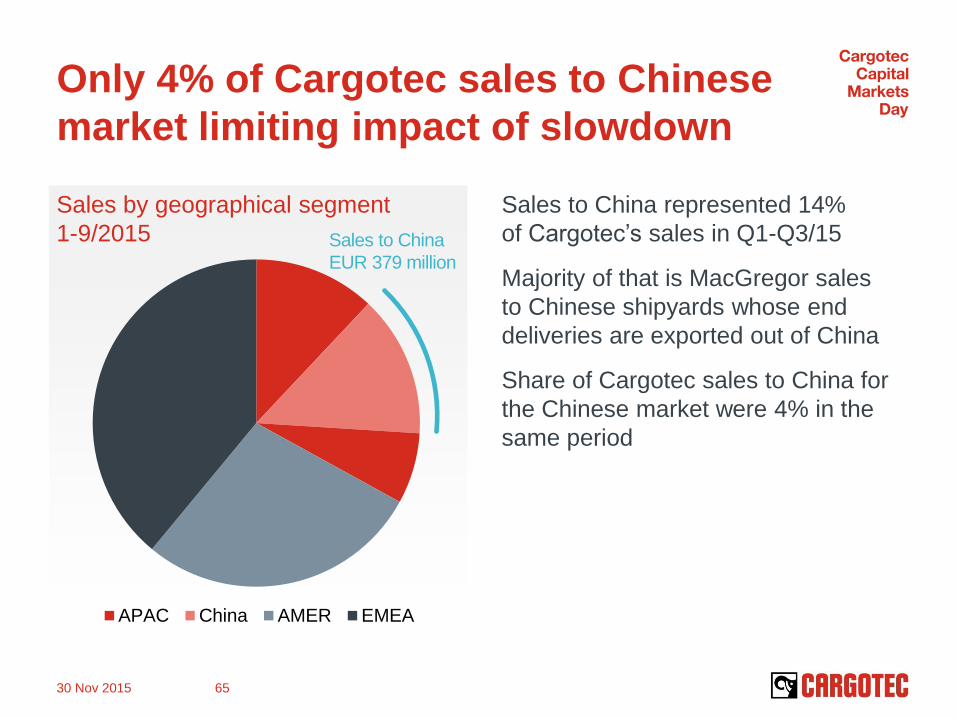
Sales by geographical segment
1-9/2015
Only 4% of Cargotec sales to Chinese
market limiting impact of slowdown
Sales to China represented 14%
of Cargotec’s sales in Q1-Q3/15
Majority of that is MacGregor sales
to Chinese shipyards whose end
deliveries are exported out of China
Share of Cargotec sales to China for
the Chinese market were 4% in the
same period
30 Nov 2015 65
APAC China AMER EMEA
Sales to China
EUR 379 million
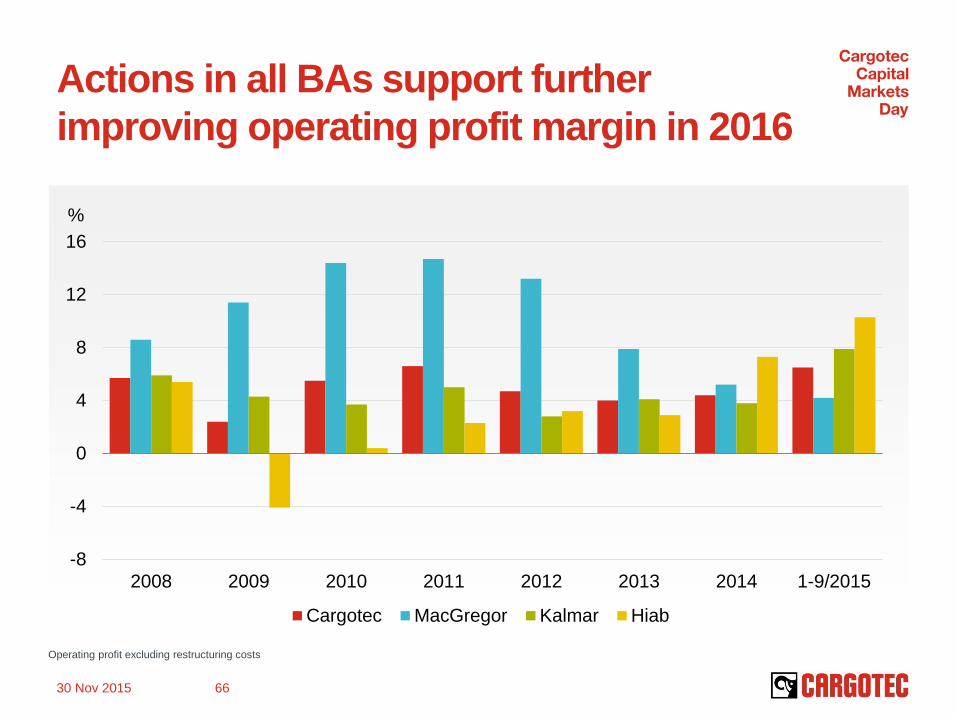
Actions in all BAs support further
improving operating profit margin in 2016
-8
-4
0
4
8
12
16
2008 2009 2010 2011 2012 2013 2014 1-9/2015
Cargotec MacGregor Kalmar Hiab
30 Nov 2015 66
Operating profit excluding restructuring costs
%
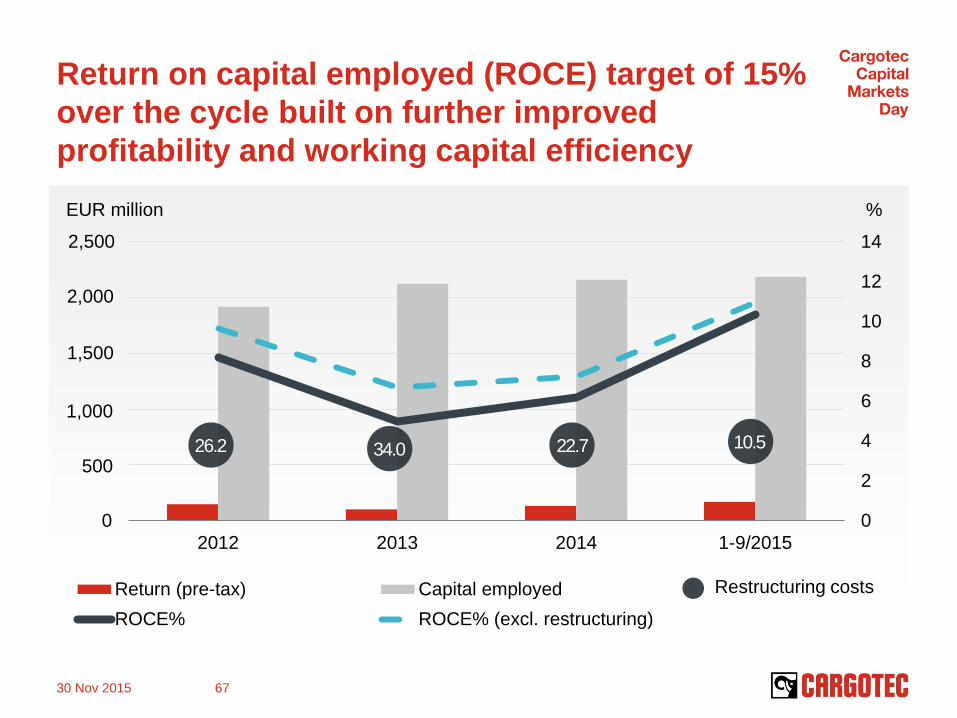
Return on capital employed (ROCE) target of 15%
over the cycle built on further improved
profitability and working capital efficiency
0
2
4
6
8
10
12
14
2012 2013 2014 1-9/2015
Return (pre-tax) Capital employed
ROCE% ROCE% (excl. restructuring)
26.2 34.0 22.7 10.5
30 Nov 2015 67
Restructuring costs
% EUR million
2,500
2,000
1,500
1,000
500
0
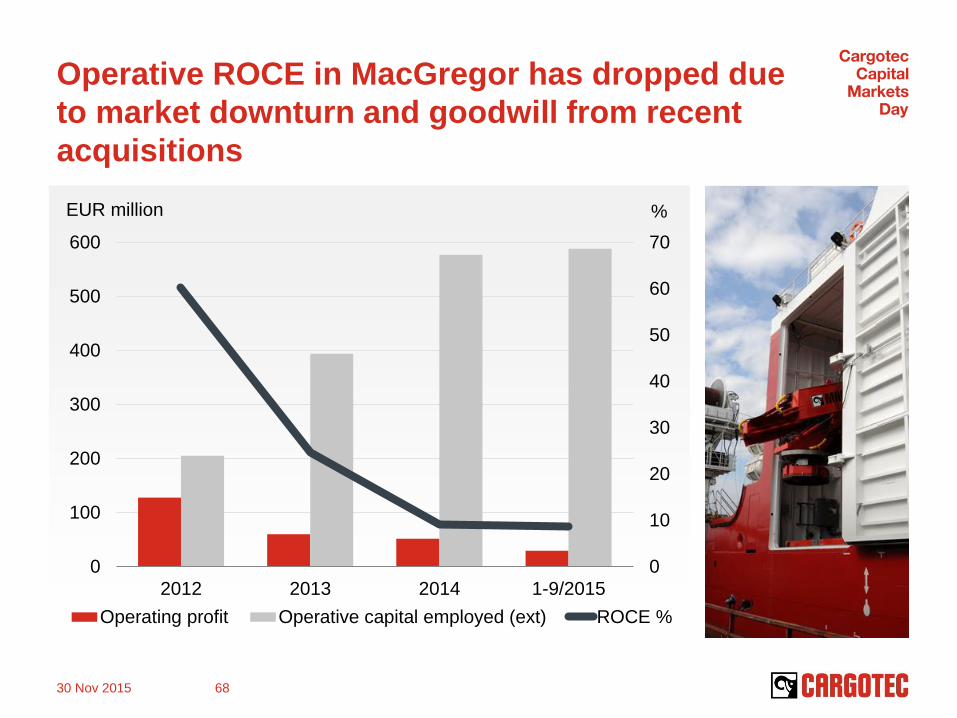
Operative ROCE in MacGregor has dropped due
to market downturn and goodwill from recent
acquisitions
0
10
20
30
40
50
60
70
0
100
200
300
400
500
600
2012 2013 2014 1-9/2015
Operating profit Operative capital employed (ext) ROCE %
30 Nov 2015 68
% EUR million
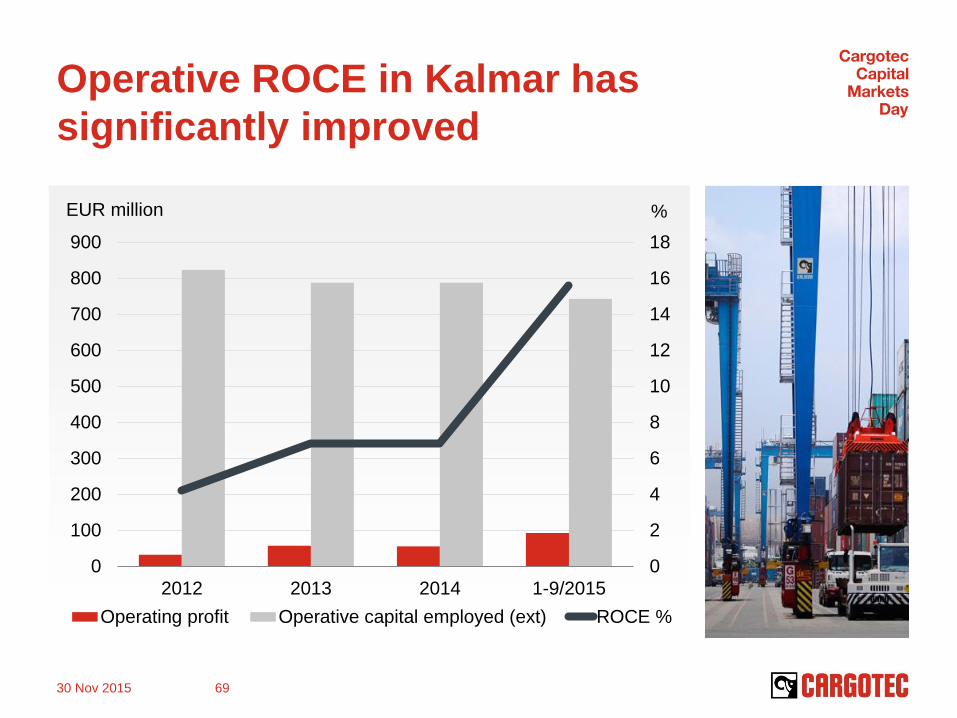
Operative ROCE in Kalmar has
significantly improved
0
2
4
6
8
10
12
14
16
18
0
100
200
300
400
500
600
700
800
900
2012 2013 2014 1-9/2015
Operating profit Operative capital employed (ext) ROCE %
30 Nov 2015 69
EUR million %
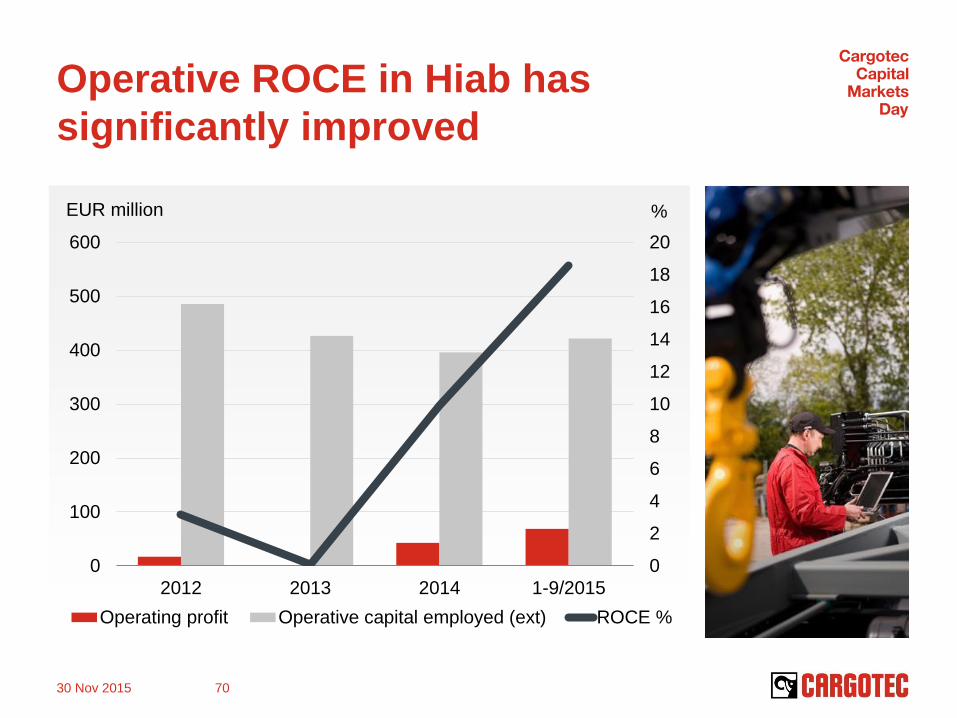
Operative ROCE in Hiab has
significantly improved
0
2
4
6
8
10
12
14
16
18
20
0
100
200
300
400
500
600
2012 2013 2014 1-9/2015
Operating profit Operative capital employed (ext) ROCE %
30 Nov 2015 70
EUR million %
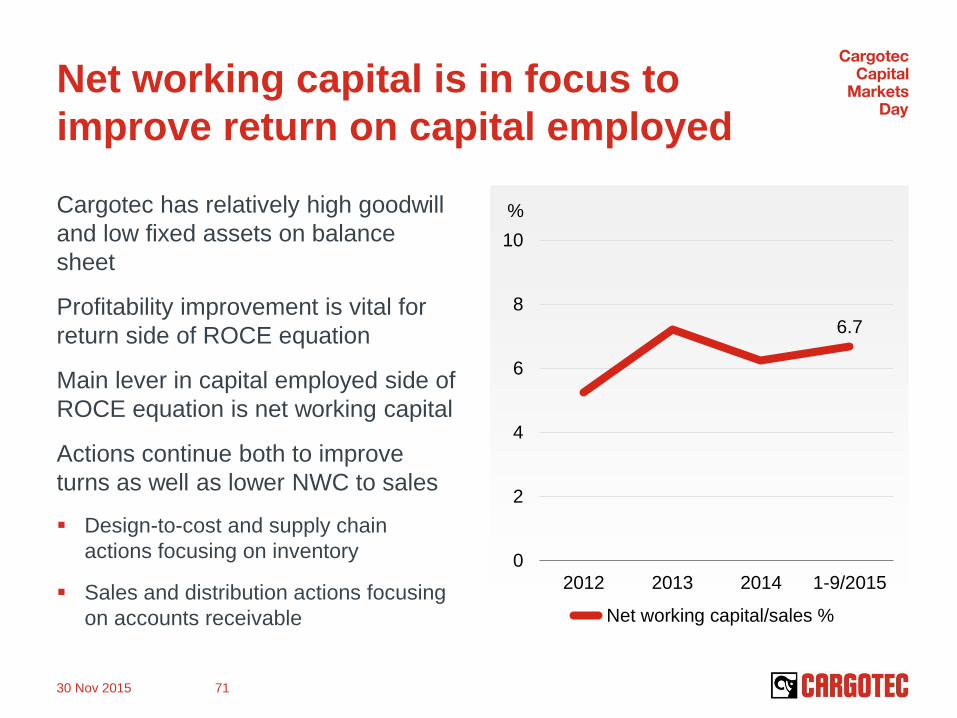
Net working capital is in focus to
improve return on capital employed
Cargotec has relatively high goodwill
and low fixed assets on balance
sheet
Profitability improvement is vital for
return side of ROCE equation
Main lever in capital employed side of
ROCE equation is net working capital
Actions continue both to improve
turns as well as lower NWC to sales
Design-to-cost and supply chain
actions focusing on inventory
Sales and distribution actions focusing
on accounts receivable
30 Nov 2015 71
%
6.7
0
2
4
6
8
10
2012 2013 2014 1-9/2015
Net working capital/sales %
0
50
100
150
200
250
300
350
2008 2009 2010 2011 2012 2013 2014 1-9/2015
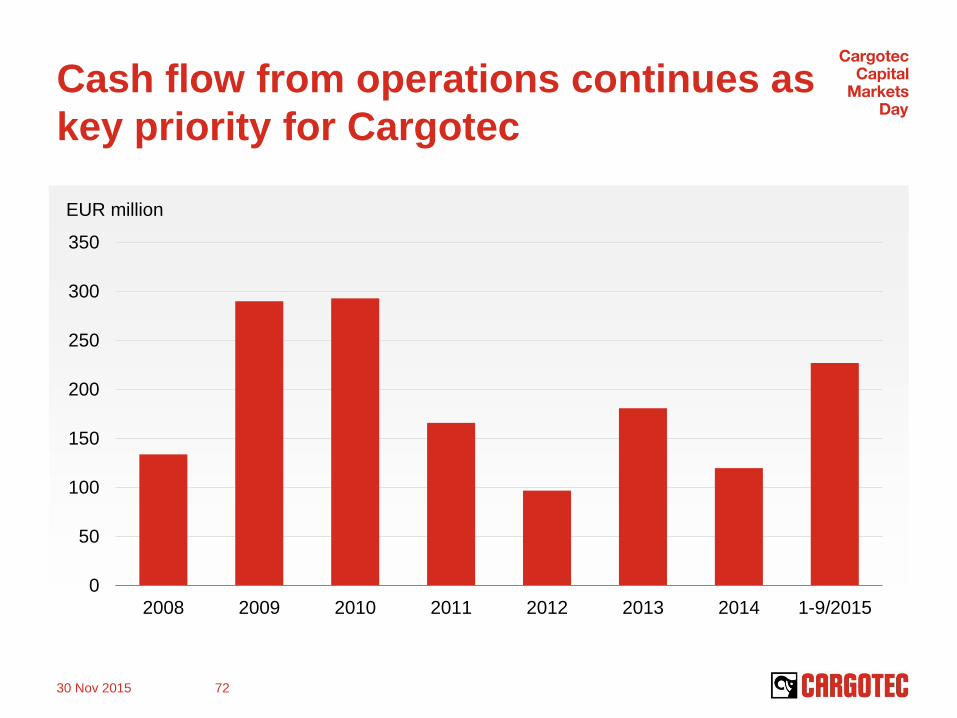
Cash flow from operations continues as
key priority for Cargotec
30 Nov 2015 72
EUR million
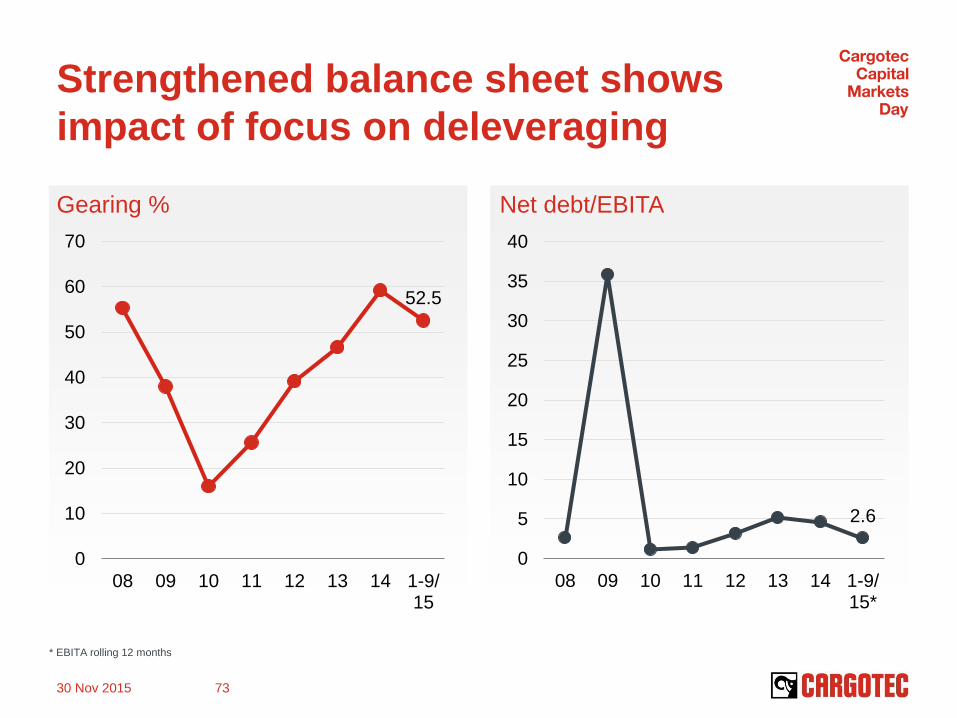
Strengthened balance sheet shows
impact of focus on deleveraging
Gearing %
52.5
0
10
20
30
40
50
60
70
08 09 10 11 12 13 14 1-9/15
Net debt/EBITA
2.6
0
5
10
15
20
25
30
35
40
08 09 10 11 12 13 14 1-9/15*
30 Nov 2015 73
* EBITA rolling 12 months
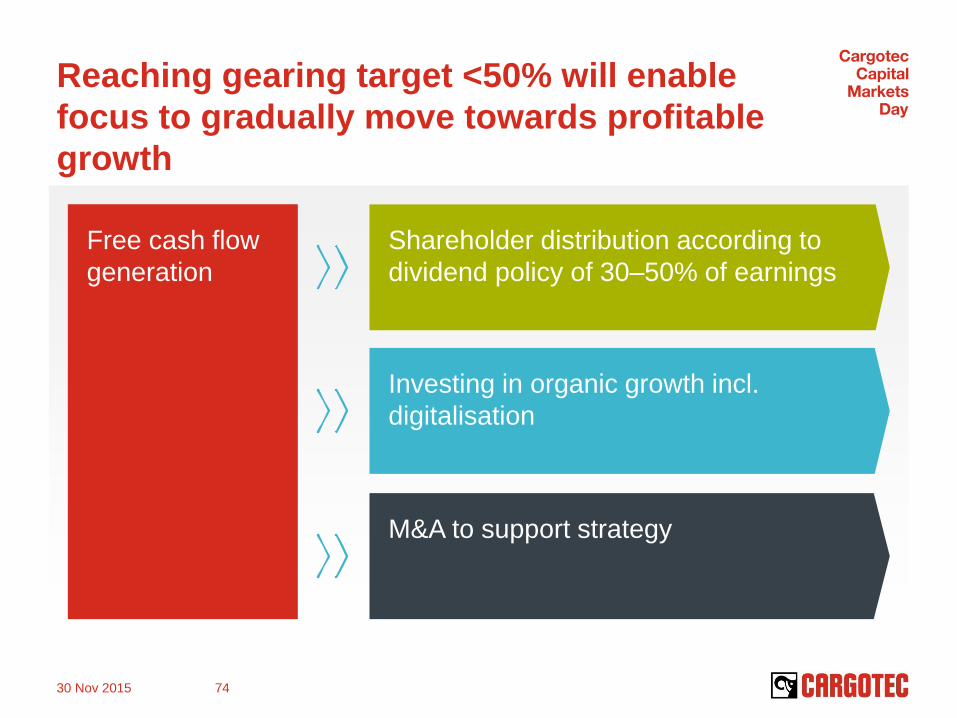
Reaching gearing target <50% will enable
focus to gradually move towards profitable
growth
30 Nov 2015 74
Free cash flow
generation
Shareholder distribution according to
dividend policy of 30–50% of earnings
Investing in organic growth incl.
digitalisation
M&A to support strategy
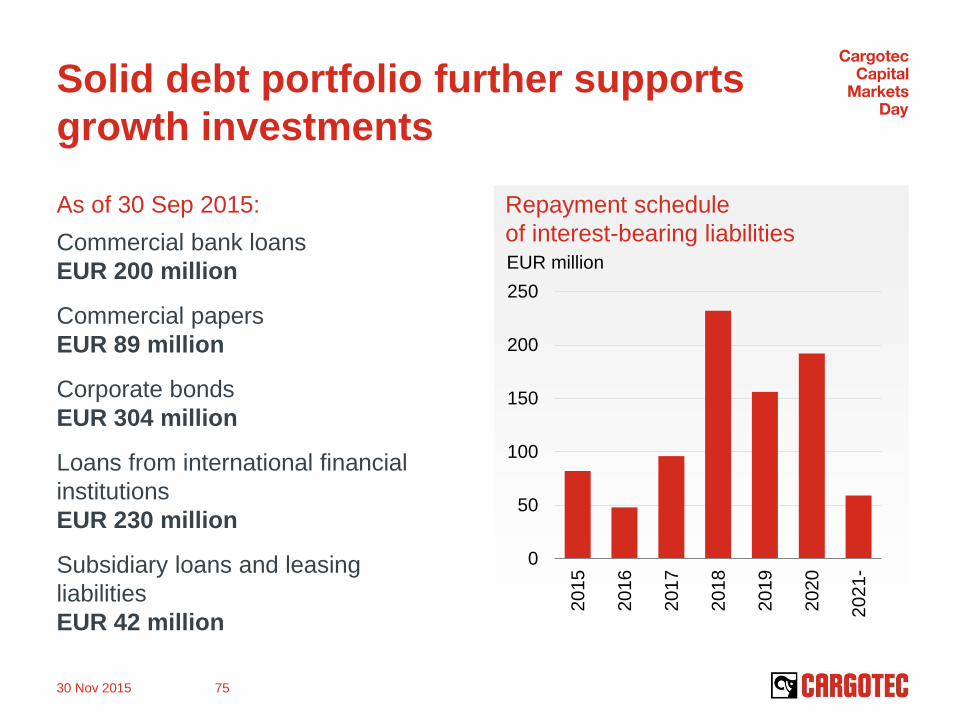
Solid debt portfolio further supports
growth investments
As of 30 Sep 2015:
Commercial bank loans
EUR 200 million
Commercial papers
EUR 89 million
Corporate bonds
EUR 304 million
Loans from international financial
institutions
EUR 230 million
Subsidiary loans and leasing
liabilities
EUR 42 million
Repayment schedule
of interest-bearing liabilities
0
50
100
150
200
250
2015
2016
2017
2018
2019
2020
2021-
30 Nov 2015 75
EUR million

30 Nov 2015 76
Levers we are
working on to
improve shareholder
return at Cargotec
From turnaround to profitable growth
focus currently on Hiab and Kalmar
Further improving operating profit
margin
Further improving return on capital
(ROCE)
focus on further net working capital
efficiency improvement
Strengthened balance sheet enables
growth investments

Questions