Embed Size (px)
Citation preview
7/25/2019 Coalesce Rs Doc
http://slidepdf.com/reader/full/coalesce-rs-doc 1/12
II. COALESCING THEORY AND SEPARATION EQUIPMENT DESIGN
Incoming Stream Droplet Size Distribution
The drop size of the entrained liquid in an emulsion varies, depending on the flowconditions. For common conditions in the oil patch, studies have shown that drop sizesrange from 50 to 2000 microns. The maximum stable droplet diameter is obtained byusing the Sleicher-Hinze equation, which is a correlate function of the Reynolds numberand friction factor and is given by:
d K DV D VD
d c
c
c
c
max
. .
=
− − ρ
σ
ρ
µ
2 0 6 0 08
where:
d max = Maximum Stable Droplet Size (cm) K d = Droplet Size Correlating Constant (See below)
ρ c = Density of oil (gm/cm3) D = Diameter of the Inlet Piping (cm)V = Average Velocity of Inlet Piping (cm/s2)
σ c = Interfacial Tension (dyne/cm) µc = Viscosity of the continuous phase (centipoise)
Hinze determined the droplet size correlating constant ( K d ), from experimental data ondroplet size distribution. Three droplet sizes were determined such that 10%, 50%, and90% of the dispersed phase volume was contained in drops of diameter less than d 10, d50,and d90, respectively. Values of the constant K d of 0.66, 1.60 and 2.2 were correlatedwith drop size diameters of d10, d50, and d90, respectively. From this equation thefollowing qualitative conclusions can be drawn:
• The greater the velocity of the mixed phases in the inlet piping, the smallerthe diameters of the dispersed phase stable droplets will be due to higher pressure drop and shearing action.
• The lower the interfacial tension, the lower the maximum stable dropletsize will be.
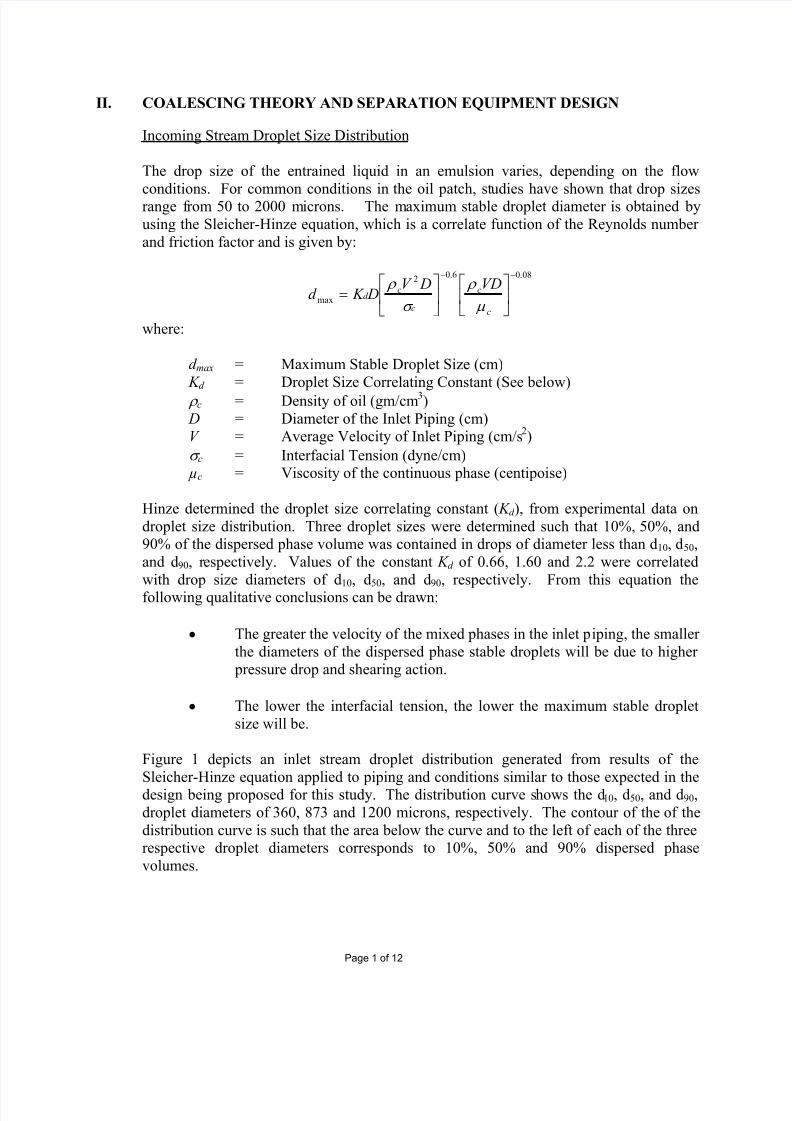
Figure 1 depicts an inlet stream droplet distribution generated from results of theSleicher-Hinze equation applied to piping and conditions similar to those expected in thedesign being proposed for this study. The distribution curve shows the d10, d50, and d90,droplet diameters of 360, 873 and 1200 microns, respectively. The contour of the of thedistribution curve is such that the area below the curve and to the left of each of the threerespective droplet diameters corresponds to 10%, 50% and 90% dispersed phasevolumes.
Page 1 of 12
7/25/2019 Coalesce Rs Doc
http://slidepdf.com/reader/full/coalesce-rs-doc 2/12
Figure 1
Inlet Droplet Size Distribution
0
10
20
30
40
50
60
70
80
90
100
0 100 200 300 400 500 600 700 800 900 1,000 1,100 1,200 1,300 1,400 1,500 1,600 1,700 1,800 1,900 2,000
dpavg (microns)
N u m b e r o f D r o p l e t s
d-90
d-50
d-10
Droplet Hydraulics
In any gravity-based liquid / liquid separation system, the effectiveness can be estimated
by determining the vertical velocity of the entrained liquid droplets. Stokes law is theaccepted equation used to determine this vertical velocity. For Reynolds numbers lessthan one, Stokes Law can be expressed by the following equation:
V d o c= g −1
18
2 ( ) ρ ρ
µ
ω ο
V o = Vertical velocity droplet in dispersed phase (cm/sec)d = Diameter of the droplet (cm)
ρ ω = Specific gravity of water ρ o = Specific gravity of oil µ = Viscosity of the water continuous phase (centipoise) g c = Gravitational Constant (980 cm/s
2)
Separation is improved by providing process conditions that result in an increase in thevertical velocity of the entrained droplets. The greater difference in density between the bulk phase and dispersed phase droplets results in greater vertical velocity of the droplets
Page 2 of 12
7/25/2019 Coalesce Rs Doc
http://slidepdf.com/reader/full/coalesce-rs-doc 3/12
which yields more rapid phase separation. Since the densities of the two liquid phases areusually fixed by the source, there is little that can be done with this variable to improveseparation performance. However, the remaining variables of the viscosity of thecontinuous phase and the droplet diameter included in Stokes Equation can be modifiedvia process conditions and can be impacted. . Separation can be improved by heating the
mixture, thereby lowering the viscosity of the continuous phase that in turn, increases thevertical velocity of the dispersed droplets. However, because it is a squared term inStokes Equation, the droplet diameter has a much greater effect on droplet verticalvelocity than the other variables and subsequently has the predominant effect onimproving separation. Therefore, key elements in the design of liquid-liquid separationequipment are those that provide the apparatus and conditions that enhance thecoalescence of droplets in the incoming dispersed phase.
An emulsion of liquids, such as water and oil will naturally separate if allowed to remainundisturbed due to the difference of the specific gravities of the two liquids. However, itis impractical in most oilfield applications to attempt to provide a process that creates
such an undisturbed condition. To aid gravity in achieving the desired liquid-liquidseparation, a medium to aid in the coalescence of small droplets into larger droplets can be installed in the separation vessel to provide for a more rapid separation of twoimmiscible liquids. Some of the media that are typically utilized include glass shards,fiberglass strands, and metal plates arranged in various configurations. Experimentaldata are available to predict the effects of these various types of coalescing media.
Coalescence Theory
Flow-driven coalescence in emulsions is modeled based on decoupling the process intoan external flow and internal flow. The external flow is the macroscopic flow that bringsthe droplets together and hence governs the collision frequency, the contact force and theinteraction time. The drainage of the fluid film between colliding droplets constitutes theinternal flow. The film drainage is considered to be the critical step in the merging process of two colliding droplets.
For a mono-dispersed blend (single immiscible phase dispersed in a single bulk phase),the rate of change of the specific droplet inter-facial area (diameter) can be expressed as proportional to three factors:
• The droplet collision frequency
• The coalescence probability (fraction of collisions that actually leads to
coalescence)• The change in inter-facial area due to a single coalescence event.
The collision frequency is a function of shear rate, droplet diameter and number ofdroplets per volume of bulk phase. The coalescence probability is an inverse exponentialfunction of fluid film drainage time and droplet interaction time. The fluid film drainagetime is a complex function of droplet diameter, viscosity ratio, inter-facial tension and thedistance between the droplets at which coalescence occurs spontaneously. The resulting
Page 3 of 12
7/25/2019 Coalesce Rs Doc
http://slidepdf.com/reader/full/coalesce-rs-doc 4/12
equation that predicts the increase in droplet size after a step-down in shear rate(reduction of bulk flow velocity normal to droplet settlement velocity) that occurs uponentering the treatment equipment shows primary dependence on only three parameters:
• Residence time
• Step-down ratio (flow regime)
• Incoming droplet size distribution.
Physical properties such a viscosity, surface tension and density difference are muchmore influential in the determination of settlement velocities of the coalesced droplets ascompared to their effect on the actual coalescence of the droplets.
Coalescence Enhancement with Plate Packs
The use of flow-through parallel plates to increase coalescence in skim tanks used forgravity separation was pioneered in 1959 as a method of improving the efficiency ofexisting refinery API separators for treatment of storm water that contained oil droplets
with diameters less than 150 microns. The original design of an API separator was basedsolely on Stoke’s Law droplet settlement via gravity. The typical API separator had nocoalescing enhancing internals with the exception that some designs included baffle plates that were intended to promote coalescence by the increasing eddy currents andBrownian movement at the flow path turns around the arrangement of baffles.
The concept behind breaking or corrugating parallel plates is to impart impingement andcentrifugal forces to the fluid particles passing through the vertically oriented parallel plates is to force the flow through a series of closely spaced parallel plates. The section between the plates has a small hydraulic radius that results in a low Reynolds numberapproaching that of laminar flow. On the surface of the plates, the droplet meets and
coalesces with other dispersed phase droplets. The coalescing droplets on the platesurface continue to grow in diameter until their vertical velocity enables them to rise ordescend to the interface between the bulk liquid phases. While this process is occurring,any solid particles in the stream are falling and are settling to the bottom of the pack in avertically oriented plate construction.
Equipment Design Parameters
From the preceding discussion, there are three considerations that are primary in thedesign of liquid-liquid separation equipment. These are:
• The evaluation of the inlet droplet size distribution• The selection of the optimal vessel configuration (vertical or horizontal) andsubsequent flow regime
• The provision of sufficient retention time to effect the desired separation.
Control over inlet droplet size distribution exists to a greater degree in the design of newgreenfield facilities. In such instances, inlet piping can be sized to minimize shearing anddesigned to avoid size reductions or other restrictions at the inlet of the separation
Page 4 of 12
7/25/2019 Coalesce Rs Doc
http://slidepdf.com/reader/full/coalesce-rs-doc 5/12
equipment. For the design of new liquid-liquid separation equipment to be installed inexisting facilities, piping size reductions or restrictions should be avoided near the inlet tothe separation equipment. Internal to the equipment, a diffuser type inlet distributorshould be provided that has low-shear characteristics.. Provision of sufficient retentiontime is often governed by the physical room available for the equipment. Generally, it is
desirable to provide the largest equipment that is physically and economically practical.
Control of the flow regime or flow profile in the separation equipment is accomplishedthrough the equipment dimensions and internals configuration. Improved separation isachieved when flow conditions can be produced which are in the laminar flow regimewith minimal superficial velocity having a plug or flat flow profile. Providing maximumcross-sectional area normal to the bulk flow enables a low velocity, laminar flow regime.A plug or flat flow profile is produced by the inclusion of internals (distribution baffles or plate packs) that re-distribute flow along the majority of the bulk flow path. Withoutsuch internals in a separation vessel, there is no means to spread the liquid flow profileout across the cross-sectional flow area. Therefore, at flow rates in the desired laminar
regime, channeling occurs and a velocity profile with a maximum point (center of flow)that is twice the average superficial velocity results. When such conditions exist, theeffective retention time of the bulk phase is substantially less than design.
Equipment Performance Estimation
Ultimately, the performance of gravity based liquid-liquid separation equipment isdetermined by the degree that dispersed phase droplets travel out of the bulk phase andinto a collected phase or some type of skimming device. The physical geometry anddimensions of the equipment determine what percentage of the droplets above acalculated diameter can be removed by means of their Stokes settling velocity, i.e., the bulk phase velocity must be less than the Stokes velocity at the calculated dropletdiameter. The Stokes or settlement velocity is always parallel to the gravitational fieldthat is vertically oriented. Therefore, in a vertical separator the settlement velocity is parallel to the bulk phase velocity and conversely, in a horizontal separator the settlementvelocity is normal to the bulk phase velocity.
For a given distribution of dispersed phase droplets at the separation vessel inlet, alldroplets above the calculated diameter should be removed from the bulk phase. Theactual volume of dispersed phase removed depends on the inlet concentration of thedispersed phase and the actual droplet distribution in the equipment. The internal dropletdistribution may be identical to the inlet distribution or favorably enhanced by theequipment design and internals provided.
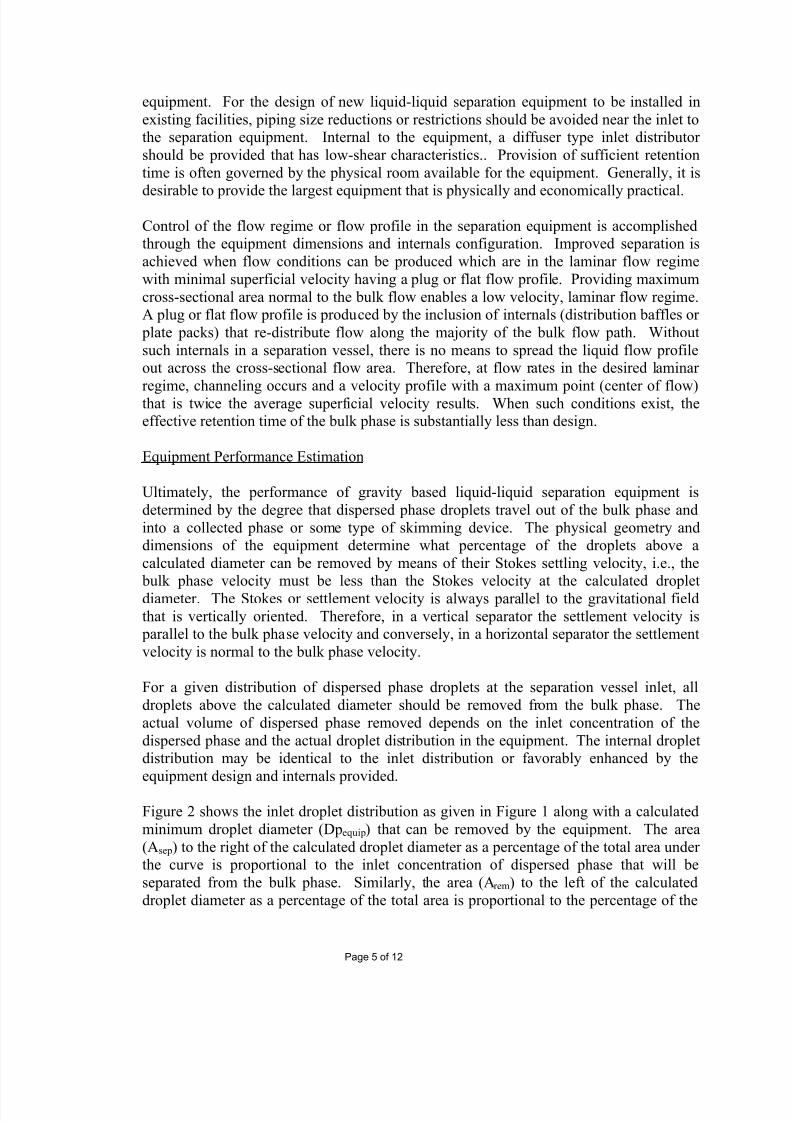
Figure 2 shows the inlet droplet distribution as given in Figure 1 along with a calculatedminimum droplet diameter (Dpequip) that can be removed by the equipment. The area(Asep) to the right of the calculated droplet diameter as a percentage of the total area underthe curve is proportional to the inlet concentration of dispersed phase that will beseparated from the bulk phase. Similarly, the area (Arem) to the left of the calculateddroplet diameter as a percentage of the total area is proportional to the percentage of the
Page 5 of 12
7/25/2019 Coalesce Rs Doc
http://slidepdf.com/reader/full/coalesce-rs-doc 6/12
inlet volume concentration of dispersed phase that is not separated and remains in the bulk phase effluent.
Figure 2
Inlet Droplet Size Distribution with Minimum Removal Size
0
10
20
30
40
50
60
70
80
90
100
0 100 200 300 400 500 600 700 800 900 1,000 1,100 1,200 1,300 1,400 1,500 1,600 1,700 1,800 1,900 2,000
Dpavg (microns)
N u m b e
r o f D r o p l e t s
Dpequip
Page 6 of 12
7/25/2019 Coalesce Rs Doc
http://slidepdf.com/reader/full/coalesce-rs-doc 7/12
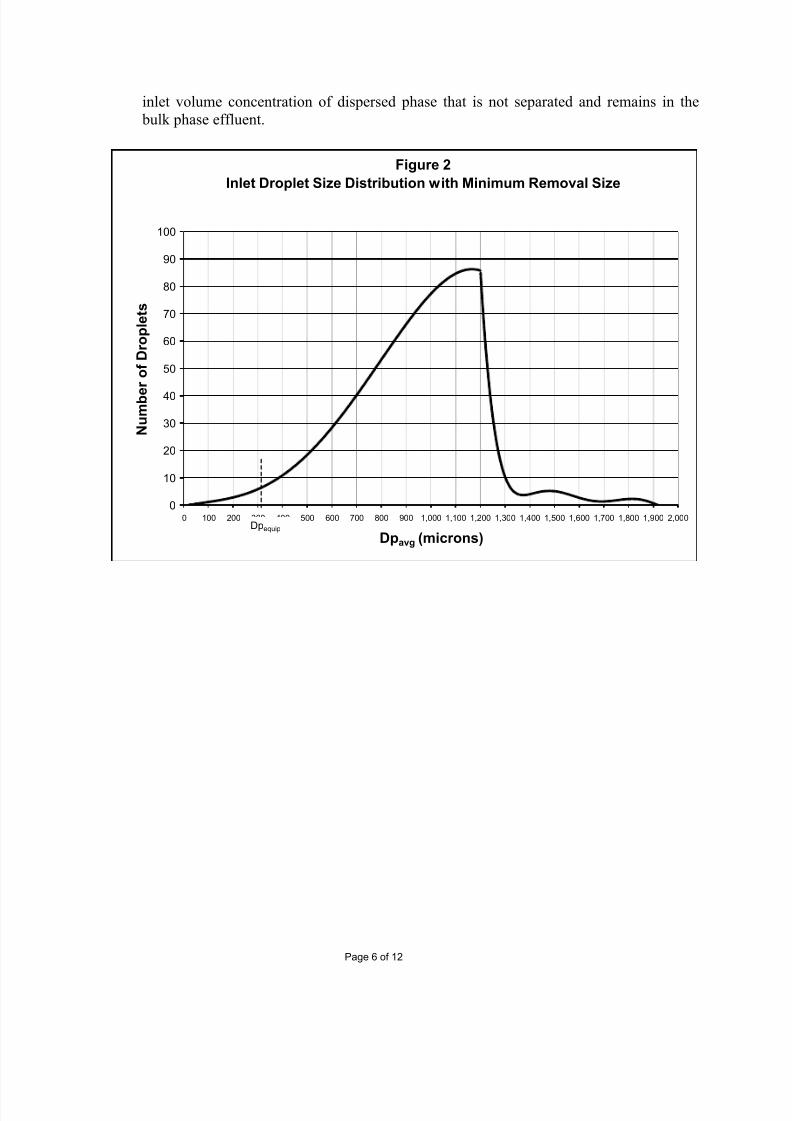
Figure 3 is similar to Figure 2 but with a second droplet distribution curve shown with adashed line. The dashed curve represents a droplet distribution that has been enhanceddue to droplet coalescence in the equipment. The curve lies to the right of the inletdistribution curve due to the increased average droplet size resulting from the variouscoalescence mechanisms provided by the equipment. As shown in Figure 3, the net
effect of the droplet distribution being shifted to the right is that the area representing theamount of dispersed phase remaining in the processed water effluent is decreased. Theenhanced distribution curve is a result of the addition of internals that promote increasedcoalescence. The calculated minimum droplet diameter remains the same because thedimensions and geometry of the equipment, i.e. droplet travel path and retention timehave not changed.
Figure 3
Droplet Size Distributions - Inlet and Enhanced
0
10
20
30
40
50
60
70
80
90
100
0 100 200 300 400 500 600 700 800 900 1,000 1,100 1,200 1,300 1,400 1,500 1,600 1,700 1,800 1,900 2,000
Dpavg (microns)
N u m b
e r o f D r o p l e t s
Dpequip
Inlet Distribution
Enhanced
Distribution
Equipment Design Summary
As stated in the Equipment Performance section, the physical dimensions of theequipment determine what droplets above a calculated diameter can be removed bymeans of their Stokes settling velocity. A design that provides the greatest cross-sectional area (CSA) in the direction of settling droplets will result in the best performance. For Length-to-Diameter (L/D) ratios of 3.0 to 5.0 for cylindrical vessels
Page 7 of 12
7/25/2019 Coalesce Rs Doc
http://slidepdf.com/reader/full/coalesce-rs-doc 8/12
and similar values of Length-to-Width ratios for rectangular vessels that are typicallyfound in the oil and gas industry, horizontal vessels provide 2 to 3 times more CSA perwetted volume than do vertical vessels. Therefore, new designs should utilize horizontalconfigurations as the basic vessel configuration. Horizontal configurations also providemore room for the inclusion and maintenance access of any types of internals, including
coalescing enhancing medium.
As a minimum, internals such as perforated baffle plates should be provided that re-distribute the bulk phase flow throughout its entire path. This enables the plug flowregime to be realized and provide for full use of the design retention time. In addition, properly positioned plates attenuate sloshing that is often a problem on floating production facilities. More preferable, is the installation of plate packs. The plate packs provide further enhancement of droplet coalescence as well as providing re-distributionof bulk flow. Vertically oriented, corrugated plate packs are preferred over horizontal,straight plates because they are much less prone to debris accumulation and fouling(debris falls to bottom of equipment and not in between horizontally stacked plates).
Vertically oriented, corrugated plate packs also have sufficient flow resistance (due tosemi-torturous path) that acts to redistribute flow and therefore, does not require separatedistribution plates ahead as horizontal, straight plates require.
III. PRE-SUMP PROPOSED DESIGN
Location and Overall Configuration
The existing Production and Emergency Sumps are located on the outboard side of thenortheast hull column. Open area on the top of the northeast hull column provides alocation that is closest to the existing sumps, has adequate area for a relatively largehorizontal vessel or tank and is at the proper elevation for gravity drainage of the existingdrain collection headers to the proposed Pre-Sump and effluent flow to the ProductionSump. Available vertical clearance on the column top is approximately 8 to 10 feet,limited by major structural beams from the above modules.
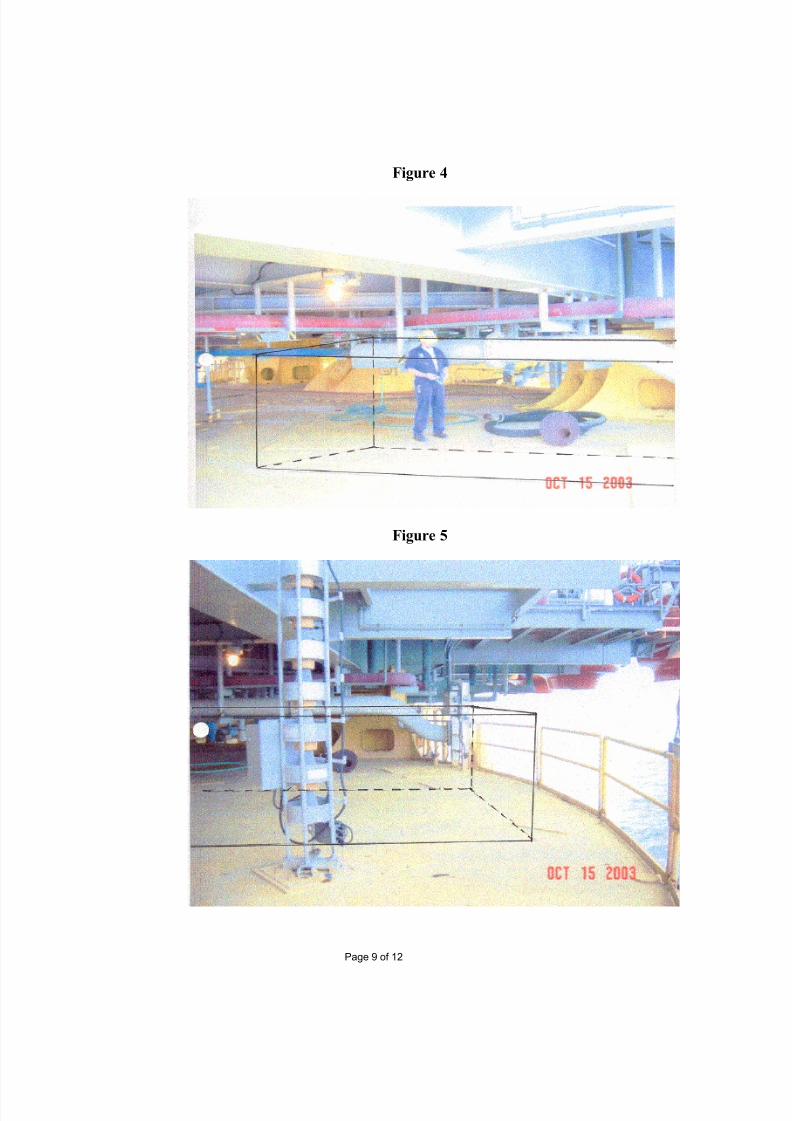
A horizontal vessel or tank is the preferred configuration from both process and locationstandpoints. Optimum volume is obtained from the available space by employing arectangular tank configuration with dimensions of 8’W x 5’H x 25’L. Figures 4 and 5depict an isometric outline of the tank super-imposed on a photograph of the area beingconsidered. The existing 14” inlet line to the Production Sump would be cut and re-directed to the proposed Pre-Sump. The inlet line would be reduced to a 6” or 8”entering the Pre-Sump and have an orifice plate or valve for throttling purposes. No
hydraulic bypass would be provided. However, a manual bypass line with isolationvalves would be provided for maintenance purposes. Treated effluent water from thePre-sump would continue on to the existing Production Sump with interface levelcontrolled by an adjustable outlet leg. Dispersed phase oil will be skimmed off into anoil bucket and pumped to the Wet Oil Tank with a Wilden type pump.
Page 8 of 12
7/25/2019 Coalesce Rs Doc
http://slidepdf.com/reader/full/coalesce-rs-doc 9/12
Figure 4
Figure 5
Page 9 of 12
7/25/2019 Coalesce Rs Doc
http://slidepdf.com/reader/full/coalesce-rs-doc 10/12
Performance Calculations
The performance calculations in this section are based on the method described earlier inthis report. First, a droplet size distribution in the inlet stream is calculated based on theSleicher-Hinze equation. The minimum droplet diameter (Dpequip) that can be removed is
then calculated based on the equipment geometry. An equipment specific dropletdistribution curve is then generated based on the geometry and internals specified for the proposed equipment. This distribution curve is then integrated to obtain under-curveareas to the left and right of the minimum droplet diameter (Dpequip) and subsequenteffluent concentration. The above calculation sequence is done for each new inlet rate.
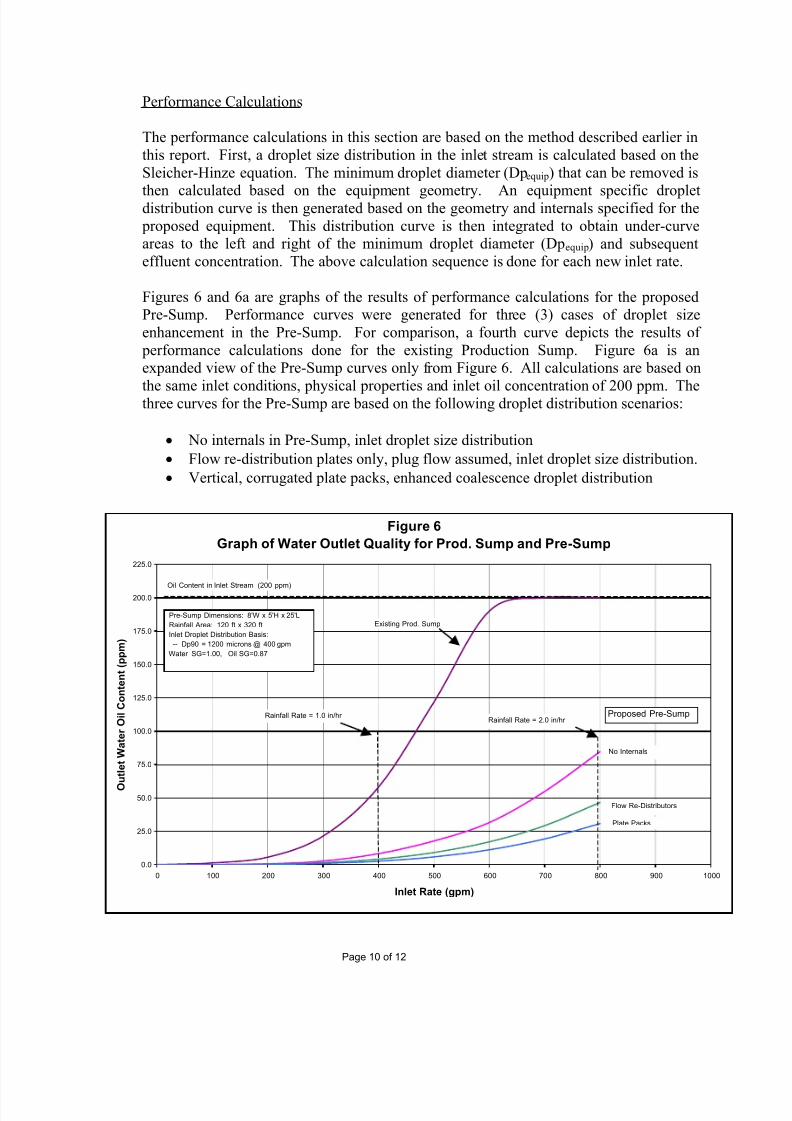
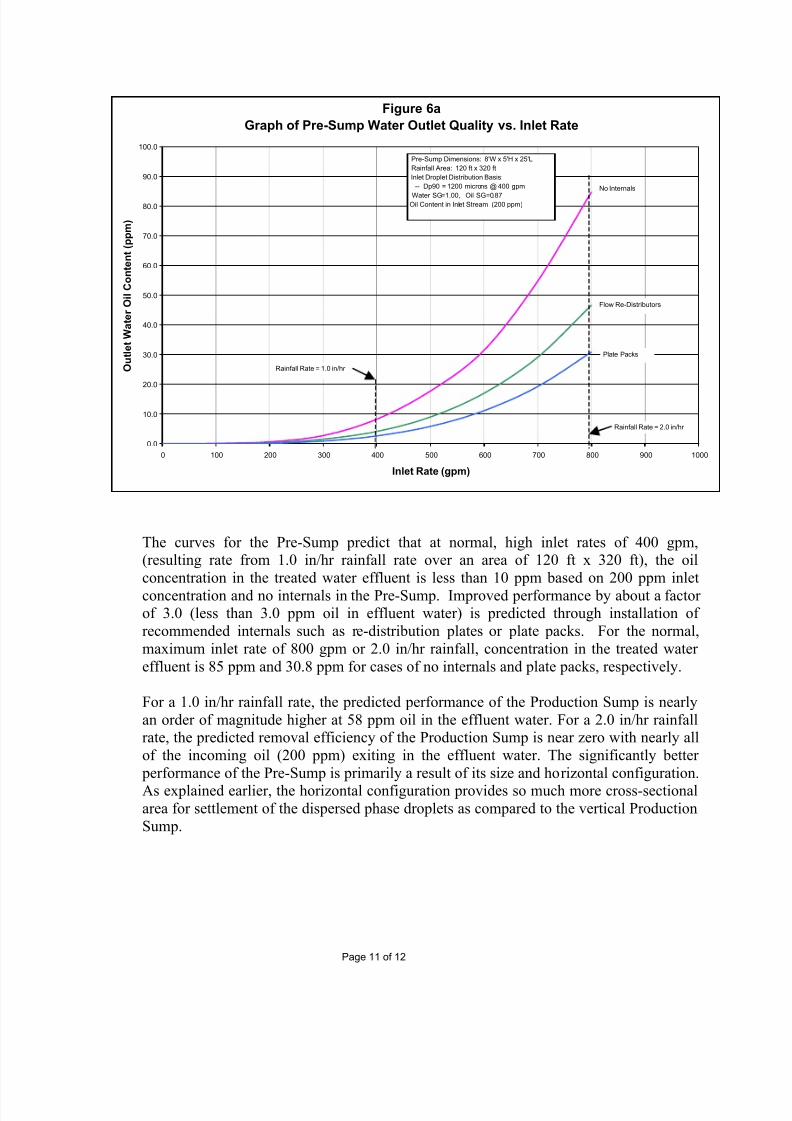
Figures 6 and 6a are graphs of the results of performance calculations for the proposedPre-Sump. Performance curves were generated for three (3) cases of droplet sizeenhancement in the Pre-Sump. For comparison, a fourth curve depicts the results of performance calculations done for the existing Production Sump. Figure 6a is anexpanded view of the Pre-Sump curves only from Figure 6. All calculations are based on
the same inlet conditions, physical properties and inlet oil concentration of 200 ppm. Thethree curves for the Pre-Sump are based on the following droplet distribution scenarios:
• No internals in Pre-Sump, inlet droplet size distribution
• Flow re-distribution plates only, plug flow assumed, inlet droplet size distribution.
• Vertical, corrugated plate packs, enhanced coalescence droplet distribution
Figure 6
Graph of Water Outlet Quality for Prod. Sump and Pre-Sump
0.0
25.0
50.0
75.0
100.0
125.0
150.0
175.0
200.0
225.0
0 100 200 300 400 500 600 700 800 900 1000
Inlet Rate (gpm)
O
u t l e t W a t e r O i l C o n t e n t ( p p m )
Pre-Sump Dimensions: 8'W x 5'H x 25'L
Rainfall Area: 120 ft x 320 ft
Inlet Droplet Distribution Basis:
-- Dp90 = 1200 microns @ 400 gpm
Water SG=1.00, Oil SG=0.87
Rainfall Rate = 1.0 in/hr
Oil Content in Inlet Stream (200 ppm)
Existing Prod. Sump
Proposed Pre-Sump
No Internals
Flow Re-Distributors
Plate Packs
Rainfall Rate = 2.0 in/hr
Page 10 of 12
7/25/2019 Coalesce Rs Doc
http://slidepdf.com/reader/full/coalesce-rs-doc 11/12
Figure 6a
Graph of Pre-Sump Water Outlet Quality vs. Inlet Rate
0.0
10.0
20.0
30.0
40.0
50.0
60.0
70.0
80.0
90.0
100.0
0 100 200 300 400 500 600 700 800 900 1000
Inlet Rate (gpm)
O u t l e t W a t e r O i l C o n t e n t ( p p m )
Pre-Sump Dimensions: 8'W x 5'H x 25'L
Rainfall Area: 120 ft x 320 ft
Inlet Droplet Distribution Basis:
-- Dp90 = 1200 microns @ 400 gpm
Water SG=1.00, Oil SG=0.87Oil Content in Inlet Stream (200 ppm)
Rainfall Rate = 2.0 in/hr
No Internals
Flow Re-Distributors
Plate Packs
Rainfall Rate = 1.0 in/hr
The curves for the Pre-Sump predict that at normal, high inlet rates of 400 gpm,(resulting rate from 1.0 in/hr rainfall rate over an area of 120 ft x 320 ft), the oilconcentration in the treated water effluent is less than 10 ppm based on 200 ppm inletconcentration and no internals in the Pre-Sump. Improved performance by about a factorof 3.0 (less than 3.0 ppm oil in effluent water) is predicted through installation ofrecommended internals such as re-distribution plates or plate packs. For the normal,maximum inlet rate of 800 gpm or 2.0 in/hr rainfall, concentration in the treated watereffluent is 85 ppm and 30.8 ppm for cases of no internals and plate packs, respectively.
For a 1.0 in/hr rainfall rate, the predicted performance of the Production Sump is nearlyan order of magnitude higher at 58 ppm oil in the effluent water. For a 2.0 in/hr rainfallrate, the predicted removal efficiency of the Production Sump is near zero with nearly allof the incoming oil (200 ppm) exiting in the effluent water. The significantly better performance of the Pre-Sump is primarily a result of its size and horizontal configuration.
As explained earlier, the horizontal configuration provides so much more cross-sectionalarea for settlement of the dispersed phase droplets as compared to the vertical ProductionSump.
Page 11 of 12
7/25/2019 Coalesce Rs Doc
http://slidepdf.com/reader/full/coalesce-rs-doc 12/12
Pre-Sump Installation Cost
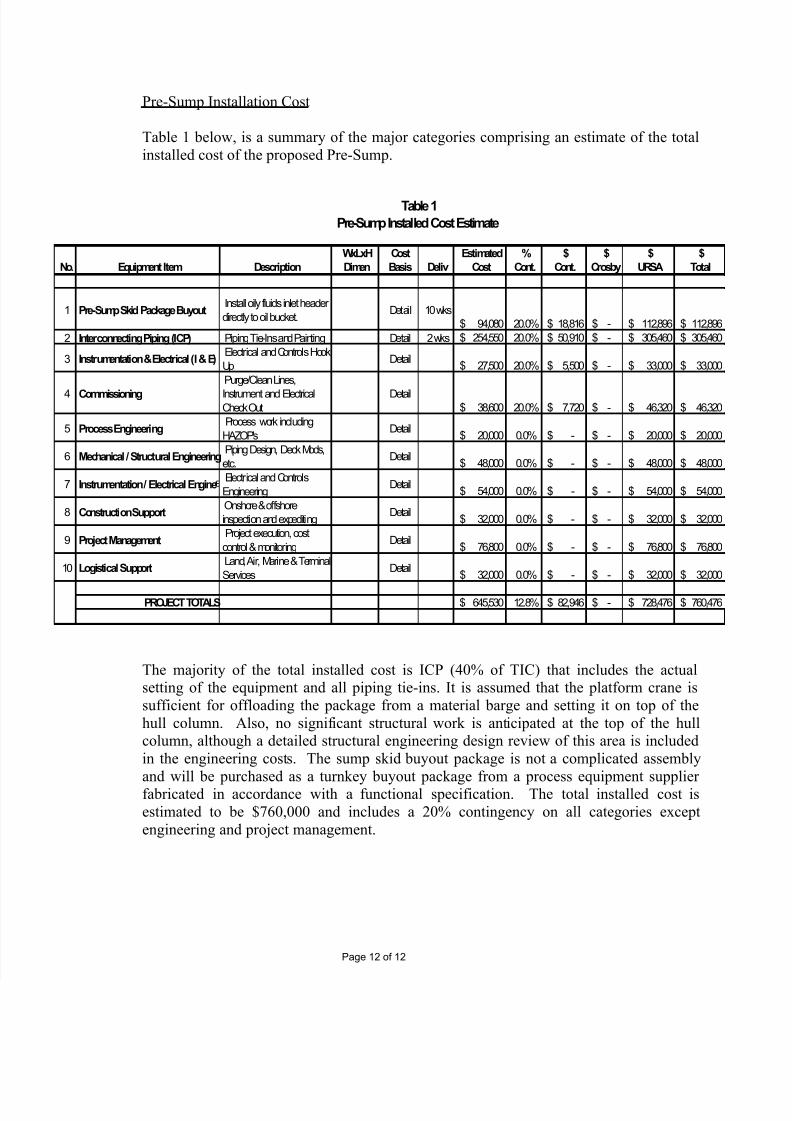
Table 1 below, is a summary of the major categories comprising an estimate of the totalinstalled cost of the proposed Pre-Sump.
Table 1
Pre-Sump Installed Cost Estimate
WxLxH Cost Estimated % $ $ $ $No. Equipment Item Description Dimen Basis Deliv Cost Cont. Cont. Crosby URSA Total
1 Pre-Sump Skid Package Buyout Install oily fluids inlet header
directly to oil bucket.Detail 10 wks
94,080$ 20.0% 18,816$ -$ 112,896$ 112,896$
2 Interconnecting Piping (ICP) Piping Tie-Ins and Painting Detail 2 wks 254,550$ 20.0% 50,910$ -$ 305,460$ 305,460$
3 Instrumentation & Electrical (I & E) Electrical and Controls Hook
UpDetail
27,500$ 20.0% 5,500$ -$ 33,000$ 33,000$
4 Commissioning
Purge/Clean Lines,
Instrument and ElectricalCheck Out
Detail38,600$ 20.0% 7,720$ -$ 46,320$ 46,320$
5 Process Engineering Process work including
HAZOP'sDetail
20,000$ 0.0% -$ -$ 20,000$ 20,000$
6 Mechanical / Structural Engineering Piping Design, Deck Mods,
etc.Detail
48,000$ 0.0% -$ -$ 48,000$ 48,000$
7 Instrumentation / Electrical Engine Electrical and Controls
EngineeringDetail
54,000$ 0.0% -$ -$ 54,000$ 54,000$
8 Construction Support Onshore & offshoreinspection and expediting
Detail32,000$ 0.0% -$ -$ 32,000$ 32,000$
9 Project Management Project execution, cost
control & monitoringDetail
76,800$ 0.0% -$ -$ 76,800$ 76,800$
10 Logistical Support Land, Air, Marine & Terminal
ServicesDetail
32,000$ 0.0% -$ -$ 32,000$ 32,000$
PROJECT TOTALS 645,530$ 12.8% 82,946$ -$ 728,476$ 760,476$
The majority of the total installed cost is ICP (40% of TIC) that includes the actualsetting of the equipment and all piping tie-ins. It is assumed that the platform crane issufficient for offloading the package from a material barge and setting it on top of thehull column. Also, no significant structural work is anticipated at the top of the hullcolumn, although a detailed structural engineering design review of this area is includedin the engineering costs. The sump skid buyout package is not a complicated assemblyand will be purchased as a turnkey buyout package from a process equipment supplierfabricated in accordance with a functional specification. The total installed cost isestimated to be $760,000 and includes a 20% contingency on all categories exceptengineering and project management.
Page 12 of 12