Embed Size (px)
Citation preview

Color Scheme
42 176 182
144 144 144
45 53 57
49 128 195
8 161 254
58 97 171
Color Scheme
42 176 182
144 144 144
45 53 57
49 128 195
8 161 254
58 97 171
Legacy Acquisi-on Corp October 2016

Color Scheme
42 176 182
144 144 144
45 53 57
49 128 195
8 161 254
58 97 171
Disclaimer
2
� This informa5on is being presented in reliance on your representa5on that you are a qualified ins5tu5onal buyer or an ins5tu5onal accredited investor as such terms are defined in the federal securi5es laws. These materials are not an offer to sell, and are not seeking an offer to buy, any securi5es of Legacy Acquisi5on Corp. (“Legacy"). Legacy securi5es may only be sold pursuant to an effec5ve registra5on statement filed with the Securi5es and Exchange Commission or an exemp5on therefrom. The informa5on provided herein is provided to you on the condi5on that you agree that you will hold it in strict confidence and not reproduce it or disclose it to any third party in whole or in part. By receiving this informa5on, the recipient expressly agrees to maintain the confiden5ality of the informa5on herein and to use any such informa5on in accordance with its compliance policies, contractual obliga5ons and applicable law, including federal and state securi5es laws.
� The statements contained in this presenta5on that are not purely historical are forward-‐looking statements. Our forward-‐looking statements include, but are not limited to, statements regarding our or our management team's expecta5ons, hopes, beliefs, inten5ons or strategies regarding the future. In addi5on, any statements that refer to projec5ons, forecasts or other characteriza5ons of future events or circumstances, including any underlying assump5ons, are forward-‐looking statements. The words "an5cipate," "believe," "con5nue," "could," "es5mate," "expect," "intends," "may," "might," "plan," "possible," "poten5al," "predict," "project," "should," "would" and similar expressions may iden5fy forward-‐looking statements, but the absence of these words does not mean that a statement is not forward-‐looking.
� The forward-‐looking statements contained in this presenta5on are based on our current expecta5ons and beliefs concerning future developments and their poten5al effects on us. There can be no assurance that future developments affec5ng us will be those that we have an5cipated. These forward-‐looking statements involve a number of risks, uncertain5es (some of which are beyond our control) or other assump5ons that may cause actual results or performance to be materially different from those expressed or implied by these forward-‐looking statements. Should one or more of these risk or uncertain5es materialize, or should any of our assump5ons prove incorrect, actual results may vary in material respects from those projected in these forward-‐looking statements. We undertake no obliga5on to update or revise any forward-‐looking statements, whether as a result of new informa5on, future events or otherwise, except as may be required under applicable securi5es laws.
� Certain market data informa5on in this presenta5on is based on management's es5mates. Legacy obtained the industry, market and compe55ve posi5on data used throughout this presenta5on from internal es5mates and research as well as from industry publica5ons and research, surveys and studies conducted by third par5es. Legacy believes its es5mates to be accurate as of the date of this presenta5on. However, this informa5on may prove to be inaccurate because of the method by which Legacy obtained some of the data for its es5mates or because this informa5on cannot always be verified due to the limits on the availability and reliability of raw data, and the nature of the data gathering process.
� Historical performances of Proctor & Gamble Co. and Coty, Inc. presented herein reflect many factors outside the control of the sponsors and management team of Legacy and are no guarantee of future results of Legacy.

Color Scheme
42 176 182
144 144 144
45 53 57
49 128 195
8 161 254
58 97 171
Key Investment Highlights
3
Deep opera(onal experience across global consumer brands
Robust deal sourcing and M&A capabili(es
Proven value crea(on at public and private companies
Strong public company leadership, governance and guidance
Extensive strategic and management exper(se in branded consumer businesses

Color Scheme
42 176 182
144 144 144
45 53 57
49 128 195
8 161 254
58 97 171
Seasoned Leaders
4
• Over 35 years opera5ng experience at Procter & Gamble • Led the crea5on and na5onal rollout of Pringles
• Revitalized Secret an5-‐perspirant:
“strong enough for a man but made for a woman” • Co-‐owner of Cincinna5 Reds MLB team
• Owner and CEO of EnovaPremier, LLC, a Tier 1 automo5ve supplier
• Former Board Member Federal Reserve Bank of Cleveland
• Na5onal Museum and Library Services Board appointment by President G.W. Bush
Edwin Rigaud Chief Execu(ve Officer
Lloyd Ward Chairman
• Over 35 years of consumer products’ opera5ng experience • Maytag Corpora5on – Former Chairman and CEO
• Frito-‐Lay – Former President (Western Division)
• Procter & Gamble (17 years) – Former General Manager • General Motors – Former Board Director
• JP Morgan – Former Board Directo
• United States Olympic Commihee: CEO & Secretary General
Jim Lane Chair – Investment CommiFee
• 35 years of private equity experience • Goldman Sachs & Co (20 years) -‐ Former Founder & General Partner
of the Investment Area (PIA) – GS private equity business
• Investment Commihee member -‐ PIA and Whitehall Real Estate Funds • Former Chairman & CEO -‐ SG Capital Partners ("SG”), the US private equity
business of Societe Generale and SG Cowen
• Management Commihee member of SG Cowen
Color Scheme
42 176 182
144 144 144
45 53 57
49 128 195
8 161 254
58 97 171
Picture Embed ____
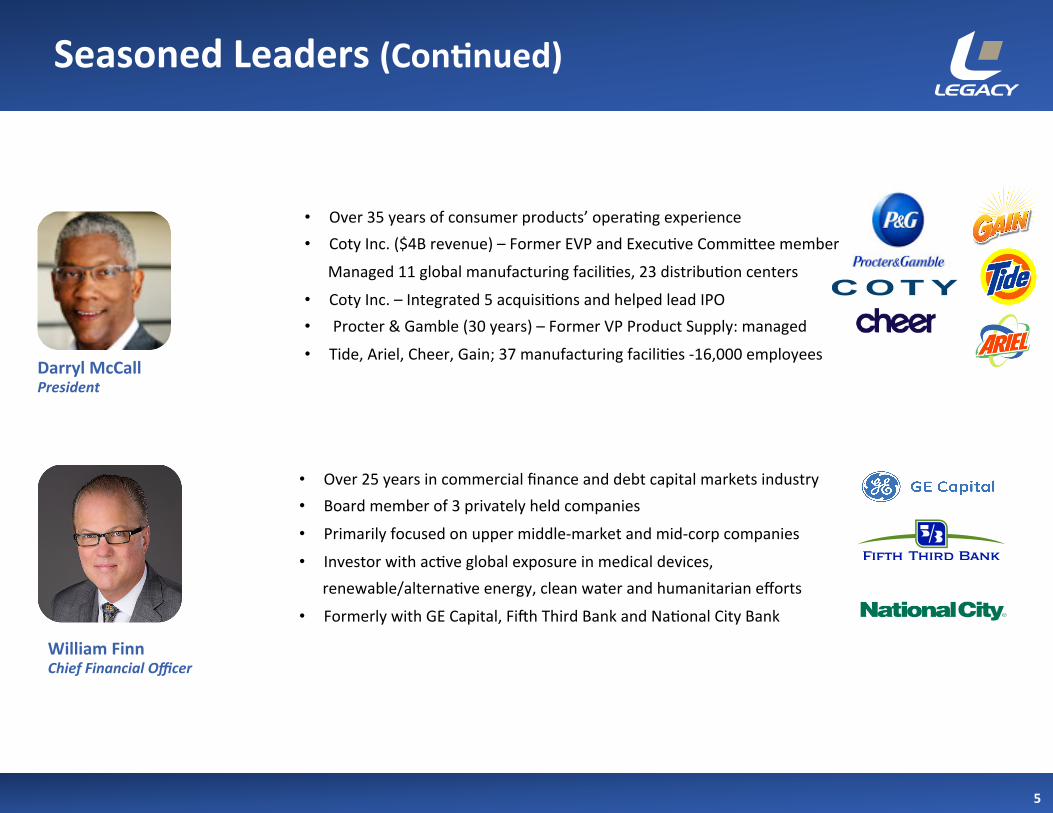
Seasoned Leaders (Con-nued)
5
William Finn Chief Financial Officer
• Over 25 years in commercial finance and debt capital markets industry • Board member of 3 privately held companies
• Primarily focused on upper middle-‐market and mid-‐corp companies
• Investor with ac5ve global exposure in medical devices, renewable/alterna5ve energy, clean water and humanitarian efforts
• Formerly with GE Capital, Fikh Third Bank and Na5onal City Bank
Darryl McCall President
• Over 35 years of consumer products’ opera5ng experience • Coty Inc. ($4B revenue) – Former EVP and Execu5ve Commihee member
Managed 11 global manufacturing facili5es, 23 distribu5on centers
• Coty Inc. – Integrated 5 acquisi5ons and helped lead IPO • Procter & Gamble (30 years) – Former VP Product Supply: managed
• Tide, Ariel, Cheer, Gain; 37 manufacturing facili5es -‐16,000 employees
Color Scheme
42 176 182
144 144 144
45 53 57
49 128 195
8 161 254
58 97 171
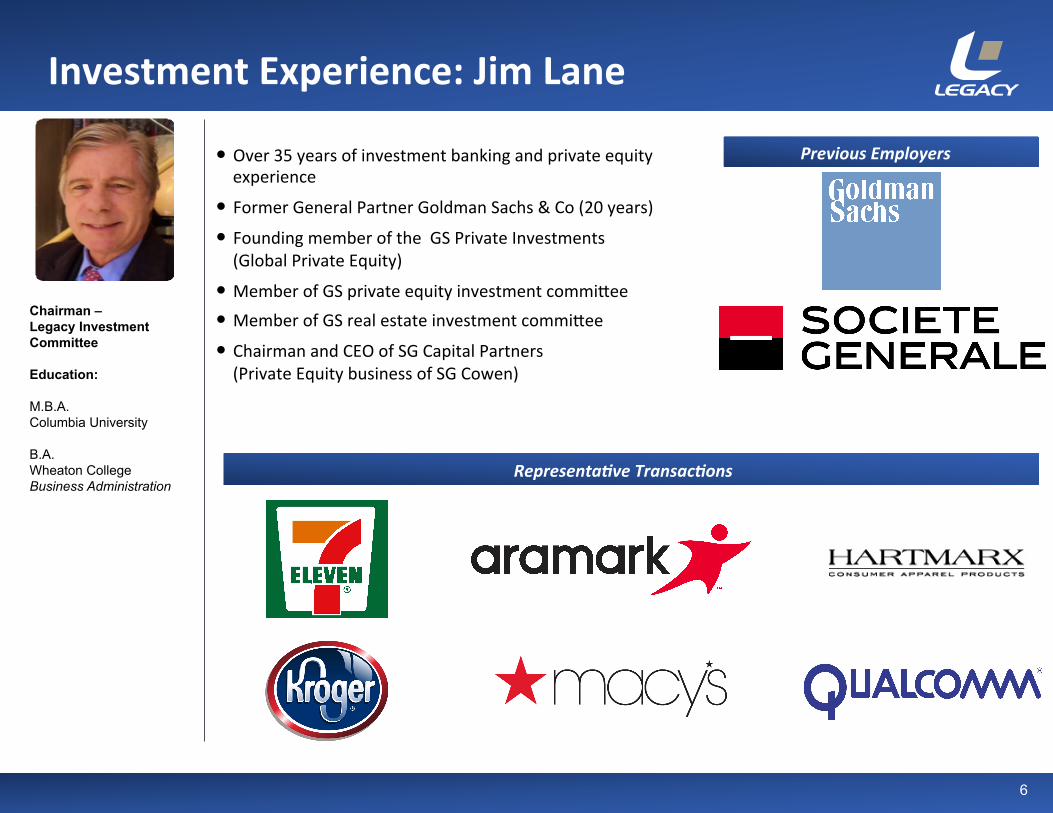
Investment Experience: Jim Lane
6
Chairman – Legacy Investment Committee Education: M.B.A. Columbia University B.A. Wheaton College Business Administration
� Over 35 years of investment banking and private equity experience
� Former General Partner Goldman Sachs & Co (20 years)
� Founding member of the GS Private Investments (Global Private Equity)
� Member of GS private equity investment commihee � Member of GS real estate investment commihee
� Chairman and CEO of SG Capital Partners (Private Equity business of SG Cowen)
Previous Employers
Representa(ve Transac(ons

Color Scheme
42 176 182
144 144 144
45 53 57
49 128 195
8 161 254
58 97 171
Picture Embed ____
Seasoned Leaders (Con-nued)
7
Thomas Davenport Managing Director
• Over 15 years of investment and strategic advisory experience
• Managing Partner at Davenport Capital Management
• Former investment banker at William Blair in Mergers & Acquisi5ons
• Former investment banker at Ci5group in Global Industrials
Jonathan Webb Senior Managing Director
• 30 years of investment experience
• Former Vice President at Lehman Brothers
• Former investment banker at Merrill Lynch
• Former investment banker at Oppenheimer
• Former Managing Director in Mergers & Acquisi5ons at Duff & Phelps
• Former Principal at Hispania Capital Partners, a Duff & Phelps sponsored private equity fund

Color Scheme
42 176 182
144 144 144
45 53 57
49 128 195
8 161 254
58 97 171
Why Legacy
8
• Proven leadership team across several top consumer brands
• Pool of 25 members of combined team with relevant func5onal exper5se as part of sponsor team
Opera-onal Leadership Proprietary Deal Sourcing
• Experience catalyzing transforma5ve growth
• Unique sourcing & due diligence
The Legacy plaSorm is dedicated to sourcing high-‐poten-al consumer assets through proprietary deal flow at aVrac-ve valua-ons, and leveraging management’s deep industry
& opera-onal exper-se to drive shareholder value
Top 5 managers bring over 150 years of combined
management experience
Robust deal flow
• Conglomerate Divestures
• Middle Market PE
• Family Owned Business
Track record:
• Managing global brands
• Adding value across the supply chain
Deep Opera-onal Team with C-‐Suite Experience
M&A Exper-se Value Crea-on Experience
Experienced leadership:
• Iden5fying acquisi5on targets • Networking with owners • Acquiring and integra5ng public and private companies
Proven ability to:
• Drive shareholder value • Navigate mul5ple contexts and consumer categories

Color Scheme
42 176 182
144 144 144
45 53 57
49 128 195
8 161 254
58 97 171
� The team created value at P&G for over 30 years with the most recognizable global brands
� Over 20 individuals associated with the Legacy plaRorm worked across each stage of the value chain to enhance world class brands
� Legacy team responsible for some of the most recognizable and successful brands via:
-‐ Marke(ng and category management
-‐ Innova(on (packaging, patents, process) -‐ Supply chain management
-‐ Cost controls and reduc(ons
P&G Value Crea-on During Legacy Tenure
§ [To come]
§ [To come]
� Frito Lay was dominant in the salted snack category with a 45% share na5onally
� Only compe55on were strong regional brands
� Frito Lay faced no na5onal player to threaten its dominance
� Anheuser-‐Busch(AB) acquired a solid regional brand called Eagle Snacks
� AB announced their intent to use their beer store door delivery system to compete with Frito Lay, na5onally
� AB quickly expanded distribu5on and achieved a 6% na5onal market share
� Frito Lay responded
� AB never achieved double digit na5onal market share
� AB never turned a profit in the snack business
� AB withdrew for the salted snack market and sold Eagle Snacks to P&G in 1996.
� Exploited underdeveloped categories in Beauty (nails)
� Targeted niche market opportuni-es with significant growth poten-al and without major compe--on
� Acquired brands that led to global evolu-on of Beauty
� Targeted Skincare as the weakest por-on of Coty’s porSolio
� Strengthened U.S. presence in Skincare
� Diversified into mul-ple Beauty categories
� Built Coty’s Beauty segment to be 15% of the firm’s total revenue at the -me of IPO
� Color Cosme-cs revenue increased ~25% in the years leading up to Coty’s IPO
� Targeted new distribu-on opportuni-es (mass retail, salons, global distribu-on)
� Expanded Skincare distribu-on beyond QVC and into brick and mortar, domes-cally and abroad
� Penetrated new global distribu-on markets
� Skin & Body Care contributed 30% to Coty’s total revenue at IPO
� The segment also experienced ~20% growth in the years leading up to Coty’s launch
Beau
ty In
dustry
Skincare In
dustry
Coty Acquisi-on Strategy Growth
7
Brands
Key acquisitions:
Coty experienced significant EBTIDA Growth Under McCall
Source: Company filings and FactSet. * Past performance is not necessarily indicative of Legacy’s future results.
The Legacy team was responsible for crea-ng, managing and revitalizing some of the most valuable global brands while at P&G
Cost Savings Revenue Growth Margin Expansion
Brand Revitaliza-on Global Brand Expansion
Performance of P&G During Legacy Members’ Tenures
$0
$10
$20
$30
$40
$50
$60
$70
$80
$90
EBITDA Revenue
+2,134%
+1,133%
0%
500%
1000%
1500%
2000%
2500%
3000%
12/31/1984 3/14/1991 5/25/1997 8/7/2003 10/18/2009 12/31/2015P&G S&P500
Price Performance
Revenue and EBITDA ($bn)

Color Scheme
42 176 182
144 144 144
45 53 57
49 128 195
8 161 254
58 97 171
Experience Acquiring, Dives-ng and Integra-ng Companies
Select Consumer M&A Transac-ons
9
Has acquired
$1 Billion
Has acquired
$1 Billion
Has acquired
$500 Million
Has acquired
$400 Million
Has acquired
$7 Billion
Has acquired
$150 Million
Has acquired
$4.95 Billion
Has acquired
$57 Billion
Has acquired
$148 Million
Has acquired
$2.7 Billion
Has acquired
$800 Million

Color Scheme
42 176 182
144 144 144
45 53 57
49 128 195
8 161 254
58 97 171
SPAC Overview
A SPAC is an investment vehicle that enables a leadership team to raise capital via an IPO for the purpose of subsequently acquiring an exis(ng opera(ng company
¡ A public vehicle that has no commercial opera-ons un-l it effects a “business combina-on” (merger / acquisi-on of an opera-ng business), aner which the target business becomes a publicly traded en-ty (similar to a reverse merger)
¡ SPAC sponsors cover the cost of underwri-ng fees, legal fees, working capital, and other expenses, 100%+ of the capital raised in the IPO is placed into a trust account with a major bank
¡ IPO investors typically purchase $10.00 units comprised of one common share and ½ warrant
¡ IPO Investors have the ability to redeem their common shares for $10.00 cash (and s-ll keep the ½ warrant) if they choose not to par-cipate in a business combina-on
¡ Automa-c liquida-on with capital returned to investors if no acquisi-on within specified -meframe -‐ 24 months
¡ No management fees or salaries paid
¡ Opportunity to build a plaSorm through future issuances
11

Color Scheme
42 176 182
144 144 144
45 53 57
49 128 195
8 161 254
58 97 171
SPAC Process: IPO to Business Combina-on
Investor Can Choose
Scenario C: Keep the Shares & Warrant
Scenario B: Redeem Shares & Keep Warrant
Timeframe: Up to 24 Mon
ths
(Investors c
an se
ll shares and
warrants d
aily in th
e op
en m
arket)
Time = 0 mos
Time < 21 mos
Time < 24 mos
Scenario A: Redeem Shares
Vote Result
Or Expiry of Permihed Timeline
Investor risk is minimized by the ability to receive ini<al investment at op<on of
the investor
IPO Closes
Target Search
Target Iden5fied
Shareholder Approval Process
NO YES
¡ $10.00
¡ $10.00 + ½ warrant
¡ 1 share + ½ warrant ¡ Cash available to fund Business Combina5on
No Business Combina5on Ini5al Business Combina5on Closes
12
Color Scheme
42 176 182
144 144 144
45 53 57
49 128 195
8 161 254
58 97 171
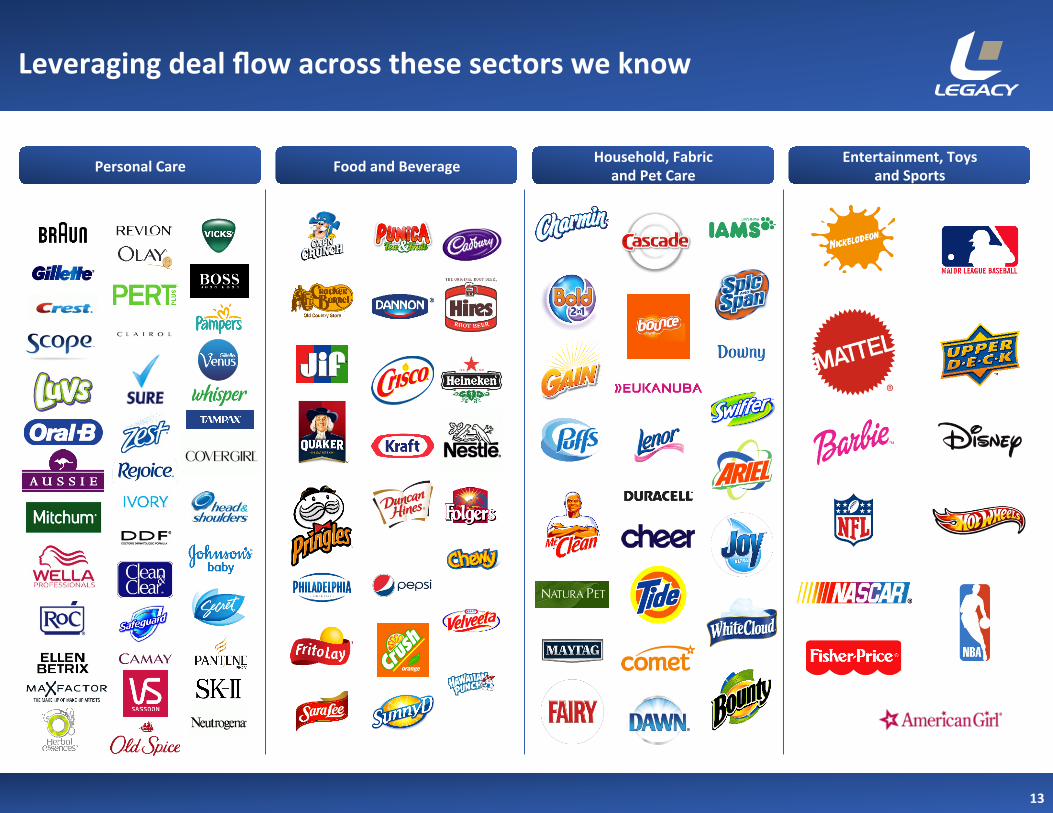
Leveraging deal flow across these sectors we know
13
Personal Care Food and Beverage Household, Fabric and Pet Care
Entertainment, Toys and Sports
Color Scheme
42 176 182
144 144 144
45 53 57
49 128 195
8 161 254
58 97 171
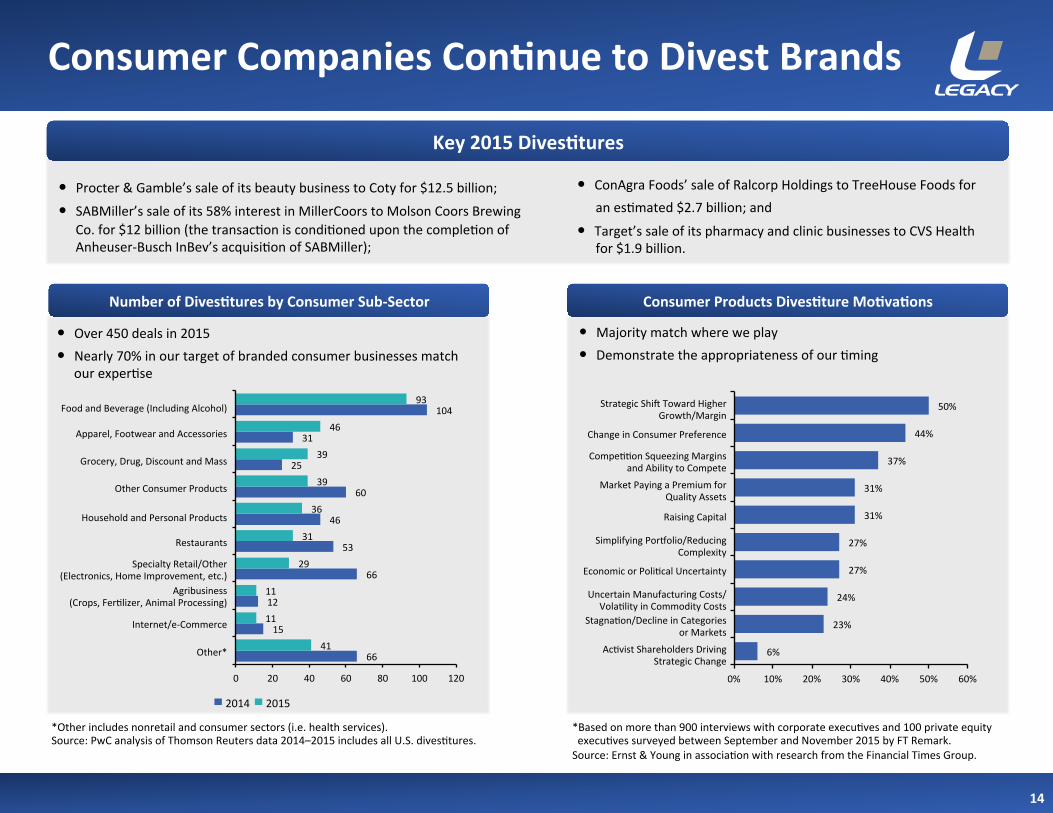
� Over 450 deals in 2015 � Nearly 70% in our target of branded consumer businesses match
our exper5se
� Majority match where we play � Demonstrate the appropriateness of our 5ming
Key 2015 Dives-tures
� Procter & Gamble’s sale of its beauty business to Coty for $12.5 billion;
� SABMiller’s sale of its 58% interest in MillerCoors to Molson Coors Brewing Co. for $12 billion (the transac5on is condi5oned upon the comple5on of Anheuser-‐Busch InBev’s acquisi5on of SABMiller);
� ConAgra Foods’ sale of Ralcorp Holdings to TreeHouse Foods for an es5mated $2.7 billion; and
� Target’s sale of its pharmacy and clinic businesses to CVS Health for $1.9 billion.
*Other includes nonretail and consumer sectors (i.e. health services). Source: PwC analysis of Thomson Reuters data 2014–2015 includes all U.S. dives5tures.
14
Consumer Companies Con-nue to Divest Brands
*Based on more than 900 interviews with corporate execu5ves and 100 private equity execu5ves surveyed between September and November 2015 by FT Remark. Source: Ernst & Young in associa5on with research from the Financial Times Group.
6%
23%
24%
27%
27%
31%
31%
37%
44%
50%
0% 10% 20% 30% 40% 50% 60%
Ac5vist Shareholders Driving Strategic Change
Stagna5on/Decline in Categories or Markets
Uncertain Manufacturing Costs/ Vola5lity in Commodity Costs
Economic or Poli5cal Uncertainty
Simplifying Por|olio/Reducing Complexity
Raising Capital
Market Paying a Premium for Quality Assets
Compe55on Squeezing Margins and Ability to Compete
Change in Consumer Preference
Strategic Shik Toward Higher Growth/Margin
Number of Dives-tures by Consumer Sub-‐Sector Consumer Products Dives-ture Mo-va-ons
2015 2014
66
15
12
66
53
46
60
25
31
104
41
11
11
29
31
36
39
39
46
93
0 20 40 60 80 100 120
Other*
Internet/e-‐Commerce
Agribusiness (Crops, Fer5lizer, Animal Processing)
Specialty Retail/Other (Electronics, Home Improvement, etc.)
Restaurants
Household and Personal Products
Other Consumer Products
Grocery, Drug, Discount and Mass
Apparel, Footwear and Accessories
Food and Beverage (Including Alcohol)

Color Scheme
42 176 182
144 144 144
45 53 57
49 128 195
8 161 254
58 97 171
Benefits of Merging with a SPAC
15
… the many advantages over a tradi-onal IPO, sale to a financial buyer or a strategic buyer:
Certainty of Price ¡ Target company will know deal considera5on at outset of process vs. the day before an IPO lis5ng ¡ The SPAC can structure a deal with con5ngent earnout considera5on (which can result in a significantly higher effec5ve price), where a tradi5onal IPO cannot
Control
¡ Creates a liquidity event for exis5ng management, but s5ll allows them to retain opera5onal control and responsibility for growing the business
¡ Allows for “private equity input without private equity dominance” ¡ A transac5on with a SPAC can be much less disrup5ve to the target company, its management and its employees (vs. a deal with a strategic buyer, who could be mo5vated to eliminate select opera5ons and senior management team)
Cost / Dilu-on ¡ Many of the costs of going public have already been borne by the SPAC Founders while taking the vehicle public ¡ Less target valua5on dilu5on vs. a tradi5onal IPO because no “IPO discount”
Sponsorship ¡ SPAC leadership teams oken bring a mix of public company and private equity experience and can assist with the transi5on from private to public while also maintaining con5nuity of opera5ons and delivering equity value crea5on
Timing ¡ Less risk of the “IPO Window” closing since the SPAC is already public ¡ Expedited “going public” 5meline reduces risk that ahrac5ve public equity valua5ons come down because of the shorter transac5on 5meline (3 – 4 months v. 6 months)
Upside ¡ A transac5on with a SPAC could result in the target company’s shareholders owning a meaningful por5on of a public en5ty and poten5ally realizing upside that can occur from the private to public company arbitrage

Color Scheme
42 176 182
144 144 144
45 53 57
49 128 195
8 161 254
58 97 171
Legacy Value Crea-on Exper-se
11
Strategy, Opera-ons and Integra-on Exper-se
� Diligent execu5on drives value crea5on process and delivers bohom line results � Strategy drives all stages of growth engine
� Led produc5on facili5es domes5cally and interna5onally
� Technological innova5on that drives efficient supply
� Op5mized supply chain to create value
Woody Keown
Robert Robinson
Supply Chain
� Extensive global Brand planning, posi5oning and marke5ng campaigns
� Social media and digital marke5ng exper5se
� Driven growth though market segmenta5on
Ignacio Sola
Beverly Grant
Sales & Marke-ng
� Pioneering work at P&G in product and packaging innova5on
� Proven R&D track record: team par5cipated in developing over 50 patents
� Managing and streamlining design process
R&D, Package Design and Product Development
Mary Carethers
Sam Ross
� Product innova5on � Expanded distribu5on � Significant channel expansion � Channel management
� IPO execu5on � Acquisi5on and integra5on
management
� Supply chain op5miza5on
� Globaliza5on
� Brand revitaliza5on � Category management
� Product and supply chain innova5on
� Value op5miza5on
Jim Lane (35+ years)
Darryl McCall (35+ years)
Ken Robinson (35+ years)
Edwin Rigaud (35+ years)
Lloyd Ward (35+ years)
Others
Others
Others
Opera-onal Exper-se

Color Scheme
42 176 182
144 144 144
45 53 57
49 128 195
8 161 254
58 97 171
Legacy Illustra-ve Offering Summary
Issuer: Legacy Acquisi5on Corp.
Offering Type: Ini5al Public Offering
Offering Size: $230,000,000 ($200,000,000 base deal)
Over-‐Allotment Op-on: 15.0%
Offering Price Per Unit: $10.00
Number of Units: 23,000,000 units (20,000,000 units base deal)
Unit Composi-on: 1 common share and ½ warrant
Warrant Strike / Call: $11.50 / $24.00 per full share
Amount in Trust: 100%
Ini-al Underwri-ng Fee: 2.5%
Deferred Underwri-ng Fee: 3.0%
Exchange: NASDAQ
Timeframe: 24 months to complete an acquisi5on
Working Capital: $2,000,000 plus accrued interest
Insider Investment:
$8,500,000 private placement (17,000,000 warrants at $0.50 / warrant) § $3,000,000 investment from Legacy Acquisi5on Sponsor § $5,500,000 investment from Co-‐Sponsors § Warrants cannot be sold or transferred un5l a business combina5on has been
completed
17

Color Scheme
42 176 182
144 144 144
45 53 57
49 128 195
8 161 254
58 97 171
Legacy Illustra-ve Offering Summary (cont.)
Sponsor Considera-on:
Sponsor group is collec5vely awarded 20% equity (based on IPO size) following the successful comple5on of the ini5al business combina5on § Locked up for one year, or earlier if the stock reaches $12.00 at least 150 days
aker business combina5on
Use of Proceeds: Acquisi5on considera5on and related expenses and / or working capital needs of the combined en5ty post-‐combina5on
Qualified Business Combina-on:
Business combina5on must have a fair market value equal to at least 80% of the balance in the trust account
Timing: A typical SPAC IPO can be completed in 3 – 4 months
18

Color Scheme
42 176 182
144 144 144
45 53 57
49 128 195
8 161 254
58 97 171
Q & A
13
Global Public & Private Company Leadership � Ability to acquire and integrate business into public pla|orms
� Knowledgeable about how to opera5onally and financially govern a public company
� Experience building and acquiring best in class talent
Successful M&A and Inves-ng Track Record � Significant experience execu5ng acquisi5ons in the public and private equity arena
� Extensive turnaround experience with consumer brands and businesses
� Substan5al experience revitalizing and transforming brands
Proprietary Deal Sourcing and Rela-onship Network � Network of C-‐suite rela5onships across consumer packaged goods (CPG), durable and non-‐durable industries
� Visibility to available acquisi5on opportuni5es from private equity investors, professional advisors and industry insiders
� Board level, government and non-‐profit senior rela5onships
Significant Consumer Opera-onal Leadership � Seasoned management team with significant consumer industry experience
� Successful track record building global consumer businesses and products
� Brand building, product op5miza5on, R&D and product development

Color Scheme
42 176 182
144 144 144
45 53 57
49 128 195
8 161 254
58 97 171
Color Scheme
42 176 182
144 144 144
45 53 57
49 128 195
8 161 254
58 97 171
APPENDIX
20
Color Scheme
42 176 182
144 144 144
45 53 57
49 128 195
8 161 254
58 97 171
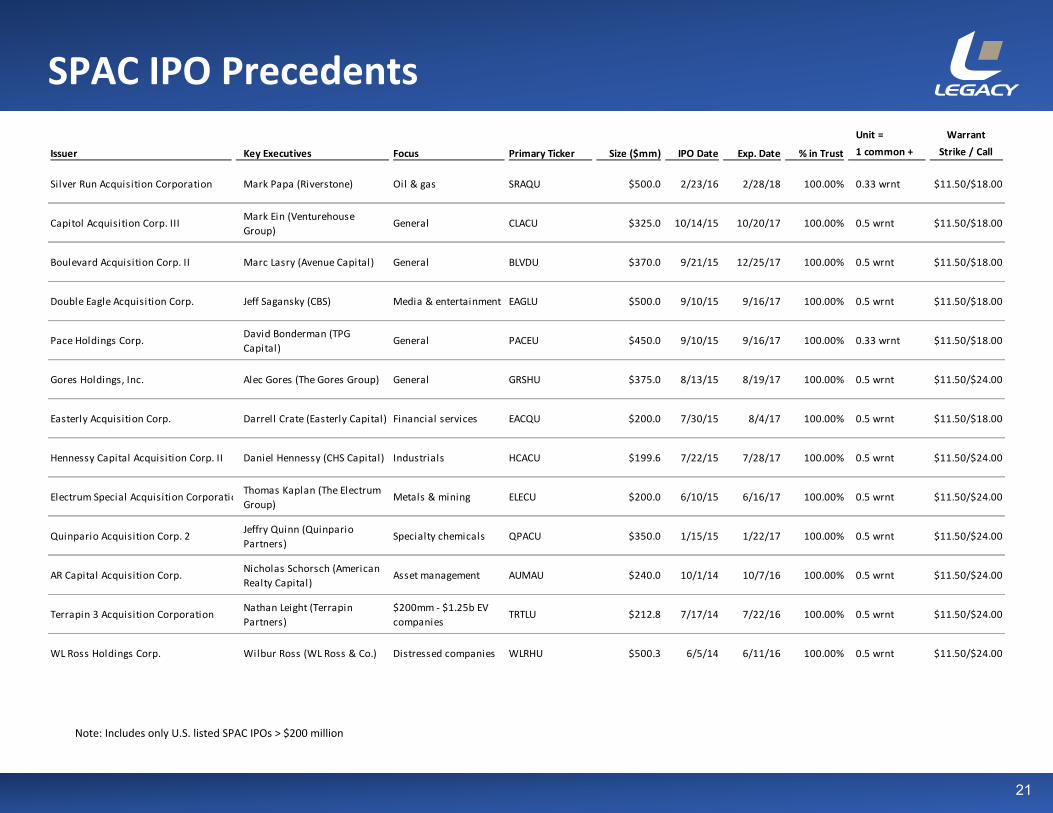
Issuer Key Executives Focus Primary Ticker Size ($mm) IPO Date Exp. Date % in Trust
Unit = 1 common +
WarrantStrike / Call
Silver Run Acquisition Corporation Mark Papa (Riverstone) Oil & gas SRAQU $500.0 2/23/16 2/28/18 100.00% 0.33 wrnt $11.50/$18.00
Capitol Acquisition Corp. III Mark Ein (Venturehouse Group)
General CLACU $325.0 10/14/15 10/20/17 100.00% 0.5 wrnt $11.50/$18.00
Boulevard Acquisition Corp. II Marc Lasry (Avenue Capital) General BLVDU $370.0 9/21/15 12/25/17 100.00% 0.5 wrnt $11.50/$18.00
Double Eagle Acquisition Corp. Jeff Sagansky (CBS) Media & entertainment EAGLU $500.0 9/10/15 9/16/17 100.00% 0.5 wrnt $11.50/$18.00
Pace Holdings Corp. David Bonderman (TPG Capital)
General PACEU $450.0 9/10/15 9/16/17 100.00% 0.33 wrnt $11.50/$18.00
Gores Holdings, Inc. Alec Gores (The Gores Group) General GRSHU $375.0 8/13/15 8/19/17 100.00% 0.5 wrnt $11.50/$24.00
Easterly Acquisition Corp. Darrell Crate (Easterly Capital) Financial services EACQU $200.0 7/30/15 8/4/17 100.00% 0.5 wrnt $11.50/$18.00
Hennessy Capital Acquisition Corp. II Daniel Hennessy (CHS Capital) Industrials HCACU $199.6 7/22/15 7/28/17 100.00% 0.5 wrnt $11.50/$24.00
Electrum Special Acquisition CorporationThomas Kaplan (The Electrum Group)
Metals & mining ELECU $200.0 6/10/15 6/16/17 100.00% 0.5 wrnt $11.50/$24.00
Quinpario Acquisition Corp. 2 Jeffry Quinn (Quinpario Partners)
Specialty chemicals QPACU $350.0 1/15/15 1/22/17 100.00% 0.5 wrnt $11.50/$24.00
AR Capital Acquisition Corp. Nicholas Schorsch (American Realty Capital)
Asset management AUMAU $240.0 10/1/14 10/7/16 100.00% 0.5 wrnt $11.50/$24.00
Terrapin 3 Acquisition Corporation Nathan Leight (Terrapin Partners)
$200mm -‐ $1.25b EV companies
TRTLU $212.8 7/17/14 7/22/16 100.00% 0.5 wrnt $11.50/$24.00
WL Ross Holdings Corp. Wilbur Ross (WL Ross & Co.) Distressed companies WLRHU $500.3 6/5/14 6/11/16 100.00% 0.5 wrnt $11.50/$24.00
SPAC IPO Precedents
21
Note: Includes only U.S. listed SPAC IPOs > $200 million

Color Scheme
42 176 182
144 144 144
45 53 57
49 128 195
8 161 254
58 97 171
$36 $503
$1,082
$493
$1,455 $1,710
$4,772
$608 $1,018
$2,724
$423 $619
$0
$2,000
$4,000
$6,000
2009 2010 2011 2012 2013 2014 2015 Q1'15 Q2'15 Q3'15 Q4'15 Q1'16
IPO Proceed
s
SPAC Market Update With the recent rebound of the SPAC market, both sponsors and public equity investors are taking a fresh look at the product
• In 2007 there was $12 billion of SPAC IPO issuance. Ac5vity slowed down dras5cally during the 2008 financial crisis as unstable market condi5ons and structural inefficiencies made it difficult to close business combina5ons
• In 2010 the SPAC market began to recover as a number of developments resulted in a superior product: • Structural changes to address historical inefficiencies, making SPACs more ahrac5ve to investors, target companies
and sponsors • The entry of higher quality, “brand name” sponsors with strong track records, unique deal flow, public company
experience, and real rela5onships with equity investors • These developments laid the groundwork for a number of successful, high-‐profile SPAC business combina5ons This, in turn, has resulted in:
• Broader par5cipa5on from new equity investors (i.e. not just the same “SPAC Hedge Funds” that have been successfully inves5ng in SPACs for years)
• Beher recep5vity from sophis5cated target companies and sellers (including: Dow Chemical, Cerberus, Goldman Sachs, Madison Dearborn, etc.)
SPAC IPO Issuance, 2009-‐2016 YTD ($mm)(1) The “Virtuous Circle” Driving Recent Success
Broader Investor
Par-cipa-on
Improved Structure
Posi-ve Recent Track
Record
Sophis-cated Sellers
Stronger Sponsors
Source: Dealogic, Bloomberg, Public filings (accessible via hyperlink in “link” column, or at www.sec.gov/edgar) (1) Includes all U.S. and Canadian-‐listed SPACs, with Canadian IPO amounts converted from CAD to USD as of each closing
22

Color Scheme
42 176 182
144 144 144
45 53 57
49 128 195
8 161 254
58 97 171
IPO Timetable & Responsibili-es
Week Objec-ves Primary
Responsibility
1
§ Execute engagement leher § Engage Underwriter Counsel and Issuer Counsel § Complete working group list
§ S, U § S, U
§ All
2
§ Set up corpora5on § Begin corpora5on audits § Begin first drak of registra5on statement § Finalize Board of Directors posi5ons § Commence NASD approval process
§ IC § A § S, U, IC, UC § S § UC
3/4
§ Finalize registra5on statement § Finalize corpora5on audits § File registra5on statement
§ S, U, IC, UC § A § IC
5/6
§ Apply to exchange (NASDAQ) § Begin prepara5on of management presenta5ons
§ S, IC § S, U
7/8
§ Plan road show and management presenta5ons (choose ci5es)
§ Distribute first drak of underwri5ng agreement § Receive comments from the SEC
§ S, U
§ UC
§ S, U, IC, UC
9 § Respond to comments from the SEC § S, U, IC, UC
10
§ Finalize road show presenta5on schedule § Receive second round of comments from the SEC
§ S,U § S, U, IC, UC
Week Objec-ves Primary
Responsibility
11
§ Respond to second round of comments from the SEC § Print preliminary prospectus (“red herring”) § Nego5ate underwri5ng agreement § Underwriter sales force mee5ng (“teach in”) § Company presenta5on to ins5tu5onal sales force § Company presenta5on to retail sales force § Send out red herrings § Begin 1x1 investor mee5ngs
§ S, U, IC, UC
§ P § UC, IC § U § S, U
§ S, U § P, U § S, U
12
§ File warrant agreement and remaining exhibits with the SEC § Con5nue 1x1 investor mee5ngs
§ IC, UC
§ S,U
13 (Pricing)
§ Agree on final terms of offering § Price offering, sign underwri5ng agreement § Go effec5ve (delivery of comfort leher and IC opinion)
§ S, U § S, U § S, U, IC, UC
14 (Closing)
§ File final prospectus § Print and distribute final prospectus § Securi5es delivered and payment made to company § Closing documents exchanged
§ IC § P, U § U
§ All
Legend
Legacy Sponsors S Issuer Counsel IC Underwriters U
Underwriter Counsel UC Auditor A Printer P
23

Color Scheme
42 176 182
144 144 144
45 53 57
49 128 195
8 161 254
58 97 171
Key Investment Highlights
Robust deal sourcing capabili(es from industry leaders and advisor networks
Deep global consumer brands opera(ons experience and exper(se
Extensive M&A and investment experience
Proven value crea(on in public & private companies
Preeminent public company leadership experience
24

Color Scheme
42 176 182
144 144 144
45 53 57
49 128 195
8 161 254
58 97 171
Co-‐Sponsor Return Analysis (for discussion purposes only)
Co-‐Sponsor Returns Based on $5.5 Million Investment ($ millions, except per share)
Note: assumes full exercise of the over-‐allotment op5on (1) Warrant values only account for intrinsic value based on $11.50 strike at each respec5ve stock price (2) Locked up for one year, or earlier if the stock reaches $12.00 at least 150 days aker business combina5on
25
$9.6 $11.5 $13.4 $15.3 $17.3 $19.2 $21.1 $23.0 $24.9 $26.8 $28.8
$2.8
$8.3
$13.8
$19.3
$9.6 $11.5
$13.4 $15.3
$17.3 $19.2
$21.1
$25.8
$33.2
$40.6
$48.0
0.0x
1.0x
2.0x
3.0x
4.0x
5.0x
6.0x
7.0x
8.0x
9.0x
10.0x
$0.0
$10.0
$20.0
$30.0
$40.0
$50.0
$60.0
$5.00 $6.00 $7.00 $8.00 $9.00 $10.00 $11.00 $12.00 $13.00 $14.00 $15.00
MO
IC
Inve
stm
ent V
alue
Stock Price
Private Warrants (1) Common Shares (2) MOIC
Stock Price: $5.00 $6.00 $7.00 $8.00 $9.00 $10.00 $11.00 $12.00 $13.00 $14.00 $15.00Private Warrants $0.0 $0.0 $0.0 $0.0 $0.0 $0.0 $0.0 $2.8 $8.3 $13.8 $19.3Common Shares $9.6 $11.5 $13.4 $15.3 $17.3 $19.2 $21.1 $23.0 $24.9 $26.8 $28.8Total Co-Sponsor Value $9.6 $11.5 $13.4 $15.3 $17.3 $19.2 $21.1 $25.8 $33.2 $40.6 $48.0MOIC 1.7x 2.1x 2.4x 2.8x 3.1x 3.5x 3.8x 4.7x 6.0x 7.4x 8.7x

Color Scheme
42 176 182
144 144 144
45 53 57
49 128 195
8 161 254
58 97 171
Legacy Acquisi-on Corp. Capital Structure
• For a total investment of $5.5 million, Legacy’s co-‐investors would receive 1,916,667 shares and 11,000,000 warrants
• Each warrant is equal to ½ share at $5.75 with a strike place of $11.50
• The stock will price at $10 per share upon the comple5on of the Ini5al Public Offering "IPO"
• All capital is at risk
• Unlike public units, both the insider investment and promote shares will be worthless in the event that we are unable to successfully consummate a merger
26
Shares Warrants Shares Warrants
Managers / Sponsors 3,833,333 6,000,000 - - 3,833,333 6,000,000
Co-Sponsors 1,916,667 11,000,000 - - 1,916,667 11,000,000
Public Investors - - 23,000,000 23,000,000 23,000,000 23,000,000
Total 5,750,000 17,000,000 23,000,000 23,000,000 28,750,000 40,000,000
Founder Investors Public Investors Totalshares
Totalwarrants