Embed Size (px)
Citation preview
.1
Project Kick-Off MeetingDE-FE0009761
October 29, 2012
Commercialization of an Atmospheric Iron-Based Coal Direct Chemical Looping Process for Power Generation
.2
Outline
Introduction
Technology Review
Project Objectives
Phase I Activities and Budget
Phase II Activities and Budget
.3
Project Participants
Government Agencies:• DOE/NETL• ODOD
Industrial participants:• The Babcock & Wilcox, PGG• The Ohio State University• Clear Skies Consulting
.4
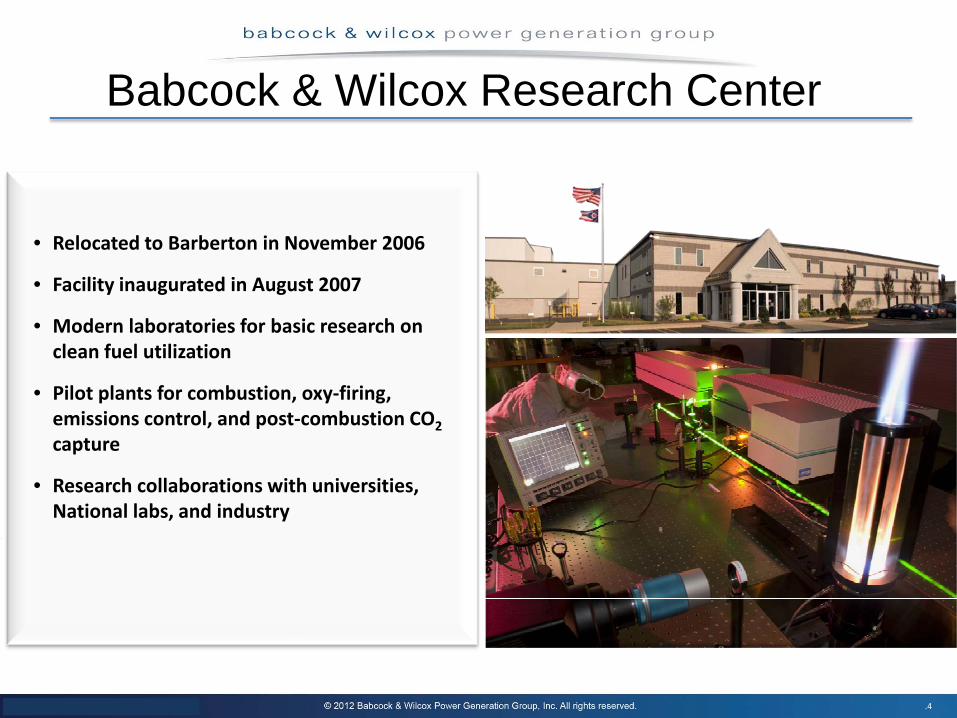
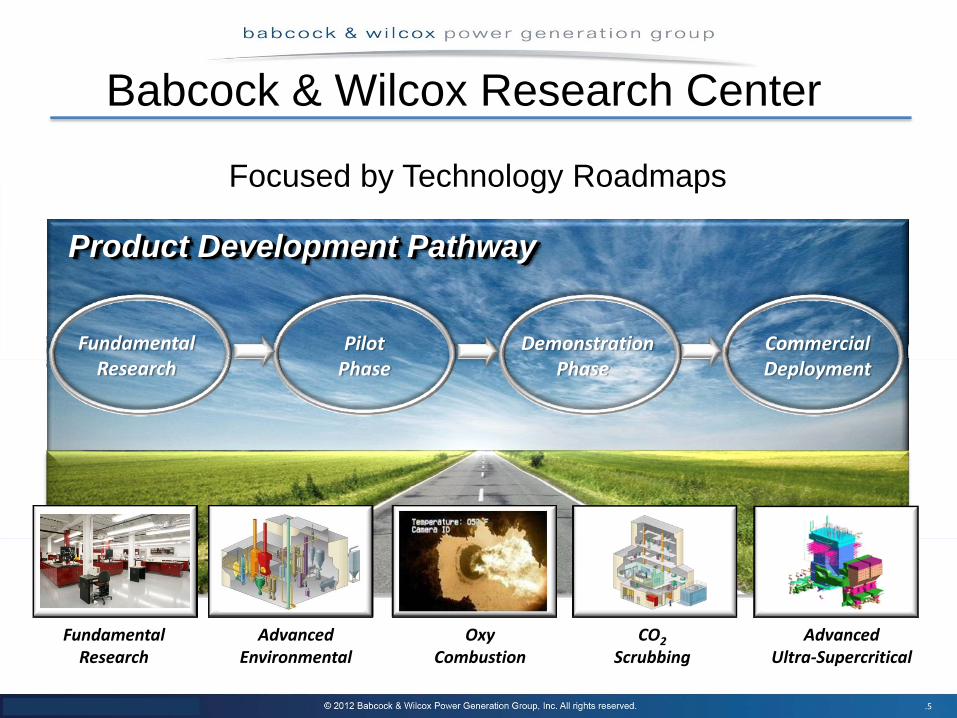
Babcock & Wilcox Research Center
• Relocated to Barberton in November 2006
• Facility inaugurated in August 2007
• Modern laboratories for basic research on clean fuel utilization
• Pilot plants for combustion, oxy‐firing, emissions control, and post‐combustion CO2capture
• Research collaborations with universities, National labs, and industry
.5
Focused by Technology Roadmaps
Product Development Pathway
FundamentalResearch
PilotPhase
DemonstrationPhase
CommercialDeployment
CO2Scrubbing
OxyCombustion
AdvancedUltra‐Supercritical
AdvancedEnvironmental
FundamentalResearch
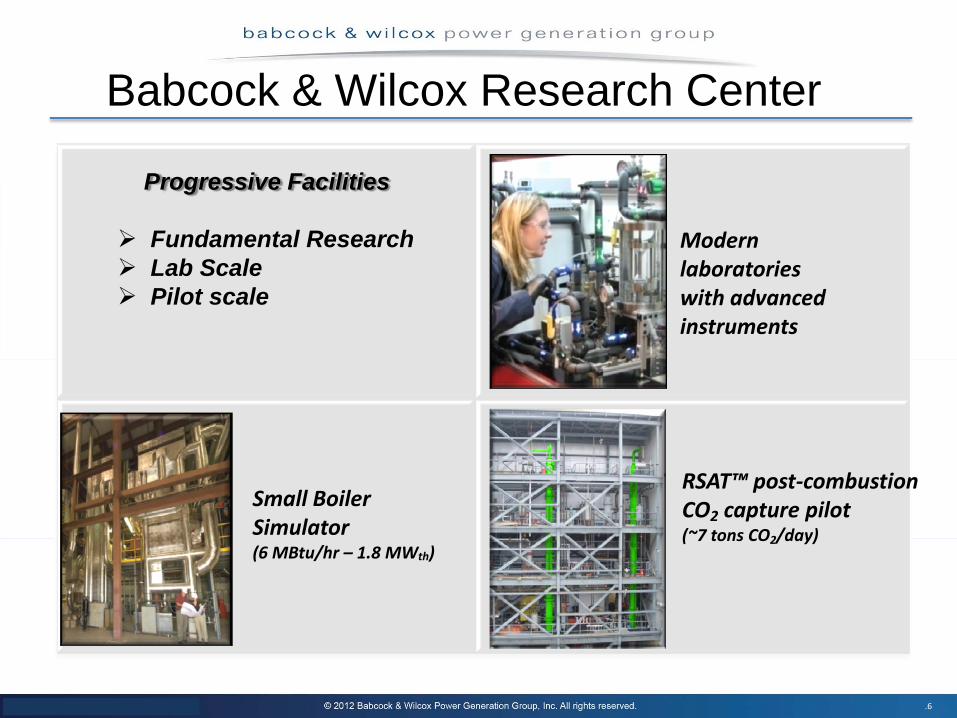
Babcock & Wilcox Research Center
.6
Progressive Facilities
Fundamental ResearchLab Scale Pilot scale
Small Boiler Simulator (6 MBtu/hr – 1.8 MWth)
RSAT™ post‐combustion CO2 capture pilot (~7 tons CO2/day)
Modern laboratories with advanced instruments
Babcock & Wilcox Research Center
.7
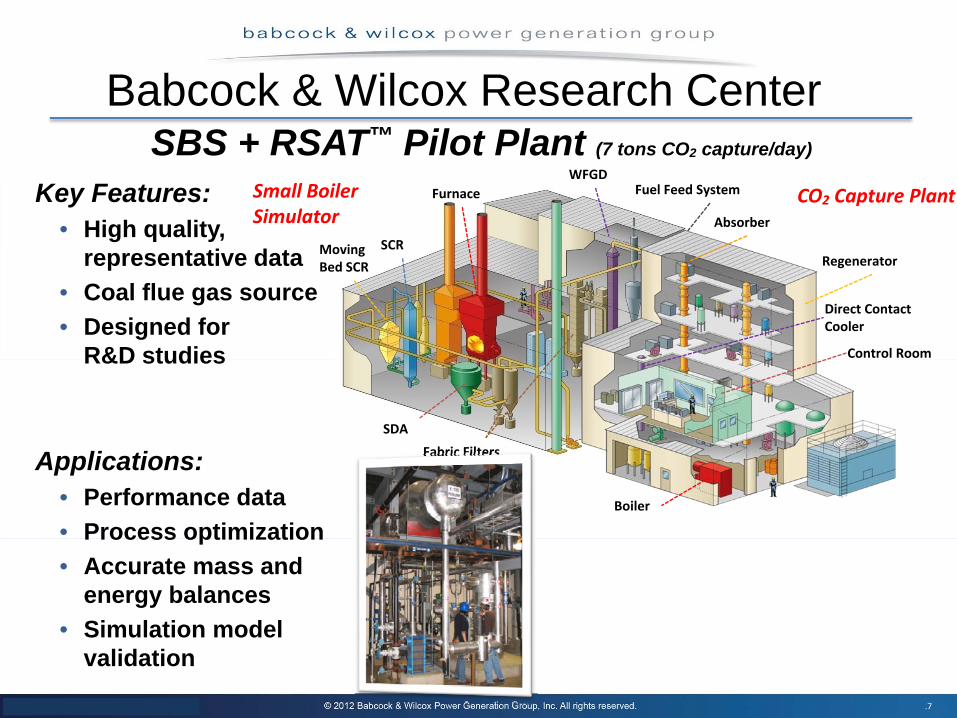
SBS + RSAT™ Pilot Plant (7 tons CO2 capture/day)
Key Features:• High quality,
representative data• Coal flue gas source• Designed for
R&D studies
Applications:• Performance data• Process optimization• Accurate mass and
energy balances• Simulation model
validation
SCRMoving Bed SCR
WFGD
SDA
Fabric Filters
Fuel Feed System Furnace CO2 Capture PlantAbsorber
Regenerator
Direct Contact Cooler
Control Room
Boiler
Small Boiler Simulator
Babcock & Wilcox Research Center
.8
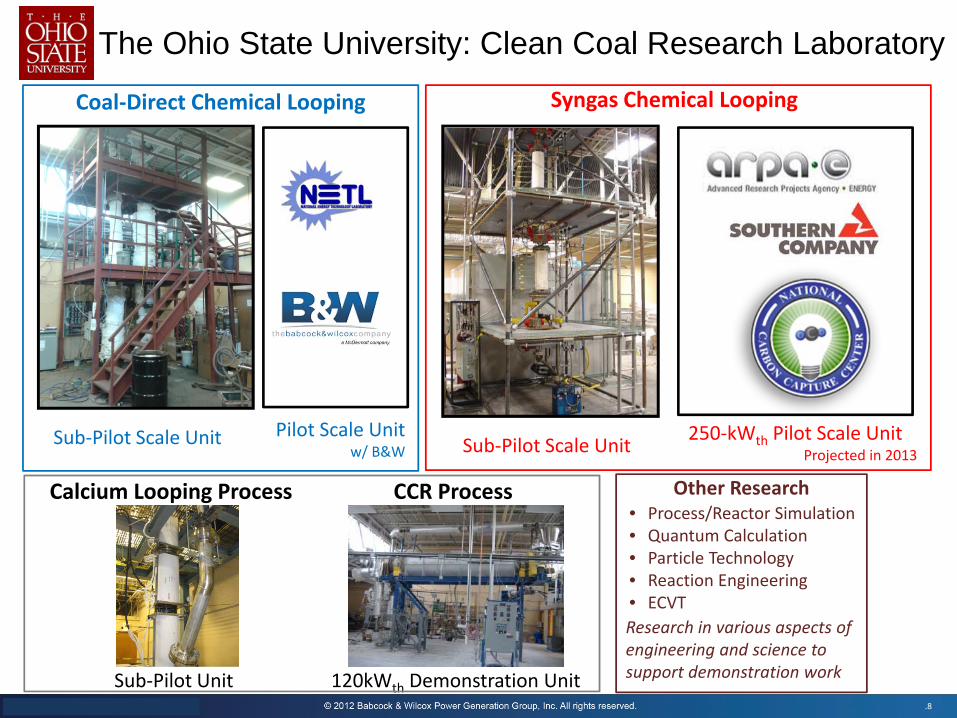
The Ohio State University: Clean Coal Research Laboratory
Sub‐Pilot Scale Unit
Syngas Chemical LoopingCoal‐Direct Chemical Looping
Sub‐Pilot Scale Unit
Other Research
120kWth Demonstration Unit
Calcium Looping Process CCR Process
Sub‐Pilot Unit
250‐kWth Pilot Scale UnitProjected in 2013
Pilot Scale Unitw/ B&W
• Process/Reactor Simulation• Quantum Calculation• Particle Technology• Reaction Engineering• ECVTResearch in various aspects of engineering and science to support demonstration work
.9
Outline
Introduction
Technology Review
Project Objectives
Phase I Activities and Budget
Phase II Activities and Budget
.10
Outline
Introduction
Technology ReviewConceptBench and Sup-pilot Scale DemonstrationsTechno-economic analysis
Project Objectives
Phase I Activities and Budget
Phase II Activities and Budget
.11
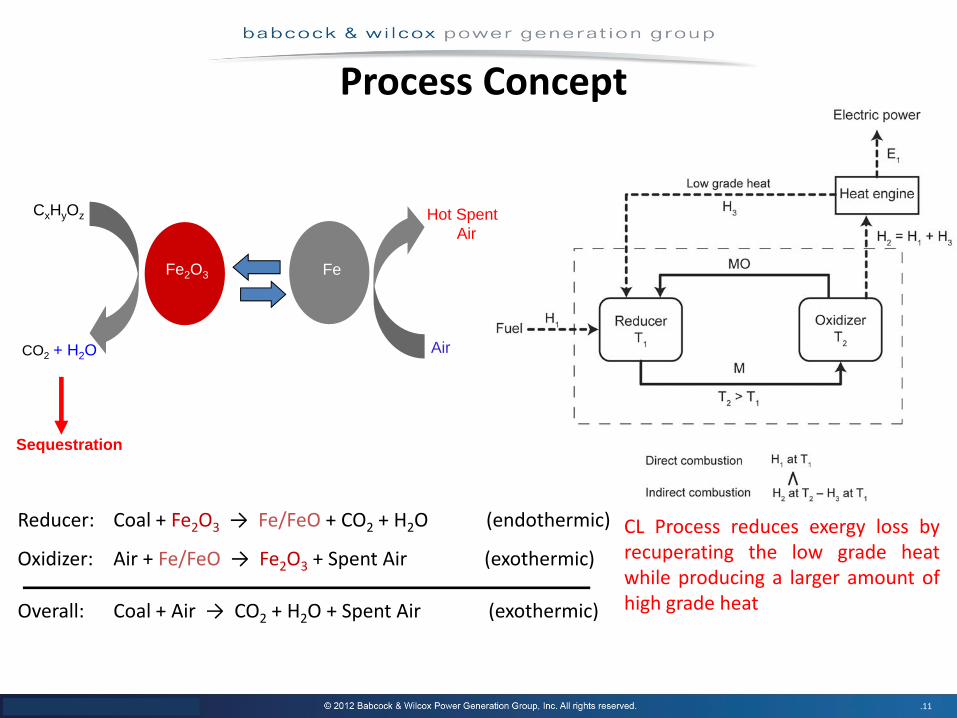
Process Concept
Reducer: Coal + Fe2O3 → Fe/FeO + CO2 + H2O (endothermic)
Oxidizer: Air + Fe/FeO → Fe2O3 + Spent Air (exothermic)
Overall: Coal + Air → CO2 + H2O + Spent Air (exothermic)
CL Process reduces exergy loss byrecuperating the low grade heatwhile producing a larger amount ofhigh grade heat
Fe2O3
Air
Hot Spent Air
CxHyOz
CO2 + H2O
Fe
Sequestration
.12
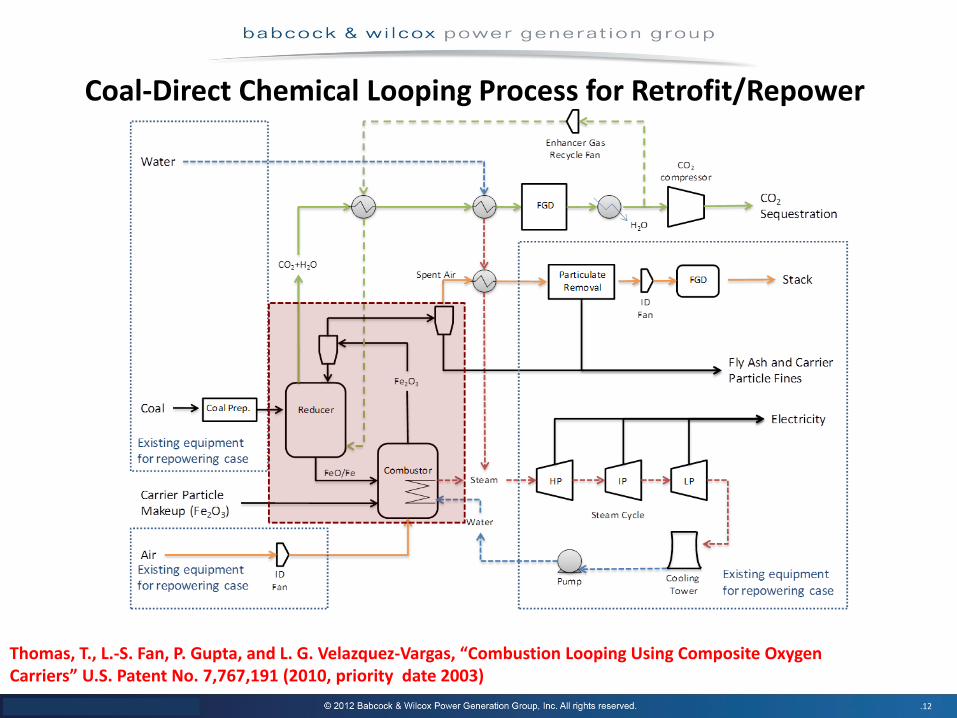
Coal‐Direct Chemical Looping Process for Retrofit/Repower
Thomas, T., L.‐S. Fan, P. Gupta, and L. G. Velazquez‐Vargas, “Combustion Looping Using Composite Oxygen Carriers” U.S. Patent No. 7,767,191 (2010, priority date 2003)
.13
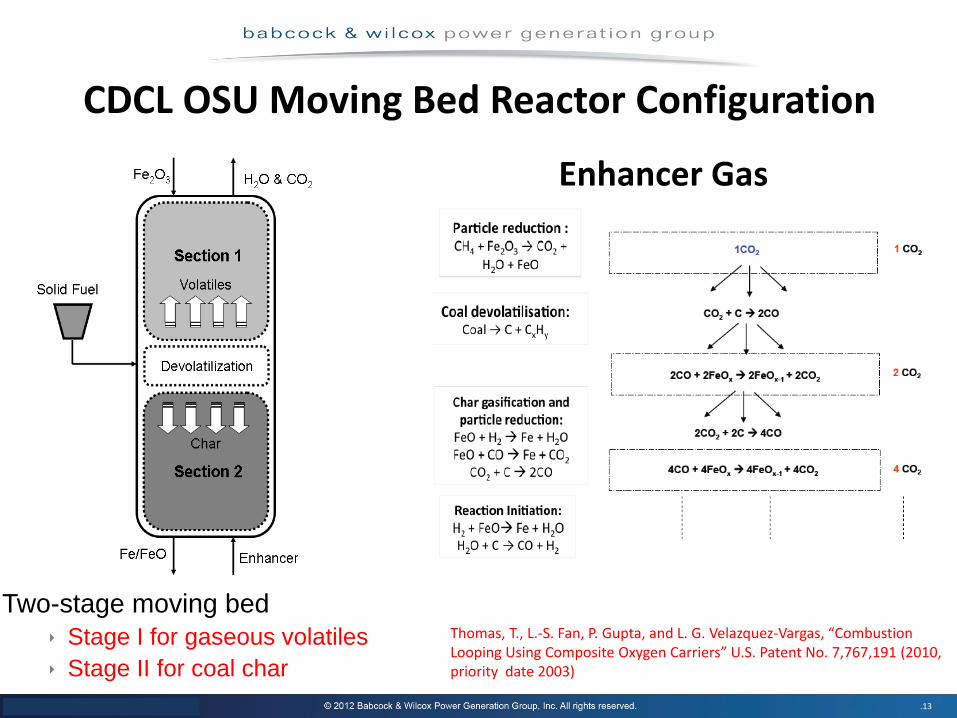
CDCL OSU Moving Bed Reactor Configuration
Enhancer Gas
Two-stage moving bedStage I for gaseous volatilesStage II for coal char
Thomas, T., L.‐S. Fan, P. Gupta, and L. G. Velazquez‐Vargas, “Combustion Looping Using Composite Oxygen Carriers” U.S. Patent No. 7,767,191 (2010, priority date 2003)
.14
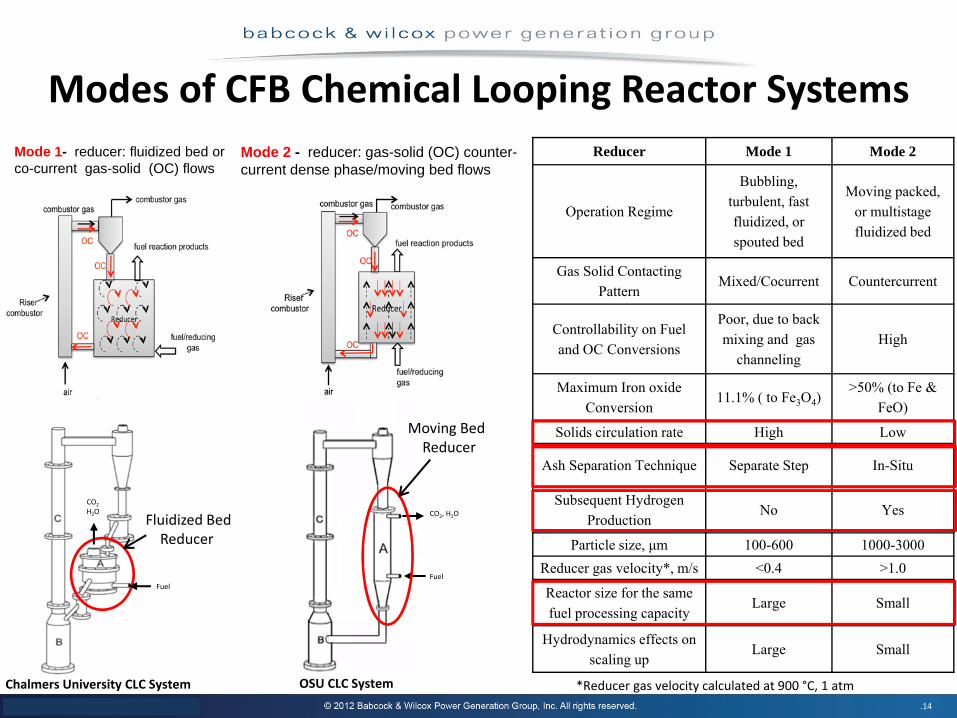
Modes of CFB Chemical Looping Reactor SystemsMode 1- reducer: fluidized bed or co-current gas-solid (OC) flows
Mode 2 - reducer: gas-solid (OC) counter-current dense phase/moving bed flows
OSU CLC SystemChalmers University CLC System
Fuel
CO2
H2O CO2, H2O
Moving Bed Reducer
Fuel
Reducer Mode 1 Mode 2
Operation Regime
Bubbling, turbulent, fast fluidized, or spouted bed
Moving packed, or multistage fluidized bed
Gas Solid Contacting Pattern
Mixed/Cocurrent Countercurrent
Controllability on Fuel and OC Conversions
Poor, due to back mixing and gas
channelingHigh
Maximum Iron oxide Conversion
11.1% ( to Fe3O4)>50% (to Fe &
FeO)
Solids circulation rate High Low
Ash Separation Technique Separate Step In-Situ
Subsequent Hydrogen Production
No Yes
Particle size, μm 100-600 1000-3000Reducer gas velocity*, m/s <0.4 >1.0
Reactor size for the same fuel processing capacity
Large Small
Hydrodynamics effects on scaling up
Large Small
Fluidized Bed Reducer
*Reducer gas velocity calculated at 900 °C, 1 atm
.15
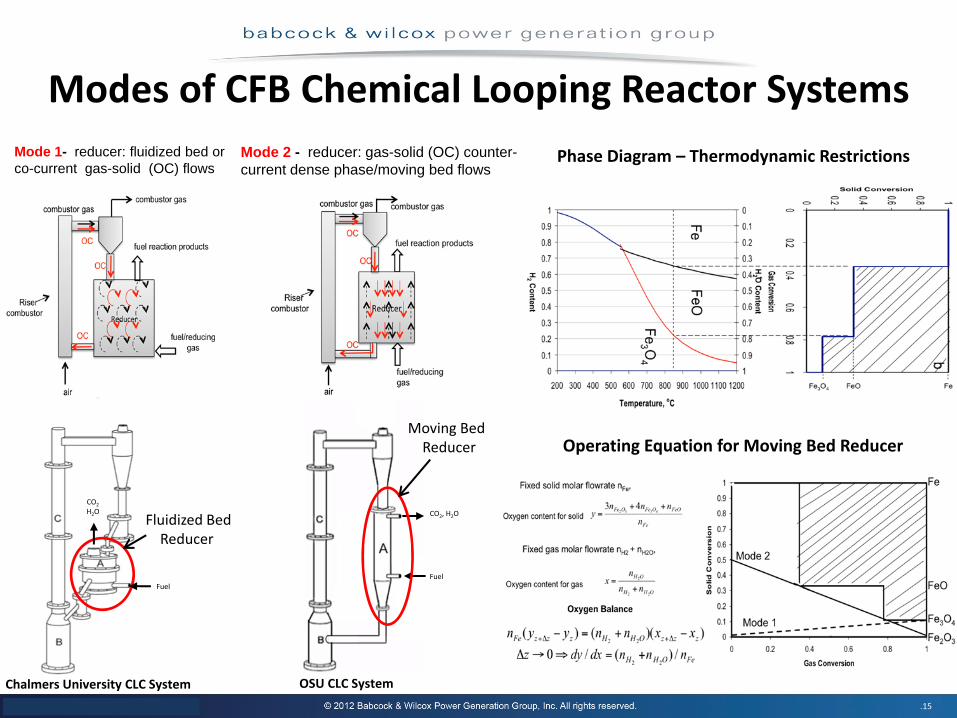
Modes of CFB Chemical Looping Reactor SystemsMode 1- reducer: fluidized bed or co-current gas-solid (OC) flows
Mode 2 - reducer: gas-solid (OC) counter-current dense phase/moving bed flows
OSU CLC SystemChalmers University CLC System
Fuel
CO2
H2O CO2, H2O
Moving Bed Reducer
Fuel
Fluidized Bed Reducer
Phase Diagram – Thermodynamic Restrictions
Operating Equation for Moving Bed Reducer
.16
.17
Outline
Introduction
Technology ReviewConceptBench and Sup-pilot Scale DemonstrationsTechno-economic analysis
Project Objectives
Phase I Activities and Budget
Phase II Activities and Budget
.18
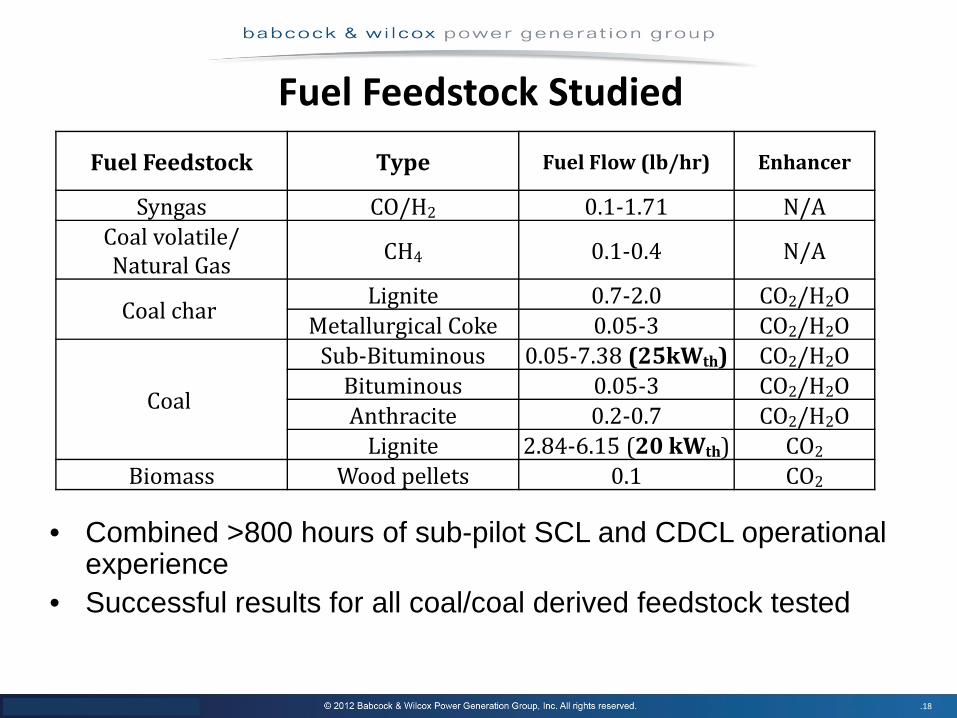
Fuel Feedstock Studied
Fuel Feedstock Type Fuel Flow (lb/hr)
0.1‐1.71
Enhancer
Syngas CO/H2 N/ACoal volatile/ CH 0.1‐0.4 N/ANatural Gas 4
Lignit .7‐2.0 CO /HCoal char eMetallurgical CokeSub‐Bituminous
00.05‐3
0.05‐7.38
2 2OCO2/H OCO /H2
Bituminous 0.05‐3
2
2 OCO2/H2Coal
(25kWth)O
/H2Anthracite .2‐0.7.84‐6.15
CO2 O) CLignit
ood pelletsO20 kWth
0.1 COBiomass We 2
0( 2
2
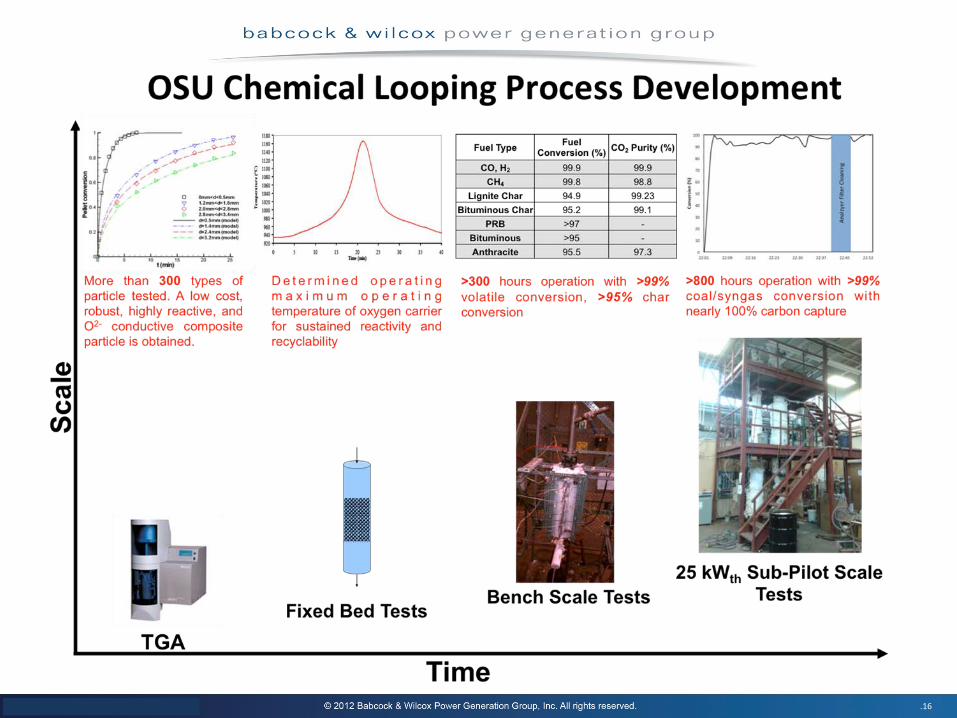
• Combined >800 hours of sub-pilot SCL and CDCL operational experience
• Successful results for all coal/coal derived feedstock tested
.19
25 kWth Sub‐Pilot Demonstration
• Fully assembled and operational• 500+ hours of operational experience• 200+ hours continuous successful operation• Smooth solid circulation • Confirmed non-mechanical gas sealing under
reactive conditions• 13 test campaigns completed
.20
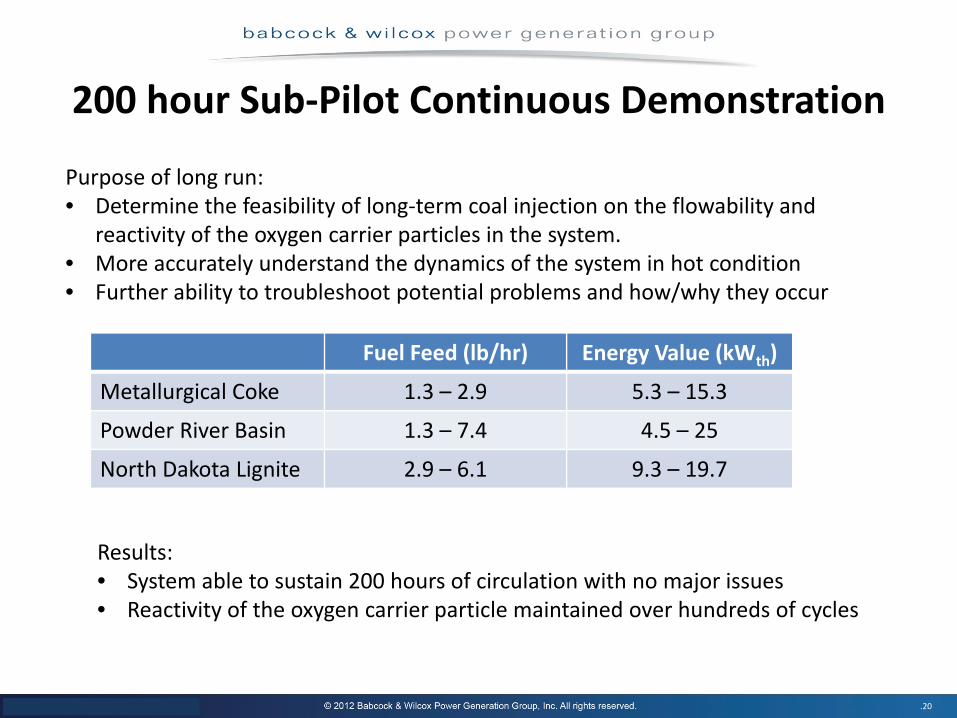
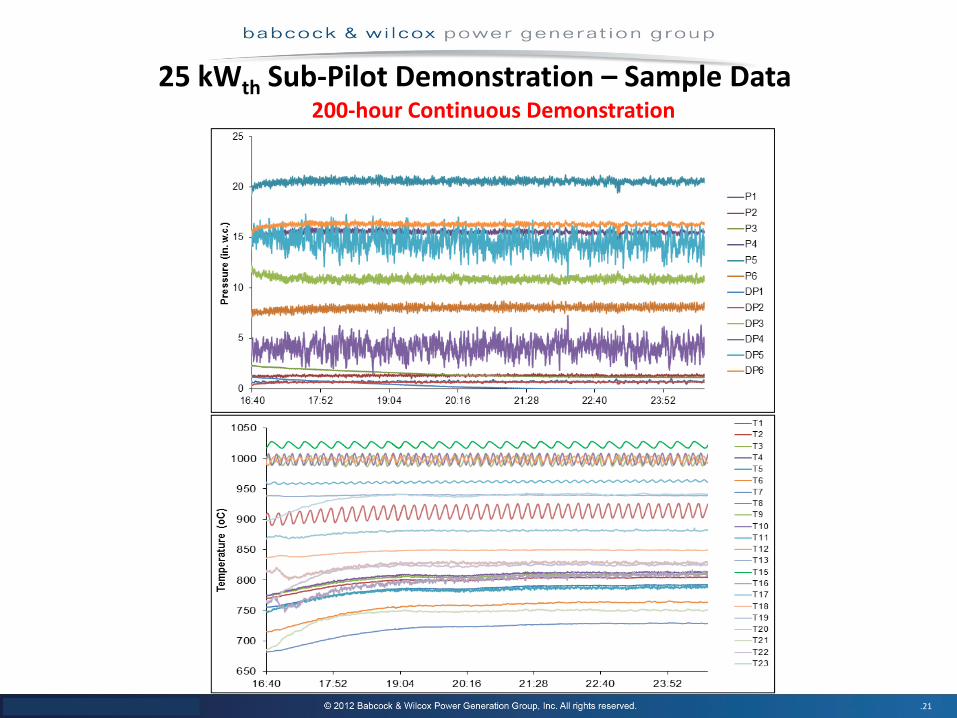
200 hour Sub‐Pilot Continuous Demonstration
Fuel Feed (lb/hr) Energy Value (kWth)
Metallurgical Coke 1.3 – 2.9 5.3 – 15.3
Powder River Basin 1.3 – 7.4 4.5 – 25
North Dakota Lignite 2.9 – 6.1 9.3 – 19.7
Purpose of long run: • Determine the feasibility of long‐term coal injection on the flowability and
reactivity of the oxygen carrier particles in the system.• More accurately understand the dynamics of the system in hot condition• Further ability to troubleshoot potential problems and how/why they occur
Results: • System able to sustain 200 hours of circulation with no major issues • Reactivity of the oxygen carrier particle maintained over hundreds of cycles
.21
25 kWth Sub‐Pilot Demonstration – Sample Data200‐hour Continuous Demonstration
.22
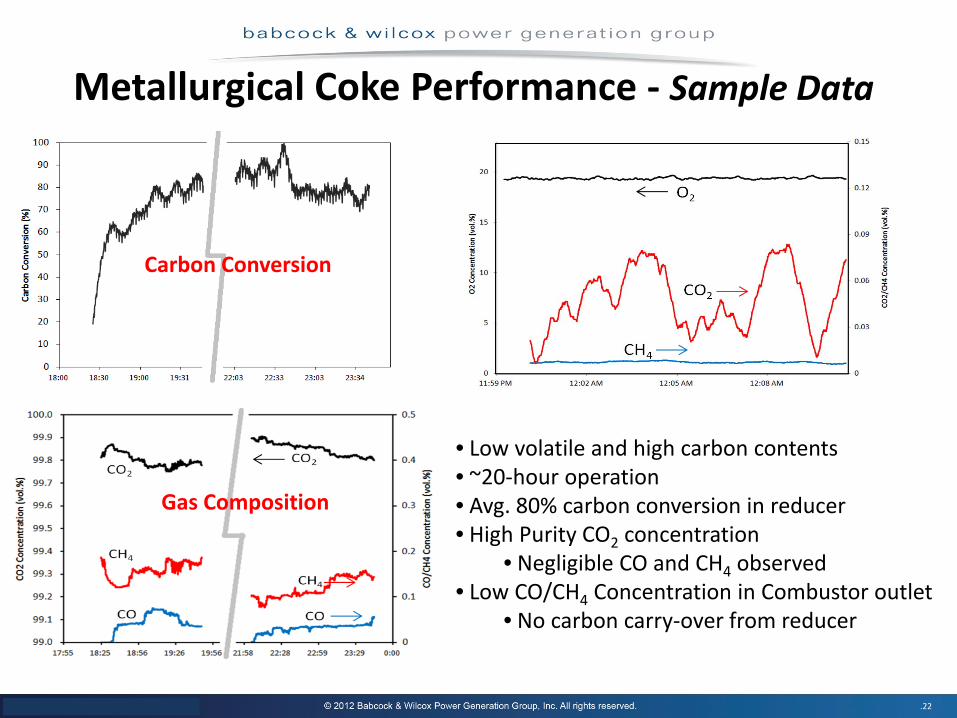
Metallurgical Coke Performance ‐ Sample Data
Carbon Conversion
Gas Composition
• Low volatile and high carbon contents• ~20‐hour operation• Avg. 80% carbon conversion in reducer• High Purity CO2 concentration
• Negligible CO and CH4 observed• Low CO/CH4 Concentration in Combustor outlet
• No carbon carry‐over from reducer
.23
0.0%
0.2%
0.4%
0.6%
0.8%
1.0%
90%91%92%93%94%95%96%97%98%99%
100%
0 20 40 60
Con
cent
ratio
n (%
) CO
, CH
4
Con
cent
ratio
n (%
) CO
2
Time (min)
CO2
CO
CH4
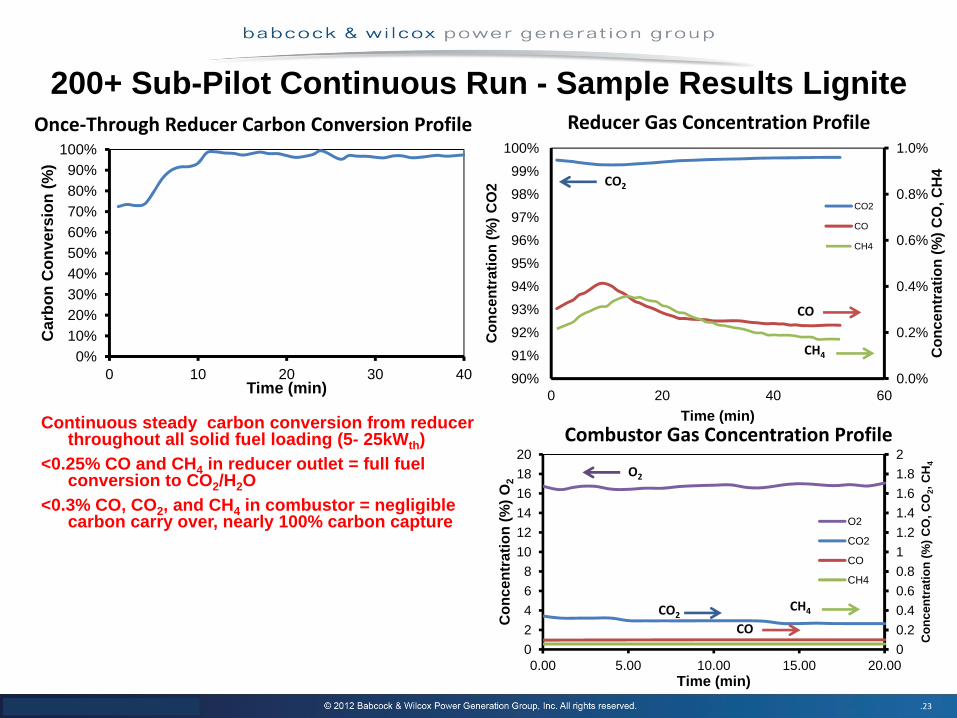
Once‐Through Reducer Carbon Conversion Profile Reducer Gas Concentration Profile
CH4
CO2
CO
Combustor Gas Concentration ProfileContinuous steady carbon conversion from reducer
throughout all solid fuel loading (5- 25kWth)<0.25% CO and CH4 in reducer outlet = full fuel
conversion to CO2/H2O<0.3% CO, CO2, and CH4 in combustor = negligible
carbon carry over, nearly 100% carbon capture
200+ Sub-Pilot Continuous Run - Sample Results Lignite
0%10%20%30%40%50%60%70%80%90%
100%
0 10 20 30 40
Car
bon
Con
vers
ion
(%)
Time (min)
00.20.40.60.811.21.41.61.82
02468
101214161820
0.00 5.00 10.00 15.00 20.00
Con
cent
ratio
n (%
) CO
, CO
2, C
H4
Con
cent
ratio
n (%
) O2
Time (min)
O2
CO2
CO
CH4
CH4
COCO2
O2
.24
Outline
Introduction
Technology ReviewConceptBench and Sup-pilot Scale DemonstrationsTechno-economic analysis
Project Objectives
Phase I Activities and Budget
Phase II Activities and Budget
.25
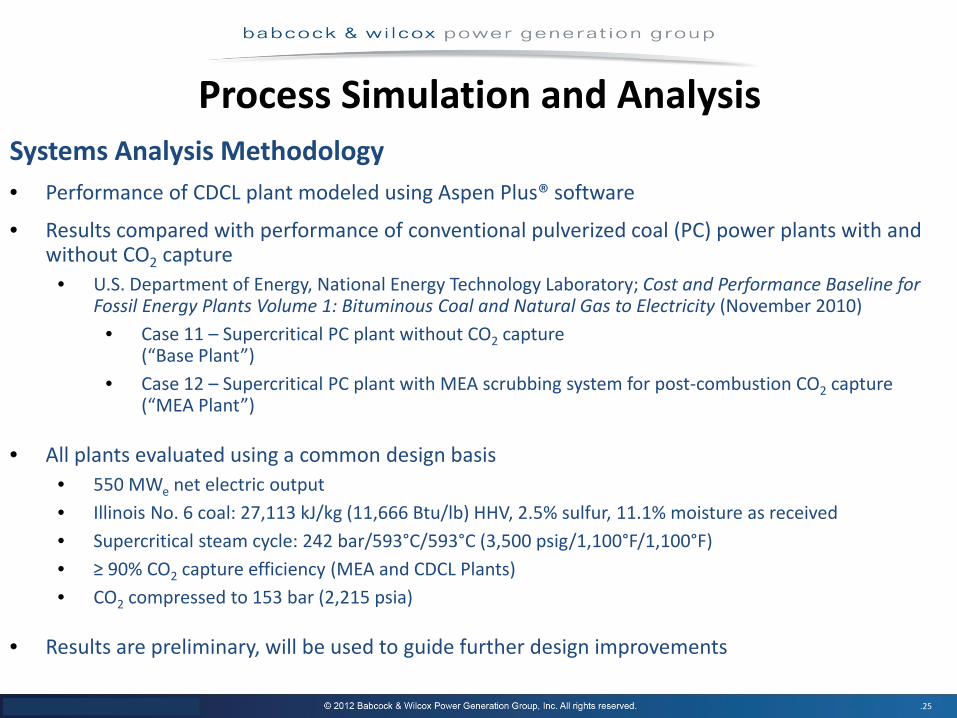
Process Simulation and AnalysisSystems Analysis Methodology• Performance of CDCL plant modeled using Aspen Plus® software
• Results compared with performance of conventional pulverized coal (PC) power plants with and without CO2 capture
• U.S. Department of Energy, National Energy Technology Laboratory; Cost and Performance Baseline for Fossil Energy Plants Volume 1: Bituminous Coal and Natural Gas to Electricity (November 2010)
• Case 11 – Supercritical PC plant without CO2 capture(“Base Plant”)
• Case 12 – Supercritical PC plant with MEA scrubbing system for post‐combustion CO2 capture (“MEA Plant”)
• All plants evaluated using a common design basis• 550 MWe net electric output• Illinois No. 6 coal: 27,113 kJ/kg (11,666 Btu/lb) HHV, 2.5% sulfur, 11.1% moisture as received• Supercritical steam cycle: 242 bar/593°C/593°C (3,500 psig/1,100°F/1,100°F)• ≥ 90% CO2 capture efficiency (MEA and CDCL Plants)• CO2 compressed to 153 bar (2,215 psia)
• Results are preliminary, will be used to guide further design improvements
.26
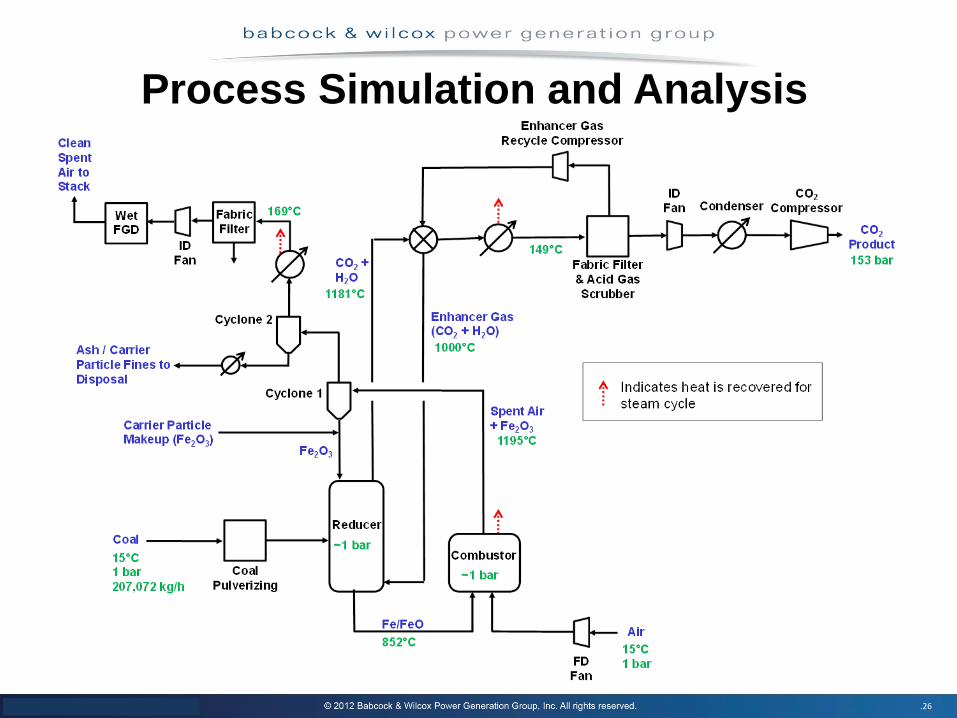
Process Simulation and Analysis
.27
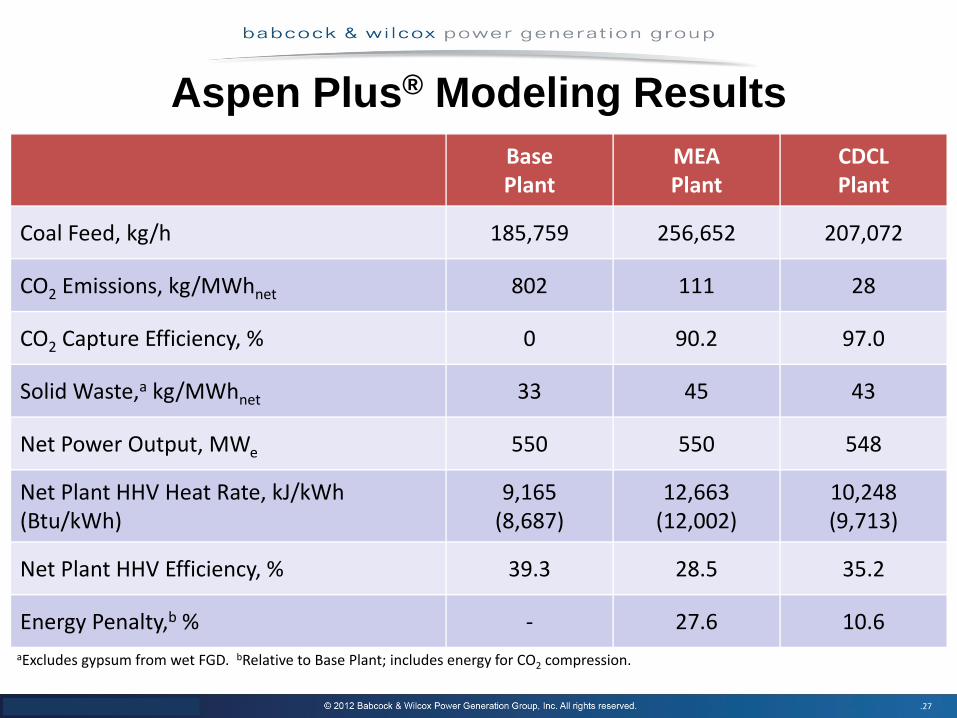
Aspen Plus® Modeling Results
aExcludes gypsum from wet FGD. bRelative to Base Plant; includes energy for CO2 compression.
BasePlant
MEAPlant
CDCLPlant
Coal Feed, kg/h 185,759 256,652 207,072
CO2 Emissions, kg/MWhnet 802 111 28
CO2 Capture Efficiency, % 0 90.2 97.0
Solid Waste,a kg/MWhnet 33 45 43
Net Power Output, MWe 550 550 548
Net Plant HHV Heat Rate, kJ/kWh (Btu/kWh)
9,165(8,687)
12,663(12,002)
10,248(9,713)
Net Plant HHV Efficiency, % 39.3 28.5 35.2
Energy Penalty,b % ‐ 27.6 10.6
.28
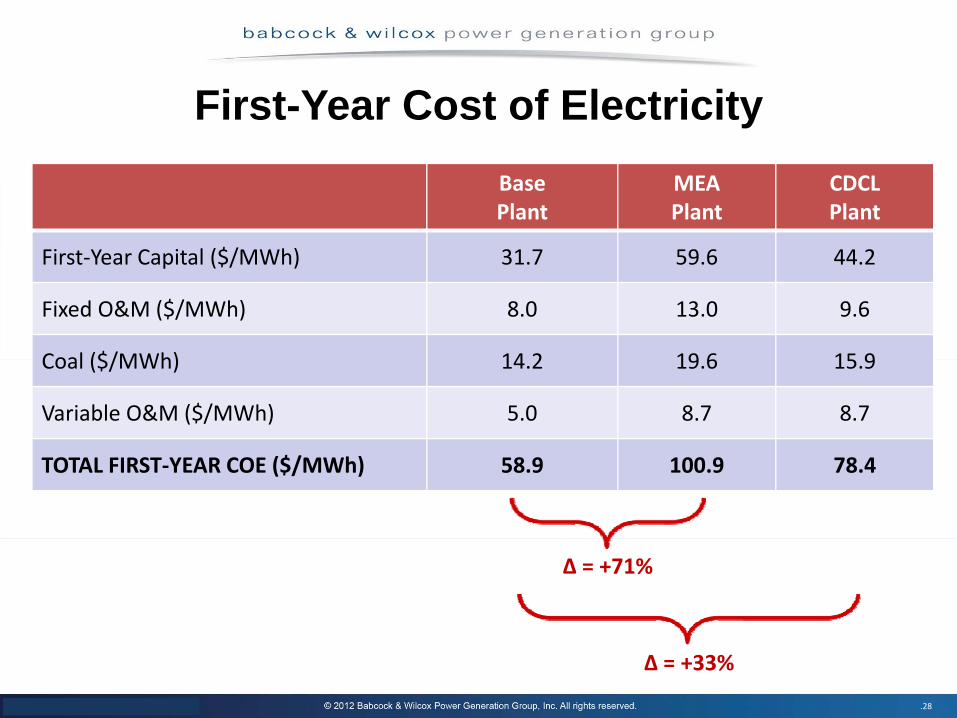
First-Year Cost of ElectricityBasePlant
MEAPlant
CDCLPlant
First‐Year Capital ($/MWh) 31.7 59.6 44.2
Fixed O&M ($/MWh) 8.0 13.0 9.6
Coal ($/MWh) 14.2 19.6 15.9
Variable O&M ($/MWh) 5.0 8.7 8.7
TOTAL FIRST‐YEAR COE ($/MWh) 58.9 100.9 78.4
∆ = +71%
∆ = +33%
.29
Outline
Introduction
Technology Review
Project Objectives
Phase I Activities and Budget
Phase II Activities and Budget
.30
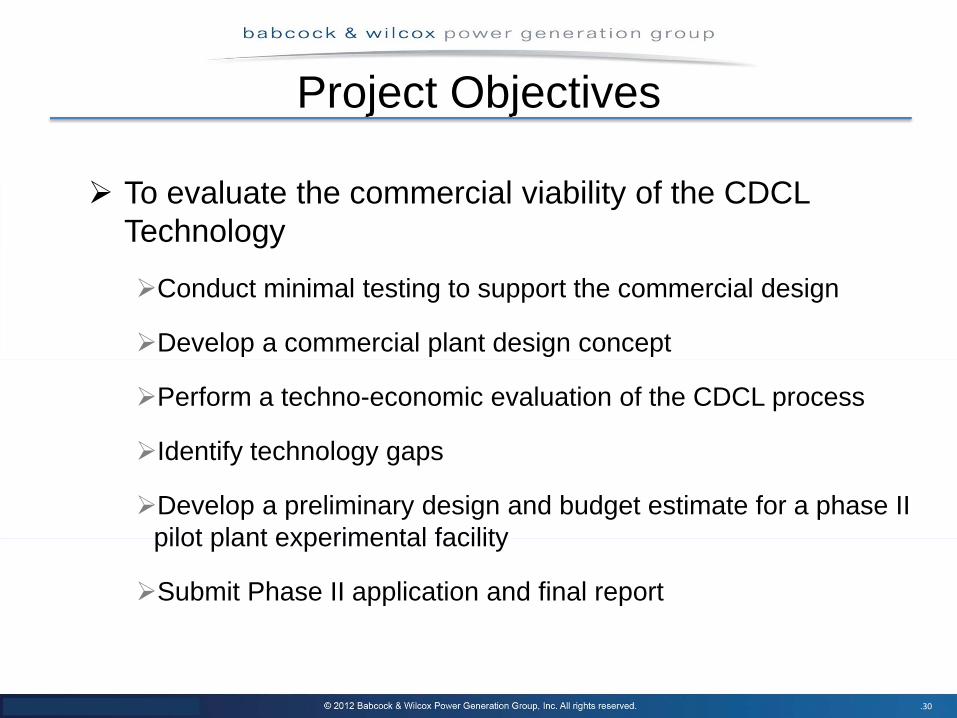
Project Objectives
To evaluate the commercial viability of the CDCLTechnology
Conduct minimal testing to support the commercial design
Develop a commercial plant design concept
Perform a techno-economic evaluation of the CDCL process
Identify technology gaps
Develop a preliminary design and budget estimate for a phase II pilot plant experimental facility
Submit Phase II application and final report
.31
Outline
Introduction
Technology Review
Project Objectives
Phase I Activities and Budget
Phase II Activities and Budget
.32
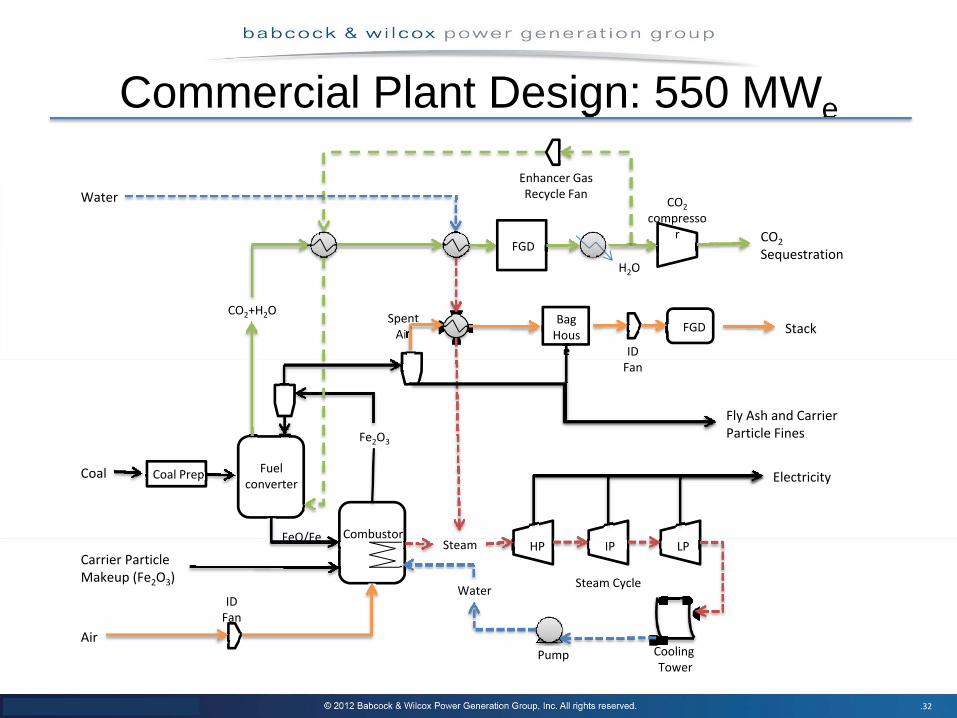
Fuel converter
Combustor
Pump
Coal Prep.Coal
CO2
compressor
Bag House
FGD Stack
CO2
Sequestration
LPIPHP
Air
Fe2O3
Cooling Tower
ID Fan
Water
ID Fan
H2O
CO2+H2O
Enhancer Gas Recycle Fan
Electricity
Carrier Particle Makeup (Fe2O3)
Fly Ash and Carrier Particle Fines
FGD
Spent Air
Steam
WaterSteam Cycle
FeO/Fe
Commercial Plant Design: 550 MWe
.33
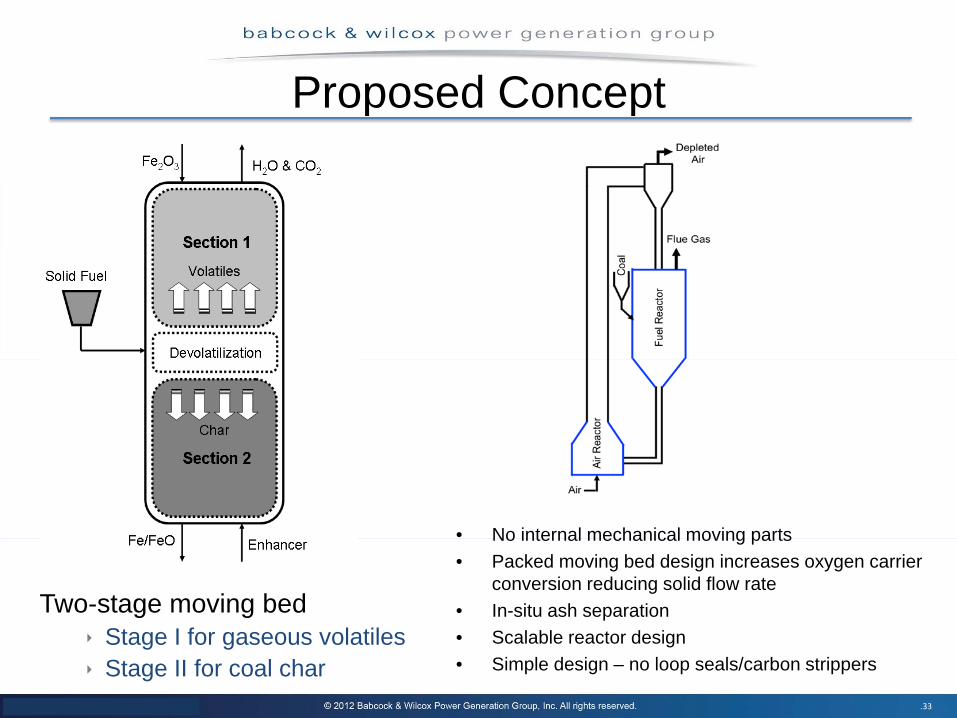
Proposed Concept
Two-stage moving bedStage I for gaseous volatilesStage II for coal char
• No internal mechanical moving parts• Packed moving bed design increases oxygen carrier
conversion reducing solid flow rate• In-situ ash separation• Scalable reactor design• Simple design – no loop seals/carbon strippers
.34
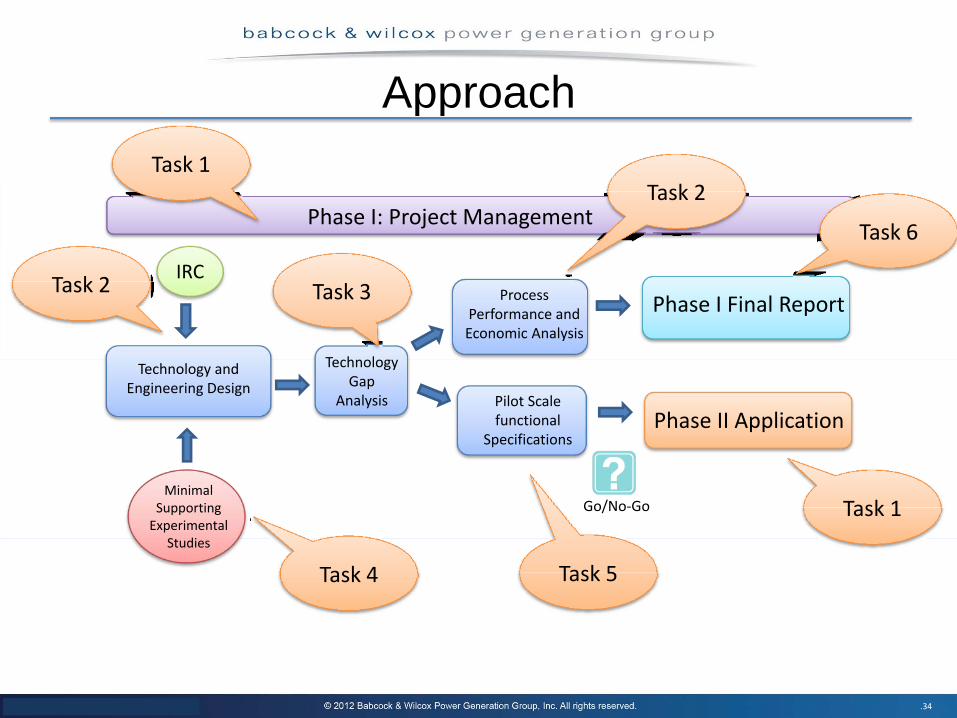
Minimal Supporting Experimental
Studies
Technology and Engineering Design
Technology Gap
Analysis
Phase I: Project Management
Pilot Scale functional
SpecificationsPhase II Application
Process Performance and Economic Analysis
Phase I Final ReportIRC
Go/No‐Go
Task 1
Task 2
Task 4
Task 3
Task 5
Task 2
Task 6
Task 1
Approach
.35
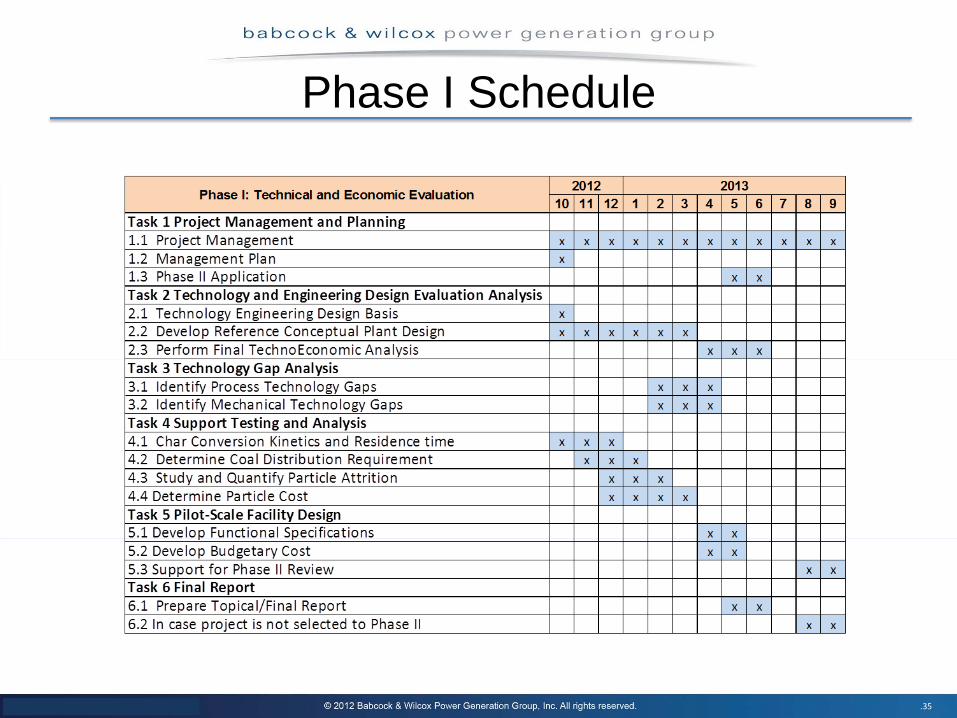
Phase I Schedule
.36
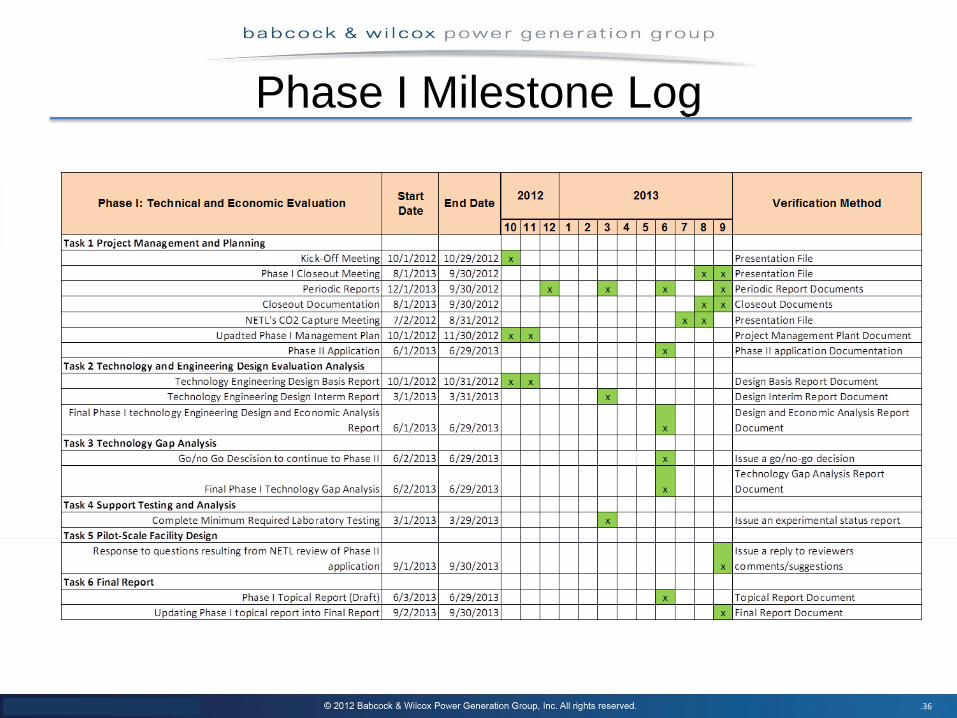
Phase I Milestone Log
.37
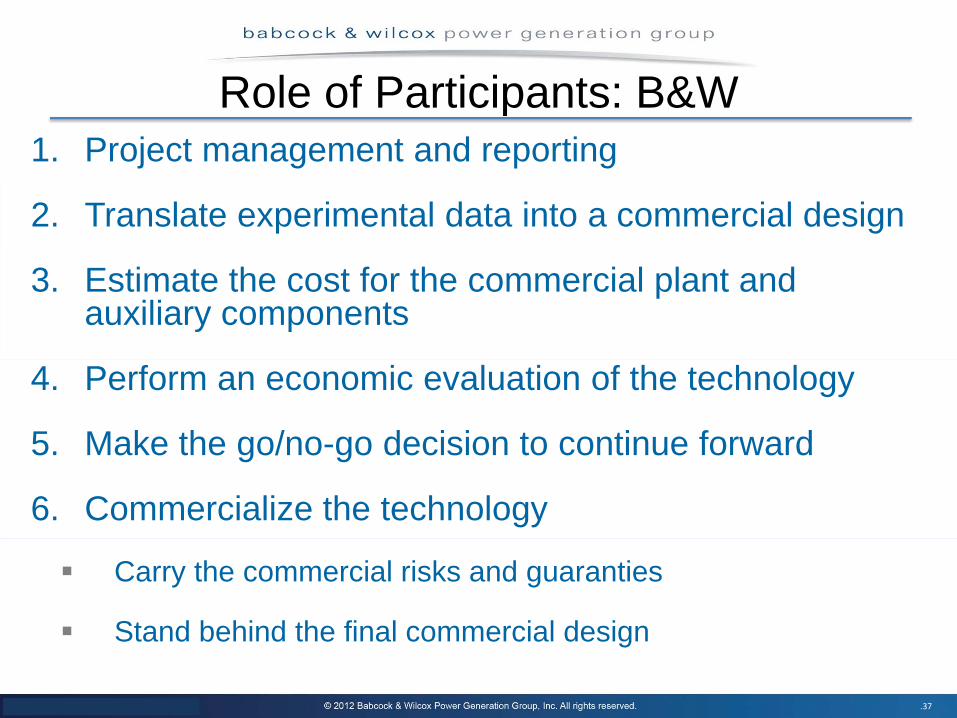
1. Project management and reporting
2. Translate experimental data into a commercial design
3. Estimate the cost for the commercial plant and auxiliary components
4. Perform an economic evaluation of the technology
5. Make the go/no-go decision to continue forward
6. Commercialize the technology
Carry the commercial risks and guaranties
Stand behind the final commercial design
Role of Participants: B&W
.38
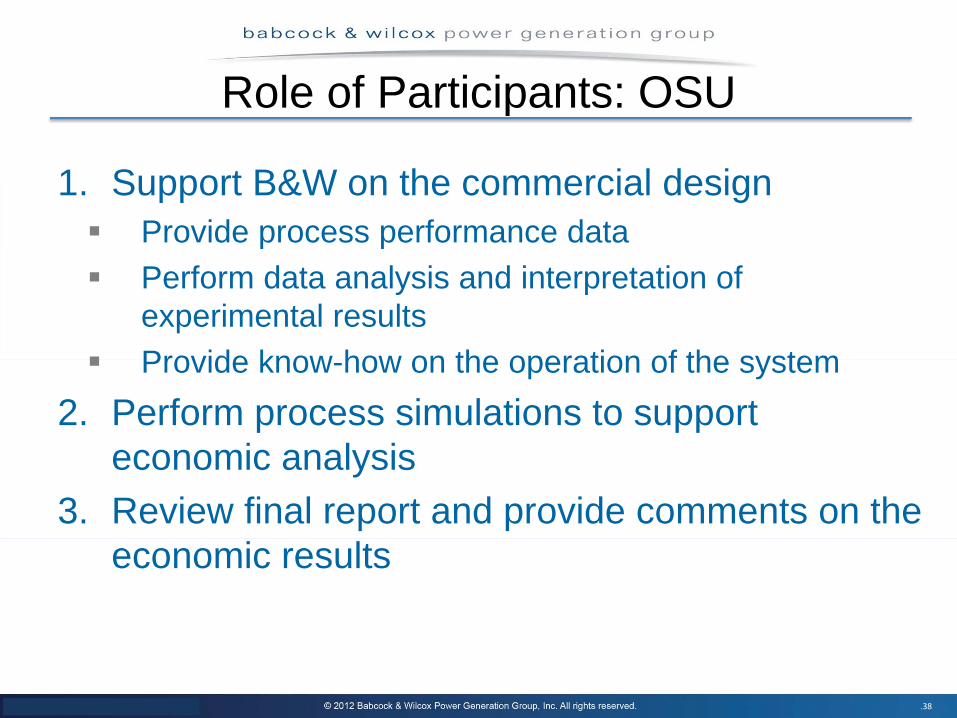
1. Support B&W on the commercial designProvide process performance dataPerform data analysis and interpretation of experimental resultsProvide know-how on the operation of the system
2. Perform process simulations to support economic analysis
3. Review final report and provide comments on the economic results
Role of Participants: OSU
.39
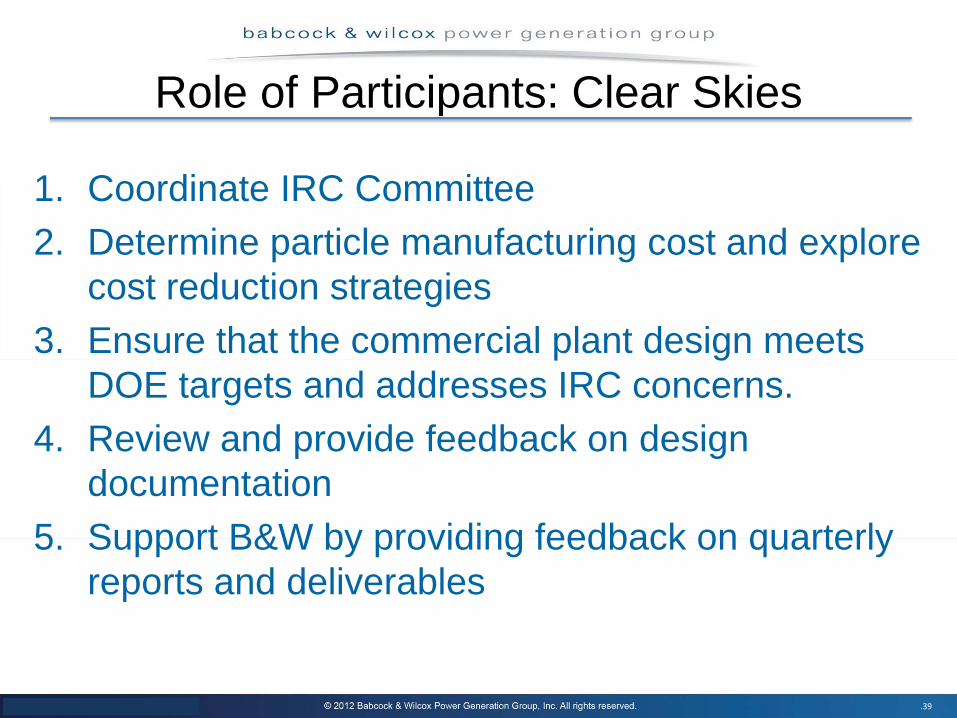
1. Coordinate IRC Committee2. Determine particle manufacturing cost and explore
cost reduction strategies3. Ensure that the commercial plant design meets
DOE targets and addresses IRC concerns.4. Review and provide feedback on design
documentation5. Support B&W by providing feedback on quarterly
reports and deliverables
Role of Participants: Clear Skies
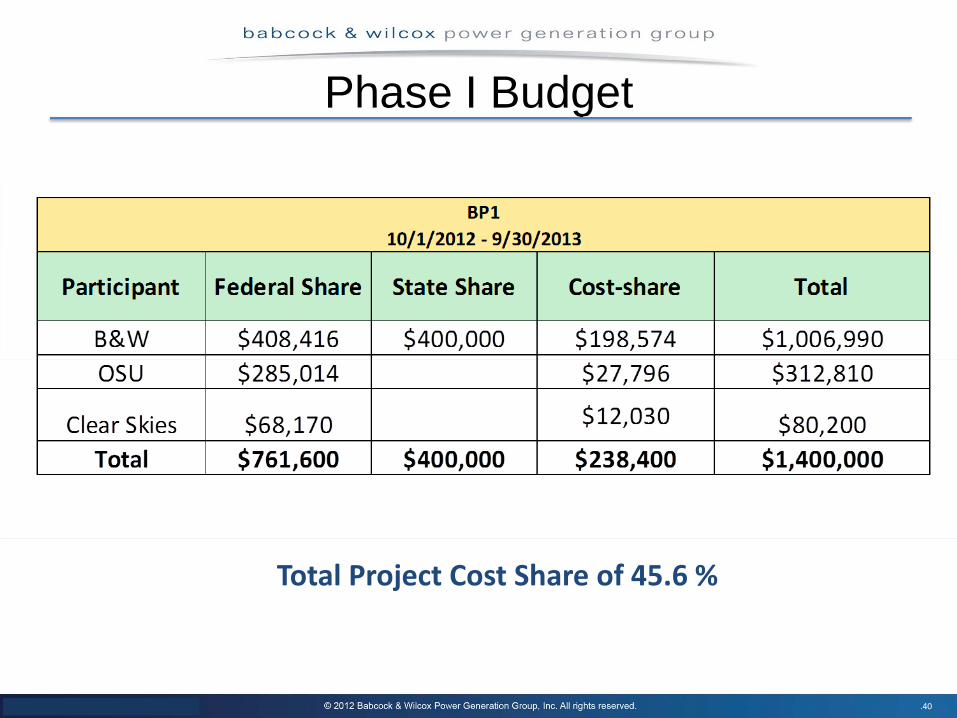
.40
Total Project Cost Share of 45.6 %
Phase I Budget
.41
Thank you
This material is based upon work supported by the Department of Energy under Award Number DE‐FE0009761 and DE‐NT0005289