Embed Size (px)
Citation preview

By: SKatrina
Shital C. Shaha Brink, Rebe
h, Coalition foecca London,
Youth and
J.P
A stwho
or CommunityShelly Masurd Their Comm
P. Mo
CommEval
tarter guidwant to uimprove t
y Schools at tr, and Gisell Qmunities at St
rgan C
munituation
200
de for comuse data ttheir com
the Institute foQuihuis at thetanford Unive
Chase
y Schon Tool9
mmunity sto tell themmunity sc
or Educationae John W. Garersity.
ools lkit
school stair story achools.
al Leadershiprdner Center
aff nd
p; for

www.communityschools.org www.iel.org
1
Community Schools Evaluation Toolkit
A starter guide for community school staff who want to use data to tell their story and improve their community schools.
Preface Community schools face a unique opportunity at the local, state, and federal levels. For decades national support has been growing and there is an increasing recognition of the need to address the multiple challenges involved in attaining greater student success. In this context, community schools are poised to make a major leap forward in the coming years. U.S. Secretary of Education Arne Duncan, a long‐time advocate of community schools, recently declared community schools as “not in conflict” with other reforms such as effective teachers and school leaders, and standards and quality assessments; rather they are “central to education reform”. Secretary Duncan stresses that schools should be open longer – not just 6 hours a day, 5 days a week. “When children and families learn together great things happen for the community. We have to move with a huge sense of urgency.” To meet Secretary Duncan’s charge, and move community schools forward, we need more and better data about community schools’ impact on student success (e.g., higher graduation rates, reduced dropouts rates more postsecondary participation) ‐‐ as well as intermediate indicators that lead to that success. Community schools must collect, analyze, and use data to convince policymakers to create stronger policies in support of community schools. We know that community schools DO work; we must now make a stronger case using data. This Evaluation Toolkit is intended to help with that data collection and analysis. It is driven by a results framework, and offers a step‐by‐step explanation of evaluation approach and a menu of data collection instruments. Additionally, examples from local evaluations are included. As always the Coalition invites your comments and feedback as we seek to develop tools that support the growth and development of community schools across the nation.
Martin J. Blank President, Institute for Educational Leadership Director, Coalition for Community Schools

www.communityschools.org www.iel.org
2
About the Creators The Coalition for Community Schools (CCS) at the Institute for Educational Leadership is an alliance of national, state and local organizations in education K‐16, youth development, community planning and development, family support, health and human services, government and philanthropy as well as national, state, and local community school networks. CCS advocates for community schools as the vehicle for strengthening schools, families, and communities so that together they can improve student learning. The John W. Gardner Center for Youth and Their Communities at Stanford University (JGC) partners with communities to research, develop, and disseminate effective practices and models for developing well ‐rounded young people. By bringing together community leaders and sharing new knowledge, JGC supports them in implementing quality programs for and with their young people. As such, they are better equipped to improve and continually renew their communities. JGC works closely with schools across the Bay Area implementing a community school approach to achieve community‐wide goals. Acknowledgements CCS is grateful for the generous support of The J.P. Morgan Chase Foundation for the production of this tool‐kit. Mark E. Rigdon, our Program Officer, has been consistently helpful and supportive of this effort and the broader work of CCS. In addition to the work of CCS and JGC, this work would not have been possible without the expertise, guidance and support of the following individuals and organizations. For a complete list of the individuals involved See Appendix A.
• CCS Evaluation Advisory Team – Comprised of evaluators and funders, this group convened three times during the creation of the toolkit to offer resources and feedback on the content of the toolkit. In addition, several members of this group provided guidance around specific areas of expertise. You will notice citations of surveys and research contributed by these experts throughout the toolkit.
• San Mateo County Community Schools Focus Group – For over six years JGC has collaborated with local community schools to deepen and expand an integrated and comprehensive service model. JGC has worked most closely with four schools in Redwood City School District and Cunha Middle School in Half Moon Bay. In April 2009, JGC facilitated a focus group to seek the expertise of local leaders in this work and to incorporate lessons learned from their experience into the toolkit.
www.communityschools.org www.iel.org
3
Table of Contents Preface………………………………………………………………………………. 1 About Creators …………………………………………………………………… 2 Introduction Overview ...................................................................................... 4 About Community Schools .............................................................. 5 Part 1- Before you Start: Begin with the End in Mind Step 1: The Community Schools Logic Model ..................................... 7
Table A – Logic Model…...7 Table B - Results and Corresponding Indicators…10
Step 2: Have what you need to conduct a successful evaluation. ......... 13
Part 2- Get Ready: Prepare to Evaluate Step 3: Know what you want to evaluate. ....................................... 15
Table C - Common Language….14 Table D- SMART – Tips for Choosing Results… 16
Step 4: Align your evaluation to the Community Schools Logic Model. 18 Part 3- Get Set: Designing the Evaluation Step 5: Develop the questions you want to answer in your evaluation. 21 Step 6: Decide what data to collect. ............................................... 23
Table E - Recommended Results, Indicators, and Data Collection Strategies for Students, Families, Schools, and Communities….25
Part 4- Go!: The Evaluation Process Step 7: Collect data. .................................................................... 30 Step 8: Making sense of your data. ........................................... 34 Step 9: Use your findings. ............................................................ 35 Appendices: Appendix A – List of Evaluation Advisory Team (page 38) Appendix B - Data Collection Surveys (page 39) Appendix C – Community School Funding Sources: Data Collection Matrix (page 40)

www.communityschools.org www.iel.org
4
INTRODUCTION Overview Welcome to the Community School Evaluation Toolkit. This toolkit is designed to help community schools evaluate their efforts so that they learn from their successes, identify current challenges, and plan future efforts. It provides a step‐by‐step process for planning and conducting an evaluation at your community school site(s). The toolkit is a practical, hands‐on guide that makes it possible for you to improve your community school’s effectiveness and to tell your story. Equally important, it offers a menu of data collection tools (i.e. surveys, public databases) for evaluating whether and how your school is achieving results. You can find these tools on line at: http://www.communityschools.org/resources/community_schools_evaluation_toolkit.aspx. For whom is the toolkit written? This toolkit is for community school leaders, i.e., superintendents, local government leaders, foundations, United Ways, principals, site coordinators, curriculum planners, community‐based organizations, higher‐education institutions, and others. Anyone connected to a community school can facilitate the evaluation process. A background in research or evaluation is not required to use this toolkit effectively. The toolkit highlights strategies for an individual community school but they can also be used for initiatives with multiple community school sites. What is the purpose of the Toolkit? This toolkit is designed to help you learn more about planning and conducting an evaluation of your community school or community school initiative. For the purposes of this toolkit, evaluation is defined as an assessment of the performance and consequences of the strategies implemented at a community school or an initiative. The toolkit is designed to help you:
1. Use existing data sources and collect additional data (if needed) to conduct a low cost evaluation.
2. Identify areas of success and areas in need of improvement in your community school.
3. Gather information that can help you make planning decisions about your evaluation.
4. Facilitate community schools planning to lay a foundation for evaluation. The CCS Logic Model (see page 8) provides the basis for such planning.
5. Assess the extent to which you are leveraging resources.

www.communityschools.org www.iel.org
5
More CCS Resources: National Models‐ Community Schools Across the Nation Community Schools Research Brief Making the Difference Raising Graduation and College Going Rates: Community High Schools Is Your School a Community School? www.communityschools.org
About Community Schools What is a community school? The Coalition for Community Schools (CCS) defines a community school as both a place and a set of partnerships between the school and other community resources (See chart below). Its integrated focus on academics, health and social services, youth and community development, and community engagement leads to improved student learning, stronger families, and healthier communities. Schools become centers of the community and are open to everyone – all day, every day, evenings, and weekends. Using public schools as hubs, community schools bring together many stakeholders to offer a range of supports and opportunities to children, youth, families, and communities to achieve results. Community schools are built around a Logic Model (LM), as described in the next section. Community schools are responsive to the unique conditions and circumstances facing their students, families, school, and community. Their design is based on the following principles:
• Communities and schools are fundamentally and positively interconnected. • Schools can make a difference in the lives of all children. • Children do better when their families do better. • The development of the whole child is a critical factor for student success. • Community schools initiatives blend funding streams and partnerships to build
on existing efforts.

www.communityschools.org www.iel.org
6
Part 1- Before you Start: Begin with the End in Mind Step 1: The Community Schools Logic Model (LM) The design principles suggest that community schools be built to achieve results for students, families, and the community. These results should be developed around a Logic Model (LM). CCS created the LM (page 8) to help guide community school efforts around improving student learning and development and strengthening families and communities. By focusing their work around results, community schools can position themselves to identify partnerships, secure funding, and achieve selected results. The toolkit is organized around the LM to provide community schools nationwide with common language for assessment. Using a “Results Based Accountability (RBA)” process, the specific results that community schools seek – both in terms of how they function and in relationship to the well being of students, families, and communities – were determined. Mark Friedman defines RBA as:
…a disciplined way of thinking and taking action that can be used to improve the quality of life in communities, cities, counties, states, and nations…it can also be used to improve the performance of programs, agencies, and service systems.1
We are continuously learning at CCS. Therefore, the LM builds on CCS’ results framework2. The Community Schools LM illustrates the intended results and activities linked to them. It demonstrates how your results are expected to drive the decisions about which inputs and programs will make up your community school strategy. For example, if your school or initiative finds that family involvement is lower than you want it to be, a result you may consider is “Families are increasingly involved in their child’s education.” (See LM, page 8.) Ask yourself: “Are we providing enough and appropriate opportunities for families to be engaged?” Addressing questions such as these leads to both short and long‐term results which, in turn, support community school’s intended impact—students who graduate ready for college, careers, and citizenship. Using a community school strategy, develop the inputs and activities that you expect will help you achieve your results and support the community school’s intended impact—students graduating ready for college, careers, and citizenship. It is important to note that there is reciprocity between What Can Happen at a Community School and the Outputs. This is depicted by the two way arrows in the LM.
1 See http://www.communitypartnerships.info/rba.htm for an elaboration of Friedman’s Results Based Accountability model. Also visit: http://www.raguide.org/ 2 Coalition for Community Schools. 2007. Community Schools-Promoting Student Success: A Rationale Results Framework. http://communityschooleat.pbworks.com/f/CCS_rationale_and_results_framework.pdf

www.communityschools.org www.iel.org
7
Utilizing this LM will help you determine which results are important for your students, families, and communities.

www.communityschools.org www.iel.org
8
Your Planned Work Your Intended Results
Impact
Students graduate ready for college, careers, and citizenship
Table A. Community Schools Logic Model
Long‐term Results (distal)
Students succeed academically
Students are healthy: physically, socially and emotionally
Communities are desirable places to live
Students live & learn in a safe, supportive, and stable environment
What Can Happen at a Community
Schools?
Family engagement (e.g. adult education)
Extended Learning Opportunities/Youth Development
Professional development (school staff and community)
Social and Emotional Learning
Linkages between schools and partners
Health, mental health, and social services; family support
Early Childhood Development
Inputs
Support from schools and community
Sufficient staff (expertise + availability)
Sufficient resources (e.g., funding, facilities)
Available/relevant partners
Leadership & Initiative level infrastructure
Community School Coordinator
Outputs
Supported Families
Comprehensive learning supports
Integrated academic enrichment and social services to support children’s intellectual, social, emotional, and physical development
High quality, engaging, instructional programs
Partner integration into school day
Short‐term Results
(proximal)
Children are ready to enter school
Students attend school consistently
Students are actively involved in learning and their community
Families are increasingly involved in their children’s education
Schools are engaged with families and communities

www.communityschools.org www.iel.org
9
Community schools recognize that many factors influence the education of our children and that various conditions need to be in place to produce positive results. This is why they work with partners to mobilize the assets of the school and the entire community to improve educational, health, social, family, economic, and related results.
Community schools move through stages of development. For example, a community school in its first year could have one or two activities (i.e. What Can Happen at Community Schools – see LM). These community schools are just getting started and aiming to achieve short‐term results such as those highlighted in the LM. On the other hand, there are also schools further along in this developmental trajectory. This type of community school will have many more of the activities listed under the What Can Happen at a Community School column in the LM. If you fall into this category, you will want to look more carefully at the long‐term results designed to lead to community schools’ intended impact. The Children’s Aid Society’s Stages of Community School Development is a useful resource to assist you in locating your school’s development and is available at: http://www.communityschools.org/resources/community_school_evaluation_toolkit_resources.aspx. Because it links activities and consequences in a sequenced way, a LM helps you focus on program implementation—where did activities and consequences come about as intended, and where did they fall short? Where are links strong? As Table B (below) shows, for each result there are a number of ways to measure your success —in the toolkit these are called indicators. There are several indicators for each result that provide a way to measure whether the community school is progressing in meeting the results they have chosen. These indicators were identified from evaluations of community schools and reflect the research literature on best practices for youth development and community schools. Access the research on indicators here, by clicking on each result area: http://www.communityschools.org/results/default.aspx.

www.communityschools.org www.iel.org
10
Table B: Results and Corresponding Indicators
3 Schorr, Lisbeth B. and Vicky Marchand. Pathway to Children Ready for School and Succeeding at Third Grade. Pathways Mapping Initiative, 2007. http://www.cssp.org/uploadFiles/3RD%20GRADE%20PATHWAY%20PDF%209‐07.pdf 4 Ibid. 5 Ibid.
RESULTS INDICATORS THAT ALIGN WITH EACH RESULT
SHORT‐TERM RESULTS
Children are ready to enter school
Immunizations More children with health insurance3 Children in expected height and weight range for their age4 Availability of early childhood education programs Attendance at early childhood education programs Parents read to children5 Vision, hearing, and dental status
Students attend school consistently
Daily attendance Early chronic absenteeism Tardiness Truancy
Students are actively involved in learning and their community
Students feel they belong in school Availability of in‐school and after‐school programs Students feel competent Schools are open to community Attendance at before and after‐school programs Partnerships for service learning in the school/community Post‐secondary plans
Schools are engaged with families and community
Trust between faculty and families Teacher attendance and turnover Faculty believe they are an effective and competent team Community‐school partnerships
Families are actively involved in their children’s education
Families support students’ education at home Family attendance at school‐wide events and parent‐teacher conferences Family experiences with school‐wide events and classes Family participation in school decision‐making

www.communityschools.org www.iel.org
11
Review the original Rationale Results Framework from the Coalition for Community Schools here: http://www.communityschools.org/resources/community_school_evaluation_toolkit_resources.aspx.
RESULTS INDICATORS THAT ALIGN WITH EACH RESULT
LONG‐TERM RESULTS
Students succeed academically
Standardized test scores Teachers support students Grades Teachers take positive approach to learning and teaching Graduation rates Dropout rates Reading by 3rd grade
Students are healthy: physically, socially and emotionally
Asthma control Vision, hearing, and dental status Physical fitness Nutritional habits Positive adult relationships Positive peer relationships
Students live and learn in stable and supportive environments
Students, staff, and families feel safe Schools are clean Families provide basic needs Incidents of bullying Reports of violence or weapons
Communities are desirable places to live
Employment and employability of residents and families served by the school Student and families with health insurance Community mobility and stability Juvenile Crime

www.communityschools.org www.iel.org
12
Organizing and Conducting Your Evaluation The three following sections will take you through the evaluation process, based on the LM (page 8), step by step: Get Ready helps you assess your readiness for evaluation. Get Set leads you through the evaluation planning process. Go teaches you how to collect and study your data.
Use your evaluation findings for results based planning
Findings and planning inform the next evaluation

www.communityschools.org www.iel.org
13
Step 2: Make sure you have what you need to conduct a successful evaluation. 2a. Consider your readiness. To conduct an effective evaluation at any scale you need to know what you are trying to evaluate. Before you start you need to know:
• Do you have the resources you need? Identify people who can help you collect or analyze data. Make sure that you and your partners have adequate time to devote to the evaluation. Determine if you have access to a secure computer both to store confidential data and to conduct data analysis.
• Have the school, community partners, and other stakeholders identified a shared set
of school and community results? The LM is comprehensive and your school may be focused on only one or two of the results. (E.g. Children enter school ready to learn; Students attend school consistently) If you and your stakeholders have not decided on a shared set of results, Steps 2 and 3 (discussed in later sections) can help you think about how to create these.
2b. Plan for success! Careful planning in the form of an evaluation work plan helps ensure that you have all the pieces in place. The following checklist includes pieces that need to be included in your evaluation work plan:
Key results from the Community Schools LM (page 8), and related indicators, are defined and aligned with existing programs. (See the Introduction, Steps 3 and 4).
Evaluation questions (see Step 5). Indicators and data sources (see Steps 6 and 7). A list of partners and their role in the evaluation process. Plans for sharing what you learn from the evaluation (see Step 8 and 9).
Exploring Higher Education PartnershipsCommunity schools should consider developing a partnership with a local university to enhance their evaluation efforts. Most universities have students studying research methods who may be interested in helping you for little or no cost. For example, Tulsa Area Community Schools Initiative (TASCI) has a strong partnership with the University of Oklahoma’s Jeannine Rainbolt College of Education. The university research team was able to collect and analyze data from the participating schools. As a result they have an evaluation of their community school initiative. The report will inform TASCI’s work around: fundraising, partnership building, stakeholder meetings, and improving their community schools.

www.communityschools.org www.iel.org
14
A detailed timeline for the first year. In addition to an overall evaluation timeline, creating a data collection timeline is also important. Frequency of data collection will also depend on the indicator you choose to focus your work. For example, if you decide to address the indicator “Early Chronic Absence,” you will need to decide if you are going to collect this data weekly or monthly.

www.communityschools.org www.iel.org
15
PART 2- GET SET: Prepare to Evaluate Step 3: Know what you want to evaluate. 3a. Identify your results and decide what activities will help you achieve them. You probably have results that your community school strives to achieve. You also have activities in place to reach these common results. Unless these elements are written down and explicit, it’s hard to plan an evaluation to determine whether or not you are achieving the desired results. To ensure that the data you collect will be relevant and useful, clearly document your current activities, results, and indicators for the next year.
Table C: Common Language
Inputs: Identifying your community school’s available inputs will help you determine the extent to which you able to implement activities and achieve your intended results. You should make a list of all of the inputs that you and your community school partners can bring to the table as well as others you will need to access over time.
Tool‐Kit Terms… Can Also Be Called…Input Program Investments, Resources (e.g. staff, capacity,
space, funds, etc.) Activities (i.e. What Can Happen at a Community School?)
Activity, processes, strategies, methods, action steps
Output
Deliverables, units of services, products
Result
Outcomes, goals
Indicator Benchmark, proxy measure
Consistency in Planning and Evaluation Language:This toolkit uses the terms: inputs, activities, results, indicators, and activities, and outputs. In other settings you may find these terms defined differently or other words used to talk about the same concepts. (See Table C) For example, Federal Full‐Service Community School grantees must report on objectives and performance measures (referred to as results and indicators in this toolkit). Find out if your stakeholders have a strong preference for certain terms. The most important thing is that everyone involved in your community school and evaluation understands the terms you are using and the concepts they represent.

www.communityschools.org www.iel.org
16
Activities: (i.e., What Can Happen at a Community School?) Activities are the programs, services, and supports the community school provides that will help you achieve your results. They should be linked to the unique characteristics of your community. Outputs: Outputs are the measureable, tangible, and direct products of what is taking place at your community school. They lead to your desired results – benefits for students, families, and your community. It is important to note, however, that they themselves are NOT the results you expect your community school to produce. Result: A result can be short‐term and long‐term. Short‐term results address knowledge and behavior change or confront a challenge in your school or community. These results eventually lead to the long‐term results. Long‐term results focus on the “big picture,” and usually begin to be seen about six months out, but often won’t be seen until a year or more. These results will take time to attain. Closely examining your results will help you answer the question whether anyone is better off. Remember to begin your evaluation by focusing on a few results. As you write your results, consider these questions:
• How much service do we want to deliver? • How well can we deliver it?
Indicators: Indicators are evidence or information that will tell you whether your community school is achieving the desired results. Indicators are measurable characteristics. They answer the question: “How will we know change has occurred in respective result area?” 3b. Know who you want to evaluate Your community school strategies may focus on the entire school or select members of the school and community population. For example, if one of your programs is after‐school mentoring, then your evaluation should look at this target population. Based on your community school’s LM, you would expect the program to have an effect on this target population. If your program is designed to impact all students at your school, then you should collect data on all the students. Even when you have a specific target population you may also want to collect data on students who are not meant to be impacted in order to compare students who are part of the program with those who are not. You may want to undertake these comparisons after you have had experience in evaluating your community school and/or with the assistance of an evaluation partner.

www.communityschools.org www.iel.org
17
3c. Prioritize your Results. Engage your stakeholders in a results prioritizing process. Limiting the focus of your evaluation will make your job easier and prevent your evaluation from becoming too time consuming or costly. Keep in mind that results are on a continuum: short‐term to long‐term. The phases below can help determine what is feasible in a set time period.
Continuum of Results
Closer in Time More Distant in Time Easier to Measure Harder to Measure More attributable to Program Less Attributable to Program
As you prioritize, you may want to:
• Choose results that can be accomplished in the near future. • Start with results that are shared by the largest number of stakeholders involved. • Consider what information your current or future stakeholders want to know.
Table D: SMART – Tips for Choosing Results
It is important to remember that results must be measurable. A common acronym for forming your results is SMART:
Specific – Define exactly what you want to accomplish. Measurable – Be able to determine whether you’ve met it. Achievable – Make sure you can meet the result. Realistic – Just as it sounds, can you really do this? Timely –Specify the timeframe for making it happen.
Learning As a result of activities/programs, the target audience will have an increase in knowledge and awareness. Ask yourself: What are the most direct results you expect to achieve? What has to happen first?
Behavior As a result of gained knowledge, the target audience (for whom the activity/program was done) takes some type of action. Ask yourself: What results come next – the things you want to happen, but that can’t happen without the first results?
Condition As a result of actions taken, a change in condition will take place. Ask yourself: What do you hope will result over time, as a product of your short and intermediate results?

www.communityschools.org www.iel.org
18
Review the example planning tool found here: http://www.communityschools.org/resources/community_school_evaluation_toolkit_resources.aspx.
www.communityschools.org www.iel.org
19
Step 4: Align your evaluation to the Community Schools Logic Model. 4a. Examine your activities and results in the context of the Community Schools LM. Consider the activities and results that you have defined and determine where they fit into the LM (see page 8). This will align your work with the national community school movement and with the resources provided in this toolkit. 4b. Decide which results will be your focus. After reviewing the list of results that your team considers important, you will need to narrow the list so that you can focus on a few. Think strategically, with your community school stakeholders, about where your activities and results align with the LM. It may be that they fit within several different results. Knowing that community schools often address many needs, stakeholders need to agree on the realistic priorities of the evaluation. Deciding on the scope of your results, by focusing on only one or two results in the beginning will simplify data collection and measurement as well as allow you to hold productive conversations with your partners.

www.communityschools.org www.iel.org
20
Evaluation example: Grand Rapids, MI Kent School Services Network (KSSN), in Grand Rapids, MI, brings health and human services into the school building to serve students and families. This idea is called a “community school.” Given the importance of students attending school consistently, placing services at school removes many barriers families have in finding services and helps keep students in class. When students are in class, they can keep learning and achieving. KSSN decided to tackle the issue of early chronic absence within their community schools. Their first step was to organize a group of stakeholders (i.e. Inputs) that would be able to create and implement strategies that made most sense for them and their community. Some members of their “Attendance Team” include:
Principal Community School Coordinator Nurse Family Support Specialist Home/School Coordinator
Below are a few of the activities that KSSN decided to implement (i.e. What Can Happen at a Community School):
• The principal leads the attendance meeting, contacting parents when appropriate. • The community school coordinator makes arrangements for mental health assessments and
necessary referrals, assists with transportation needs to initial assessments and follow‐up services, and assists with contacting parents regarding attendance concerns.
• The attendance secretary prepares a weekly list of students with attendance concerns, attends the attendance meetings, and mails appropriate attendance letters to parents.
• The school contacts the family ‐ either by phone, face‐to‐face, or home visit ‐ to address truancy concerns.
• The Department of Health Services intervenes to address any violations related to state benefits concerns and mails notification letters once the child has missed two days of school.
• The school nurse addresses medical issues that may be preventing a student from regular attendance by following up with the parent/guardian and makes any necessary referrals.
• Parents are invited to attendance meetings to discuss their child’s attendance and plan with the school to help the student attend more consistently.
Addressing barriers—some examples of barriers to attending school consistently have been: a lack of reliable transportation, an issue with the bus stop, lack of an alarm clock, lack of a morning routine, etc. Once barriers are identified the team works to eliminate the issue(s) with the family.
Results: KSSN’s findings do not show a clear overall trend in data from the eight KSSN schools. However, each school individually exhibits some positive trend. Most schools improved from the first year of data collection to the last year. An example of success at one of the KSSN schools is that the percentage of students who were chronically absent dropped from 27.5% (2004‐2005) to 7.4% (2007‐2008). Also, the overall academic achievement at the KSSN schools is improving. Contact: Matthew VanZetten, Management Analyst, Kent County (MI) Family & Childrenʹs Coordinating Council, [email protected]
www.communityschools.org www.iel.org
21
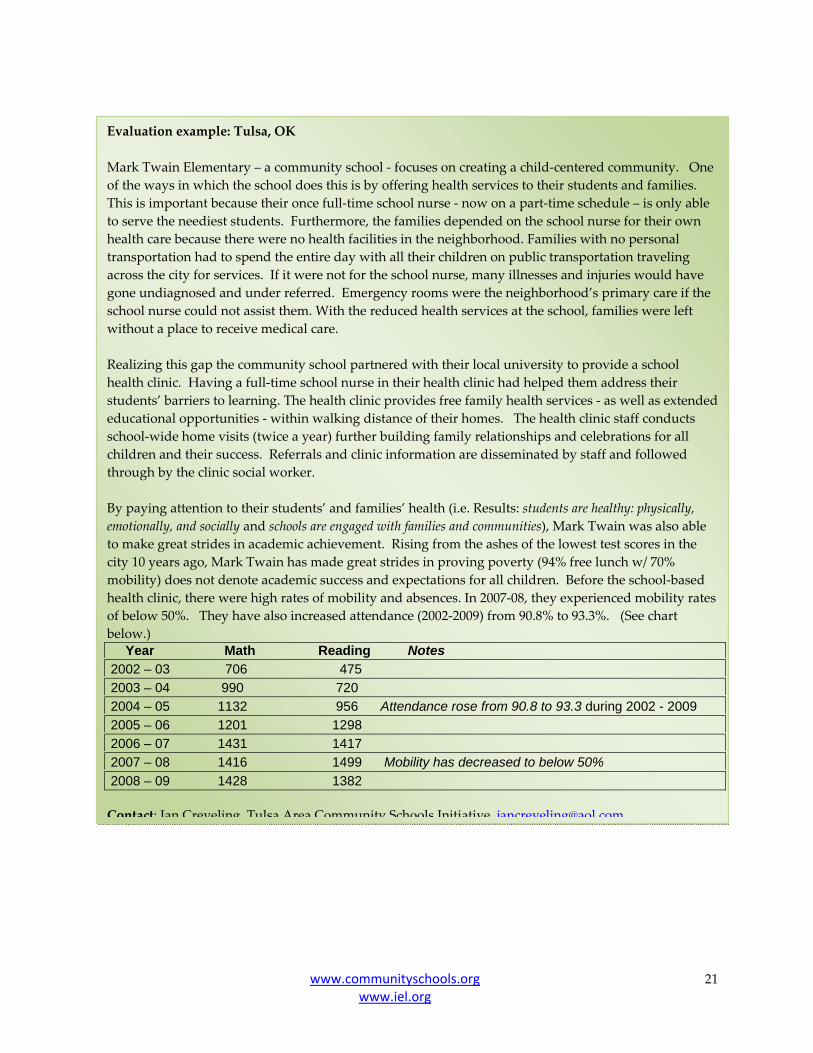
Evaluation example: Tulsa, OK Mark Twain Elementary – a community school ‐ focuses on creating a child‐centered community. One of the ways in which the school does this is by offering health services to their students and families. This is important because their once full‐time school nurse ‐ now on a part‐time schedule – is only able to serve the neediest students. Furthermore, the families depended on the school nurse for their own health care because there were no health facilities in the neighborhood. Families with no personal transportation had to spend the entire day with all their children on public transportation traveling across the city for services. If it were not for the school nurse, many illnesses and injuries would have gone undiagnosed and under referred. Emergency rooms were the neighborhood’s primary care if the school nurse could not assist them. With the reduced health services at the school, families were left without a place to receive medical care. Realizing this gap the community school partnered with their local university to provide a school health clinic. Having a full‐time school nurse in their health clinic had helped them address their students’ barriers to learning. The health clinic provides free family health services ‐ as well as extended educational opportunities ‐ within walking distance of their homes. The health clinic staff conducts school‐wide home visits (twice a year) further building family relationships and celebrations for all children and their success. Referrals and clinic information are disseminated by staff and followed through by the clinic social worker. By paying attention to their students’ and families’ health (i.e. Results: students are healthy: physically, emotionally, and socially and schools are engaged with families and communities), Mark Twain was also able to make great strides in academic achievement. Rising from the ashes of the lowest test scores in the city 10 years ago, Mark Twain has made great strides in proving poverty (94% free lunch w/ 70% mobility) does not denote academic success and expectations for all children. Before the school‐based health clinic, there were high rates of mobility and absences. In 2007‐08, they experienced mobility rates of below 50%. They have also increased attendance (2002‐2009) from 90.8% to 93.3%. (See chart below.) Year Math Reading Notes 2002 – 03 706 475 2003 – 04 990 720 2004 – 05 1132 956 Attendance rose from 90.8 to 93.3 during 2002 - 2009 2005 – 06 1201 1298 2006 – 07 1431 1417 2007 – 08 1416 1499 Mobility has decreased to below 50% 2008 – 09 1428 1382 Contact: Jan Creveling Tulsa Area Community Schools Initiative jancreveling@aol com

www.communityschools.org www.iel.org
22
Part 3- Get Set: Designing the Evaluation Step 5: Develop the questions you want your evaluation to answer. Now that you have identified one or more results for your evaluation, you need to form some evaluation questions to guide how you look at your data to see if your community school is producing the intended results. These questions should be tailored to fit your own school and community. 5a. Two types of evaluation questions. Evaluations include two broad types of questions:
1. Process Questions – How is the program operating? 2. Result‐focused Questions – Is the program accomplishing its intended results?
Process questions ask how a program functions, such as the number and types of people who are served by the activities, how individuals gain access to the activities, the types of activity offerings in which people participate, and how they experience the activity. You can ask process questions at any time but they are especially useful if you are in the beginning stages of developing your community school. Process questions can help highlight the effectiveness of community school components that can be improved or adjusted. The answers to process questions should be reported continuously so that you can use the answers to adjust and improve program implementation. Result‐focused questions ask about the effectiveness of the program, including whether it benefits recipients in the intended way. The best time to ask result‐focused questions are when a program is fully implemented or has been in place for a while. 5b. Forming your questions. The questions you generate should reflect the results and priorities of your community school stakeholders. As your community school evolves, you will need to revisit the evaluation questions, especially as you use your evaluation results to guide your future activity planning.

www.communityschools.org www.iel.org
23
Sample Evaluation Questions Related to the Result: students are actively involved in learning and in their community. Top priority questions are marked with a star (*). Process Evaluation Questions: [for an Afterschool Program]
• How many 6th, 7th, and 8th grade students participate in the after‐school program? How consistently do students participate? *
• Who are the students involved in the program? * • What types of activities take place? How often do they occur? * • In what ways do program activities align with school science curriculum? • Has the partnership between the program and the school been mutual and collaborative? * • In what ways, if any, could the program or partnership be improved? *
Results‐Focused Evaluation Questions:
• Do students who participate in the program show improvements in their science grades and test scores? *
• Do teachers of students in the program feel their students are more prepared to participate in class? *
• Do students who participate engage in community environmental initiatives or activities outside their involvement with afterschool program? Do their families?
• What else do students report gaining from the program? * • What do families report their children have gained from the program?
Evaluation example: Tulsa, OklahomaAn evaluation of 18 elementary schools across two districts in Tulsa looked at trust between teachers, parents, students, and other stakeholders as a key component of the community school model. Evaluation questions related to this area included:
• Is there mutual respect and effective collaboration among parents, families, and school staff? (Process question)
• Have schools fostered a safe, supportive, and respectful school climate? (Results‐focused question)
• Is responsibility for student learning shared across different groups of school members (e.g., students, parents, and teachers)?
Many of the surveys used by the evaluators in Tulsa are available in the toolkit (see surveys 29‐31 and 37‐42).

www.communityschools.org www.iel.org
24
Step 6: Decide what data to collect. The data you collect should be aligned with the results you selected in Steps 3 and 4. To establish what data to collect, determine what you need to measure to assess whether or not you are achieving your results. Table D (page 24) lists specific indicators for each result in the LM. Access the research on indicators here, by clicking on the results: http://www.communityschools.org/results/default.aspx. Use Table E (page 24) to decide on indicators that will help you measure the progress your community school is making towards the chosen results. Reading Table D: What you need to know
1. Anticipated Results = Results from the LM 2. Student & Family Indicators = Individual measures for students and families. 3. School, Community, and System Indicators = Measures for the whole school, school
system, or community. 4. Data Collection = Where and how can you get the data (i.e. the data source and the
collection method)? The numbers listed correspond to specific surveys. A chart listing all of the surveys available appears in the appendix and can also be found here: http://www.communityschools.org/resources/data_collection_instrument_guide.aspx.
Evaluation Example: Community Learning Centers‐ Lincoln, Nebraska The Lincoln Community Learning Centers (CLC) used case studies to tell the stories of youth and communities in a more personalized way. They collected data on the students’ activities during their evaluation and met with the students to write case studies. CLC teachers selected two students to follow throughout the year, holding discussions about the students as part of a regular team meeting. The process began in November and the case studies were completed in early May. The CLC case study development protocol and two sample case studies can be found here: http://www.communityschools.org/resources/community_school_evaluation_toolkit_resources.aspx. Contact: Lea Ann Johnson, Lincoln Community Learning Centers, [email protected]

www.communityschools.org www.iel.org
25
Evaluation Example: Carlin Springs Elementary School ‐ Arlington, VirginiaLike many community schools, Carlin Springs’ stakeholders identify improving academic performance as a key result. The essential results‐focused question driving their evaluation was: “Among those students at risk for failure, did participation in after‐school enrichment and parent involvement make it more likely they would advance to the next grade‐level in 2007‐08?” To help answer part of their question school staff implemented strategies to increase parent involvement so they could become more effective partners in their children’s education – focusing on the Short‐term Result: families are increasingly involved in their children’s education. They also looked at the rates of student participation in afterschool and enrichment activities – looking at the Short‐term Result: students are actively involved in their learning and community. (See LM, page 8 to find these results.)
In order to improve parental involvement, the community school coordinator, along with school staff, implemented several outreach activities involving school staff, youth, and families. (E.g. Principal’s Coffee, home visits, bus stop visits, family library nights, and middle school transition meetings for fifth grade parents, welcome back picnic, Fall Festival, International Dinner, and concerts.) To answer their evaluation question they collected data for both result areas. The staff collected data including: standardized test results, hours spent by each student in after‐school enrichments and tutoring, absences and tardiness, and teacher assessments on homework completion, participation in class, behavior, and overall academic performance. Data were also collected on parent participation at school and receipt of services such as home visits. Evaluators found that the following school activities have had significant impacts on their students’ performance:
After‐school academic enrichment Parent engagement activities
For example, increased parent engagement and students’ participation in after‐school activities both contributed to Carlin Springs Elementary School students’ improved academic skills and behavior.
A PowerPoint presentation of their evaluation can be found here:
http://www.communityschools.org/resources/community_school_evaluation_toolkit_resources.aspx
Contact: Anne Vor der Bruegge, Carlin Springs Elementary School, [email protected]

www.communityschools.org www.iel.org
26
Table E. Recommended Results, Indicators, and Data Collection Strategies for Students, Families, Schools, and Communities
(Note: Each survey can be downloaded at the Evaluation Toolkit’s site: http://www.communityschools.org/resources/community_schools_evaluation_toolkit.aspx)
Anticipated Results Student and Family Indicators
DataCollection
School, Community, and System Indicators
DataCollection
SHORT‐TERM RESULTS Children are ready to enter school
Immunizations Existing elementary school or early childhood program school records (elementary schools)
Availability of early childhood education programs
Self‐assessment or focus groups
Attendance at early childhood education programs
Provider attendance records (or parent report in enrollment forms)
Students attend school consistently
Early chronic absenteeism, tardiness, truancy, attendance rate
Existing school attendance data
System in place to respond to attendance problems
Self‐assessment or focus groups
Students are actively involved in learning and their community
Students feel they belong in school
Student surveys: 7, 14, 15, 20, 29, 32
Availability of in‐school and after‐school programs
In‐ and after‐school program records MOUs with community partners
Students feel empowered
Student surveys: 12,17,20
Opportunities for student leadership
Self‐assessment or focus groups with students Student surveys: 17, 28
Students feel competent
Student surveys: 2, 6, 8, 27
Schools are open to community
Focus groups Student surveys: 5, 19, 24 Teacher survey: 38 School survey: 35

www.communityschools.org www.iel.org
27
Anticipated Results Student and Family Indicators
DataCollection
School, Community, and System Indicators
DataCollection
Attendance at after‐school programs
In‐ and after‐school program records
Opportunities for service learning in the community
Self‐assessment, In‐ and after‐school program records, MOUs with community partners, or focus group
Post‐secondary plans
Student surveys: 5, 16, 32
Schools are engaged with families and community
Trust between faculty and families
Teacher survey: 42 Family surveys: 36, 41
Teacher attendance and turnover
Existing HR records
Faculty believe they are an effective and competent team
Teacher survey: 42
Community‐school partnerships
MOUs with community partners, Community‐school partner records
Families are actively involved in their children’s education
Families support students’ education at home
Student surveys: 14, 15, 31, 32 Family surveys:39 Teacher survey: 40
Opportunities for family involvement
Self‐assessment or focus group Minutes from meetings School Survey: 35
Family attendance at school‐wide events and parent‐teacher conferences
Teacher and school‐wide attendance reports Student survey: 11 Family survey: 33
Family experiences with school‐wide events, parent‐teacher conferences
Family survey: 33, 43
Family attendance at classes (e.g. ESL, parenting)
Provider attendance records Family survey: 33
Family experiences with classes (e.g. ESL, parenting)
Family survey: 33

www.communityschools.org www.iel.org
28
Anticipated Results Student and Family Indicators
DataCollection
School, Community and System Indicators
DataCollection
LONG‐TERM RESULTS
Students succeed academically
Standardized test scores (e.g., Reading by 3rd grade)
Existing school achievement data
Teachers support students
Student surveys: 1, 14, 15, 20, 32 Teacher survey: 34
Grades Existing school achievement data
Teachers take positive approach to learning and teaching
Student surveys: 15, 20, 25, 32 Teacher survey: 37
Graduation and dropout rates
Existing achievement data
Teacher classroom management
Student survey: 15, 25, 32
Students are healthy: physically, socially, and emotionally
Asthma control ER visits Student surveys: 18, 22
Service referrals (including vision, dental, mental health, and others)
Service referral records
Physical fitness Existing physical fitness data Student surveys: 18, 22
Services provided (including vision, dental, mental health, and others)
Service receipt records from partners
Nutritional habits Student surveys: 18, 23, 26
Opportunities for physical activity during school
Self‐assessment or focus group Student surveys: 18, 23, 26
Positive adult relationships
Student surveys: 9, 10, 14, 15, 17, 21
Wellness policy Data on compliance with policy
Positive peer relationships
Student surveys: 3,4, 13, 21
Students live and learn in stable and supportive environments
Staff, families, and students feel safe
Student surveys: 14, 15, 20, 32 Family survey: 36
Schools are clean Self‐assessment
www.communityschools.org www.iel.org
29
Anticipated Results Student and Family Indicators
DataCollection
School, Community and System Indicators
DataCollection
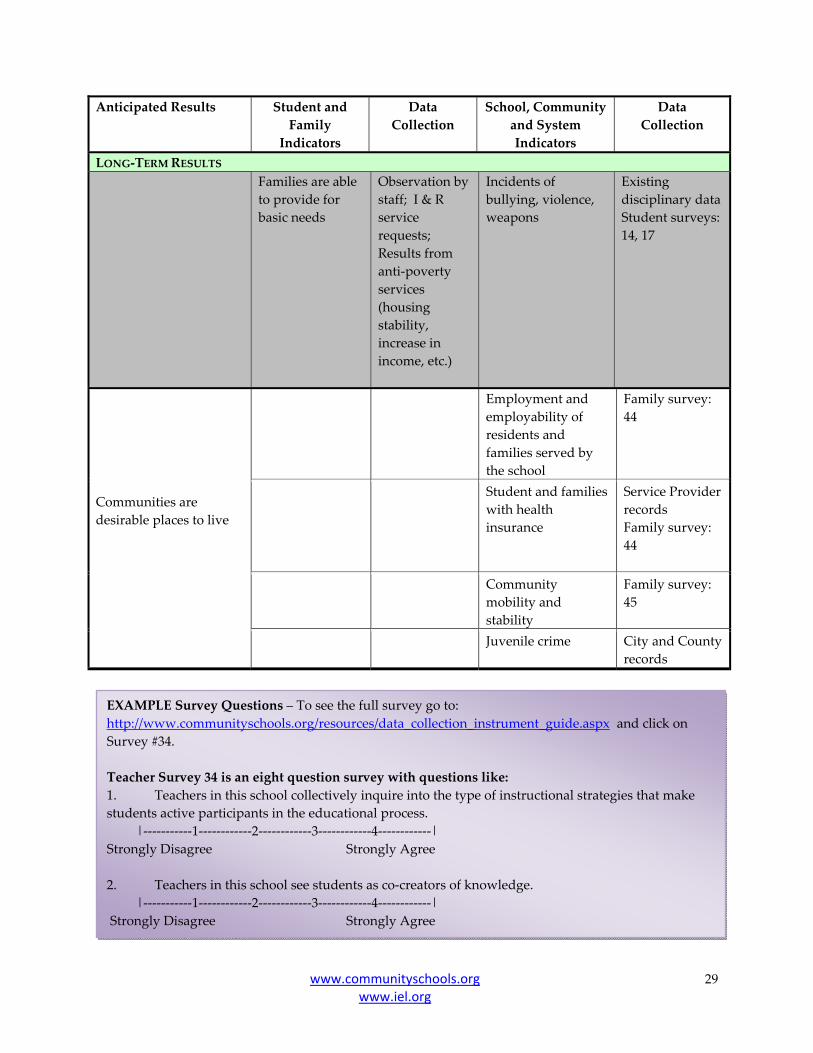
LONG‐TERM RESULTS Families are able to provide for basic needs
Observation by staff; I & R service requests; Results from anti‐poverty services (housing stability, increase in income, etc.)
Incidents of bullying, violence, weapons
Existing disciplinary data Student surveys: 14, 17
Communities are desirable places to live
Employment and employability of residents and families served by the school
Family survey: 44
Student and families with health insurance
Service Provider records Family survey: 44
Community mobility and stability
Family survey: 45
Juvenile crime City and County records
EXAMPLE Survey Questions – To see the full survey go to: http://www.communityschools.org/resources/data_collection_instrument_guide.aspx and click on Survey #34. Teacher Survey 34 is an eight question survey with questions like: 1. Teachers in this school collectively inquire into the type of instructional strategies that make students active participants in the educational process. |‐‐‐‐‐‐‐‐‐‐‐1‐‐‐‐‐‐‐‐‐‐‐‐2‐‐‐‐‐‐‐‐‐‐‐‐3‐‐‐‐‐‐‐‐‐‐‐‐4‐‐‐‐‐‐‐‐‐‐‐‐| Strongly Disagree Strongly Agree 2. Teachers in this school see students as co‐creators of knowledge. |‐‐‐‐‐‐‐‐‐‐‐1‐‐‐‐‐‐‐‐‐‐‐‐2‐‐‐‐‐‐‐‐‐‐‐‐3‐‐‐‐‐‐‐‐‐‐‐‐4‐‐‐‐‐‐‐‐‐‐‐‐| Strongly Disagree Strongly Agree

www.communityschools.org www.iel.org
30
A CLOSER LOOK Result: Communities are desirable places to live If you want to focus your evaluation on the community as a whole, you may want to consider the following issues and resources. Community schools play a key role in creating supportive and thriving communities with high‐quality and engaging schools. However, assessing your community school’s role in improving communities and making them more desirable places to live is challenging. There are often many factors (e.g. economic, environmental) beyond the control of the community school. Still, if your community school activities are focused on improving your local community, you may want to consider ways to assess this. An example is the Los Angeles Family and Neighborhood Survey (LAFANS) conducted by the RAND Corporation. The survey includes questionnaires for adults and children and an observation guide to examine the physical and social characteristics of the neighborhood. For more information on the LAFANS, see: http://www.lasurvey.rand.org/

www.communityschools.org www.iel.org
31
Part 4- GO!: The Evaluation Process Step 7: Collect data. Now that you have decided on results and corresponding indicators for data collection, you can move on to collecting the data. There are many issues to consider before you start. Table D (page 24) provides you with a starting point for each of the indicators, but choosing the best data sources for you will depend on your school and community. 7a. Important data collection guidelines. Consider confidentiality: A key concern about collecting and using any kind data is confidentiality. It is important to not reveal students’ or parents’ names, addresses, or other identifying information in any analyses, reports, or presentations. Ensure that when reporting information, you only identify groups of people that are large enough to make it impossible to identify individuals. To be safe, you may want to only report information for groups that include 20 or more people. If you store any confidential data, make sure that appropriate security is in place so the data cannot be seen by others (even over the Internet) or taken without your knowledge. Discuss confidentiality issues with everyone who will be collecting data. Refer to the FERPA (Family Educational Rights and Privacy Act) for more guidance: http://www.ed.gov/policy/gen/guid/fpco/ferpa/index.html. Obtain permission to collect data: You will need to get permission to collect or use data that is already collected at your school and community sites. Be sure to check with the appropriate administrators (e.g., principals, superintendent, city, or county personnel) to find out what their expectations are around this issue. Address barriers or provide incentives for data collection: You will likely encounter barriers that make data collection difficult. Think carefully about what challenges you may face in data collection (e.g., language, return rates, busy schedules, access to phones/internet, transportation issues) and consider how you can work around them. Also look for natural opportunities to collect data (e.g., parent‐teacher conferences, school event). Maintaining a database entails knowing which kids participated, how often, whether their families attended, etc. Sharing Data: Sharing data on individual students across organizations can be difficult for many logistical and political reasons. Creating Data Use Agreements (DUA) with partner organizations can help to manage expectations and to identify possible areas of concern. For a sample DUA: http://www.communityschools.org/resources/community_school_evaluation_toolkit_resources.aspx. Incentives: In some cases you may consider providing an incentive for individuals to fill out surveys or attend focus groups. Common incentives for students include extra credit points, pizza parties, or free time for classes with high survey response rates.

www.communityschools.org www.iel.org
32
7b: Data Collection Methods - Which data will answer your evaluation questions (see Step 5, p. 21)? How will you collect the data to answer your questions? There are a variety of data sources you can access to answer your evaluation questions. [Forming evaluation questions is discussed in Step 5.] Many questions can be answered using data already collected by your school, district, county, or other partner agencies. However, some evaluation questions may require additional data. The most likely ways to collect necessary additional data are through: data systems, surveys, focus groups, and through data collected by other agencies. Below you will find in‐depth explanations of each source. I. School Data Systems: For schools and school districts, existing data systems usually include information about student and family demographics, student academic achievement, attendance, suspensions, expulsions, and possibly other information. These data are typically maintained by a school district; a school’s individual access varies by district. Even if accessing information on each student individually is not possible, you should be able to access school‐level information for various groups of students through your District Office or State Department of Education websites. It may be possible to modify your data system to incorporate additional information or to create a parallel data system (in a spreadsheet or new database) that can be connected to the existing one. In either case, the aim is to be able to have the data you need to answer your evaluation questions. Reminder: in order to access this information, you may need Data Use Agreements (DUA) with your school districts. You can find sample DUAs at: http://www.communityschools.org/resources/community_school_evaluation_toolkit_resources.aspx.
II. Surveys: Surveys offer a complement to existing data because they can help you get information about other issues not usually included in existing database systems. Areas such as: youth motivation, family satisfaction, teacher perspectives, among others may be critical to your evaluation and would require a survey. In Step 6 you will find several sample surveys that come recommended
Database Systems Investing in a database system for your evaluation can save you time and money. There are many good products on the market. Two resources that may be helpful to you in selecting a database:
1. TechSoup.com provides information on using new technologies including articles on what to look for in a database system. www.techsoup.com
2. One example of a product that community schools use is the Cityspan Provider™. This database offers a system for recording client information, tracking enrollment, and attendance and measuring outcomes. It can be customized for your needs and was designed with many federal and state funding reporting needs in mind: http://www.cityspan.com/

www.communityschools.org www.iel.org
33
by community school researchers and evaluators. When considering these surveys or others, think about the following questions:
• Is the survey relevant to the services and efforts in your community school? Does it help answer your questions and connect to your results and indicators?
• Is the survey age appropriate? Is it written for the age group of children or individuals
from whom you are collecting data? The same survey is sometimes available in different versions for children of different ages.
• Is it the right survey at the right time? For example, you wouldn’t use a satisfaction
survey at the start of a program. • Is the survey easy to complete? Does it ask questions that will make the respondent
uncomfortable or confused? Are questions asked clearly and only one at a time? Does is take a long time to complete?
To access all of the surveys visit: http://www.communityschools.org/resources/data_collection_instrument_guide.aspx’. III. Focus Groups: Unlike existing data systems and surveys, both of which can answer questions about larger groups of people, focus groups concentrate on a set of key respondents. Focus groups are an excellent way to learn more about process type questions – how participants feel about a program or service, why and for whom it does or does not work, and in what ways the program or service could be modified or improved. Learn more about how to conduct focus groups at: http://www.managementhelp.org/evaluatn/focusgrp.htm. IV. Data Collected by Other Agencies: Your partner agencies also collect information about your students, families, and community. For instance, your local county health department or agency may collect information on students receiving mental health services or rates of asthma, immunization, or health insurance coverage; your human or social services department or agency likely collects information on public assistance receipt and subsidized preschool participation; police departments collect crime or safety statistics. It may be helpful to use these data, even if they are available only on a community‐wide level, both in planning your services and in helping to answer some evaluation questions. A few other places to look:
• The U.S. Census Bureau has local population estimates by age and ethnicity as well as a host of local information about population education levels, employment, income, and insurance coverage, among others (www.census.gov). In particular, you should check out the American Community Survey on the Census website: http://tiny.cc/HLyWG for demographic information.
www.communityschools.org www.iel.org
34
• The Youth Risk Behavior Surveillance System (YRBSS) monitors priority health‐risk behaviors and the prevalence of obesity and asthma among youth and young adults. The YRBSS includes a national school‐based survey conducted by the Centers for Disease Control and Prevention (CDC) and state, territorial, tribal, and local surveys (www.cdc.gov/HealthYouth/yrbs/). For example, California administers the California Healthy Kids Survey (CHKS) in several grades.
• Annie E. Casey Foundation’s data system called KIDS COUNT (http://www.aecf.org/MajorInitiatives/KIDSCOUNT.aspx) provides data on a variety of child‐related topics.
• State Departments of Education often have web‐based information on school performance, etc.
• The Great Schools website: offers information on schools’: test scores, teacher stats, student stats, and extracurricular activities. http://www.greatschools.net/.
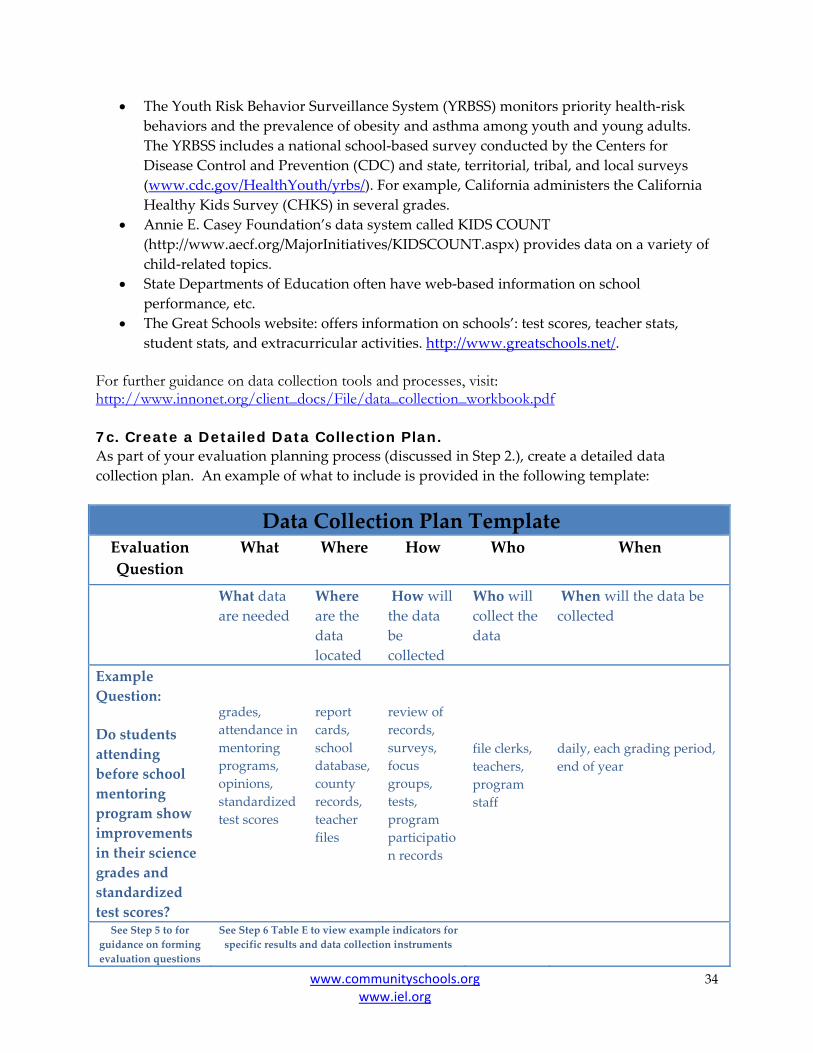
For further guidance on data collection tools and processes, visit: http://www.innonet.org/client_docs/File/data_collection_workbook.pdf 7c. Create a Detailed Data Collection Plan. As part of your evaluation planning process (discussed in Step 2.), create a detailed data collection plan. An example of what to include is provided in the following template:
Data Collection Plan TemplateEvaluation Question
What Where How Who When
What data are needed
Where are the data located
How will the data be collected
Who will collect the data
When will the data be collected
Example Question:
Do students attending before school mentoring program show improvements in their science grades and standardized test scores?
grades, attendance in mentoring programs, opinions, standardized test scores
report cards, school database, county records, teacher files
review of records, surveys, focus groups, tests, program participation records
file clerks, teachers, program staff
daily, each grading period, end of year
See Step 5 to for guidance on forming evaluation questions
See Step 6 Table E to view example indicators for specific results and data collection instruments

www.communityschools.org www.iel.org
35
Step 8: Making sense of your data. This section offers guidance for those just starting out in evaluation. No special training is necessary, but if your evaluation is complex you may want to consider partnering with another agency or a university to help with the analysis. 8a. Organize your data in a format that is easy for you to use. Regardless of the types of data you have collected, you will need to arrange the data to look for patterns, pull out sections to look at more closely, and, in some cases, link data from different sources together. Be sure to allow sufficient time to enter data from written surveys and to double check data against original files to ensure accuracy. It might be helpful to find someone who can use Microsoft EXCEL or ACCESS to input data and to create readable reports.
8b. Focus on what is important about your data. As you look at your findings, think back to your chosen results and the indicators you used to measure success. Ask yourself what your data are telling you: Are there any surprises? Do the findings make sense? Do I need more information to explain what I’m seeing? How can I use this moving forward?
Limits and Opportunities in Data Analysis Can I say my programs caused this change? Even with a defined set of evaluation questions and the right data to answer them, you should not expect to be able to say with certainty that your community school’s activities caused the changes you observe. Programs are correlated with successful results, and there may be much anecdotal evidence from participant and stakeholders that the programs are having the desired effect. Strengthening your findings with multiple data sets or perspectives It can be useful to look at the same indicator from different perspectives or using different sources of information. For example, Table B provides three different methods for collecting data on the indicator: schools are open to community. If you collect surveys from students and teachers and hold a focus group for community members, you can compare the findings. If the findings from all three sources of information are consistent, you can say with more certainty that your findings are accurate. Otherwise, you might examine your data collection procedures or identify new evaluation questions to help explain the different perspectives gathered.
Don’t get lost in your data. There are many resources available to help you look at your data and use it for ‘data‐driven decision‐making.’ Two easy‐to‐read resources are:
• Data Wise: A Step‐by‐Step Guide to Using Assessment Results to Improve Teaching and Learning, edited by Kathryn Parker Boudett, Elizabeth A. City, and Richard J. Murnane (2005), published by the Harvard Education Press.
• Statistics Made Simple for School Leaders, by Susan Rovezzi Carroll and David J. Carroll (2002), published by Rowman & Littlefield Education.

www.communityschools.org www.iel.org
36
Step 9: Use your findings. 9a. Select your audience and decide what to report. When presenting your findings to others, use clear and simple charts and statements so that people can quickly see the results. Relate your findings to the evaluation questions and results. By presenting your data in an informal setting to the individuals who helped you collect it, you can make sure that your findings make sense and that they are useful and relevant. Ideally, students, principals, teachers, after‐school program directors, and others who are providing direct services to youth and adults in your community will be able to look at your findings and have conversations about what they mean. Consider sharing your initial and refined findings with any interested partners. There are many ways to do this from one‐on‐one meetings once a year to small group discussions that happen once a week. Within these discussions you can reflect on the data and their meaning:
• What you did. • How you did it. • Whether your students and families better off.
There are many opportunities to share your findings. You can use your findings to make changes to the day‐to‐day implementation of your community school, to change local policies, and to convince funders about the success of your program. 9b. Present your data to change day-to-day practice and results-based planning. Information from process questions and results‐based questions can help you modify the day‐to‐day practice of your community school. Reflecting on the evaluation will help you to continuously improve your strategies. Using the findings from your evaluation, you can work with your partners and community school staff to ask questions like:
• Are there needs you didn’t anticipate? • Do you need to do things differently? • Do you need new partners to fill unmet needs? • Did the level of resources available to you affect how you delivered services and
programs?
There may also be other questions you will want to ask with your partners as you use your data for future planning. It is important to make your data available to your stakeholders. In order to have a productive conversation around data you will need to know the interests of your stakeholders before

www.communityschools.org www.iel.org
37
deciding how and when to share your findings. In year one, however, you may want to share findings with just a few people that could become champions for future evaluation efforts.
For more information:
• Many schools describe a continuous evaluation process as a “cycle of inquiry. “For a diagram of this process visit: http://www.communityschools.org/resources/data_collection_instrument_guide.aspx.
• Some schools review their data in what are referred to as “learning communities.” Learning communities are small groups that meet regularly to collaboratively collect, analyze, and use data to improve their individual and group practices. For a quick reference on one model for learning communities visit: http://www.communityschools.org/resources/data_collection_instrument_guide.aspx.
9c. Data to change policy. School board members, superintendents, city, or county policy makers and other elected or appointed officials can use your big picture findings to make decisions. Policy makers are pressed for time and will want short, professional summaries and reports that explain clearly what you found and how it connects to the decisions they are making. When working with these audiences, consider the following:
• Have specific recommendations – Use your findings to show where needs exist and ways to address them.
• Find champions – Know which community leaders are interested in the issue you are addressing. Consider having someone who was deeply involved in the evaluation provide an “outside” eye on findings.
• Timing is everything – Know what topics are currently being discussed at the local, county, state, and federal level and relate them to your data.
• Presentation matters – Make your findings easy to read and professional looking. Charts, colors, bullet points, and other formatting tools can be used to highlight findings at a glance.
• Who is presenting information matters – Consider all of your stakeholders as potential presenters. In some situations it may be the most powerful to have teachers, students, or others that were directly involved in collection or analysis to present the information to policy makers.
Examples of using data to make adjustments at your community school: • Since test scores among ESL students are rising less quickly than native English speakers there is
a need to create stronger links between after‐school and in‐school programming. • Failure to attract minority students led to X change in programming.

www.communityschools.org www.iel.org
38
Capturing Data on Leveraging Resources In addition to capturing and analyzing data on community school indicators to change policy, community school leaders must be able to use this data to leverage financial resources. Evaluating the impact of community schools on students, families, and communities is the primary focus of this toolkit; however, there is another intermediate dimension through which to examine the impact of community schools – how community schools leverage resources across multiple funding streams and programs. U. S. Secretary of Education Arne Duncan, described community schools as the best investment he made in education reform because of the assets the community schools strategy was able to leverage. Policymakers are also concerned about the fragmentation of services and programs that make it difficult for people to receive the supports and opportunities they need and deserve. Community schools respond to the challenge by integrating resources at the school to create a more integrated delivery system. Therefore, it is important for community school leaders to demonstrate to policymaker how they are leveraging federal, state, and local resources funding streams as well as private resources and volunteer assets to improve results. Demonstrating this leverage can buy time until specific indicators of student, family, and community well‐being move forward. The Coalition has developed a template [Appendix C] that can assist local community schools and community school initiatives to capture information on funds and services being brought together at individual community schools. Our recent report on community schools financing includes examples of how initiatives and individual community schools are financed which illustrate the value of collecting information on the resources that are aggregated through the partnerships that are the essence of community schools.
www.communityschools.org www.iel.org
39
9d. Data for funders. Although funders often require specific types of data to be included in reports to them, consider using the LM in your conversations with your funders. You might include funders in your stakeholder group and give them opportunities to participate in the evaluation process. Some funders may not be flexible about what information they need. But learning what results are important to them and keeping them informed of your evaluation efforts will likely be helpful as they report to their boards and talk to other funders about supporting your work. 9e. Sharing data beyond the stakeholder group. New Supporters: Don’t be shy about sharing successes and challenges with everyone! Encourage current stakeholders to include others in the evaluation process and be ready to share your findings publicly. Local, regional, and national press outlets may be interested in sharing stories like yours – especially unique successes that have made a difference in your community. You may find new partners and champions in surprising places. For an easy guide to creating a communications campaign, take a look at the resource from Spitfire Strategies here: http://www.communityschools.org/resources/data_collection_instrument_guide.aspx. National Community Schools Movement (www.communityschools.org): There are many schools across the country that identify with the national community schools movement and are potential allies. This toolkit has outlined nine results that community schools care about with the purpose of promoting a common language to facilitate collaborative efforts among them. Several ways to connect with other community schools include:
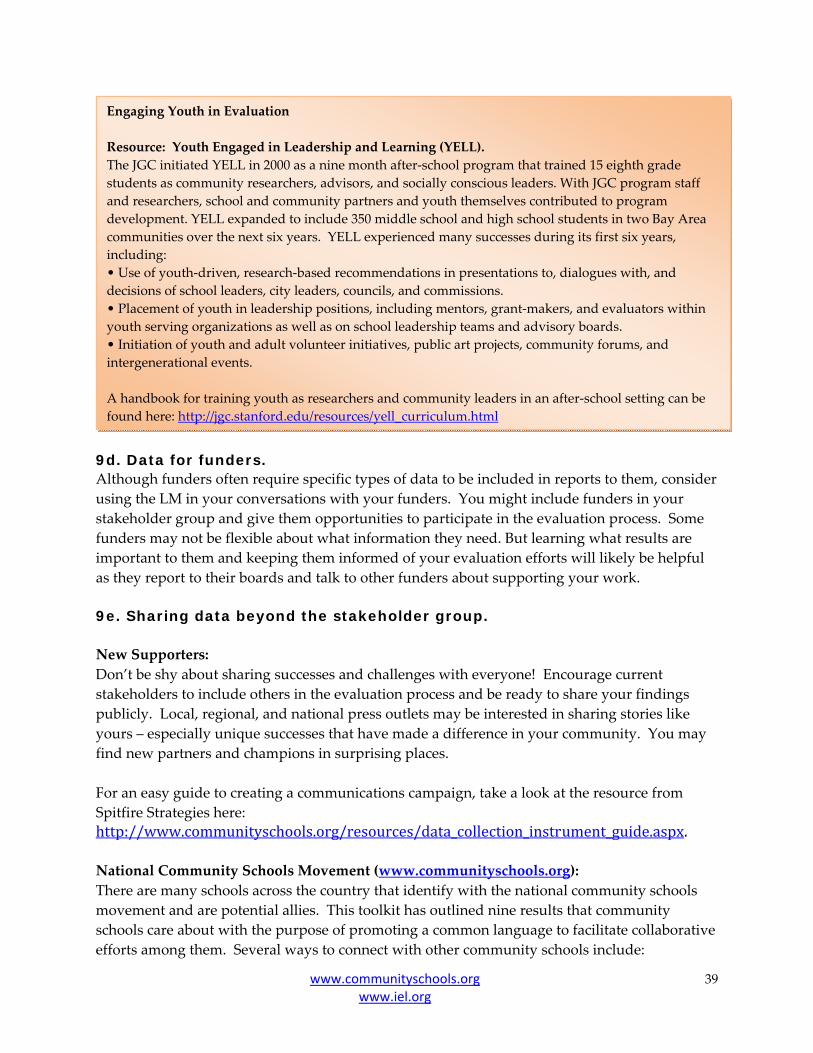
Engaging Youth in Evaluation Resource: Youth Engaged in Leadership and Learning (YELL). The JGC initiated YELL in 2000 as a nine month after‐school program that trained 15 eighth grade students as community researchers, advisors, and socially conscious leaders. With JGC program staff and researchers, school and community partners and youth themselves contributed to program development. YELL expanded to include 350 middle school and high school students in two Bay Area communities over the next six years. YELL experienced many successes during its first six years, including: • Use of youth‐driven, research‐based recommendations in presentations to, dialogues with, and decisions of school leaders, city leaders, councils, and commissions. • Placement of youth in leadership positions, including mentors, grant‐makers, and evaluators within youth serving organizations as well as on school leadership teams and advisory boards. • Initiation of youth and adult volunteer initiatives, public art projects, community forums, and intergenerational events. A handbook for training youth as researchers and community leaders in an after‐school setting can be found here: http://jgc.stanford.edu/resources/yell_curriculum.html
www.communityschools.org www.iel.org
40
1. Find other local community schools and create cross‐site learning opportunities. 2. Participate in a site visit to another school and share your findings with them. 3. Present your findings and how you got them at the Coalition for Community Schools
Conference or at other education related conferences. 4. Share your findings with others working on county, state, or national legislation that
would benefit your school.
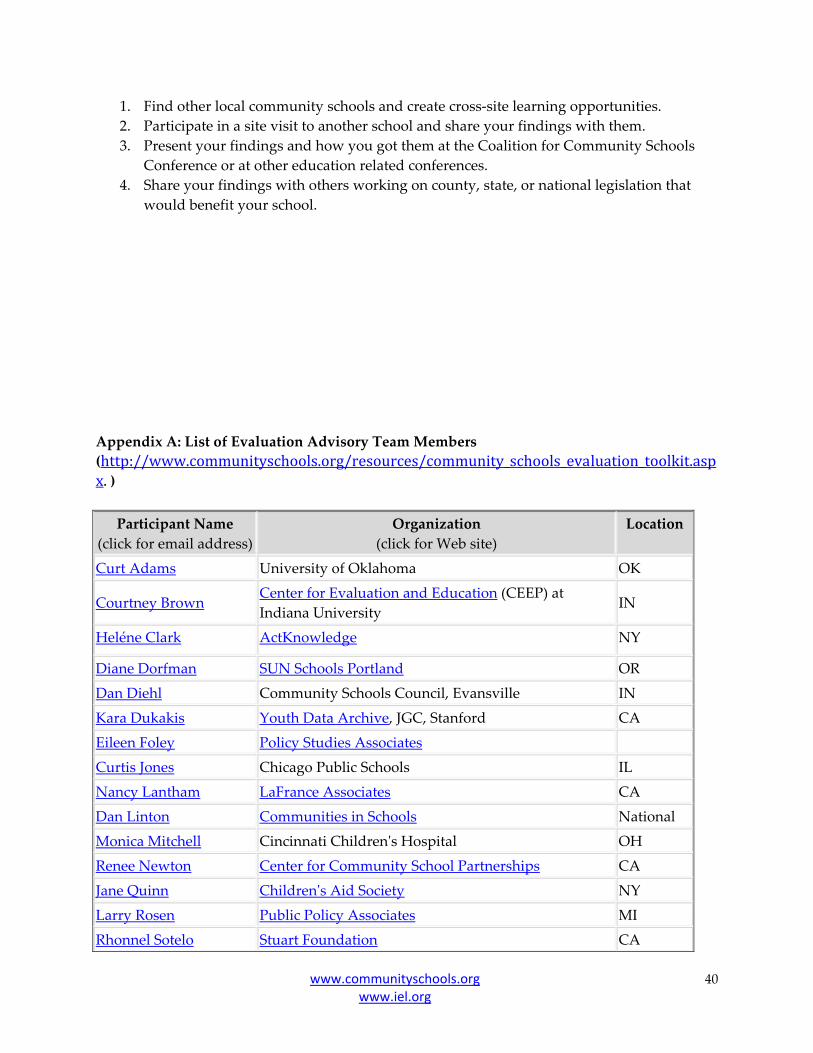
Appendix A: List of Evaluation Advisory Team Members (http://www.communityschools.org/resources/community_schools_evaluation_toolkit.aspx. ) Participant Name
(click for email address) Organization
(click for Web site) Location
Curt Adams University of Oklahoma OK
Courtney Brown Center for Evaluation and Education (CEEP) at Indiana University
IN
Heléne Clark ActKnowledge NY
Diane Dorfman SUN Schools Portland OR
Dan Diehl Community Schools Council, Evansville IN
Kara Dukakis Youth Data Archive, JGC, Stanford CA
Eileen Foley Policy Studies Associates
Curtis Jones Chicago Public Schools IL
Nancy Lantham LaFrance Associates CA
Dan Linton Communities in Schools National
Monica Mitchell Cincinnati Childrenʹs Hospital OH
Renee Newton Center for Community School Partnerships CA
Jane Quinn Childrenʹs Aid Society NY
Larry Rosen Public Policy Associates MI
Rhonnel Sotelo Stuart Foundation CA

www.communityschools.org www.iel.org
41
Gretchen Suess Barbara and Edward Netter Center for Community Partnerships, UPENN
PN
Lisa Villarreal The San Francisco Foundation CA JGC Community Partners:
• Anne Hipskind, Community School Coordinator, Cunha Intermediate School, Half Moon Bay , CA
• Anahita Modaresi, Youth Development Coordinator, Cunha Intermediate School, Half Moon Bay, CA
• Susan Sanchez, Social Services Coordinator, Cunha Intermediate School, Half Moon Bay , CA
• Sandra Portasio, Director of Community‐School Partnerships, Redwood City School district, Redwood City, CA
• Carlin Politzer, Community School Coordinator, Taft Elementary School, Redwood City, CA
• Pat Brown, Executive Director, Redwood City 2020, Redwood City, CA Appendix B: Data Collection Surveys and Other Resources • Surveys for Corresponding Indicators:
http://www.communityschools.org/resources/data_collection_instrument_guide.aspx . • Other Evaluation Planning and Implementation Resources:
http://www.communityschools.org/resources/community_school_evaluation_toolkit_resources.aspx.

APPENDIX C: School Funding Source – Data Collection Matrix Representative’s Name/Position: Name of School: Contact Information: Intermediary/Partner: Date of Interview: This data reflects the current school year or past school year (check one). Purpose: This project seeks to identify the variety of ways in which community schools are financed. We hope to untangle the mystery of how community schools are funded for the benefit of the field and others aspiring to develop community schools.
www.communityschools.org www.iel.org
42
For each program or service available at your school, please provide the following information: 1. Mark as “a,” “b,” “c,” etc. Or a combination of the following:
a. Direct allocation by intermediary, by school district? b. Funds raised by lead partner, or other source at school? For example, a grant goes to
lead partner which in turn delivers service or provides a portion to the community school. Or, a CBO receives prevention grant and delivers services at the community school. Or, CBO is a HUD Housing Council agent and offers financial education, or provides other services at the school.
c. School-based student support involved with the community school. For example, school nurse.
d. Redirection/leveraging of existing funding by partners to sites? For example, Children’s Literacy Council provides ESL classes; Community College offers technical
courses; local hospital or clinic provides services. [e.g. Boys & Girls Club offers services]
e. In-kind funding or other support such as volunteers, materials, space? 2. Write the name of the funding source and estimated amount, e.g., 21st Century, CLC,
Medicare/Medicaid, CNCS Learn & Serve, AmeriCorps, Safe and Drug Free, Dept. of Agriculture programs, work study, etc. (For programs and services, please provide $ amounts. For existing staff, provide % of FTE, For volunteers, provide hours, and for college students, provide # of work study hours, if applicable.)
3. What is leveraging the integration of resources? A policy structure? Leadership? A mix of structure and leadership?
Example Entries Listed in Red– Please Make Adjustments as Needed Federal State County City District/
LEA Private
Foundations Private
Businesses Indiv.
Donors CBOs
In-Kind
Site Coordination a) 50% FTE site coord.
d) 25% FTE site coord
b) 25% FTE site coord.
Services
• Academic Enrichment a)21st C ($110k) a)Local approp ($50k)
• Adult Education d) library resources($5k)
• After School
• Early Childhood
• Family Support Centers a)Family ctr. Prog ($75k)
• Health Services d) Medicaid ($50k)
c)Nurse @20% FTE
• Immigration Services
• Interns -- College d)work study- interns part-time salary/6mos.
e)3 grad school vols.
• Life Skills b)Casey Found.($25k)
• Mentors • Parent Education • Parent
Involvement/Leadership
• Recreation & Sports • Service Learning/Civic
Eng.
• Tutors • Volunteers

APPENDIX C: School Funding Source – Data Collection Matrix Representative’s Name/Position: Name of School: Contact Information: Intermediary/Partner: Date of Interview: This data reflects the current school year or past school year (check one). Purpose: This project seeks to identify the variety of ways in which community schools are financed. We hope to untangle the mystery of how community schools are funded for the benefit of the field and others aspiring to develop community schools.
www.communityschools.org www.iel.org
43