Embed Size (px)
Citation preview
1
Company Analysis
Robert “Jake” Anderson PRT 503
The Madison Square Garden Company Analysis
2
Table of Contents
Executive Summary……………………………………………………………………………….3
Company Profile…………………………………………………………………………………..4
Mission Statement………………………………………………………………………...4
Objectives…………………………………………………………………………………4
Values……………………………………………………………………………………..4
History of the Madison Square Garden Company………………………………………..4
Timeline…………………………………………………………………………………...5
Economic Issues…………………………………………………………………………………..6
Sports Business…………………………………………………………………………....6
Entertainment Business…………………………………………………………………....6
Media Business…………………………………………………………………………....7
All three segments…………………………………………………………………………7
Revenue and Expenditure Summary………………………………………………………………8
Revenues…………………………………………………………………………………..8
Expenditures………………………………………………………………………………8
Quarterly Revenues and Expenses 2013 Fiscal Year Graph……………………………...9
Total Revenue and Expenses 2011-2013 Graph…………………………………………10
Assets and Liabilities Summary………………………………………………………………….11
Quarterly Assets and Liabilities 2013 Fiscal Year Graph……………………………….11
Assets and Liabilities 2011-2013 Graph…………………………………………………12
Financial Analysis and Ratios……………………………………………………………………13
Current Ratio……………………………………………………………………………..13
Total Debt/Debt to Worth Ratio………………………………………………………....13
Receivable Turnover and Days’ Sales/Receivables………………………………….......14
Profit Margin……………………………………………………………………………..14
Future Trends…………………………………………………………………………………….15
Appendix…………………………………………………………………………………………16
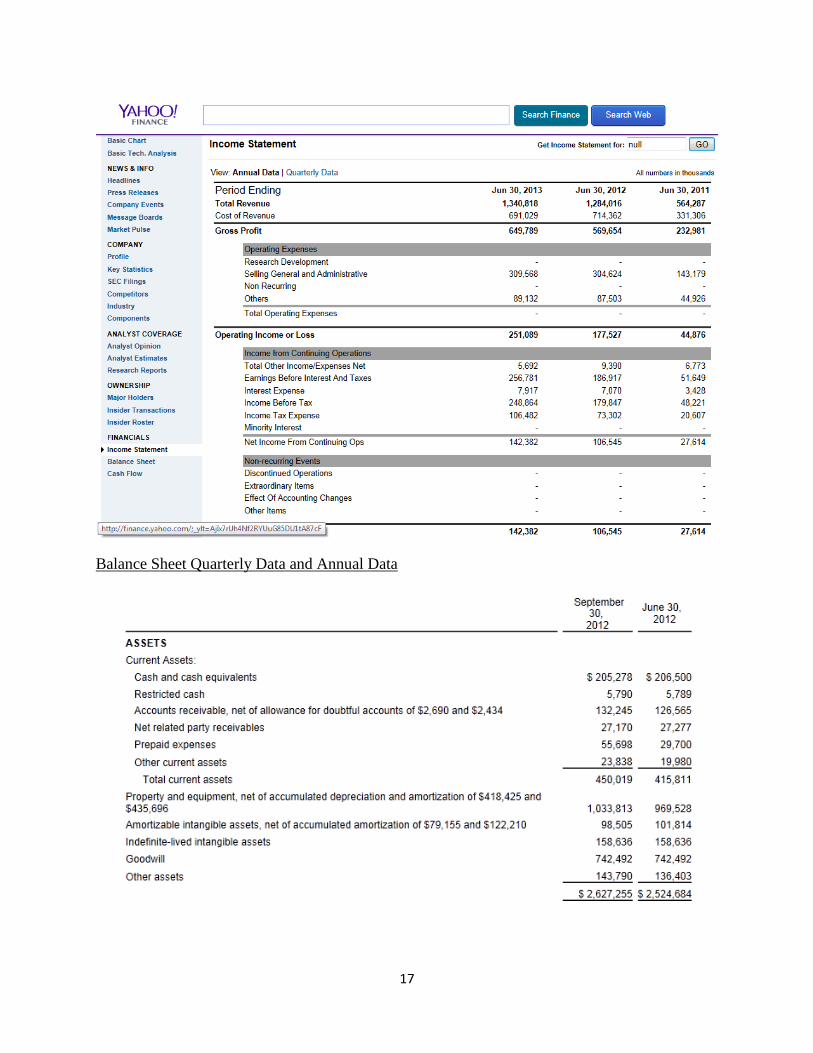
Income Statement Quarterly Data and Annual Data……………………………………..16
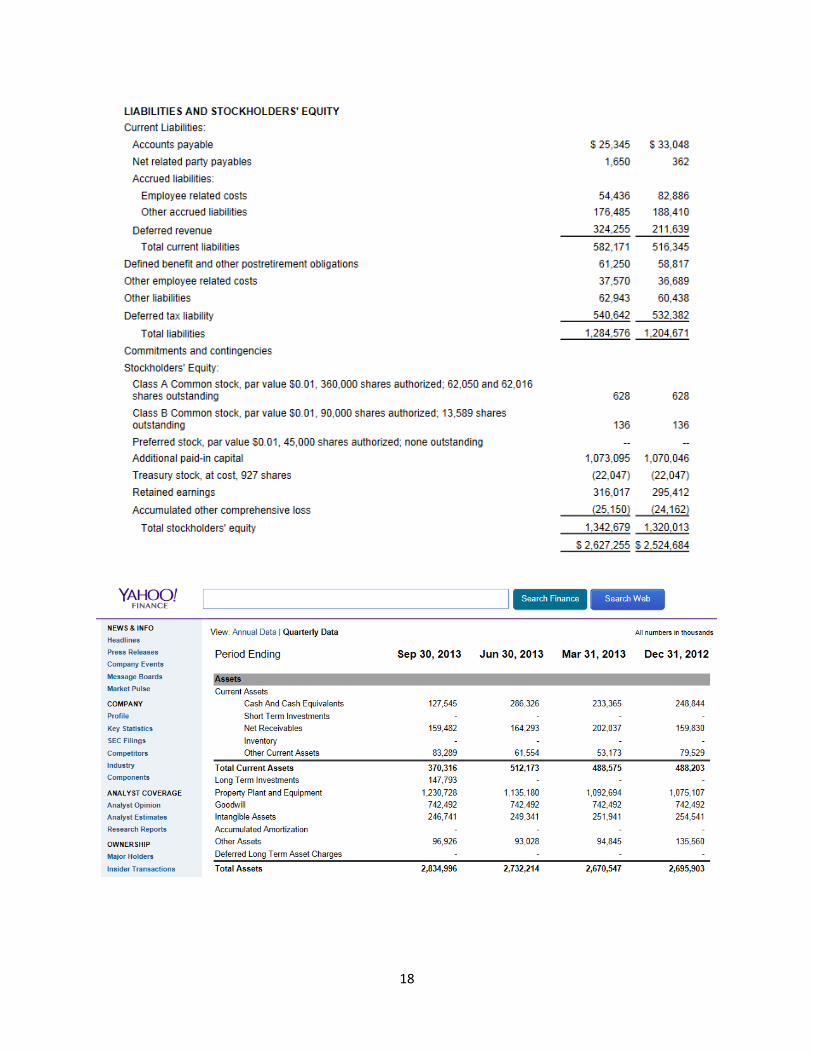
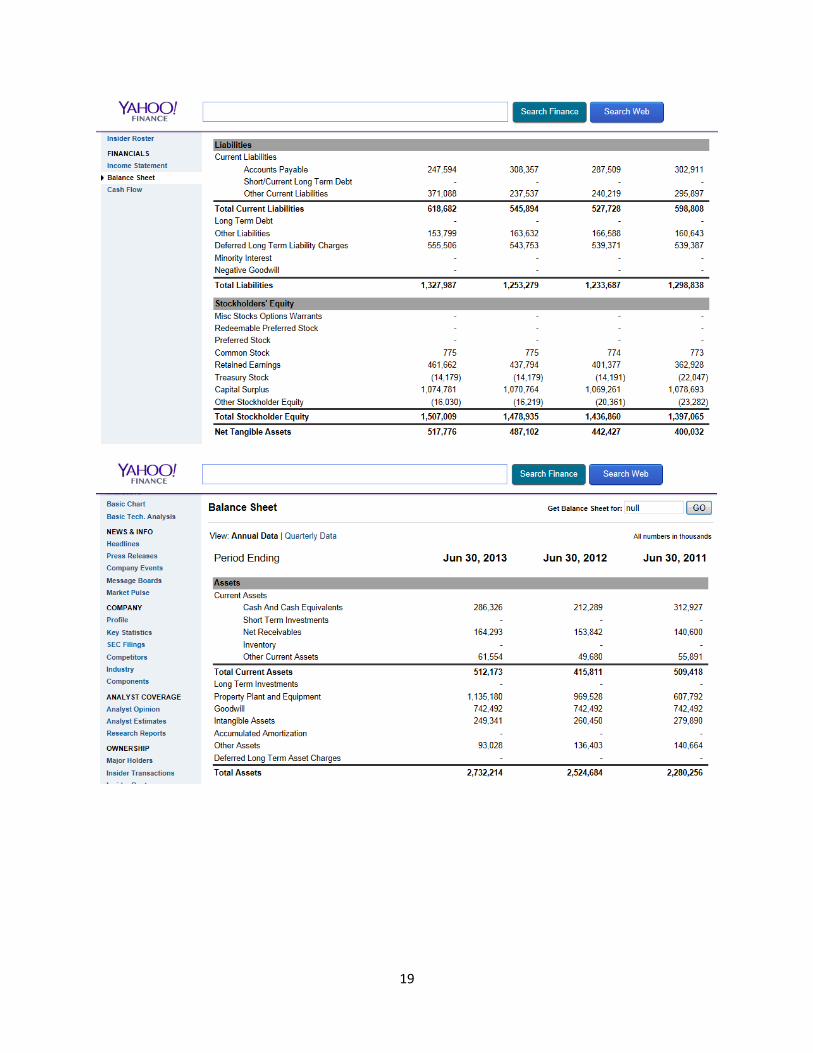
Balance Sheet Quarterly Data and Annual Data…………………………………………17
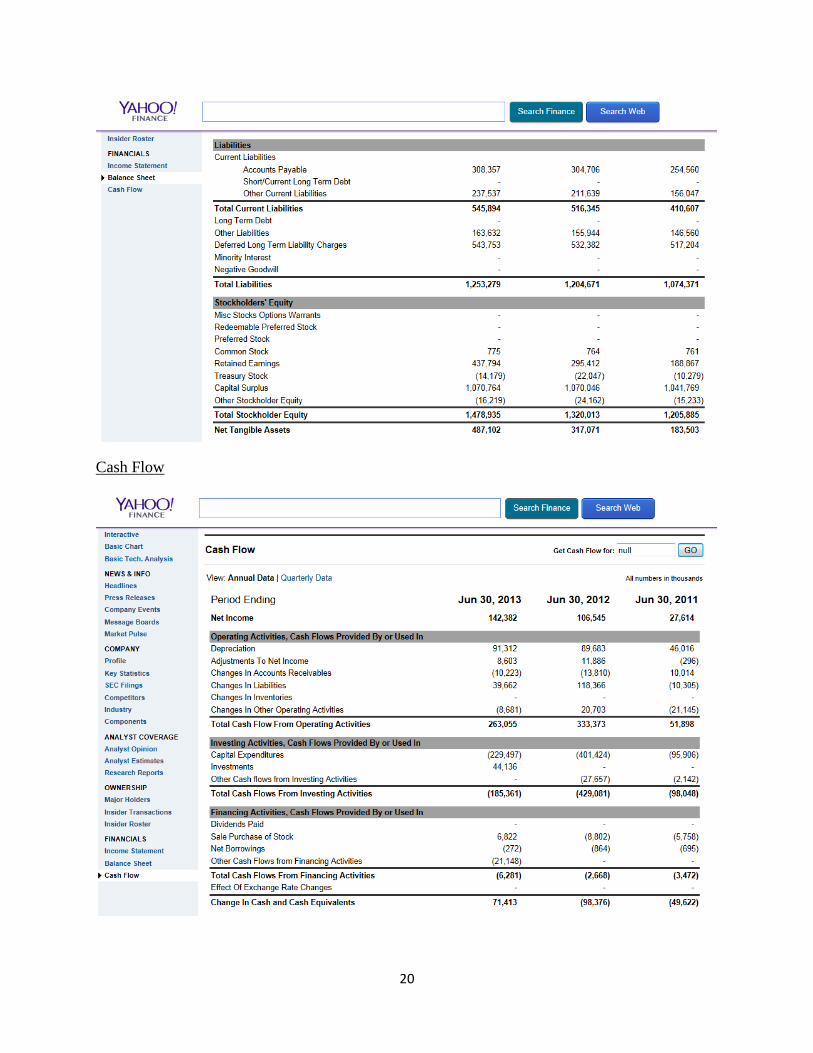
Cash Flow……………………………………………………………………………..…20
References………………………………………………………………………………………..21
3
Executive Summary
The Madison Square Garden Company (MSGC) used its brand power to generate
substantial revenue from three (3) sources; Media (50%), Sports (31%) and Entertainment
(19%). MSGC’s revenues increased during the period covered in this report despite the economic
downturn as well as the NBA and NHL work stoppages. Expenses during this same period
increased due to renovations to Madison Square Garden Arena which began in 2010.
Dependency on the economy is MSGC’s most potential weakness. A strength of MSGC
is its strong cash position. During the past economic downturn, MSGC choose to invest in itself
using company generated funds (Cash and Cash Equivalents) to finance state-of-the-art
improvements to “The World’s Most Famous Arena”. Another strength of the company is its
intangible assets. To some companies, heavy intangible assets are a weakness. In MSGC’s case,
its name recognition is actually a strength because of The Rockettes Radio City Music
Spectacular, New York Knicks and New York Rangers. Another major strength of the company
is its history and its location in New York City.
The company’s aversion to debt had only minor effects on its financial position over the
three (3) periods covered in this report. Their cash position is improving. More importantly,
MSGC is not burdened with debt or interest carrying expenses. Both revenue growth and the
collection of those revenues are healthy. Profitability continues to grow for this sports, media &
entertainment icon.
4
Company Profile
Mission Statement
“To be the most respected sports, media and entertainment company in the world by
combining the strength of our brands with the talent, character and diversity of our people. We
create exceptional experiences for our customers while delivering superior business
performance” (The Madison Square Garden Company, 2013).
Objectives
Build iconic brands that set the standard for excellence and innovation.
Forge deep connections with diverse and passionate audiences.
Deliver exceptional experiences that endure for generations.
Values
Integrity.
Passion.
Collaboration.
Innovation.
Excellence.
Leadership.
Respect.
Responsibility.
History of the Madison Square Garden Company
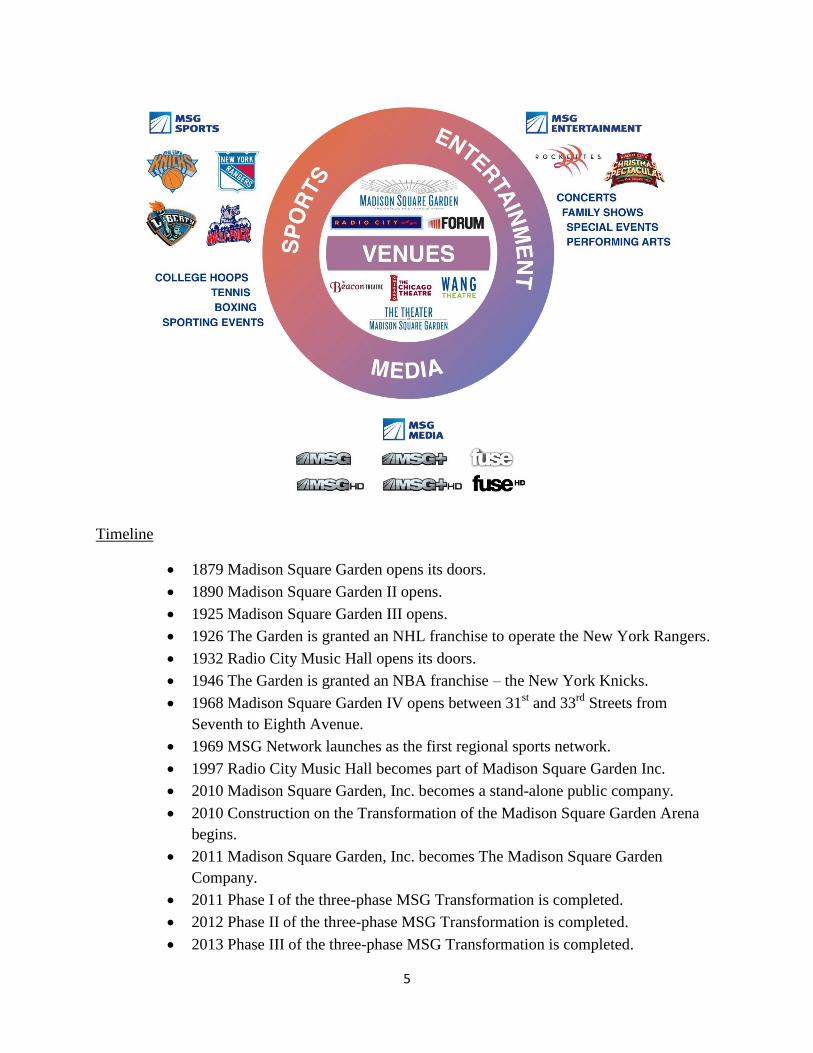
MSGC is an entertainment and promotion company located in New York, NY. It has
been known by this name since 2011 when Madison Square Garden, Inc. became The Madison
Square Garden Company. MSGC’s business grew from the venue, Madison Square Garden
which opened in 1879. This venue has been called, “The World’s Most Famous Arena” and is
one of the many brands of the company. There are three business segments that, together, make
MSGC. These segments are sports, entertainment and media and include brands such as the New
York Knicks, the New York Rangers, MSG Networks, Fuse, Madison Square Garden, Radio
City Music Hall, and The Rockettes (The Madison Square Garden Company, 2013).
5
Timeline
1879 Madison Square Garden opens its doors.
1890 Madison Square Garden II opens.
1925 Madison Square Garden III opens.
1926 The Garden is granted an NHL franchise to operate the New York Rangers.
1932 Radio City Music Hall opens its doors.
1946 The Garden is granted an NBA franchise – the New York Knicks.
1968 Madison Square Garden IV opens between 31st and 33
rd Streets from
Seventh to Eighth Avenue.
1969 MSG Network launches as the first regional sports network.
1997 Radio City Music Hall becomes part of Madison Square Garden Inc.
2010 Madison Square Garden, Inc. becomes a stand-alone public company.
2010 Construction on the Transformation of the Madison Square Garden Arena
begins.
2011 Madison Square Garden, Inc. becomes The Madison Square Garden
Company.
2011 Phase I of the three-phase MSG Transformation is completed.
2012 Phase II of the three-phase MSG Transformation is completed.
2013 Phase III of the three-phase MSG Transformation is completed.
6
Economic Issues
As a whole, MSGC faces the same economic issue that other entertainment companies
face: the recession. The success of the business depends on the ability and willingness of
consumers and businesses to purchase tickets, to spend on concessions and merchandise and the
revenues of advertising and sponsorships. In October 2013, the unemployment rate was 7.3%
(US Department of Labor, 2013). This is almost double the unemployment rate of October 2006
which was 4.7%. Because of this high unemployment rate, people may cut back on the amount
of money they spend on entertainment and other leisure activities. The company’s 2013 10K
annual report states that the performance of the segments and the company is, “dependent, to a
large extent, on general U.S. and global economic conditions, including capital market
conditions, the impact of direct competition, our ability to manage our businesses effectively, the
degree to which audiences and fans attend events hosted at our venues, and our relative strength
in the marketplace, both with suppliers and customers.” (The Madison Square Garden Company,
2013, pg. 47) The report goes on to state that the challenges facing both the U.S. and global
economies may lead to lower attendance, lower demand for suite licenses, fewer sponsorships,
fewer event bookings and lower television advertising revenues.
Despite the poor state of the economy, MSGC has spent almost $1 billon to refurbish
Madison Square Garden beginning in 2010. This refurbishment was used to, “maintain the
competitive positions of The Garden and other venues” and update to state-of-the-art
technologies (The Madison Square Garden Company, 2013, pg. 23).
Each business segment operated by MSGC presents its own unique economic issues and
risk factors that could affect success. There are also potential issues and risks that affect the
company as a whole.
Sports Business
The performance and/or popularity of the sports franchises.
Competition from other live sporting events, sporting events on TV, radio, the
internet and mobile devices.
Basketball and hockey player selection and salaries.
Actions of the NBA and NHL as well as their respective player associations.
Injuries to players.
Entertainment Business
Competition from other leisure activities including TV, radio, movies, sporting
events, other live performances and the internet.
Success of the Radio City Christmas Spectacular.
The ability to attract concerts, family shows and other events.
Development of new live productions and additions of new venues along with the
knowledge that there is no guarantee of success for these productions and these
venues.
7
Media Business
Competition for viewers and advertisers with other networks, pay-per-view, video
on demand, other content offered by cable providers, radio, movies, home video
and the internet.
Technology developments.
Ability to adapt to new content distribution platforms.
Changes in consumer behavior.
Agreements with program distributors.
Sale of advertising time and the factors that affect revenue.
Ability to obtain programming and the appeal of that programming.
All three segments
Economic downturn and financial instability.
Severe weather.
Terrorist activity or the threat of it.
Popularity and success of sports teams.
Renovation of The Garden.
May require financing to fund operations and capital expenditures.
Risk of injuries and accidents at venues.
8
Revenue and Expenditure Summary
Revenues
There are multiple revenue sources that come from all three business segments of MSGC.
In the 2013 fiscal year, the media segment accounted for almost 50% of the revenues for the
company. The two main sources of revenues from the media segment are affiliation fees and
advertising. Affiliation fees are revenues earned from distributors who carry programming for
MSG media. Advertising revenues are earned through the sale of commercial time to advertisers
during programming and through the sale of program sponsorship rights.
Revenue sources from the entertainment segment accounted for 19% of the revenues for
the 2013 fiscal year. Ticket sales is the main source of revenue and include tickets to the public
through the box office, web sites, ticketing agencies, and group sales. Another source of revenue
is the venue license fees that third-party promoters of events have to pay in order for them to
hold an event at one of the venues owned by MSGC. These fees include cost of renting the venue
and the cost of providing a number of staff including box office staff, ushers and security.
Concession sales of food and beverage along with the sale of merchandise relating to the
production taking place at a certain venue account for more revenue sources. The final source of
revenue for the entertainment segment is through the sale of signage space and sponsorship
rights.
The final segment, sports, accounted for 31% of the revenues for the 2013 fiscal year.
Like the entertainment segment, ticket sales accounts for the largest source of revenue for the
sports segment. Along with ticket sales, live sporting events also generate revenue from suite
licenses, venue licenses, and facility fees and charges. Revenue is also brought in from the sale
of telecast rights for the home and away games of the sports teams owned by MSGC. The sale
of concessions, merchandise and venue signage and sponsorships brings in money for the sports
segment much the same way it brings in money for the entertainment department.
Expenses
For the media segment, there are three main expenses. MSGC must pay a fee to acquire
the rights to carry other professional sports teams on their television networks. Rights must also
be purchased to carry other sporting events, movies, concerts and specials. Another main
expense include other direct programming costs which include, “salaries to on-air personalities,
producers, directors, technicians, writers and technical staff, as well as expenses associated with
location costs and maintaining studios and transmission facilities” (The Madison Square Garden
Company, 2013, pg. 39). The final expense for the media segments are the costs incurred from
marketing and advertising the business and programs through newspapers, TV, radio and online.
Payment to the actors, dancers, singers, musicians and entertainers is the primary expense
for the entertainment segment of MSGC. The costs of sets, lighting, display technologies,
special effects and sound are also expenses that MSGC incurs. Payment to box office personnel,
stagehands, ticket takers, ushers and security staff are also made when productions take place at
a venue owned by MSGC. When a production leaves a venue owned by MSGC and tours the
country, MSGC pays the costs associated with travel, equipment and fees and expenses for the
use of third-party venues. The final expense for the entertainment segment is the cost of
promoting productions and other events.
9
There are numerous expenses that the sports segment has to incur. The main expense
MSGC sports incurs is player salaries, escrow system/revenue sharing and NBA luxury tax.
Other team operating expenses include travel, equipment maintenance, player insurance and
payment for staff who work sporting events. The sports segment also has to pay a portion of the
expenses associated with the ownership, lease, maintenance and operation of certain venues (The
Madison Square Garden Company, 2013, pg. 46).
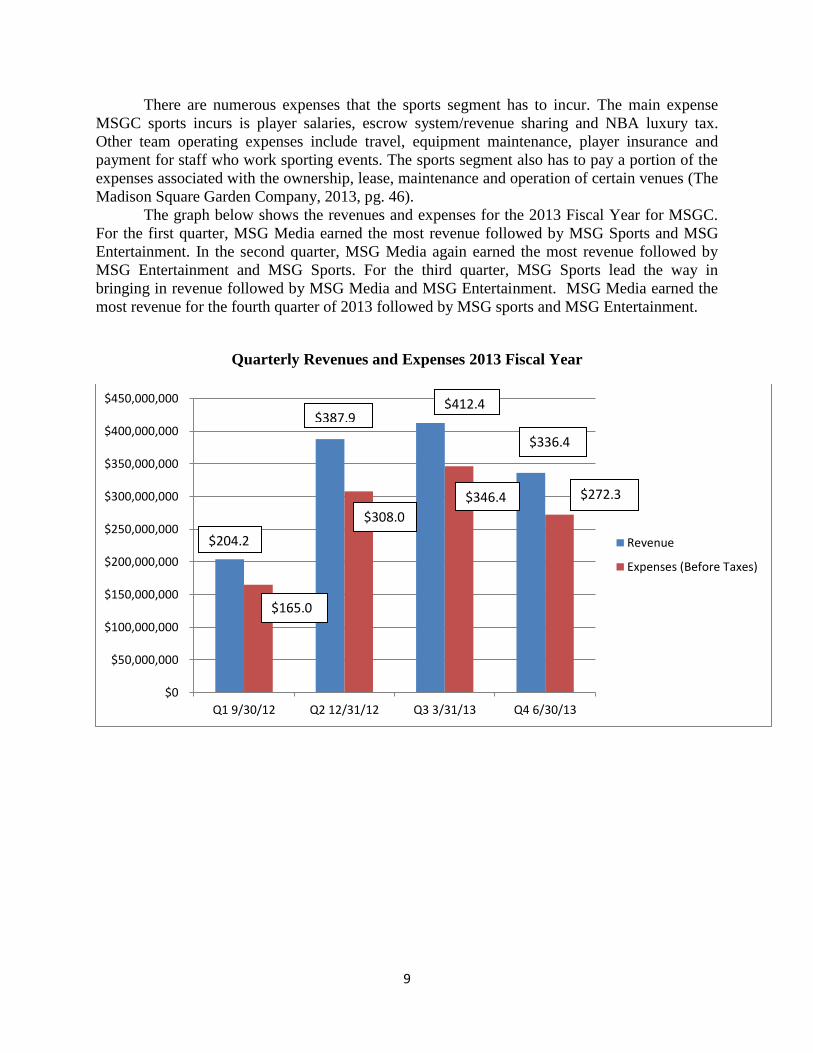
The graph below shows the revenues and expenses for the 2013 Fiscal Year for MSGC.
For the first quarter, MSG Media earned the most revenue followed by MSG Sports and MSG
Entertainment. In the second quarter, MSG Media again earned the most revenue followed by
MSG Entertainment and MSG Sports. For the third quarter, MSG Sports lead the way in
bringing in revenue followed by MSG Media and MSG Entertainment. MSG Media earned the
most revenue for the fourth quarter of 2013 followed by MSG sports and MSG Entertainment.
Quarterly Revenues and Expenses 2013 Fiscal Year
$0
$50,000,000
$100,000,000
$150,000,000
$200,000,000
$250,000,000
$300,000,000
$350,000,000
$400,000,000
$450,000,000
Q1 9/30/12 Q2 12/31/12 Q3 3/31/13 Q4 6/30/13
Revenue
Expenses (Before Taxes)
$204.2
$387.9 $412.4
$336.4
$165.0
$308.0
$346.4 $272.3
10
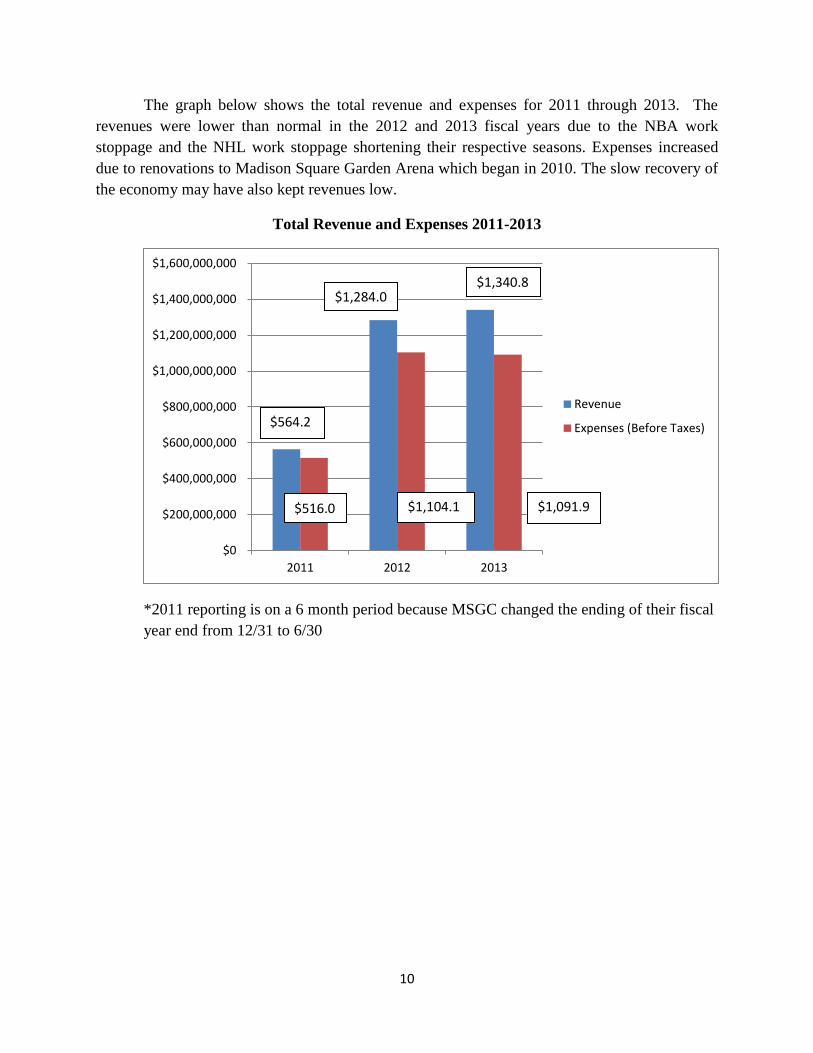
The graph below shows the total revenue and expenses for 2011 through 2013. The
revenues were lower than normal in the 2012 and 2013 fiscal years due to the NBA work
stoppage and the NHL work stoppage shortening their respective seasons. Expenses increased
due to renovations to Madison Square Garden Arena which began in 2010. The slow recovery of
the economy may have also kept revenues low.
Total Revenue and Expenses 2011-2013
*2011 reporting is on a 6 month period because MSGC changed the ending of their fiscal
year end from 12/31 to 6/30
$0
$200,000,000
$400,000,000
$600,000,000
$800,000,000
$1,000,000,000
$1,200,000,000
$1,400,000,000
$1,600,000,000
2011 2012 2013
Revenue
Expenses (Before Taxes)
$1,340.8 $1,284.0
$564.2
$1,091.9 $1,104.1 $516.0
11
Assets and Liabilities Summary
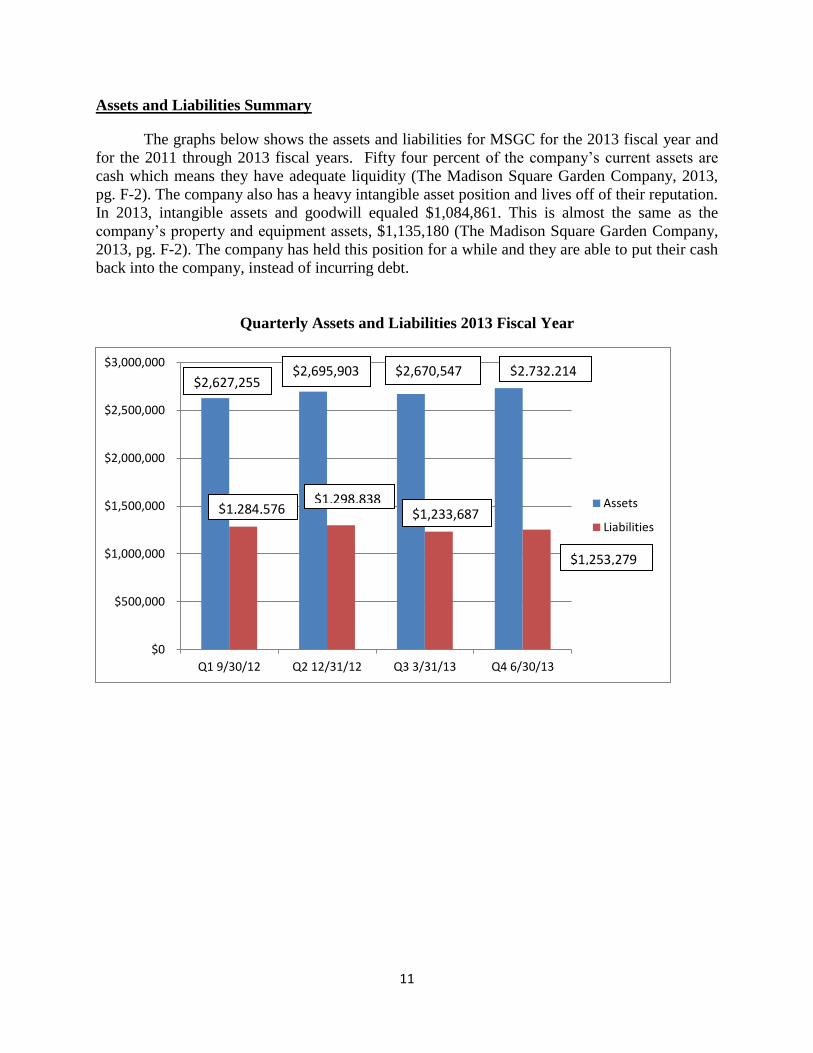
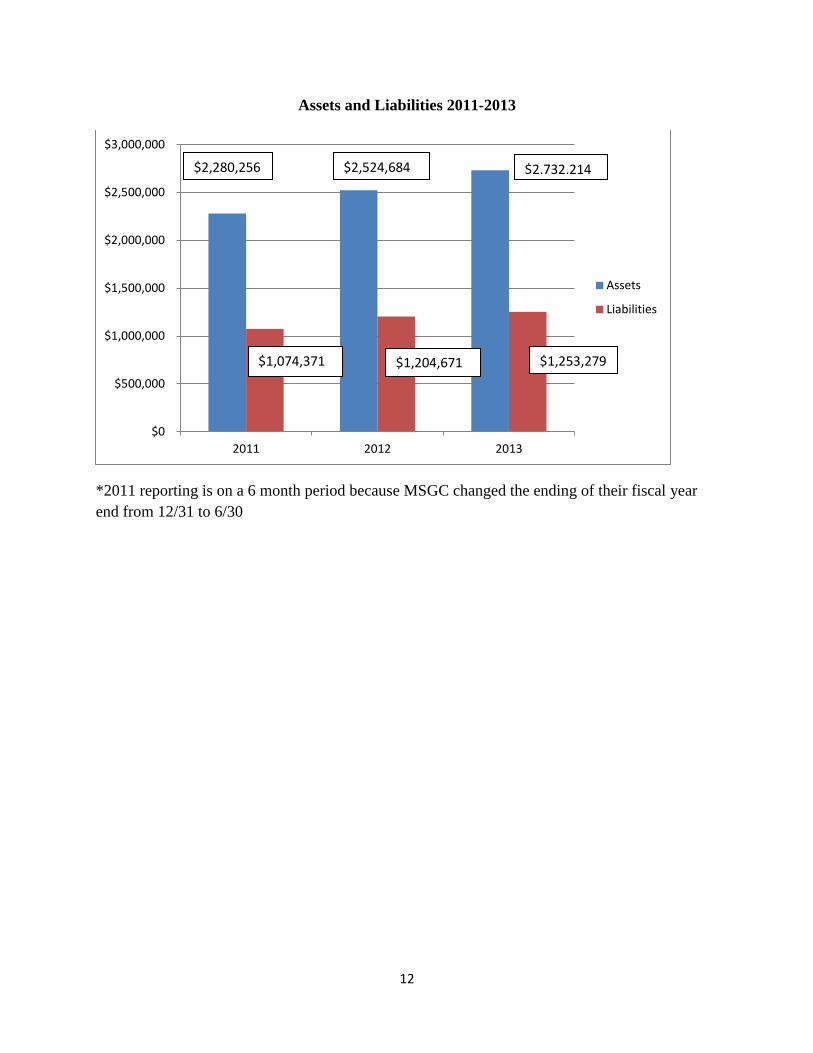
The graphs below shows the assets and liabilities for MSGC for the 2013 fiscal year and
for the 2011 through 2013 fiscal years. Fifty four percent of the company’s current assets are
cash which means they have adequate liquidity (The Madison Square Garden Company, 2013,
pg. F-2). The company also has a heavy intangible asset position and lives off of their reputation.
In 2013, intangible assets and goodwill equaled $1,084,861. This is almost the same as the
company’s property and equipment assets, $1,135,180 (The Madison Square Garden Company,
2013, pg. F-2). The company has held this position for a while and they are able to put their cash
back into the company, instead of incurring debt.
Quarterly Assets and Liabilities 2013 Fiscal Year
$0
$500,000
$1,000,000
$1,500,000
$2,000,000
$2,500,000
$3,000,000
Q1 9/30/12 Q2 12/31/12 Q3 3/31/13 Q4 6/30/13
Assets
Liabilities
$2,627,255
$1,284,576
$2,695,903
$1,298,838
$2,670,547
$1,233,687
$2,732,214
$1,253,279
12
Assets and Liabilities 2011-2013
*2011 reporting is on a 6 month period because MSGC changed the ending of their fiscal year
end from 12/31 to 6/30
$0
$500,000
$1,000,000
$1,500,000
$2,000,000
$2,500,000
$3,000,000
2011 2012 2013
Assets
Liabilities
$2,732,214
$1,253,279
$2,524,684
$1,204,671
$2,280,256
$1,074,371
13
Financial Analysis and Ratios
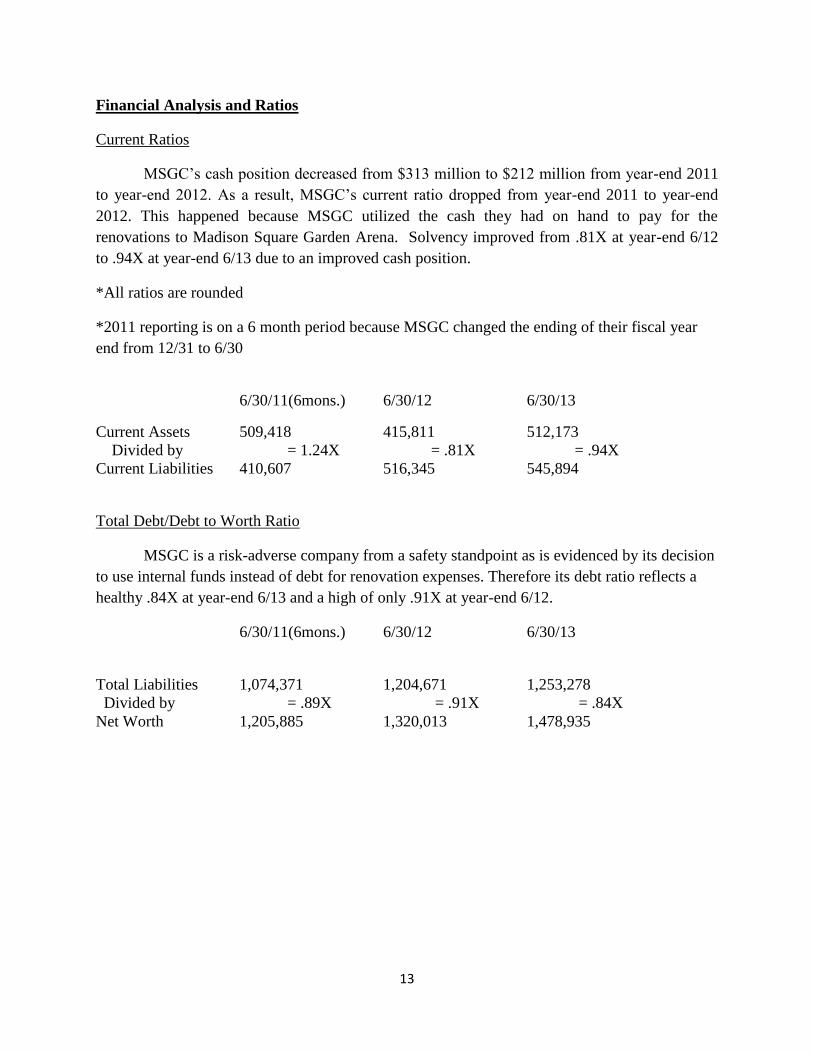
Current Ratios
MSGC’s cash position decreased from $313 million to $212 million from year-end 2011
to year-end 2012. As a result, MSGC’s current ratio dropped from year-end 2011 to year-end
2012. This happened because MSGC utilized the cash they had on hand to pay for the
renovations to Madison Square Garden Arena. Solvency improved from .81X at year-end 6/12
to .94X at year-end 6/13 due to an improved cash position.
*All ratios are rounded
*2011 reporting is on a 6 month period because MSGC changed the ending of their fiscal year
end from 12/31 to 6/30
6/30/11(6mons.) 6/30/12 6/30/13
Current Assets 509,418 415,811 512,173
Divided by = 1.24X = .81X = .94X
Current Liabilities 410,607 516,345 545,894
Total Debt/Debt to Worth Ratio
MSGC is a risk-adverse company from a safety standpoint as is evidenced by its decision
to use internal funds instead of debt for renovation expenses. Therefore its debt ratio reflects a
healthy .84X at year-end 6/13 and a high of only .91X at year-end 6/12.
6/30/11(6mons.) 6/30/12 6/30/13
Total Liabilities 1,074,371 1,204,671 1,253,278
Divided by = .89X = .91X = .84X
Net Worth 1,205,885 1,320,013 1,478,935
14
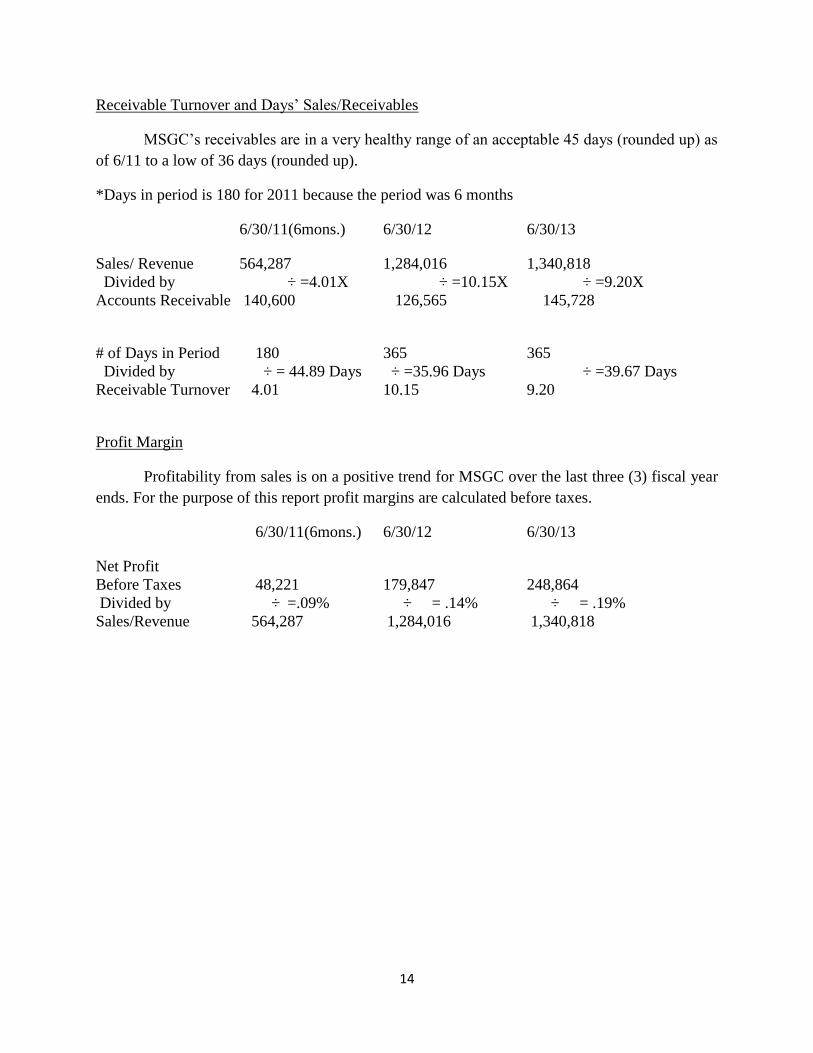
Receivable Turnover and Days’ Sales/Receivables
MSGC’s receivables are in a very healthy range of an acceptable 45 days (rounded up) as
of 6/11 to a low of 36 days (rounded up).
*Days in period is 180 for 2011 because the period was 6 months
6/30/11(6mons.) 6/30/12 6/30/13
Sales/ Revenue 564,287 1,284,016 1,340,818
Divided by ÷ =4.01X ÷ =10.15X ÷ =9.20X
Accounts Receivable 140,600 126,565 145,728
# of Days in Period 180 365 365
Divided by ÷ = 44.89 Days ÷ =35.96 Days ÷ =39.67 Days
Receivable Turnover 4.01 10.15 9.20
Profit Margin
Profitability from sales is on a positive trend for MSGC over the last three (3) fiscal year
ends. For the purpose of this report profit margins are calculated before taxes.
6/30/11(6mons.) 6/30/12 6/30/13
Net Profit
Before Taxes 48,221 179,847 248,864
Divided by ÷ =.09% ÷ = .14% ÷ = .19%
Sales/Revenue 564,287 1,284,016 1,340,818
15
Future Trends
Due to their favorable cash position MSGC can concentrate on revenue growth. The
improvements to the Madison Square Garden Arena help keep the company competitive and
have already helped earn back the funds the company spent on improvements. MSGC lives off
its reputation.
Increasing revenue is the key to the company’s survival and the company is dependent on
the economy. Another opportunity for revenue growth lies in the expansion of the Atlantic Coast
Conference (ACC). If rumors are true, the ACC Basketball Tournament will one day be held at
Madison Square Garden Arena. Even though the economy is recovering slowly, it is recovering
and that is good for MSGC. MSGC’s decision in 2010 to refurbish will pay dividends in the
future.
16
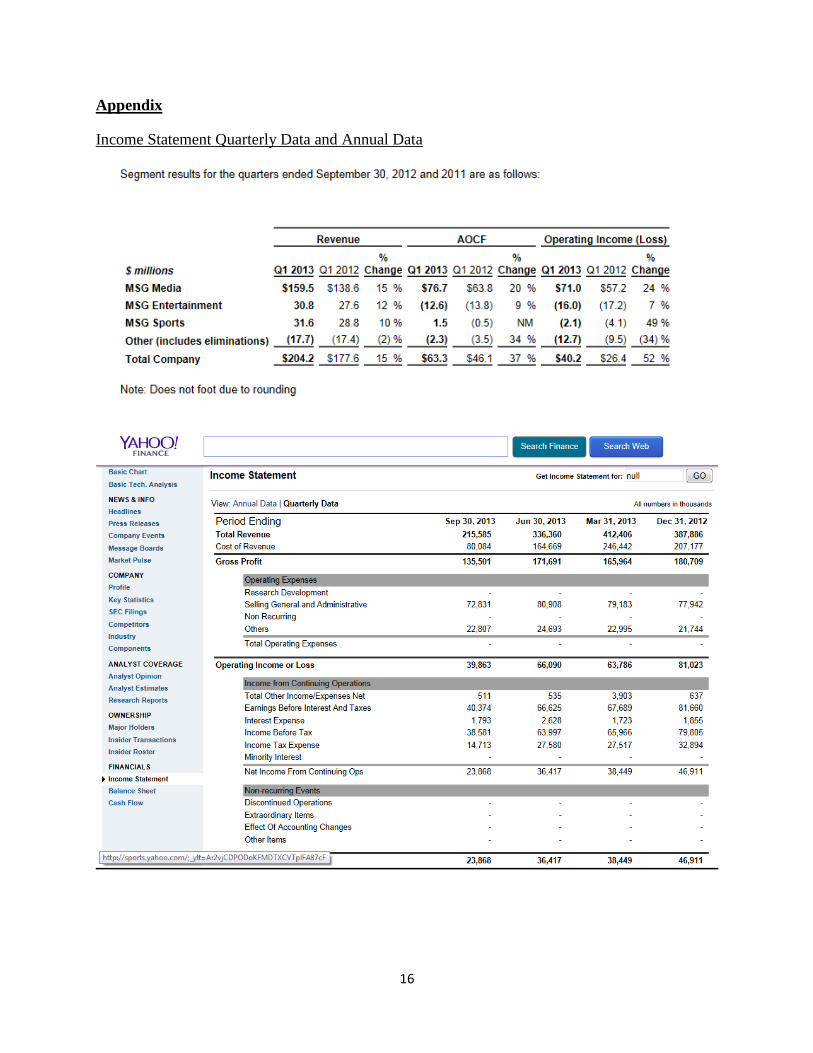
Appendix
Income Statement Quarterly Data and Annual Data
17
Balance Sheet Quarterly Data and Annual Data
18
19
20
Cash Flow
21
References
NASDAQ OMX GlobeNewswire. (2012, November 2). The madison square garden
company reports results for fiscal 2013 first quarter. Retrieved from NASDAQ OMX Media
SuiteLearning & Support website: http://globenewswire.com/news-
release/2012/11/02/502046/10010675/en/The-Madison-Square-Garden-Company-Reports-
Results-for-Fiscal-2013-First-Quarter.html
The Madison Square Garden Company. (2013, August 21). Form 10-K. Retrieved from
http://investor.msg.com/secfiling.cfm?filingID=1469372-13-9&CIK=1469372
The Madison Square Garden Company. (2013, ). Mission and values. Retrieved from The
Madison Square Garden Company website:
http://www.themadisonsquaregardencompany.com/our-company/mission-and-values.html
The Madison Square Garden Company. (2013, ). Our brands. Retrieved from The
Madison Square Garden Company website:
http://www.themadisonsquaregardencompany.com/our-brands.html
The Madison Square Garden Company. (2013, ). History. Retrieved from The Madison
Square Garden Company website: http://www.themadisonsquaregardencompany.com/our-
company/history.html
United States Department of Labor. (2013, November 13). Labor force statistics from the
current population survey. Retrieved from Databases, Tables & Calculators by Subject website:
http://data.bls.gov/timeseries/LNS14000000
Yahoo!. (2013, November 15). The madison square garden company. Retrieved from
Yahoo! Finance website: http://finance.yahoo.com/q?s=MSG&ql=1


![Company Presentation [Company Update]](https://img.pdfslide.tips/doc/110x75/577cb1c71a28aba7118bdd5f/company-presentation-company-update.jpg)
