Embed Size (px)
Citation preview
Compiled by:Dr. Avi RosenfeldBased on:
http://my.ilstu.edu/~asharm4/432/432.ppthttp://www.sts.tu-harburg.de/teaching/ws-97.98/
OOA+D/4-4-Class-Advanced.ps " דיין ר מד חומר
http://www3.interscience.wiley.com:8100/legacy/college/dennis/0471073229/ppt/ch15.ppt
UMLan overview
UML Topics
1. The general picture
2. Use Cases
3. Class Diagrams
4. Sequence Diagram
5. State Chart Diagram
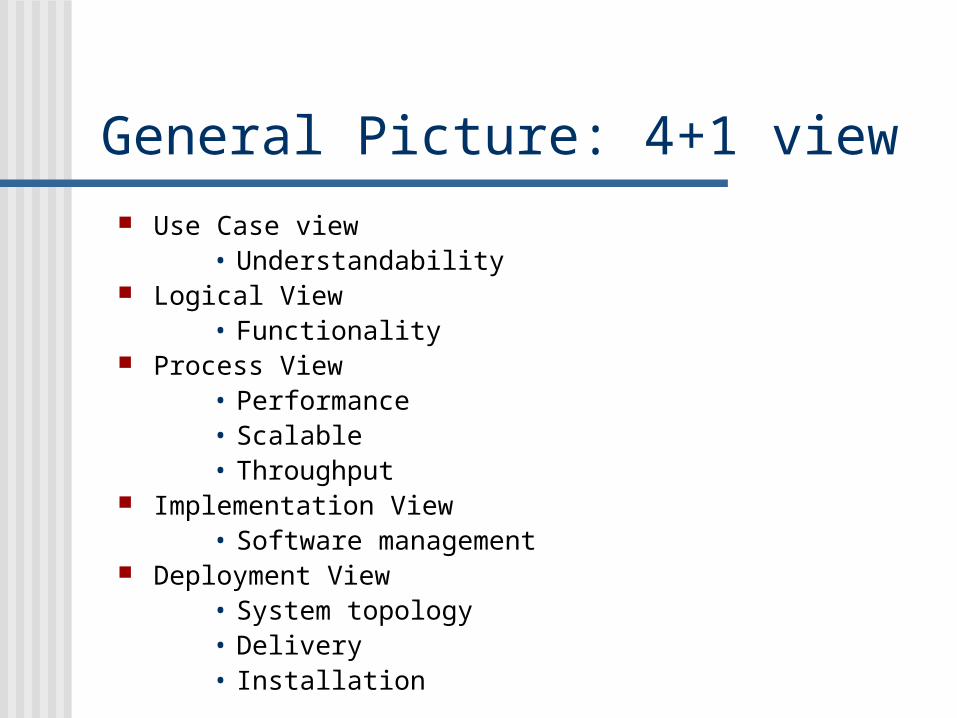
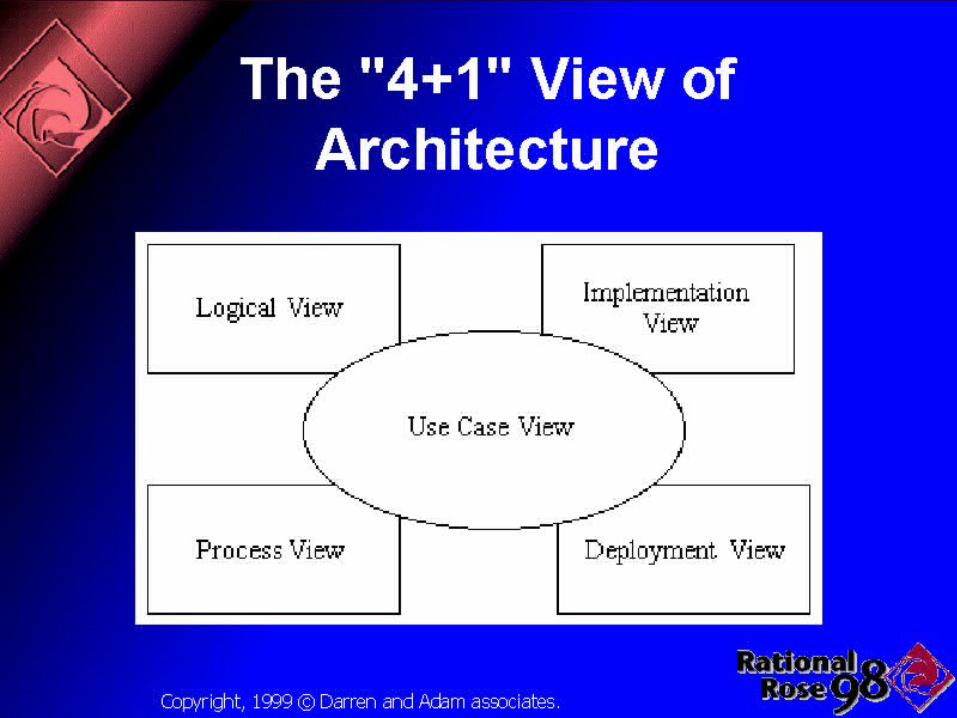
General Picture: 4+1 view Use Case view
• Understandability Logical View
• Functionality Process View
• Performance• Scalable• Throughput
Implementation View• Software management
Deployment View • System topology• Delivery• Installation
UML Diagrams
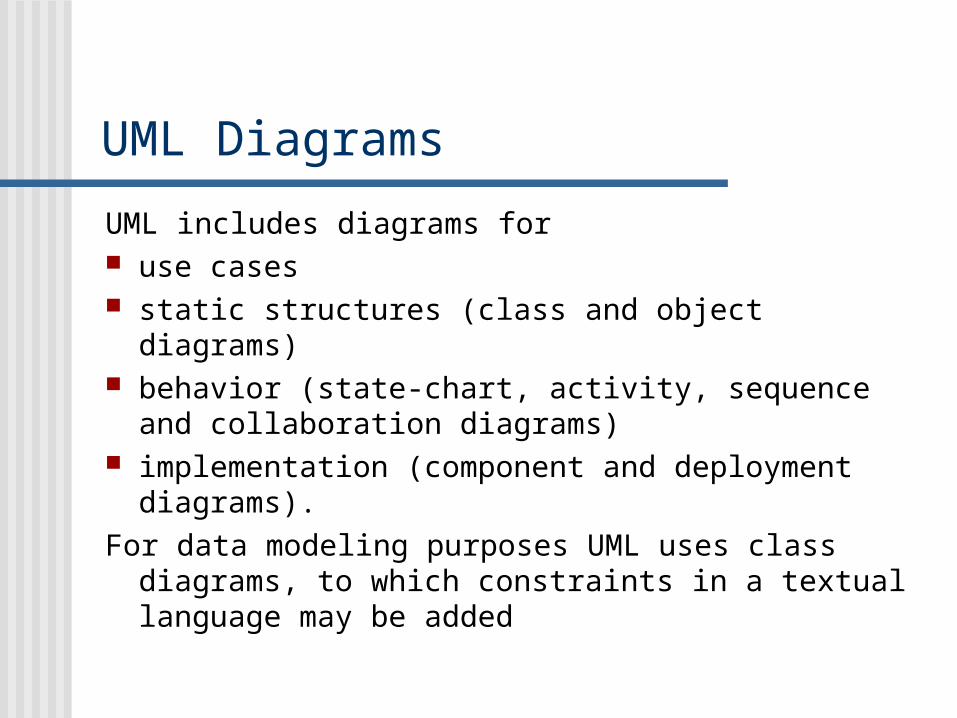
UML includes diagrams for use cases static structures (class and object diagrams) behavior (state-chart, activity, sequence and collaboration
diagrams) implementation (component and deployment diagrams).
For data modeling purposes UML uses class diagrams, to which constraints in a textual language may be added
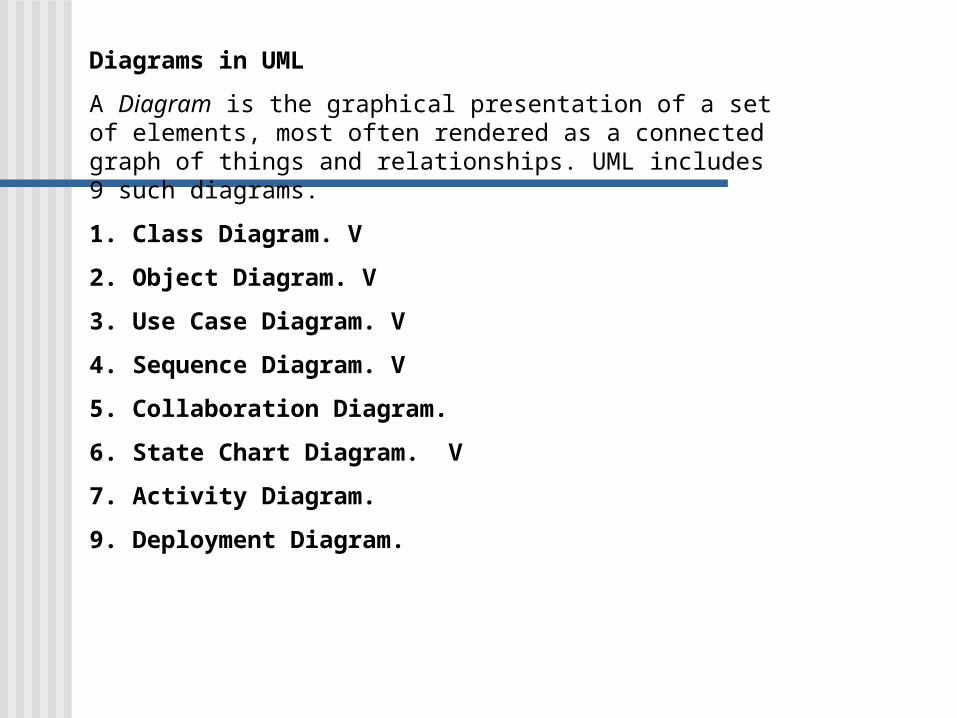
Diagrams in UML
A Diagram is the graphical presentation of a set of elements, most often rendered as a connected graph of things and relationships. UML includes 9 such diagrams.
1. Class Diagram. V
2. Object Diagram. V
3. Use Case Diagram. V
4. Sequence Diagram. V
5. Collaboration Diagram.
6. State Chart Diagram. V
7. Activity Diagram.
9. Deployment Diagram.

Class Diagrams
Class Diagrams describe the static structure of a system, or how it is structured rather than how it behaves. These diagrams contain the following elements.
• Classes, which represent entities with common characteristics or features. These features include attributes, operations and associations.
• Associations, which represent relationships that relate two or more other classes where the relationships have common characteristics or features. These attributes and operations.
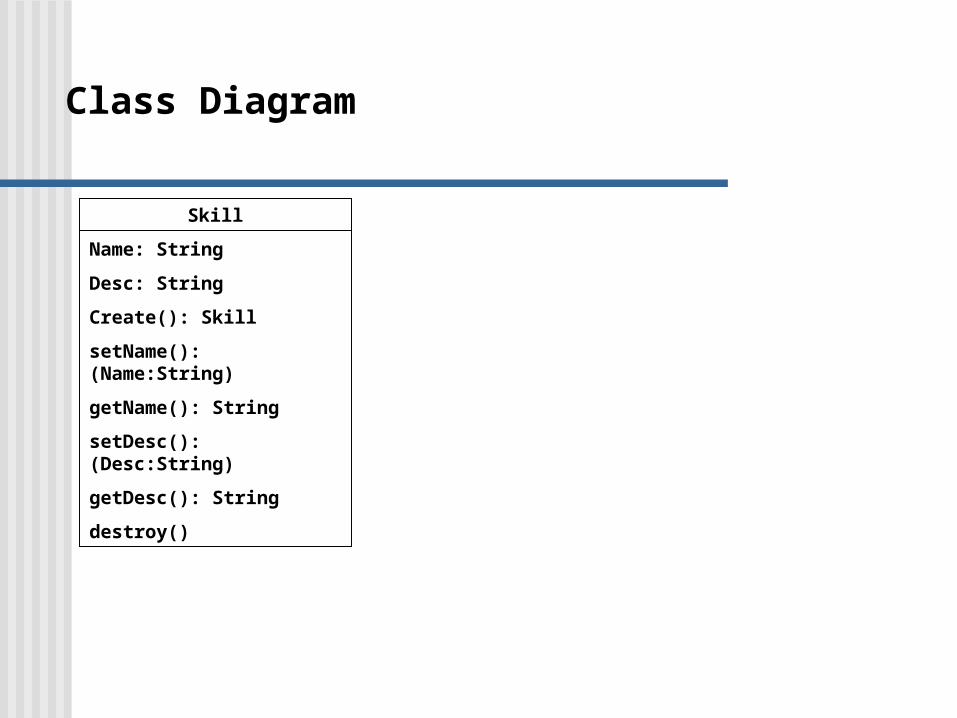
Class Diagram
Skill
Name: String
Desc: String
Create(): Skill
setName(): (Name:String)
getName(): String
setDesc(): (Desc:String)
getDesc(): String
destroy()
PowerPoint Presentation for Dennis & Haley Wixom, Systems Analysis and Design, 2nd EditionCopyright 2003 © John Wiley & Sons, Inc. All rights reserved.
15 - 9
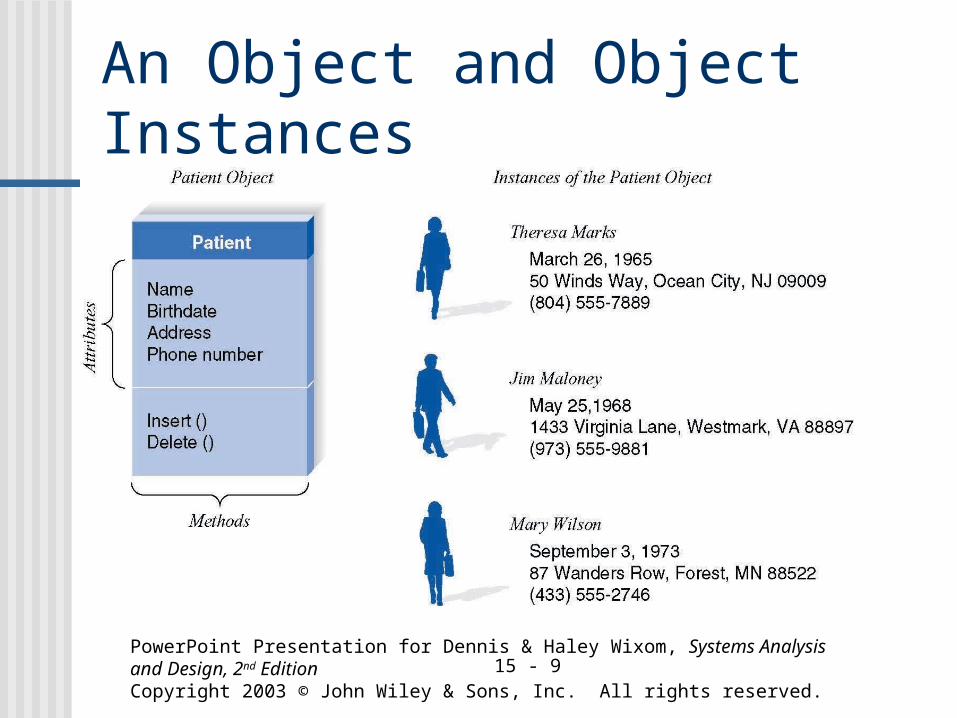
An Object and Object Instances

PowerPoint Presentation for Dennis & Haley Wixom, Systems Analysis and Design, 2nd EditionCopyright 2003 © John Wiley & Sons, Inc. All rights reserved.
15 - 10
Classes and Objects
PowerPoint Presentation for Dennis & Haley Wixom, Systems Analysis and Design, 2nd EditionCopyright 2003 © John Wiley & Sons, Inc. All rights reserved.
15 - 11
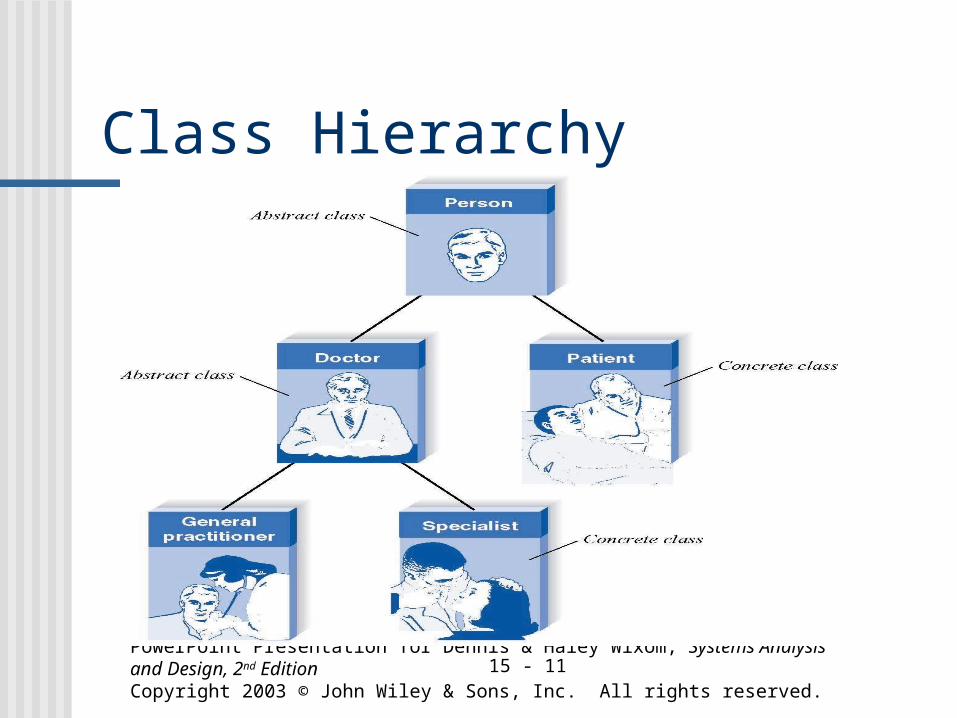
Class Hierarchy

Object Diagrams
Object Diagrams describe the static structure of a system at a particular time. Whereas a class model describes all possible situations, an object model describes a particular situation. Object diagrams contain the following elements:
• Objects, which represent particular entities. These are instances of classes.
• Links, which represent particular relationships between objects. These are instances of associations.
.
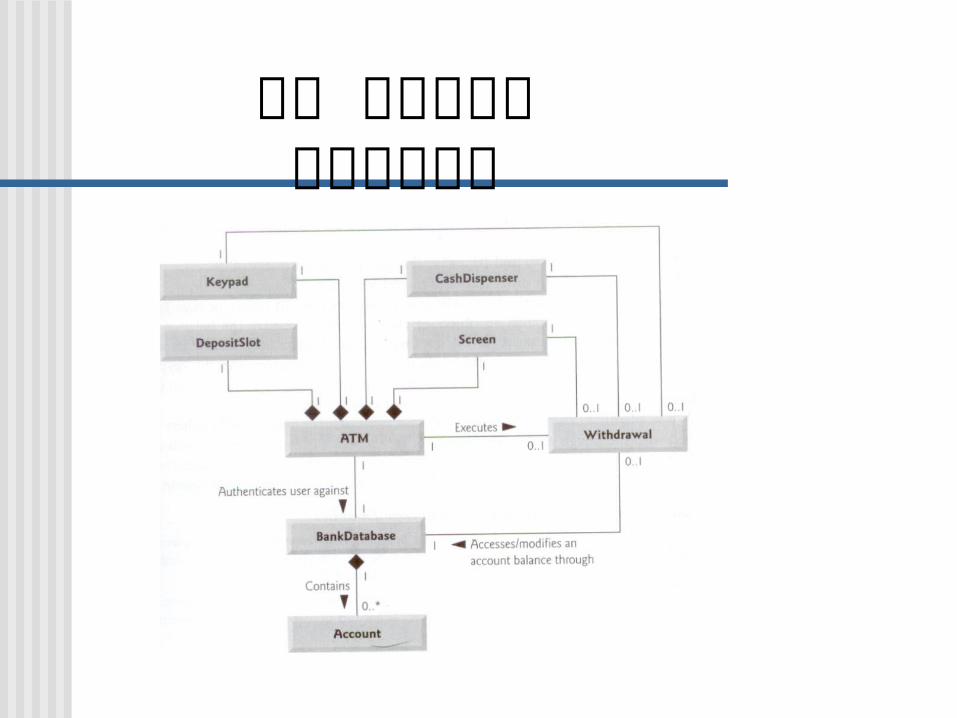
של דוגמאכספומט
PowerPoint Presentation for Dennis & Haley Wixom, Systems Analysis and Design, 2nd EditionCopyright 2003 © John Wiley & Sons, Inc. All rights reserved.
15 - 14
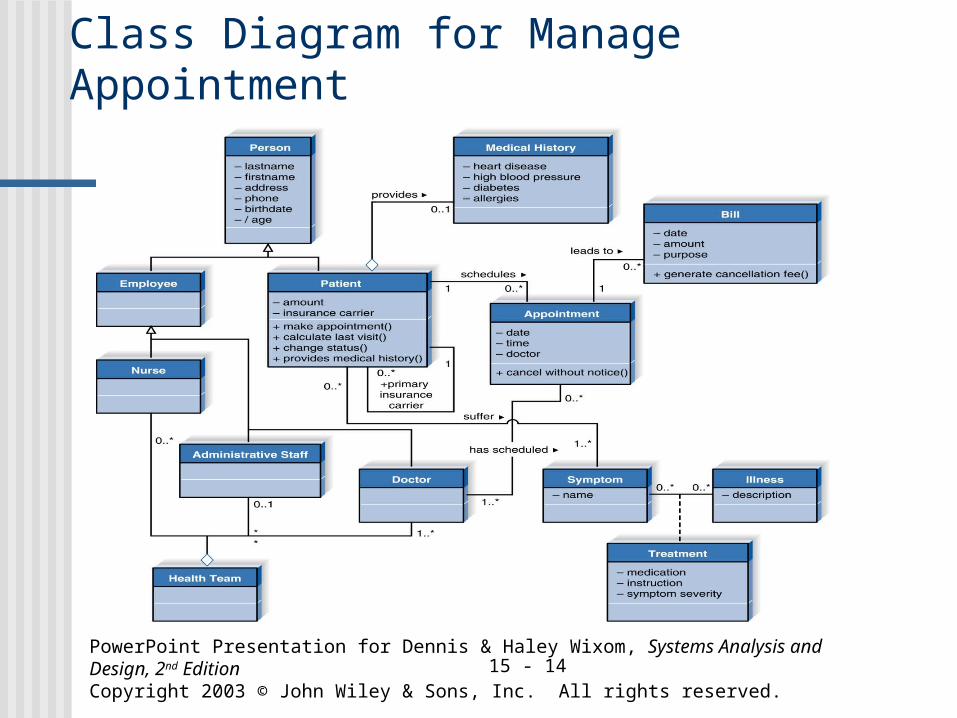
Class Diagram for Manage Appointment
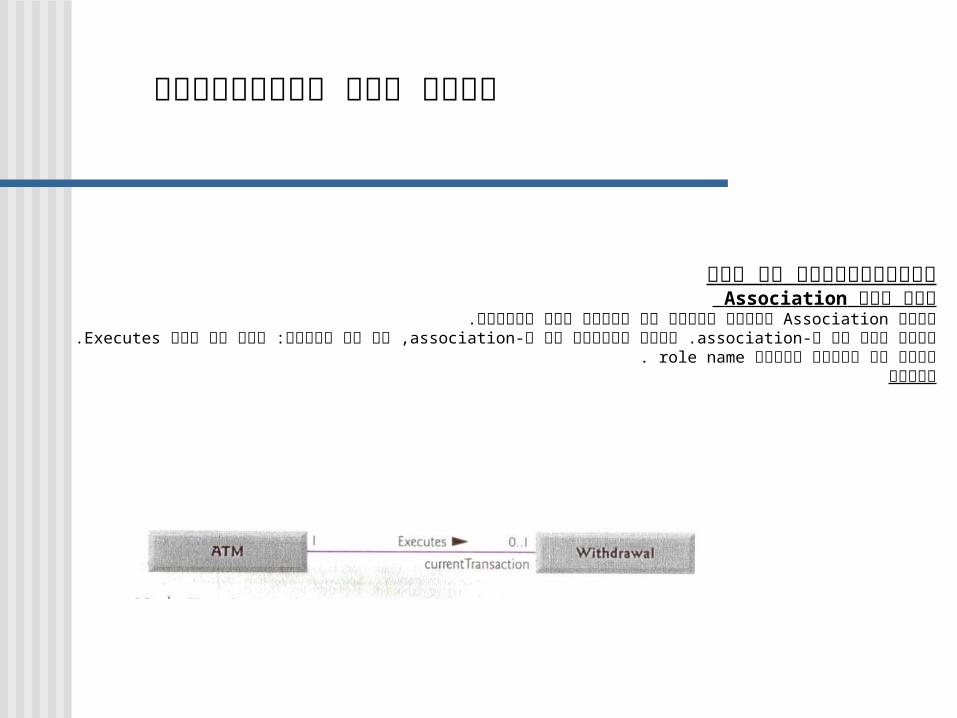
טרמינולוגיה של יחס Associationיחס בשם
ממודל בעזרת קו המקשר שתי מחלקות. Associationהיחס .Executes, יש גם כיוון: ראה את השם association. כאשר נותנים שם ל-associationאפשר לתת שם ל-
. role nameאפשר גם לציין תפקיד דוגמא
אובייקטים בין תלות
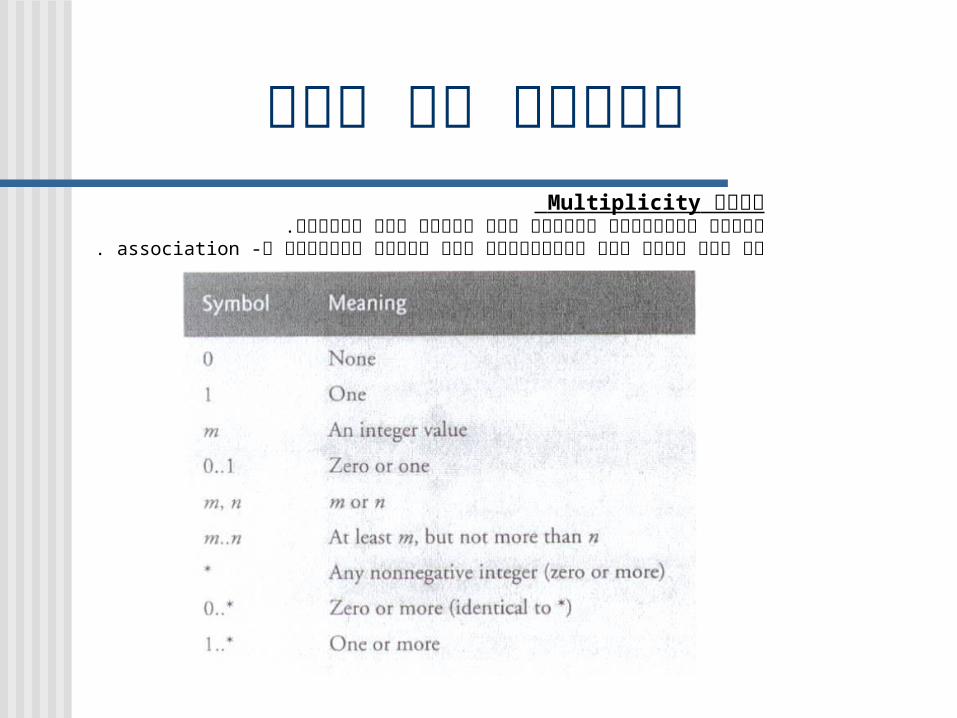
יחס יש סוגים Multiplicityמושג
ערכים שמופיעים בקצוות הקו המקשר שתי מחלקות. .associationכל ערך אומר כמה אובייקטים מכל מחלקה משתתפים ב-
PowerPoint Presentation for Dennis & Haley Wixom, Systems Analysis and Design, 2nd EditionCopyright 2003 © John Wiley & Sons, Inc. All rights reserved.
15 - 17
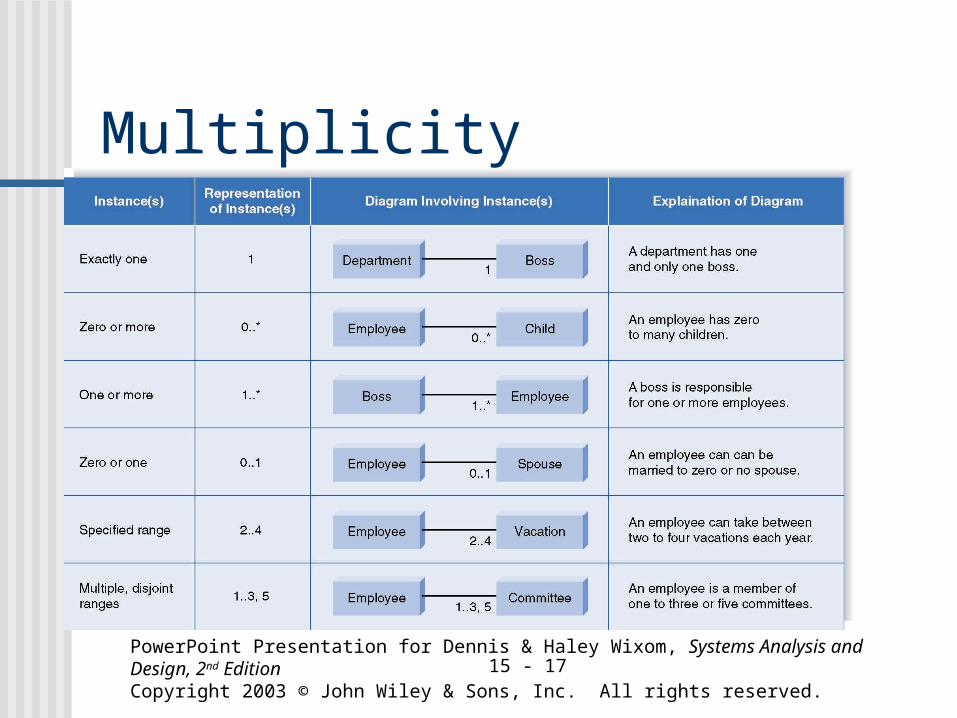
Multiplicity
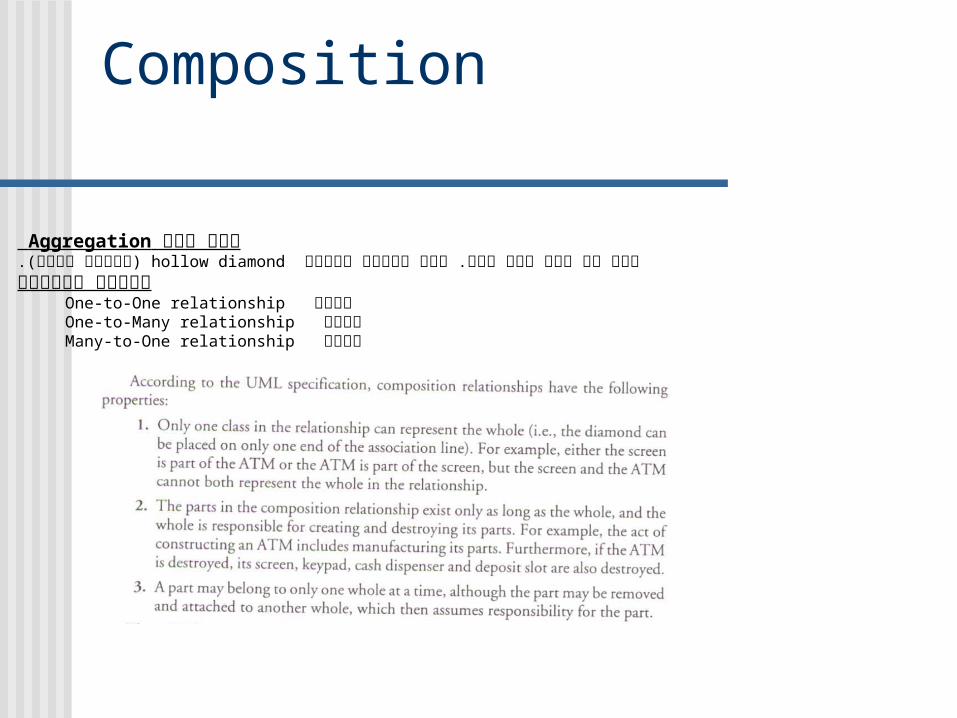
Composition
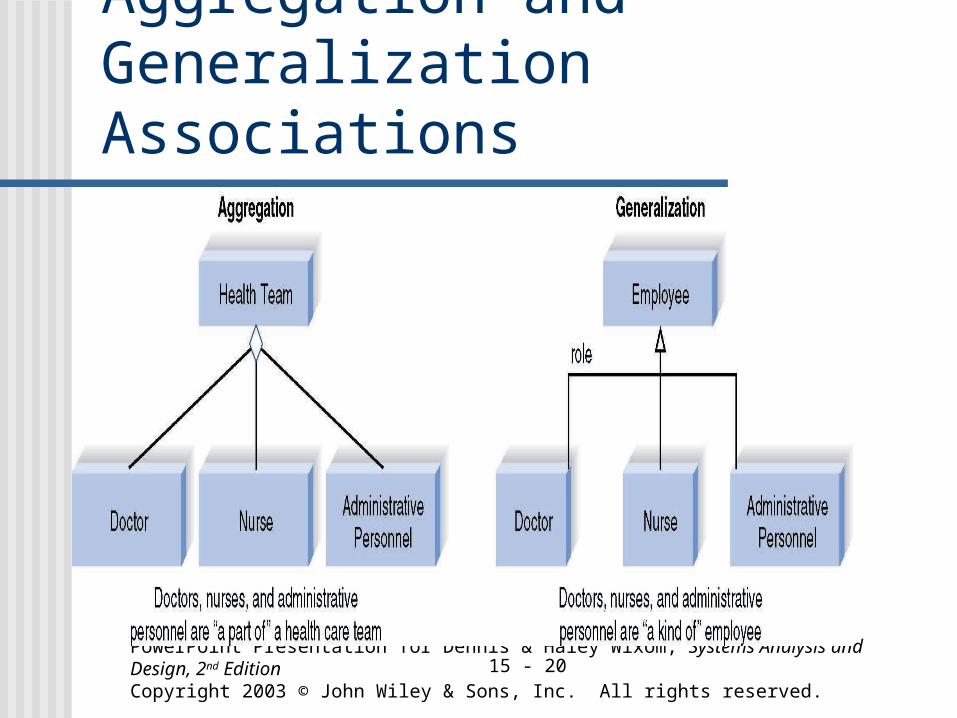
Aggregationיחס בשם )יהלום חלול(.hollow diamond יחס זה הוא יחס חלש. הוא ממודל בעזרת
רשימת היחסים One-to-One relationshipהיחס
One-to-Many relationshipהיחס Many-to-One relationshipהיחס
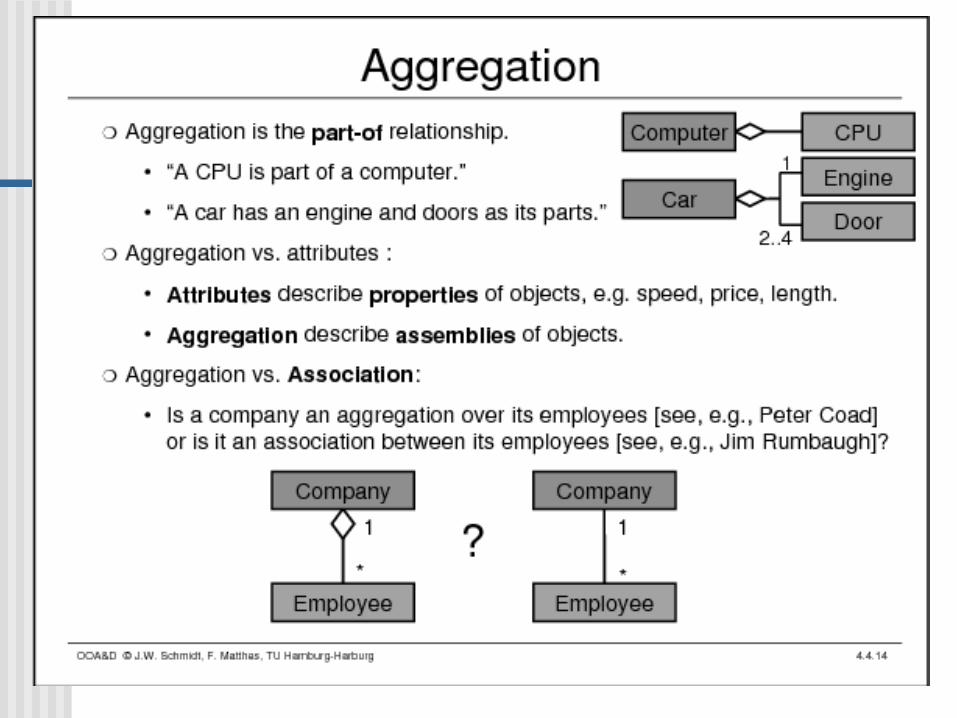
Aggregation
PowerPoint Presentation for Dennis & Haley Wixom, Systems Analysis and Design, 2nd EditionCopyright 2003 © John Wiley & Sons, Inc. All rights reserved.
15 - 20
Aggregation and Generalization Associations
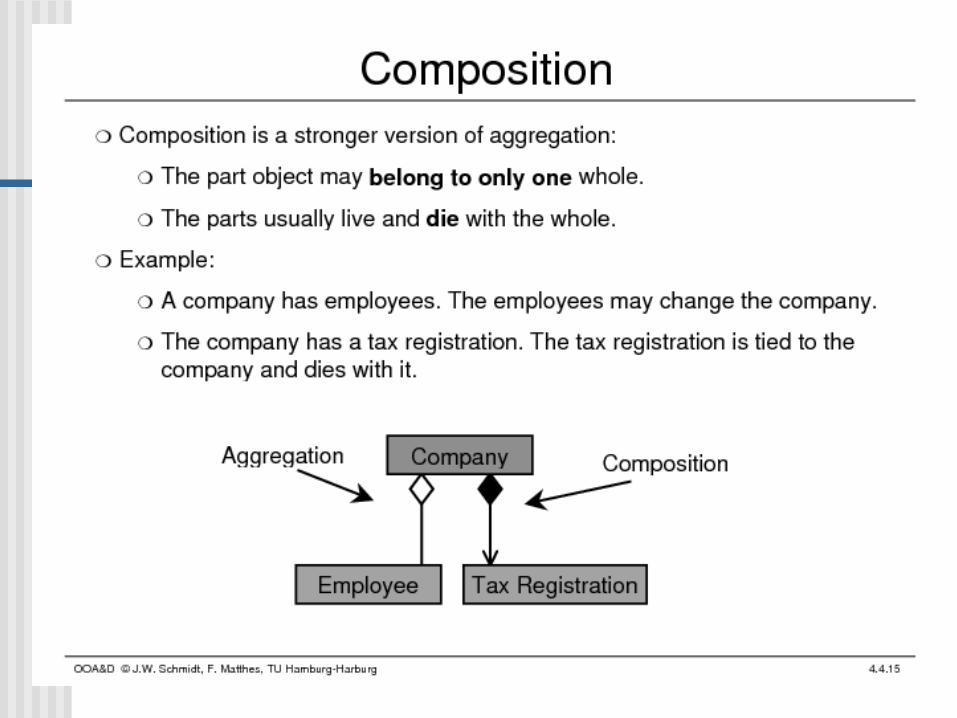
Composition
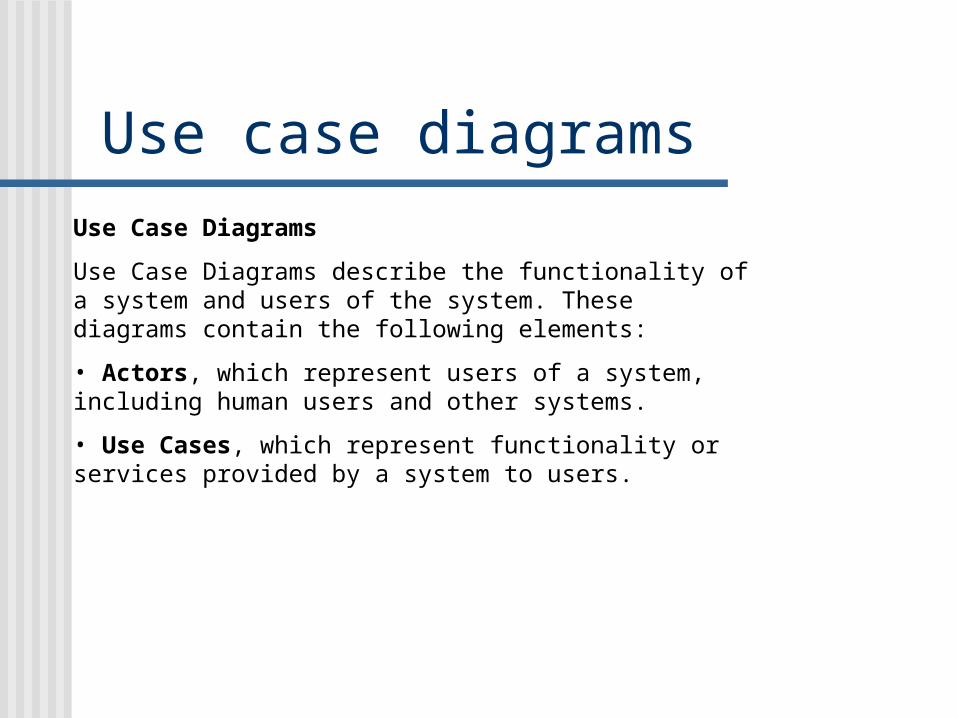
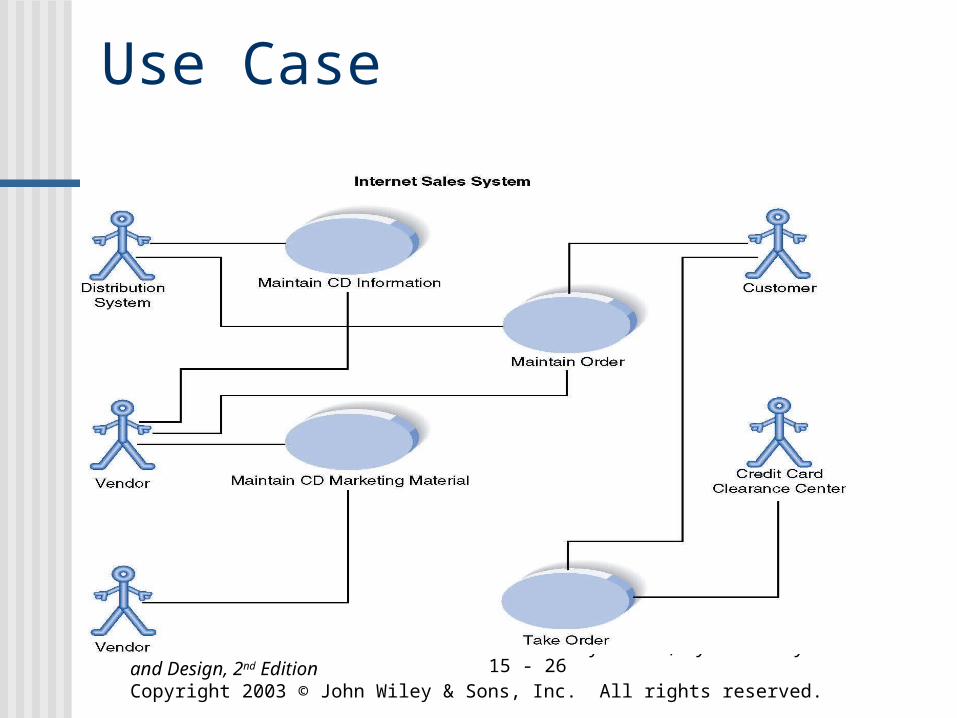
Use Case Diagrams
Use Case Diagrams describe the functionality of a system and users of the system. These diagrams contain the following elements:
• Actors, which represent users of a system, including human users and other systems.
• Use Cases, which represent functionality or services provided by a system to users.
Use case diagrams

High Level Use Case Diagram
Manage Resources
Manage Projects
System Admin
Resource Manager
Project Manager
System Administrator
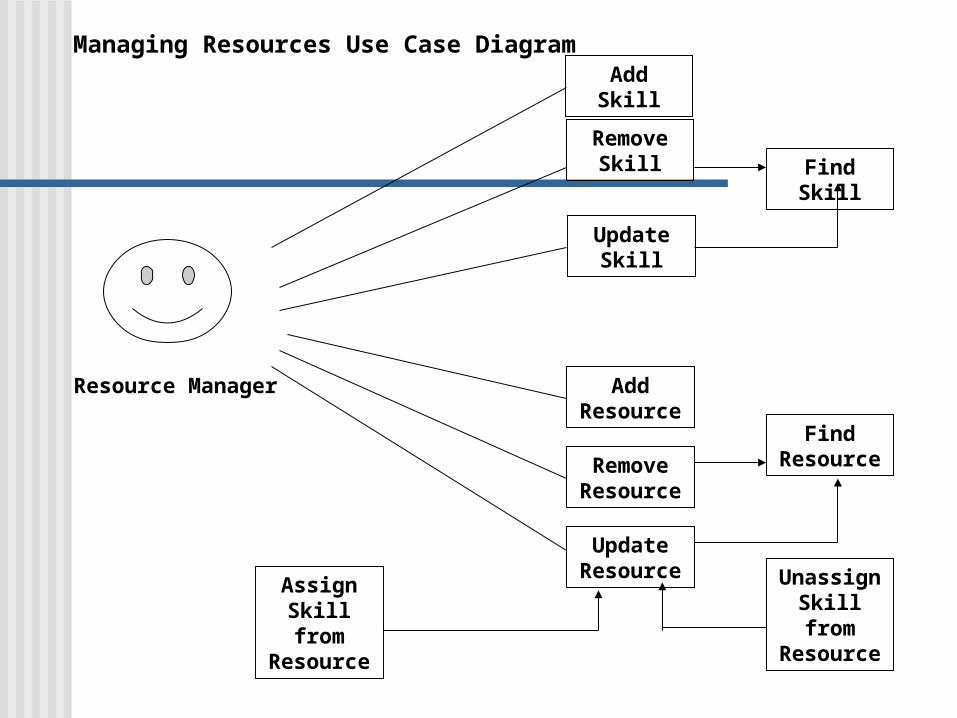
Managing Resources Use Case DiagramAdd Skill
Remove Skill
Update Skill
Find Skill
Add Resourc
eRemove Resourc
eUpdate Resourc
e
Find Resourc
e
Unassign Skill from
Resource
Assign Skill from
Resource
Resource Manager

Actors
PowerPoint Presentation for Dennis & Haley Wixom, Systems Analysis and Design, 2nd EditionCopyright 2003 © John Wiley & Sons, Inc. All rights reserved.
15 - 26
Use Case
PowerPoint Presentation for Dennis & Haley Wixom, Systems Analysis and Design, 2nd EditionCopyright 2003 © John Wiley & Sons, Inc. All rights reserved.
15 - 27
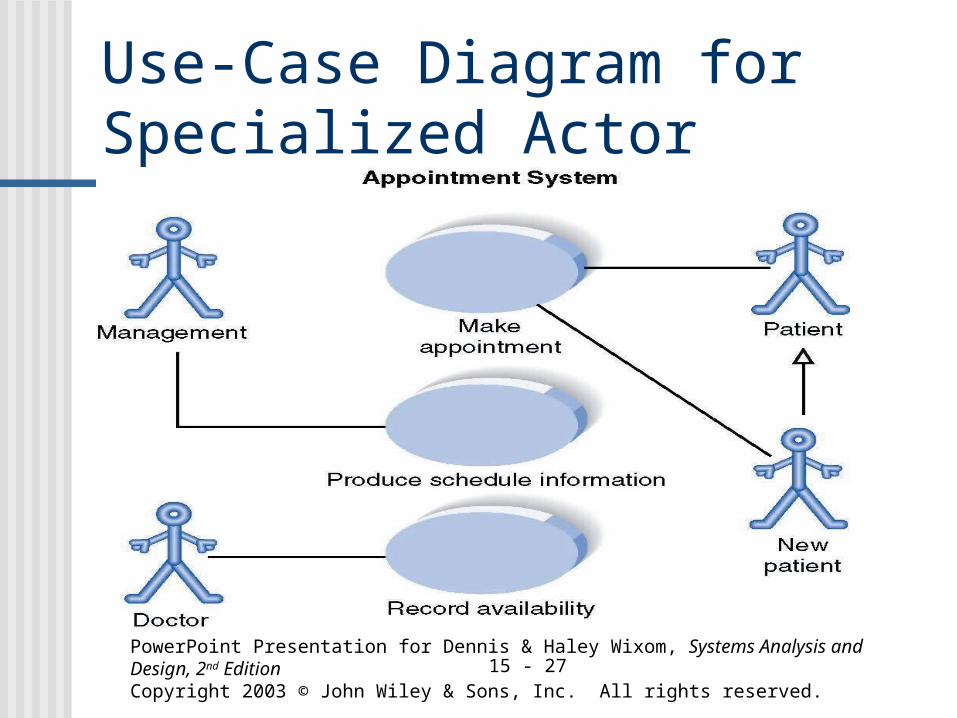
Use-Case Diagram for Specialized Actor
PowerPoint Presentation for Dennis & Haley Wixom, Systems Analysis and Design, 2nd EditionCopyright 2003 © John Wiley & Sons, Inc. All rights reserved.
15 - 28
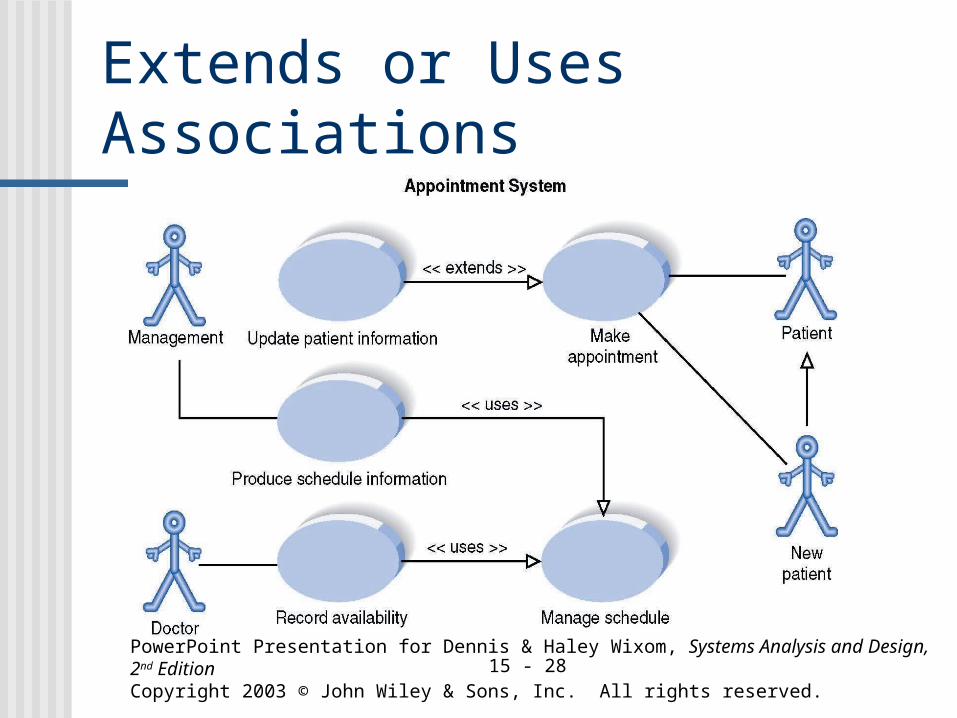
Extends or Uses Associations
PowerPoint Presentation for Dennis & Haley Wixom, Systems Analysis and Design, 2nd EditionCopyright 2003 © John Wiley & Sons, Inc. All rights reserved.
15 - 29
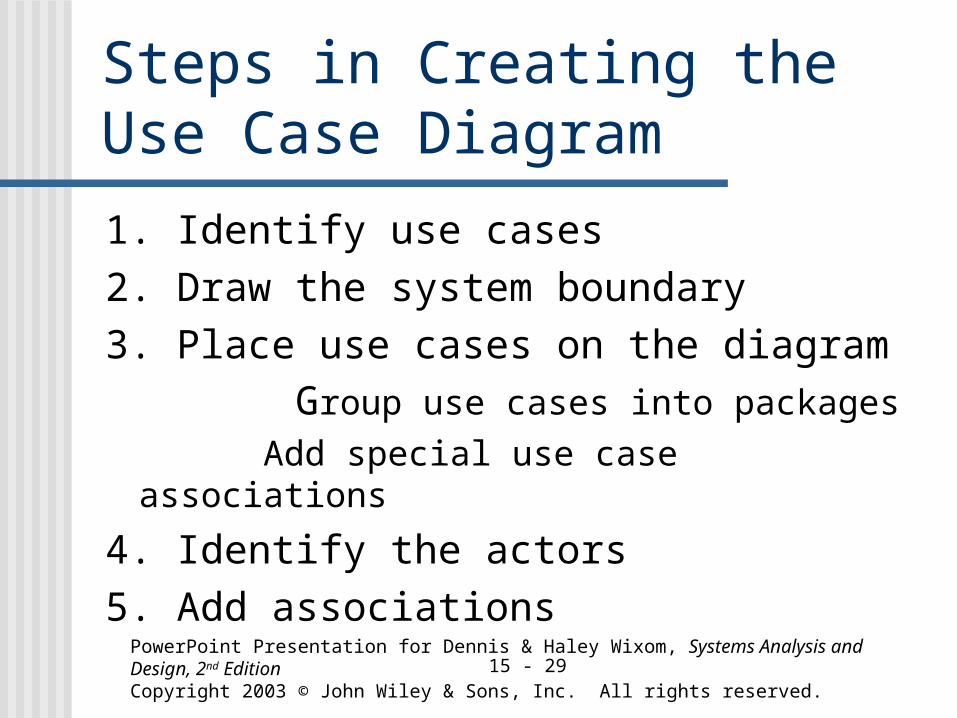
Steps in Creating the Use Case Diagram
1. Identify use cases2. Draw the system boundary3. Place use cases on the diagram Group use cases into packages
Add special use case associations
4. Identify the actors5. Add associations
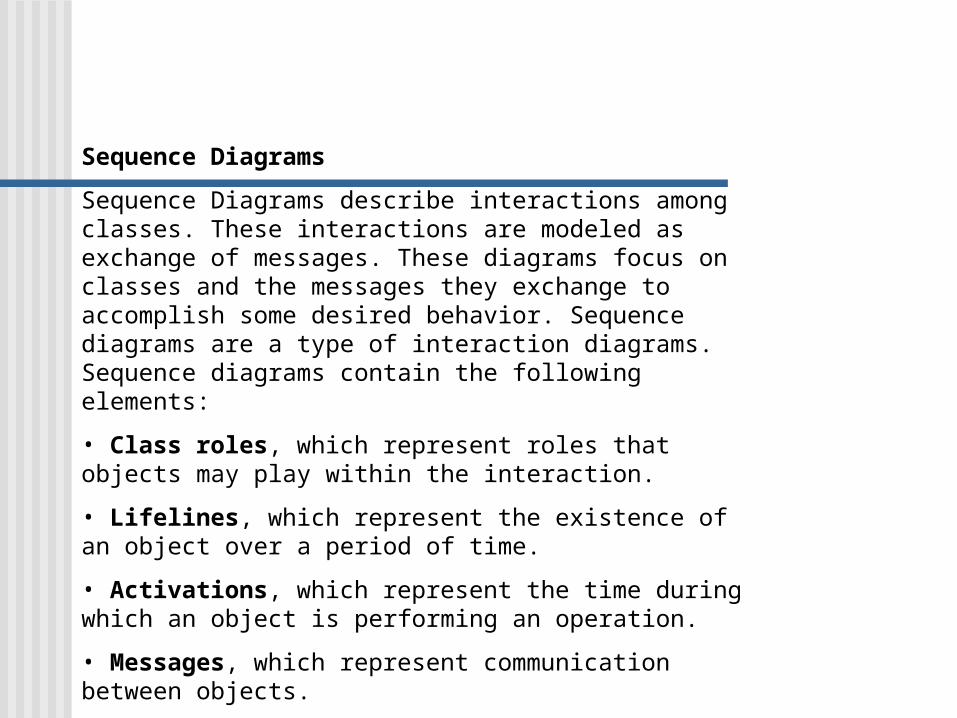
Sequence Diagrams
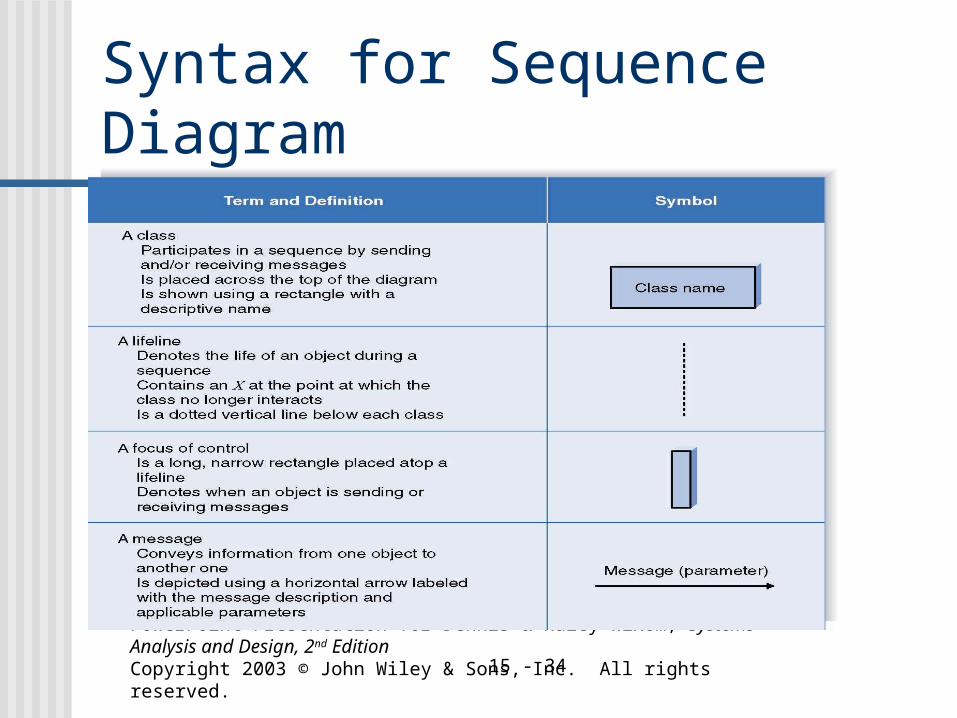
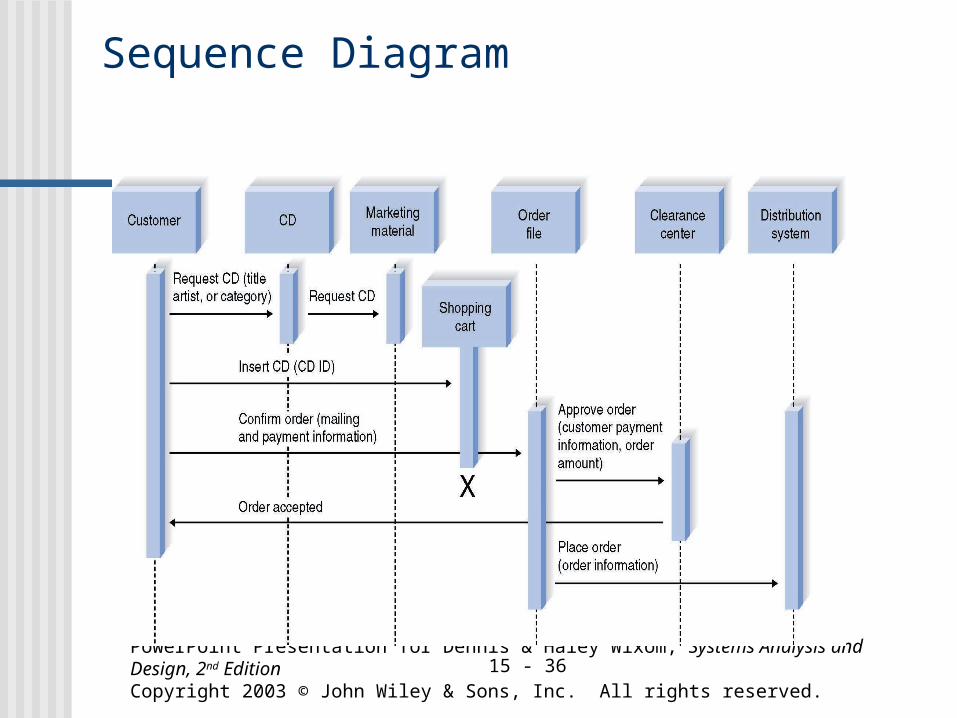
Sequence Diagrams describe interactions among classes. These interactions are modeled as exchange of messages. These diagrams focus on classes and the messages they exchange to accomplish some desired behavior. Sequence diagrams are a type of interaction diagrams. Sequence diagrams contain the following elements:
• Class roles, which represent roles that objects may play within the interaction.
• Lifelines, which represent the existence of an object over a period of time.
• Activations, which represent the time during which an object is performing an operation.
• Messages, which represent communication between objects.
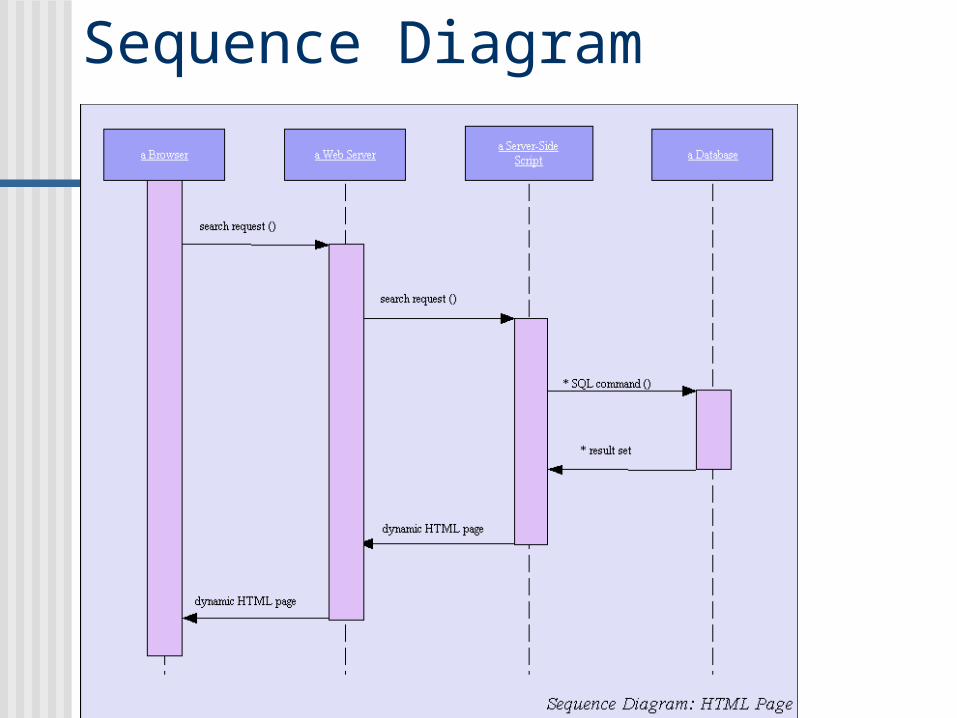
Sequence Diagram
PowerPoint Presentation for Dennis & Haley Wixom, Systems Analysis and Design, 2nd EditionCopyright 2003 © John Wiley & Sons, Inc. All rights reserved.
15 - 32
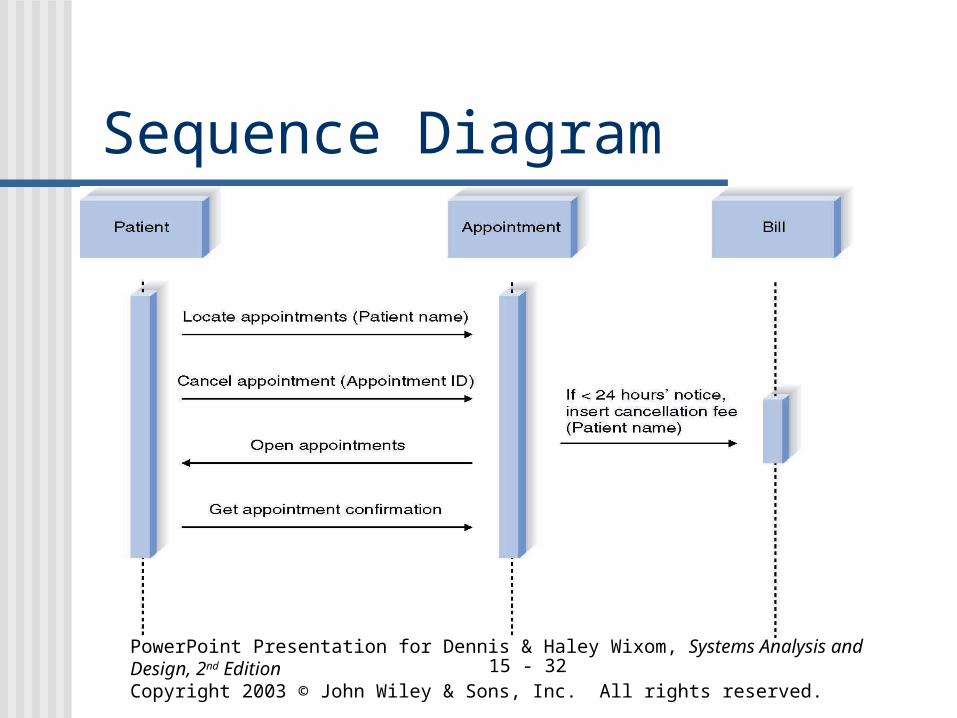
Sequence Diagram
PowerPoint Presentation for Dennis & Haley Wixom, Systems Analysis and Design, 2nd EditionCopyright 2003 © John Wiley & Sons, Inc. All rights reserved.
15 - 33
Steps in Creating a Sequence Diagram
1. Identify classes2. Add actions3. Place lifeline and focus of control
PowerPoint Presentation for Dennis & Haley Wixom, Systems Analysis and Design, 2nd EditionCopyright 2003 © John Wiley & Sons, Inc. All rights reserved.
15 - 34
Syntax for Sequence Diagram
Statechart Diagrams
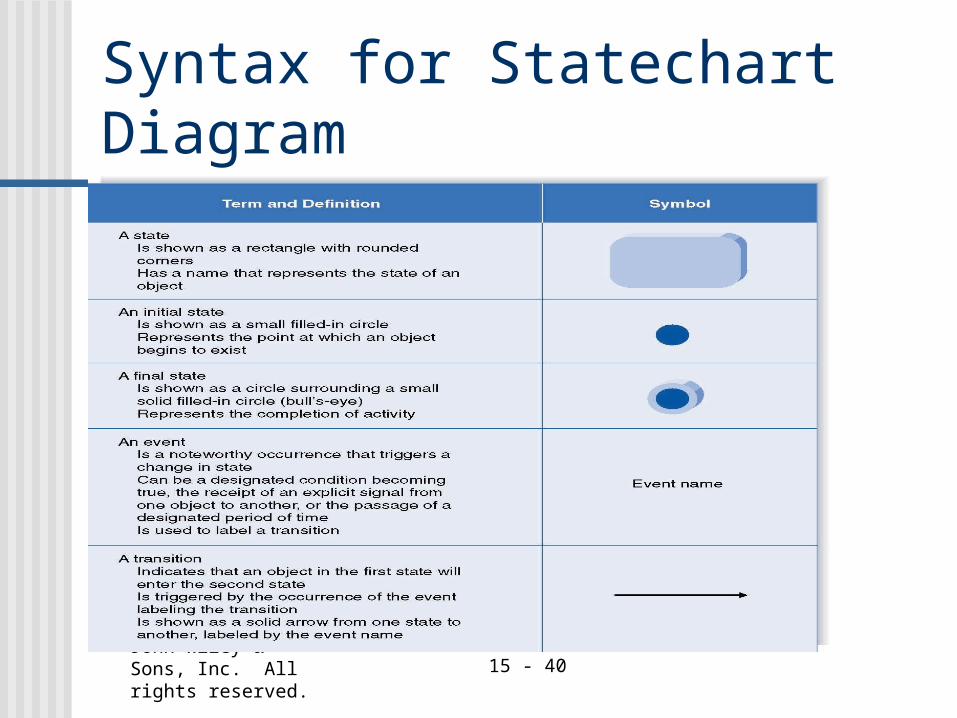
Statechart (or state) diagrams describe the states and responses of a class. Statechart diagrams describe the behavior of a class in response to external stimuli. These diagrams contain the following elements:
• States, which represent the situations during the life of an object in which it satisfies some condition, performs some activity, or waits for some occurrence.
• Transitions, which represent relationships between the different states of an object.
PowerPoint Presentation for Dennis & Haley Wixom, Systems Analysis and Design, 2nd EditionCopyright 2003 © John Wiley & Sons, Inc. All rights reserved.
15 - 36
Sequence Diagram
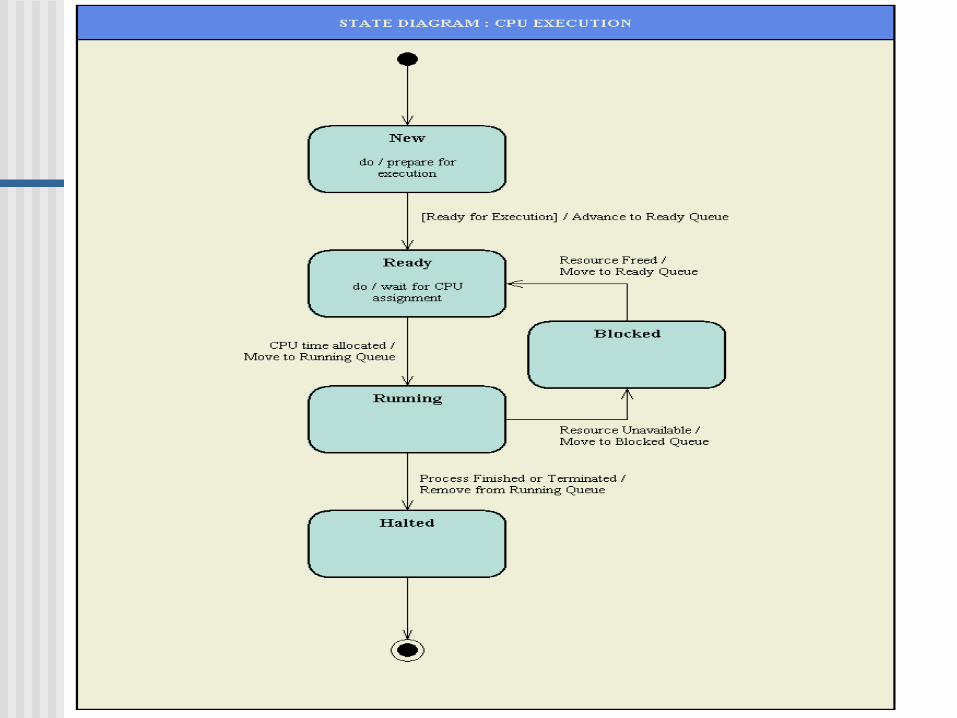
State Chart Diagram
PowerPoint Presentation for Dennis & Haley Wixom, Systems Analysis and Design, 2nd EditionCopyright 2003 © John Wiley & Sons, Inc. All rights reserved.
15 - 38
Statechart Concepts A dynamic model showing changes
of state of a single class over time in response to events along with its responses and actions
Typically not used for all classes, but just to help simplify the design of algorithms for methods of complex classes
PowerPoint Presentation for Dennis & Haley Wixom, Systems Analysis and Design, 2nd EditionCopyright 2003 © John Wiley & Sons, Inc. All rights reserved.
15 - 39
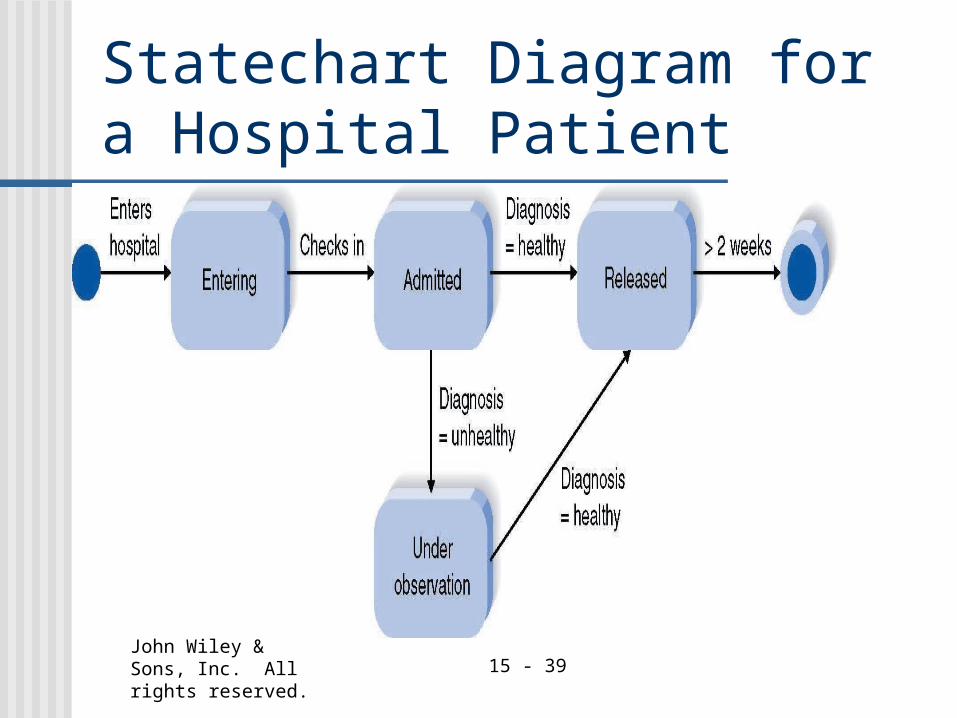
Statechart Diagram for a Hospital Patient
PowerPoint Presentation for Dennis & Haley Wixom, Systems Analysis and Design, 2nd EditionCopyright 2003 © John Wiley & Sons, Inc. All rights reserved.
15 - 40
Syntax for Statechart Diagram
PowerPoint Presentation for Dennis & Haley Wixom, Systems Analysis and Design, 2nd EditionCopyright 2003 © John Wiley & Sons, Inc. All rights reserved.
15 - 41
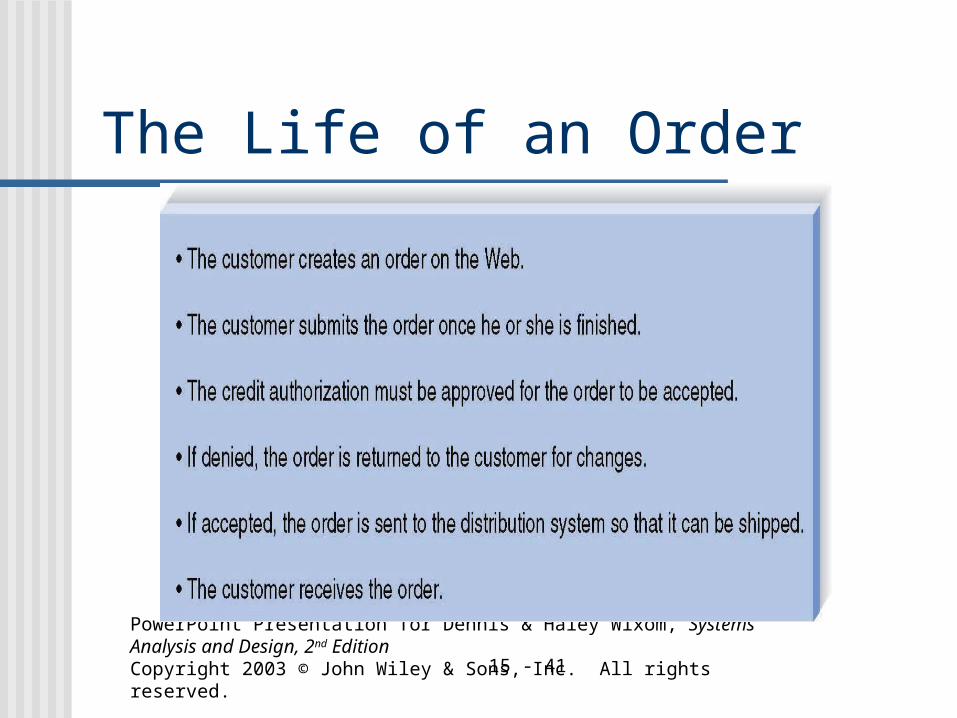
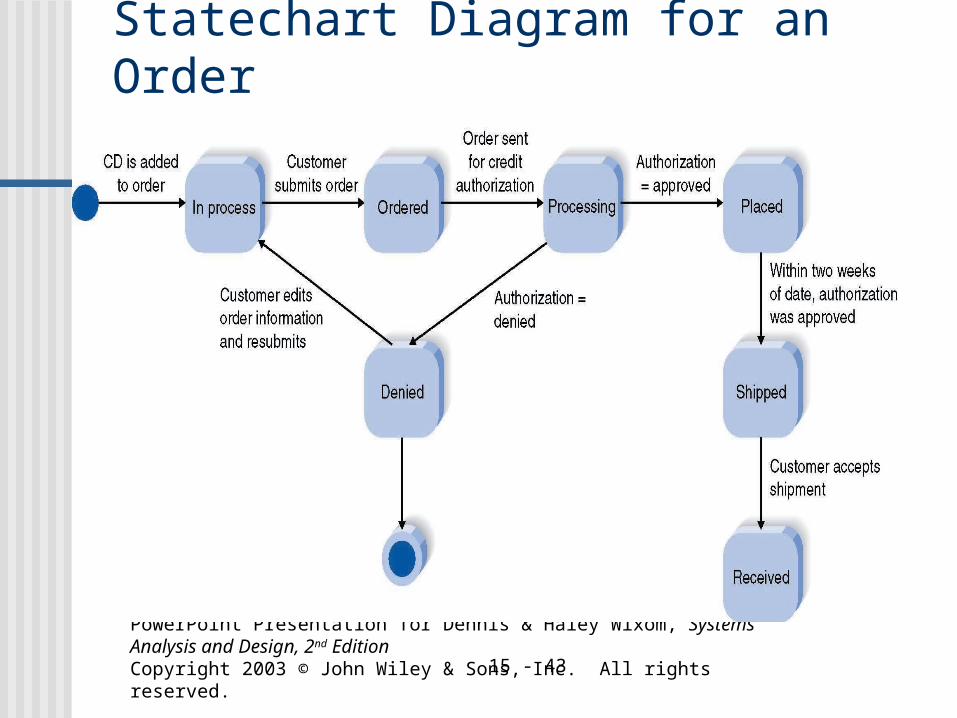
The Life of an Order
PowerPoint Presentation for Dennis & Haley Wixom, Systems Analysis and Design, 2nd EditionCopyright 2003 © John Wiley & Sons, Inc. All rights reserved.
15 - 42
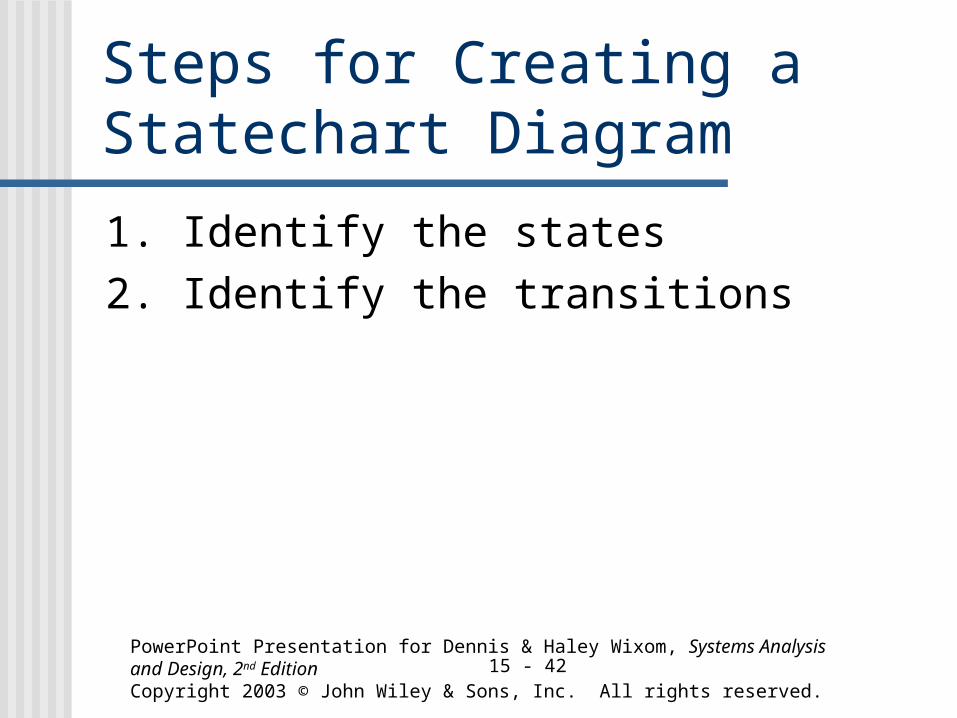
Steps for Creating a Statechart Diagram
1. Identify the states2. Identify the transitions
PowerPoint Presentation for Dennis & Haley Wixom, Systems Analysis and Design, 2nd EditionCopyright 2003 © John Wiley & Sons, Inc. All rights reserved.
15 - 43
Statechart Diagram for an Order


![[Anatol Rosenfeld] Texto, Contexto, Ensaios, Volume](https://img.pdfslide.tips/doc/110x75/5695d3271a28ab9b029d01f1/anatol-rosenfeld-texto-contexto-ensaios-volume.jpg)