Embed Size (px)
Citation preview
Highway Patrol Retirement System
Mark R. Atkeson, Executive Director 6161 Busch Boulevard, Suite 119
Columbus, Ohio 43229-2553
A Component Unit of the State of Ohio
Year ending December 31, 2013
Comprehensive Annual Financial Report

88 East Broad Street, Fifth Floor, Columbus, Ohio 43215‐3506 Phone: 614‐466‐4514 or 800‐282‐0370 Fax: 614‐466‐4490
www.ohioauditor.gov
Board of Trustees Ohio State Highway Patrol Retirement System 6161 Busch Boulevard Columbus, Ohio 43229-2553 We have reviewed the Independent Auditor’s Report of the Ohio State Highway Patrol Retirement System, Franklin County, prepared by Kennedy Cottrell Richards LLC, for the audit period January 1, 2013 through December 31, 2013. Based upon this review, we have accepted these reports in lieu of the audit required by Section 117.11, Revised Code. The Auditor of State did not audit the accompanying financial statements and, accordingly, we are unable to express, and do not express an opinion on them. Our review was made in reference to the applicable sections of legislative criteria, as reflected by the Ohio State Constitution, and the Revised Code, policies, procedures and guidelines of the Auditor of State, regulations and grant requirements. The Ohio State Highway Patrol Retirement System is responsible for compliance with these laws and regulations. Dave Yost Auditor of State July 8, 2014

This page intentionally left blank.
Introductory Section
Highlights
Highway Patrol Retirement System
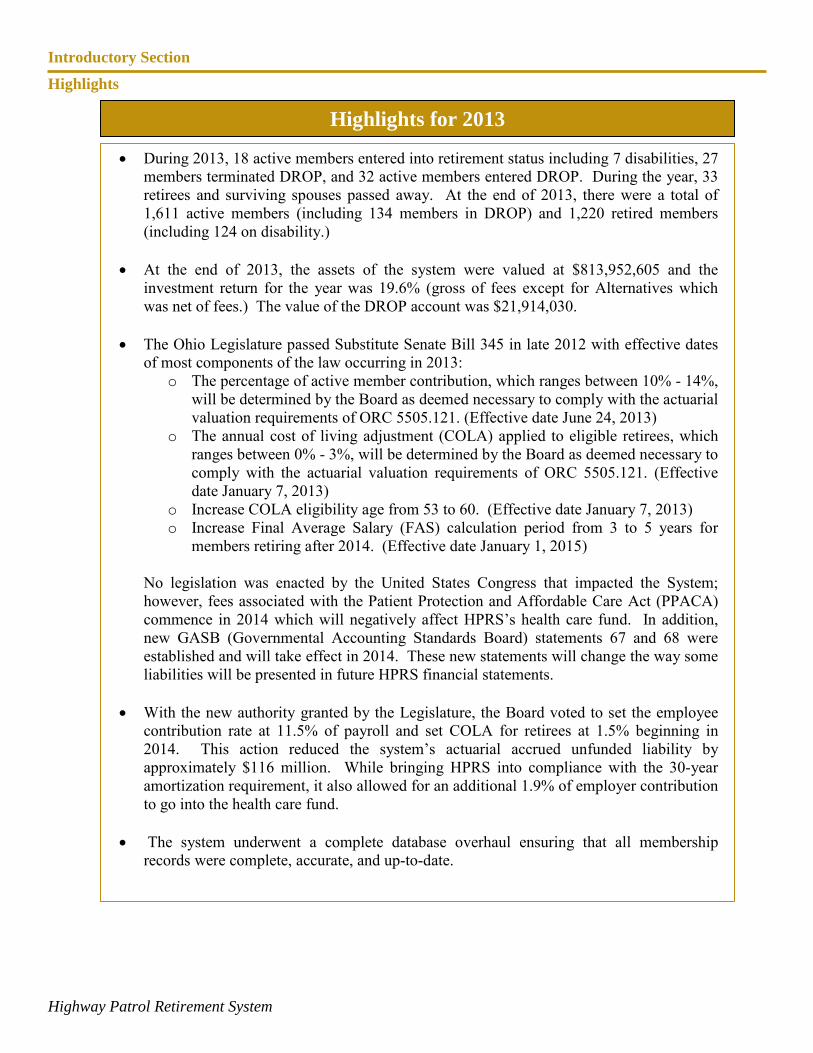
• During 2013, 18 active members entered into retirement status including 7 disabilities, 27
members terminated DROP, and 32 active members entered DROP. During the year, 33 retirees and surviving spouses passed away. At the end of 2013, there were a total of 1,611 active members (including 134 members in DROP) and 1,220 retired members (including 124 on disability.)
• At the end of 2013, the assets of the system were valued at $813,952,605 and the investment return for the year was 19.6% (gross of fees except for Alternatives which was net of fees.) The value of the DROP account was $21,914,030.
• The Ohio Legislature passed Substitute Senate Bill 345 in late 2012 with effective dates of most components of the law occurring in 2013:
o The percentage of active member contribution, which ranges between 10% - 14%, will be determined by the Board as deemed necessary to comply with the actuarial valuation requirements of ORC 5505.121. (Effective date June 24, 2013)
o The annual cost of living adjustment (COLA) applied to eligible retirees, which ranges between 0% - 3%, will be determined by the Board as deemed necessary to comply with the actuarial valuation requirements of ORC 5505.121. (Effective date January 7, 2013)
o Increase COLA eligibility age from 53 to 60. (Effective date January 7, 2013) o Increase Final Average Salary (FAS) calculation period from 3 to 5 years for
members retiring after 2014. (Effective date January 1, 2015)
No legislation was enacted by the United States Congress that impacted the System; however, fees associated with the Patient Protection and Affordable Care Act (PPACA) commence in 2014 which will negatively affect HPRS’s health care fund. In addition, new GASB (Governmental Accounting Standards Board) statements 67 and 68 were established and will take effect in 2014. These new statements will change the way some liabilities will be presented in future HPRS financial statements.
• With the new authority granted by the Legislature, the Board voted to set the employee
contribution rate at 11.5% of payroll and set COLA for retirees at 1.5% beginning in 2014. This action reduced the system’s actuarial accrued unfunded liability by approximately $116 million. While bringing HPRS into compliance with the 30-year amortization requirement, it also allowed for an additional 1.9% of employer contribution to go into the health care fund.
• The system underwent a complete database overhaul ensuring that all membership records were complete, accurate, and up-to-date.
Highlights for 2013

This page intentionally left blank.
Highway Patrol Retirement System
Table of Contents
INTRODUCTORY SECTION Page Certificate of Achievement ............................................................................................................................................................ 6 Board of Trustees and Senior Staff ................................................................................................................................................ 7 Organizational Chart ...................................................................................................................................................................... 8 Consultants and Investment Managers ........................................................................................................................................... 9 Legislative Summary ................................................................................................................................................................... 10 Letter of Transmittal .................................................................................................................................................................... 11 FINANCIAL SECTION Independent Auditor’s Report ...................................................................................................................................................... 16 Management’s Discussion and Analysis ...................................................................................................................................... 18 Basic Financial Statements Combining Statement of Plan Net Position ............................................................................................................................. 22 Combining Statement of Changes in Plan Net Position .......................................................................................................... 23 Notes to the Financial Statements ........................................................................................................................................... 24 Required Supplementary Schedules Schedule of Employer Contributions - Pension ...................................................................................................................... 38 Schedule of Employer Contributions and Other Contributing Entities - OPEB ...................................................................... 38 Schedule of Funding Progress - Pension ................................................................................................................................. 38 Schedule of Funding Progress - OPEB ................................................................................................................................... 38 Notes to the Trend Data .......................................................................................................................................................... 39 Notes to Required Supplementary Schedules ......................................................................................................................... 39 Supplementary Information Schedule of Administrative Expenses ..................................................................................................................................... 40 Schedule of Investment Expenses ........................................................................................................................................... 41 Payments to Consultants ......................................................................................................................................................... 41 Independent Auditor’s Report on Internal Control and Compliance ............................................................................................ 42 INVESTMENT SECTION Investment Overview ................................................................................................................................................................... 46 Investment Summary ................................................................................................................................................................... 47 Asset Allocation ........................................................................................................................................................................... 47 Ten-Year Investment Comparison ............................................................................................................................................... 47 Report on Investment Activity ..................................................................................................................................................... 48 Schedule of Investment Results ................................................................................................................................................... 49 Total Fund and Benchmark Returns ............................................................................................................................................ 49 Investment Portfolio .................................................................................................................................................................... 50 Summary Schedule of Investment Manager Fees ........................................................................................................................ 53 Summary Schedule of Broker Fees .............................................................................................................................................. 54 Investment Objectives, Policies, and Guidelines ......................................................................................................................... 55 ACTUARIAL SECTION Actuary’s Letter ........................................................................................................................................................................... 74 Statement of Actuarial Assumptions and Methods ...................................................................................................................... 76 Short-Term Solvency Test ........................................................................................................................................................... 78 Active Member Valuation Data ................................................................................................................................................... 78 Retiree and Beneficiary Added to and Removed from Rolls ....................................................................................................... 79 Analysis of Financial Experience................................................................................................................................................. 79 Summary of Plan Provisions ........................................................................................................................................................ 80 STATISTICAL SECTION Introduction ................................................................................................................................................................................. 86 Changes in Net Position, 2004-2013 ............................................................................................................................................ 87 Benefit Deductions from Net Position by Type, 2004-2013 ........................................................................................................ 88 Principal Participating Employer, 2004-2013 .............................................................................................................................. 88 Benefit Recipients by Type of Benefit, December 31, 2013 ........................................................................................................ 89 Average Benefit Payments, 2004-2013 ........................................................................................................................................ 90 Other Post-Employment Benefit Payments, 2004-2013 .............................................................................................................. 91 Mission & Vision Statement ............................................................................................................................................................. 92

Highway Patrol Retirement System
This page intentionally left blank.

IInnttrroodduuccttoorryy SSeeccttiioonn
Introductory Section
Awards
Highway Patrol Retirement System 6

Introductory Section
Board of Trustees and Senior Staff
Highway Patrol Retirement System 7
Capt. Cory D. Davies
Employee Trustee/Chair
Maj. (ret.) Darryl L. Anderson
Retiree Trustee/ Vice-Chair
S/Lt. Heidi A. Marshall
Employee Trustee
Sgt. Jeremy B. Mendenhall Employee Trustee
Capt. Carl Roark Employee Trustee
Lt. Andre T. Swinerton
Employee Trustee
Col. Paul A. Pride Statutory Member
Lt. (ret.) Larry A. Davis Retiree Trustee
Joseph H. Thomas
General Assembly’s Investment Expert
Kenneth C. Boyer
Treasurer of State’s Investment Designee
Maj. (ret.) JP Allen
Governor’s Investment Expert Appointee
Maj. (ret.) Mark R. Atkeson
Executive Director
Capt. (ret.) Wayne A. Warner CFO / CIO
Dennis P. Smith General Counsel
Introductory Section
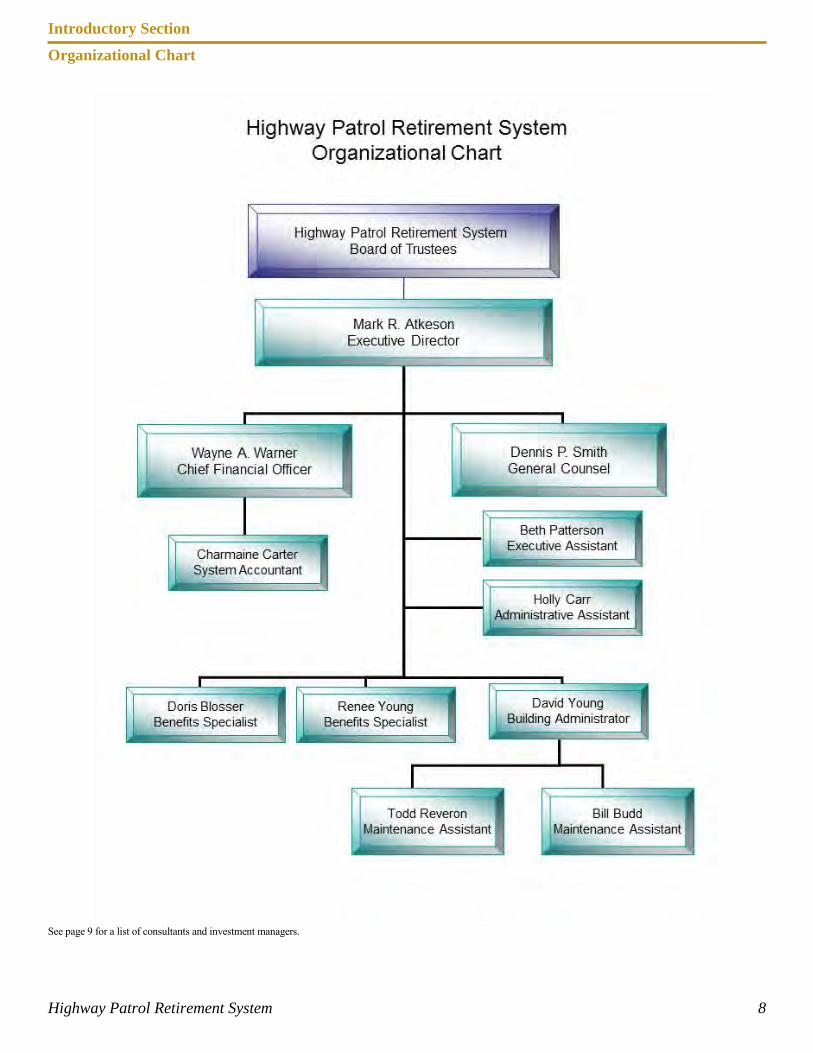
Organizational Chart
Highway Patrol Retirement System 8
See page 9 for a list of consultants and investment managers.
Introductory Section
Consultants and Investment Managers
Highway Patrol Retirement System 9
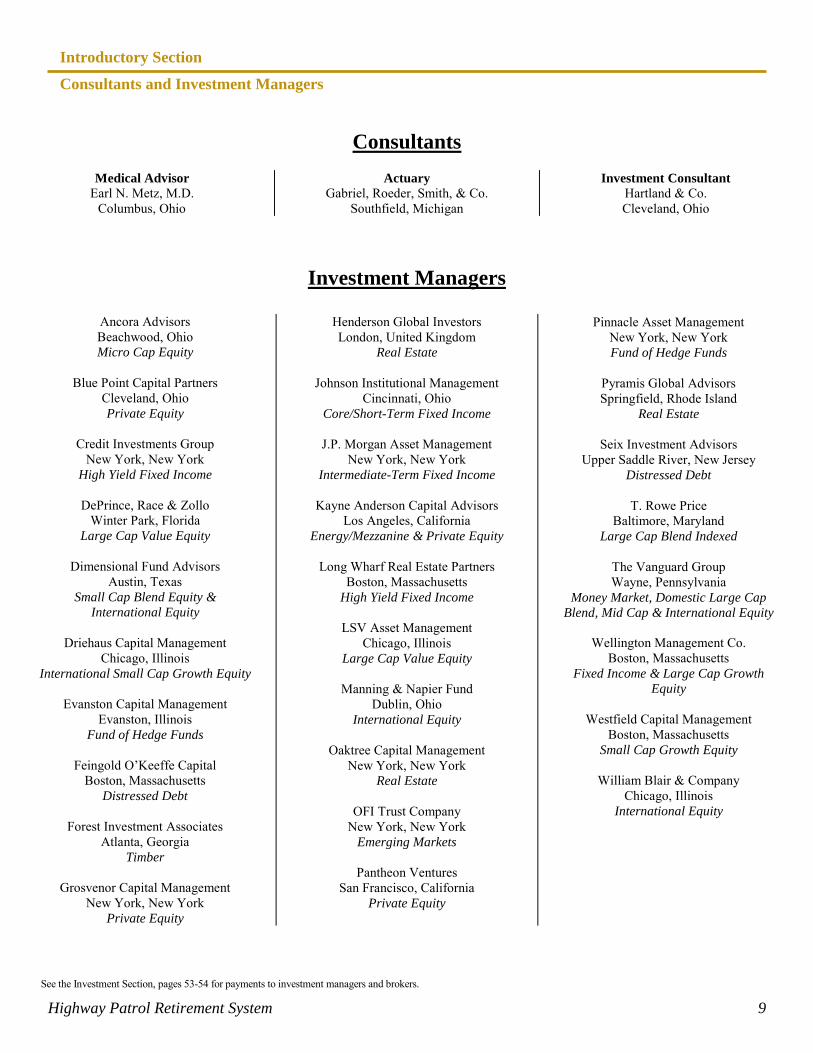
Consultants
Medical Advisor Earl N. Metz, M.D.
Columbus, Ohio
Actuary Gabriel, Roeder, Smith, & Co.
Southfield, Michigan
Investment Consultant Hartland & Co. Cleveland, Ohio
Investment Managers
Ancora Advisors Beachwood, Ohio Micro Cap Equity
Blue Point Capital Partners
Cleveland, Ohio Private Equity
Credit Investments Group
New York, New York High Yield Fixed Income
DePrince, Race & Zollo
Winter Park, Florida Large Cap Value Equity
Dimensional Fund Advisors
Austin, Texas Small Cap Blend Equity &
International Equity
Driehaus Capital Management Chicago, Illinois
International Small Cap Growth Equity
Evanston Capital Management Evanston, Illinois
Fund of Hedge Funds
Feingold O’Keeffe Capital Boston, Massachusetts
Distressed Debt
Forest Investment Associates Atlanta, Georgia
Timber
Grosvenor Capital Management New York, New York
Private Equity
Henderson Global Investors London, United Kingdom
Real Estate
Johnson Institutional Management Cincinnati, Ohio
Core/Short-Term Fixed Income
J.P. Morgan Asset Management New York, New York
Intermediate-Term Fixed Income
Kayne Anderson Capital Advisors Los Angeles, California
Energy/Mezzanine & Private Equity
Long Wharf Real Estate Partners Boston, Massachusetts
High Yield Fixed Income
LSV Asset Management Chicago, Illinois
Large Cap Value Equity
Manning & Napier Fund Dublin, Ohio
International Equity
Oaktree Capital Management New York, New York
Real Estate
OFI Trust Company New York, New York
Emerging Markets
Pantheon Ventures San Francisco, California
Private Equity
Pinnacle Asset Management New York, New York Fund of Hedge Funds
Pyramis Global Advisors Springfield, Rhode Island
Real Estate
Seix Investment Advisors Upper Saddle River, New Jersey
Distressed Debt
T. Rowe Price Baltimore, Maryland
Large Cap Blend Indexed
The Vanguard Group Wayne, Pennsylvania
Money Market, Domestic Large Cap Blend, Mid Cap & International Equity
Wellington Management Co.
Boston, Massachusetts Fixed Income & Large Cap Growth
Equity
Westfield Capital Management Boston, Massachusetts
Small Cap Growth Equity
William Blair & Company Chicago, Illinois
International Equity
See the Investment Section, pages 53-54 for payments to investment managers and brokers.
Introductory Section
Legislative Summary
Highway Patrol Retirement System 10
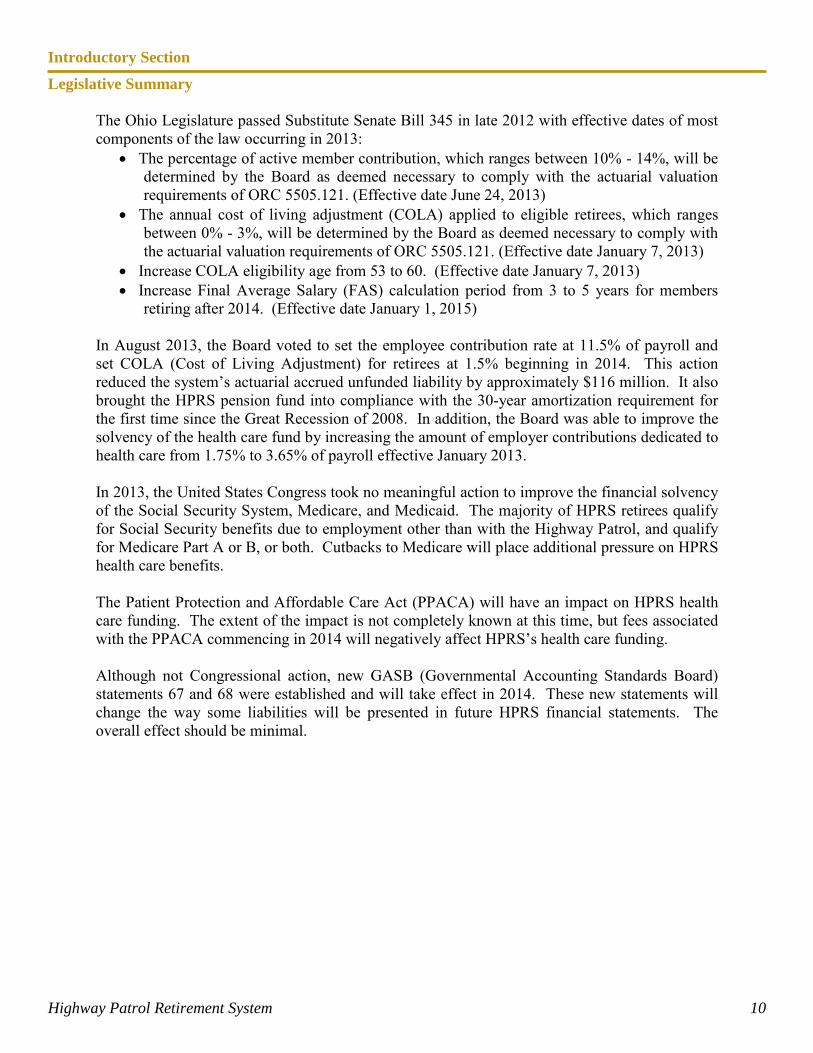
The Ohio Legislature passed Substitute Senate Bill 345 in late 2012 with effective dates of most components of the law occurring in 2013:
• The percentage of active member contribution, which ranges between 10% - 14%, will be determined by the Board as deemed necessary to comply with the actuarial valuation requirements of ORC 5505.121. (Effective date June 24, 2013)
• The annual cost of living adjustment (COLA) applied to eligible retirees, which ranges between 0% - 3%, will be determined by the Board as deemed necessary to comply with the actuarial valuation requirements of ORC 5505.121. (Effective date January 7, 2013)
• Increase COLA eligibility age from 53 to 60. (Effective date January 7, 2013) • Increase Final Average Salary (FAS) calculation period from 3 to 5 years for members
retiring after 2014. (Effective date January 1, 2015) In August 2013, the Board voted to set the employee contribution rate at 11.5% of payroll and set COLA (Cost of Living Adjustment) for retirees at 1.5% beginning in 2014. This action reduced the system’s actuarial accrued unfunded liability by approximately $116 million. It also brought the HPRS pension fund into compliance with the 30-year amortization requirement for the first time since the Great Recession of 2008. In addition, the Board was able to improve the solvency of the health care fund by increasing the amount of employer contributions dedicated to health care from 1.75% to 3.65% of payroll effective January 2013. In 2013, the United States Congress took no meaningful action to improve the financial solvency of the Social Security System, Medicare, and Medicaid. The majority of HPRS retirees qualify for Social Security benefits due to employment other than with the Highway Patrol, and qualify for Medicare Part A or B, or both. Cutbacks to Medicare will place additional pressure on HPRS health care benefits. The Patient Protection and Affordable Care Act (PPACA) will have an impact on HPRS health care funding. The extent of the impact is not completely known at this time, but fees associated with the PPACA commencing in 2014 will negatively affect HPRS’s health care funding. Although not Congressional action, new GASB (Governmental Accounting Standards Board) statements 67 and 68 were established and will take effect in 2014. These new statements will change the way some liabilities will be presented in future HPRS financial statements. The overall effect should be minimal.
Highway Patrol Retirement System 11
June 19, 2014
Letter of Transmittal Members of the Board of Trustees: We are pleased to present to you the Comprehensive Annual Financial Report for the Highway Patrol Retirement System (HPRS) for the period ending December 31, 2013. This report is intended to provide financial, investment, actuarial, and statistical information in a single publication. Working with each HPRS staff member and the various consultants employed by the HPRS, HPRS management takes full responsibility for the accuracy and completeness of this report. The data presented in this report demonstrates the careful stewardship of the system’s assets to enable the Board to provide excellent pension and health care benefits to our members. The HPRS was created by the Ohio Legislature in 1941 to provide pension benefits to the sworn officers and communications personnel of the Ohio State Highway Patrol (OSHP). Prior to this action of the Legislature, active duty members of the Patrol contributed to the Ohio Public Employees Retirement System. Currently, only sworn officers, cadets in training to become sworn officers, and communications personnel hired prior to November 2, 1989, are permitted to be contributing members of the HPRS. In 1974, the legislature authorized the HPRS to offer health care benefits to retired members, if excess funds are available. In addition to pension benefits, the HPRS provides disability benefits to active duty members, disabled both on and off duty. Survivor and death benefits and health care coverage is provided for benefit recipients and eligible dependents. A full description of benefits provided by the HPRS can be found in the Plan Summary portion of the Actuarial Section. Major Plan Initiatives and Changes in 2013 The most significant changes in 2013 centered on Board actions based on pension reform legislation enacted in 2012. For the first time in nearly five years, HPRS became compliant with the 30-year amortization requirement of the Ohio Revised Code, and the system’s actuarial accrued unfunded liability was reduced by approximately $116 million. In addition, the long-term stability of our health care fund was improved. This was accomplished by the Board taking the following actions:
• Increasing the employee contribution rate from 10% to 11.5% beginning in 2014; • Setting the COLA rate for eligible retiree at 1.5% beginning in 2014; and • Increasing the employer contribution allocation to health care from 1.75% to 3.65%
retroactive to January 2013.
Highway Patrol Retirement System 12
During the year, staff undertook a complete overhaul of the system’s databases. All retired members, spouses, surviving spouses, and dependents were contacted, all records were reviewed, and all files were updated with the most up-to-date and accurate information. This endeavor required hundreds of man-hours over several months to complete. In 2013, the Summit County Internal Audit Department was retained again to perform internal auditing services. This year it focused primarily on an assessment of the Administration functions including benefits and investments. Although several recommendations for improvement were given, no material weaknesses were identified. The recommendations were discussed and changes or improvements were made, many being put into place prior to the completion of the audit. The challenges encountered in 2012 by the transition to new leadership and the loss of much institutional knowledge were largely overcome in 2013 due to the professionalism, commitment, and hard work of the staff coupled with the support of the Board. Investments The primary objective of the State Highway Patrol Retirement System is to provide eligible members and beneficiaries with scheduled pension benefits. It is very important the Board develops and implements an investment strategy that provides the funds necessary to maintain the security and safety of the plan. With benefit recipients living longer, health care costs rising at a rate of many times the actual rate of inflation and financial downturns, such as the recession of 2008, the investment strategy must be monitored and adjusted constantly. Consistent with prudent standards for preservation of capital and maintenance of liquidity, the goal of the fund is to earn the highest possible rate of return consistent with HPRS’s tolerance for risk as determined periodically by the Board in its role as a fiduciary. This objective should ensure adequate funds to meet scheduled benefits. Diversification of assets will ensure that adverse or unexpected results from a security class will not have a detrimental impact on the entire portfolio. In November 2013, a 5-year asset liability study was completed by Hartland & Company. The study concluded the following:
• HPRS’s funded status is expected to increase over time; • HPRS is invested in an efficient portfolio that is projected to meet expected return
assumptions; • HPRS’s asset allocation is generally in line with other Ohio systems and InvestorForce
peers; and • HPRS should maintain its current asset allocation targets and ranges.
The U.S. economy continued to grow in 2013, but real GDP growth declined to 1.9% for the year, down from 2.8% in 2012. The deceleration in real GDP growth was mainly attributable to reduced government spending and decelerations in personal consumption expenditures and non-residential fixed investment. HPRS’s assets increased 19.6% (gross of fees except for Alternatives which was net of fees) finishing the year with a net position of $813,952,605.
Highway Patrol Retirement System 13
A more detailed report on investment operations and performance can be found in the Management’s Discussion and Analysis section, beginning on page 18, and the Investment Section, beginning on page 46. Internal Controls The management of HPRS has implemented and is responsible for a system of internal accounting controls, designed to provide reasonable assurance of the safeguarding of assets and the reliability of financial records. Once again in 2013, the Summit County Internal Audit Department was retained to perform internal auditing services, specifically the assessment of the Administration function, benefits, and investments. Although several recommendations for improvement were given, no material weaknesses were identified. Additional functional areas will be audited in 2014. The internal accounting controls in place are adequate to meet the purpose for which they were intended and are reviewed annually by an external auditor. The financial statements, supporting schedules, and statistical tables are presented fairly in all material respects. For the past many years, the external auditors appointed by the Auditor of State have noted in their reports that the internal controls of the HPRS parallel best practices of public pension plans and are in full compliance with nationally accepted accounting standards. Funding The funding of pension and health care benefits of the HPRS comes from a combination of employer and employee contributions, and investment returns. Ohio law requires public pension plans be able to amortize pension obligations within a 30-year period. A national standard of funding status is benchmarked at 80%. At the close of 2009, the HPRS was not able to amortize pension liabilities in 30 years or less. The funding status percentage dropped from 80.9% at the end of 2007 to 59.5% at the end of 2011. Due to changes previously described and enacted by the Board in 2013, the amortization period no longer exceeds the 30-year limit. The funding status for the period ending December 31, 2012 was 68.1%. With very favorable investment returns in 2013, we expect our funding status to see further improvement. Awards The Government Finance Officers Association of the United States and Canada (GFOA) awarded a Certificate of Achievement for Excellence in Financial Reporting to the Highway Patrol Retirement System for its comprehensive annual financial report for the fiscal year ended December 31, 2012. In order to be awarded a Certificate of Achievement, a government must publish an easily readable and efficiently organized comprehensive annual financial report. This report must satisfy both generally accepted accounting principles and applicable legal requirements. A Certificate of Achievement is valid for a period of one year only. We believe our current comprehensive annual financial report continues to meet the Certificate of Achievement program’s requirements and we are submitting it to the GFOA to determine its eligibility for another certificate.
Highway Patrol Retirement System 14
Professional Services To aid in efficient and effective management, professional services are provided to the HPRS by consultants appointed by the Board. Gabriel, Roeder, Smith & Company of Southfield, Michigan, provides actuarial services. The investment advisor to the Board is Hartland & Co. of Cleveland, Ohio. Under contract with the Auditor of the State of Ohio, Kennedy, Cottrell, Richards, Certified Public Accountants of Columbus, Ohio, audited the financial records of the system. The Summit County Internal Audit Department of Akron, Ohio, was retained to perform internal auditing services. Acknowledgements The preparation of this report reflects the combined efforts of the system's staff under the direction of the Board of Trustees. It is intended to provide complete and reliable information as a basis for making management decisions, a means for determining compliance with legal provisions, and a means for determining responsible stewardship over the assets contributed by the members and their employer, the State of Ohio. Upon publication of this report at www.ohprs.org, HPRS will notify interested parties of its availability, including all State Highway Patrol facilities, professional consultants, investment managers, ranking members of the appropriate Ohio House and Senate committees, and the Ohio Retirement Study Council. Submitted for your review,
Mark R. Atkeson Wayne A. Warner Executive Director Chief Financial Officer

FFiinnaanncciiaall SSeeccttiioonn
INDEPENDENT AUDITOR’S REPORT
Ohio State Highway Patrol Retirement System 6161 Busch Boulevard, Suite 119 Columbus, Ohio 43229-2553
To the Board of Trustees: Report on the Financial Statements We have audited the accompanying basic financial statements of Ohio State Highway Patrol Retirement System (the HPRS), a component unit of the State of Ohio, as of and for the year ended December 31, 2013, and the related notes to the financial statements, which collectively comprise the HPRS’ basic financial statements as listed in the table of contents. Management’s Responsibility for the Financial Statements Management is responsible for preparing and fairly presenting these financial statements in accordance with accounting principles generally accepted in the United States of America; this includes designing, implementing, and maintaining internal control relevant to preparing and fairly presenting financial statements that are free from material misstatement, whether due to fraud or error. Auditor's Responsibility Our responsibility is to opine on these financial statements based on our audit. We audited in accordance with auditing standards generally accepted in the United States of America and the financial audit standards in the Comptroller General of the United States’ Government Auditing Standards. Those standards require us to plan and perform the audit to reasonably assure the financial statements are free from material misstatement. An audit requires obtaining evidence about financial statement amounts and disclosures. The procedures selected depend on our judgment, including assessing the risks of material financial statement misstatement, whether due to fraud or error. In assessing those risks, we consider internal control relevant to the HPRS' preparation and fair presentation of the financial statements in order to design audit procedures that are appropriate in the circumstances, but not to the extent needed to opine on the effectiveness of the HPRS’ internal control. Accordingly, we express no opinion. An audit also includes evaluating the appropriateness of management’s accounting policies and the reasonableness of their significant accounting estimates, as well as our evaluation of the overall financial statement presentation. We believe the audit evidence we obtained is sufficient and appropriate to support our audit opinion. Opinion In our opinion, the financial statements referred to above present fairly, in all material respects, the plan net position of the Ohio State Highway Patrol Retirement System, as of December 31, 2013, and the respective changes in plan net position for the year then ended in accordance with the accounting principles generally accepted in the United States of America.
Ohio State Highway Patrol Retirement System Independent Auditor’s Report Page 2
Other Matters Required Supplementary Information Accounting principles generally accepted in the United States of America require this presentation to include Management’s discussion and analysis and required supplementary schedules, as listed in the table of contents, to supplement the basic financial statements. Although this information is not part of the basic financial statements, the Governmental Accounting Standards Board considers it essential for placing the basic financial statements in an appropriate operational, economic, or historical context. We applied certain limited procedures to the required supplementary information in accordance with auditing standards generally accepted in the United States of America, consisting of inquiries of management about the methods of preparing the information and comparing the information for consistency with management’s responses to our inquiries, to the basic financial statements, and other knowledge we obtained during our audit of the basic financial statements. We do not opine or provide any assurance on the information because the limited procedures do not provide us with sufficient evidence to opine or provide any other assurance. Supplementary and Other Information Our audit was conducted to opine on the HPRS’ basic financial statements taken as a whole. The introductory section, supplementary information, investment section, actuarial section, and statistical section, as listed in the table of contents, present additional analysis and are not a required part of the basic financial statements. The supplementary information is management’s responsibility, and was derived from and relates directly to the underlying accounting and other records used to prepare the basic financial statements. We subjected these schedules to the auditing procedures we applied to the basic financial statements. We also applied certain additional procedures, including comparing and reconciling this information directly to the underlying accounting and other records used to prepare the basic financial statements or to the basic financial statements themselves, and other additional procedures in accordance with auditing standards generally accepted in the United States of America. In our opinion, this information is fairly stated in all material respects in relation to the basic financial statements taken as a whole. We did not subject the introductory section, investment section, actuarial section, and statistical section information to the auditing procedures applied in the audit of the basic financial statements and, accordingly, we express no opinion or any other assurance on them. Other Reporting Required by Government Auditing Standards In accordance with Government Auditing Standards, we have also issued our report dated June 13, 2014, on our consideration of the HPRS’ internal control over financial reporting and our tests of its compliance with certain provisions of laws, regulations, contracts and grant agreements and other matters. That report describes the scope of our internal control testing over financial reporting and compliance, and the results of that testing, and does not opine on internal control over financial reporting or on compliance. That report is an integral part of an audit performed in accordance with Government Auditing Standards in considering the HPRS’ internal control over financial reporting and compliance.
Kennedy Cottrell Richards LLC June 13, 2014
Financial Section
Management’s Discussion and Analysis
Highway Patrol Retirement System 18
Financial Highlights • At December 31, 2013, the assets of HPRS exceeded liabilities by $813,952,605. All of the
assets are held in trust for pension and health care benefits and are available to meet HPRS’s ongoing obligations to plan participants and their beneficiaries.
• During 2013, HPRS’s total net position increased by $96,084,927 or 13.4%. • HPRS’s funding objective is to meet long-term benefit obligations through contributions and
investment income. At December 31, 2012, the date of the most recent actuarial valuation, HPRS assets equaled 68.1% of the present value of pension obligations.
• Additions to plan net position for the year were $173,205,948, which includes member and employer contributions of $35,649,228 and investment gains of $133,572,046.
• Deductions from plan net position increased 6.9% over the prior year. Of this amount, pension benefits increased by 4.6%, health care expenses increased by 11.4% and administrative expenses increased by 5.3%.
Overview of the Financial Statements The financial statements consist of the following components:
1. Combining Statement of Plan Net Position 2. Combining Statement of Changes in Plan Net Position 3. Notes to the Financial Statements
This report also contains other supplementary information in addition to the basic financial statements themselves. The Combining Statement of Plan Net Position provides a snapshot of account balances at year-end, indicating the assets available for future payments to benefit recipients, less any current liabilities of the system. The Combining Statement of Changes in Plan Net Position provides a summary of current year additions and deductions to the plan. At December 31, 2012, the date of the latest actuarial valuation, the current funding ratio was 68.1%. This means that HPRS had approximately $0.68 available for each $1.00 of projected pension liabilities. The Combining Statement of Plan Net Position and the Combining Statement of Changes in Plan Net Position report information about HPRS’s activities and financial position. These statements reflect the full accrual basis of accounting, which is similar to the accounting method used by most private sector companies. All of the current year’s revenues and expenses are taken into account regardless of when cash is received or paid. All investment gains and losses are shown at trade date rather than settlement date. Investments are shown at fair value, reflecting both realized and unrealized gains and losses. Each capital asset is depreciated over its expected useful life. The difference between HPRS assets and liabilities is reported on these statements as the Net Position – Restricted for Pension and Post-Employment Health Care Benefits. Over time, increases and decreases in HPRS’s net position are one indicator of whether the fund’s financial
Financial Section
Management’s Discussion and Analysis
Highway Patrol Retirement System 19
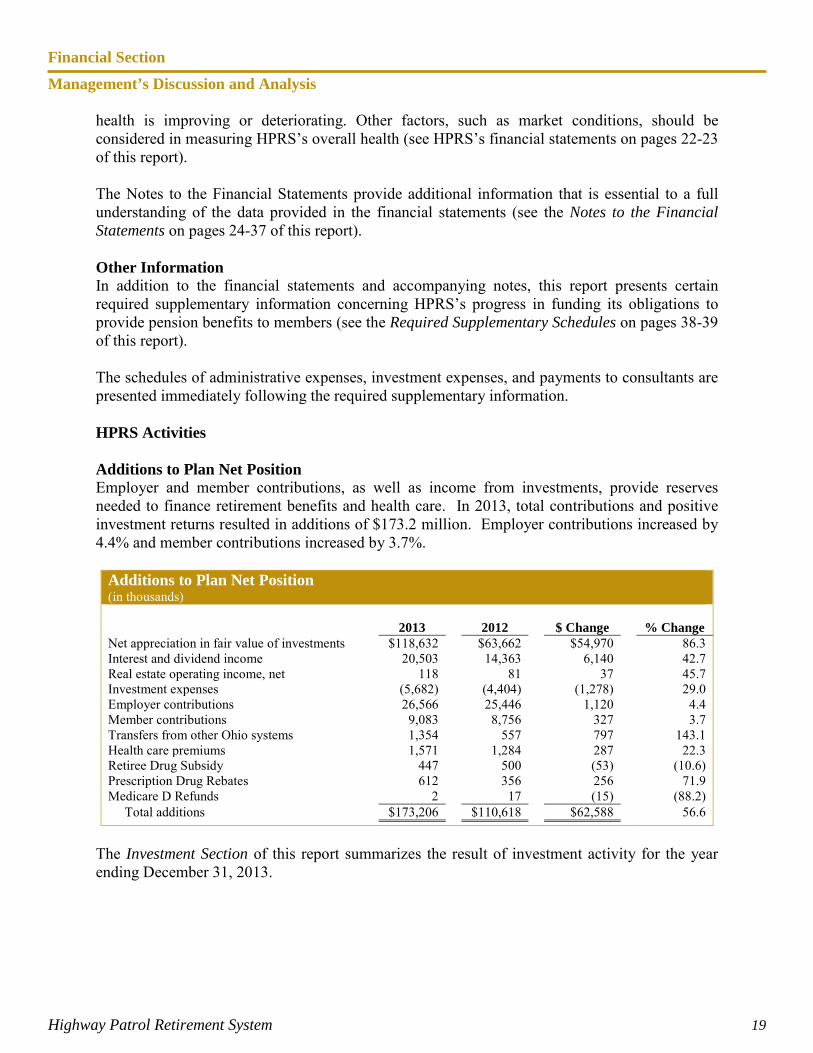
health is improving or deteriorating. Other factors, such as market conditions, should be considered in measuring HPRS’s overall health (see HPRS’s financial statements on pages 22-23 of this report). The Notes to the Financial Statements provide additional information that is essential to a full understanding of the data provided in the financial statements (see the Notes to the Financial Statements on pages 24-37 of this report). Other Information In addition to the financial statements and accompanying notes, this report presents certain required supplementary information concerning HPRS’s progress in funding its obligations to provide pension benefits to members (see the Required Supplementary Schedules on pages 38-39 of this report). The schedules of administrative expenses, investment expenses, and payments to consultants are presented immediately following the required supplementary information. HPRS Activities Additions to Plan Net Position Employer and member contributions, as well as income from investments, provide reserves needed to finance retirement benefits and health care. In 2013, total contributions and positive investment returns resulted in additions of $173.2 million. Employer contributions increased by 4.4% and member contributions increased by 3.7%.
Additions to Plan Net Position (in thousands)
2013 2012 $ Change % Change
Net appreciation in fair value of investments $118,632 $63,662 $54,970 86.3 Interest and dividend income 20,503 14,363 6,140 42.7 Real estate operating income, net 118 81 37 45.7 Investment expenses (5,682) (4,404) (1,278) 29.0 Employer contributions 26,566 25,446 1,120 4.4 Member contributions 9,083 8,756 327 3.7 Transfers from other Ohio systems 1,354 557 797 143.1 Health care premiums 1,571 1,284 287 22.3 Retiree Drug Subsidy 447 500 (53) (10.6) Prescription Drug Rebates 612 356 256 71.9 Medicare D Refunds 2 17 (15) (88.2) Total additions $173,206 $110,618 $62,588 56.6
The Investment Section of this report summarizes the result of investment activity for the year ending December 31, 2013.
Financial Section
Management’s Discussion and Analysis
Highway Patrol Retirement System 20
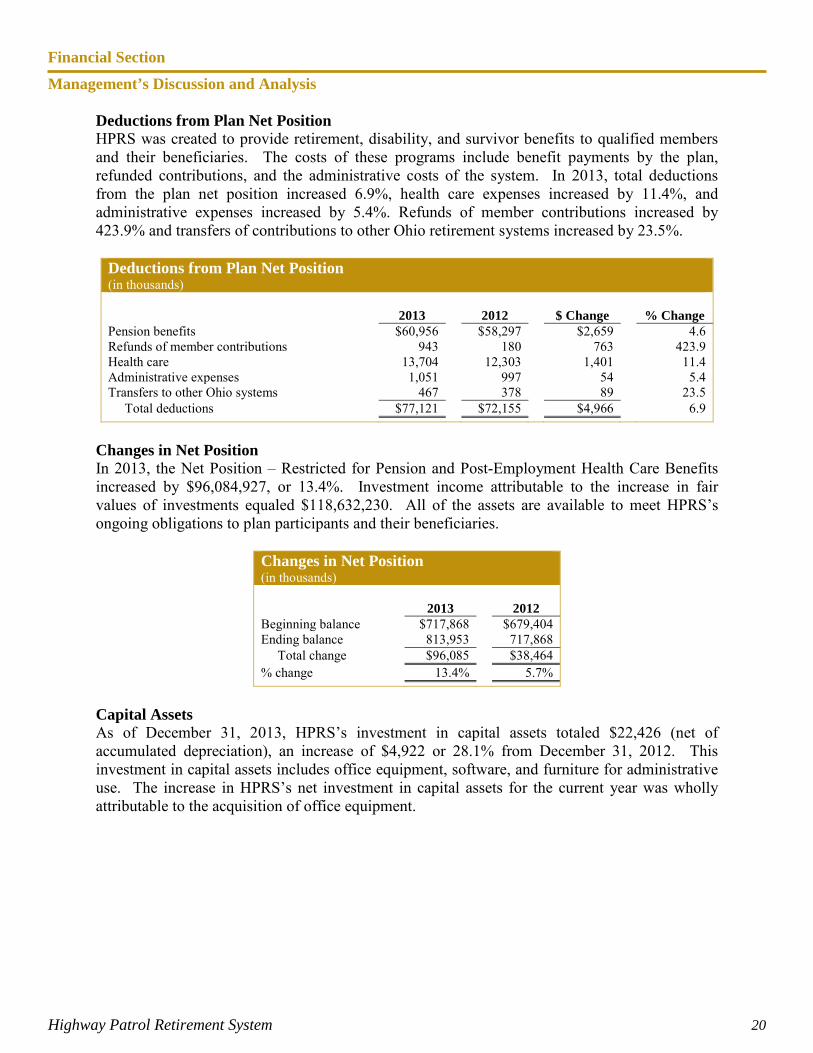
Deductions from Plan Net Position HPRS was created to provide retirement, disability, and survivor benefits to qualified members and their beneficiaries. The costs of these programs include benefit payments by the plan, refunded contributions, and the administrative costs of the system. In 2013, total deductions from the plan net position increased 6.9%, health care expenses increased by 11.4%, and administrative expenses increased by 5.4%. Refunds of member contributions increased by 423.9% and transfers of contributions to other Ohio retirement systems increased by 23.5%.
Deductions from Plan Net Position (in thousands)
2013 2012 $ Change % Change
Pension benefits $60,956 $58,297 $2,659 4.6 Refunds of member contributions 943 180 763 423.9 Health care 13,704 12,303 1,401 11.4 Administrative expenses 1,051 997 54 5.4 Transfers to other Ohio systems 467 378 89 23.5 Total deductions $77,121 $72,155 $4,966 6.9
Changes in Net Position In 2013, the Net Position – Restricted for Pension and Post-Employment Health Care Benefits increased by $96,084,927, or 13.4%. Investment income attributable to the increase in fair values of investments equaled $118,632,230. All of the assets are available to meet HPRS’s ongoing obligations to plan participants and their beneficiaries.
Changes in Net Position (in thousands)
2013 2012
Beginning balance $717,868 $679,404 Ending balance 813,953 717,868 Total change $96,085 $38,464 % change 13.4% 5.7%
Capital Assets As of December 31, 2013, HPRS’s investment in capital assets totaled $22,426 (net of accumulated depreciation), an increase of $4,922 or 28.1% from December 31, 2012. This investment in capital assets includes office equipment, software, and furniture for administrative use. The increase in HPRS’s net investment in capital assets for the current year was wholly attributable to the acquisition of office equipment.
Financial Section
Management’s Discussion and Analysis
Highway Patrol Retirement System 21
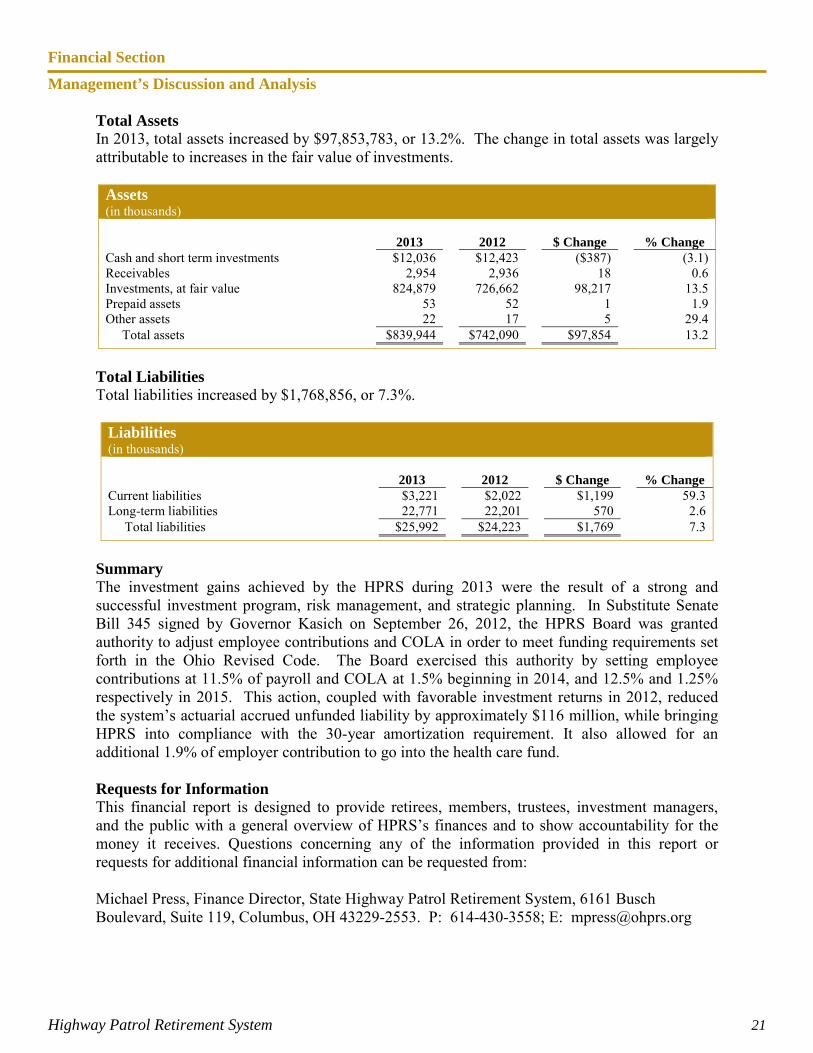
Total Assets In 2013, total assets increased by $97,853,783, or 13.2%. The change in total assets was largely attributable to increases in the fair value of investments.
Assets (in thousands)
2013 2012 $ Change % Change
Cash and short term investments $12,036 $12,423 ($387) (3.1) Receivables 2,954 2,936 18 0.6 Investments, at fair value 824,879 726,662 98,217 13.5 Prepaid assets 53 52 1 1.9 Other assets 22 17 5 29.4 Total assets $839,944 $742,090 $97,854 13.2
Total Liabilities Total liabilities increased by $1,768,856, or 7.3%.
Liabilities (in thousands) 2013 2012 $ Change % Change Current liabilities $3,221 $2,022 $1,199 59.3 Long-term liabilities 22,771 22,201 570 2.6 Total liabilities $25,992 $24,223 $1,769 7.3
Summary The investment gains achieved by the HPRS during 2013 were the result of a strong and successful investment program, risk management, and strategic planning. In Substitute Senate Bill 345 signed by Governor Kasich on September 26, 2012, the HPRS Board was granted authority to adjust employee contributions and COLA in order to meet funding requirements set forth in the Ohio Revised Code. The Board exercised this authority by setting employee contributions at 11.5% of payroll and COLA at 1.5% beginning in 2014, and 12.5% and 1.25% respectively in 2015. This action, coupled with favorable investment returns in 2012, reduced the system’s actuarial accrued unfunded liability by approximately $116 million, while bringing HPRS into compliance with the 30-year amortization requirement. It also allowed for an additional 1.9% of employer contribution to go into the health care fund. Requests for Information This financial report is designed to provide retirees, members, trustees, investment managers, and the public with a general overview of HPRS’s finances and to show accountability for the money it receives. Questions concerning any of the information provided in this report or requests for additional financial information can be requested from: Michael Press, Finance Director, State Highway Patrol Retirement System, 6161 Busch Boulevard, Suite 119, Columbus, OH 43229-2553. P: 614-430-3558; E: [email protected]
Financial Section
Highway Patrol Retirement System 22
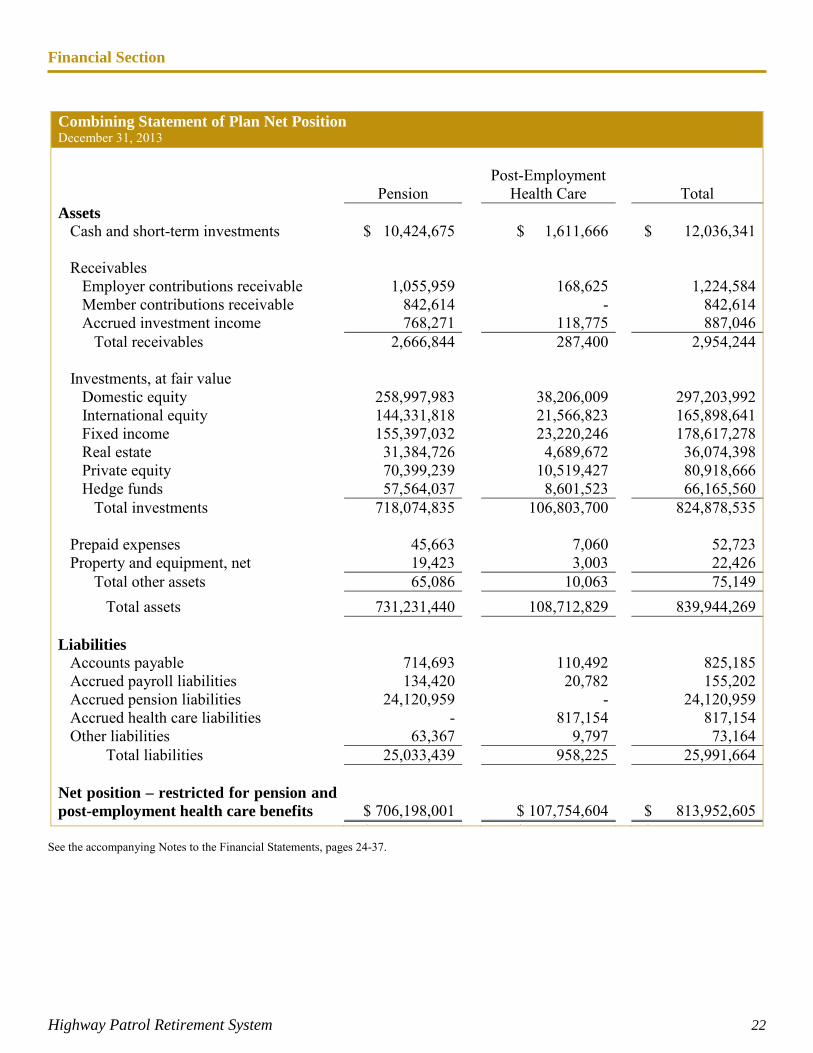
Combining Statement of Plan Net Position December 31, 2013 Post-Employment Pension Health Care Total Assets Cash and short-term investments $ 10,424,675 $ 1,611,666 $ 12,036,341 Receivables Employer contributions receivable 1,055,959 168,625 1,224,584 Member contributions receivable 842,614 - 842,614 Accrued investment income 768,271 118,775 887,046 Total receivables 2,666,844 287,400 2,954,244 Investments, at fair value Domestic equity 258,997,983 38,206,009 297,203,992 International equity 144,331,818 21,566,823 165,898,641 Fixed income 155,397,032 23,220,246 178,617,278 Real estate 31,384,726 4,689,672 36,074,398 Private equity 70,399,239 10,519,427 80,918,666 Hedge funds 57,564,037 8,601,523 66,165,560 Total investments 718,074,835 106,803,700 824,878,535 Prepaid expenses 45,663 7,060 52,723 Property and equipment, net 19,423 3,003 22,426 Total other assets 65,086 10,063 75,149 Total assets 731,231,440 108,712,829 839,944,269 Liabilities Accounts payable 714,693 110,492 825,185 Accrued payroll liabilities 134,420 20,782 155,202 Accrued pension liabilities 24,120,959 - 24,120,959 Accrued health care liabilities - 817,154 817,154 Other liabilities 63,367 9,797 73,164 Total liabilities 25,033,439 958,225 25,991,664 Net position – restricted for pension and post-employment health care benefits $ 706,198,001 $ 107,754,604 $ 813,952,605 $ 706 198 001 $ 107 754 604 $ 813 952 605
See the accompanying Notes to the Financial Statements, pages 24-37.
Financial Section
Highway Patrol Retirement System 23
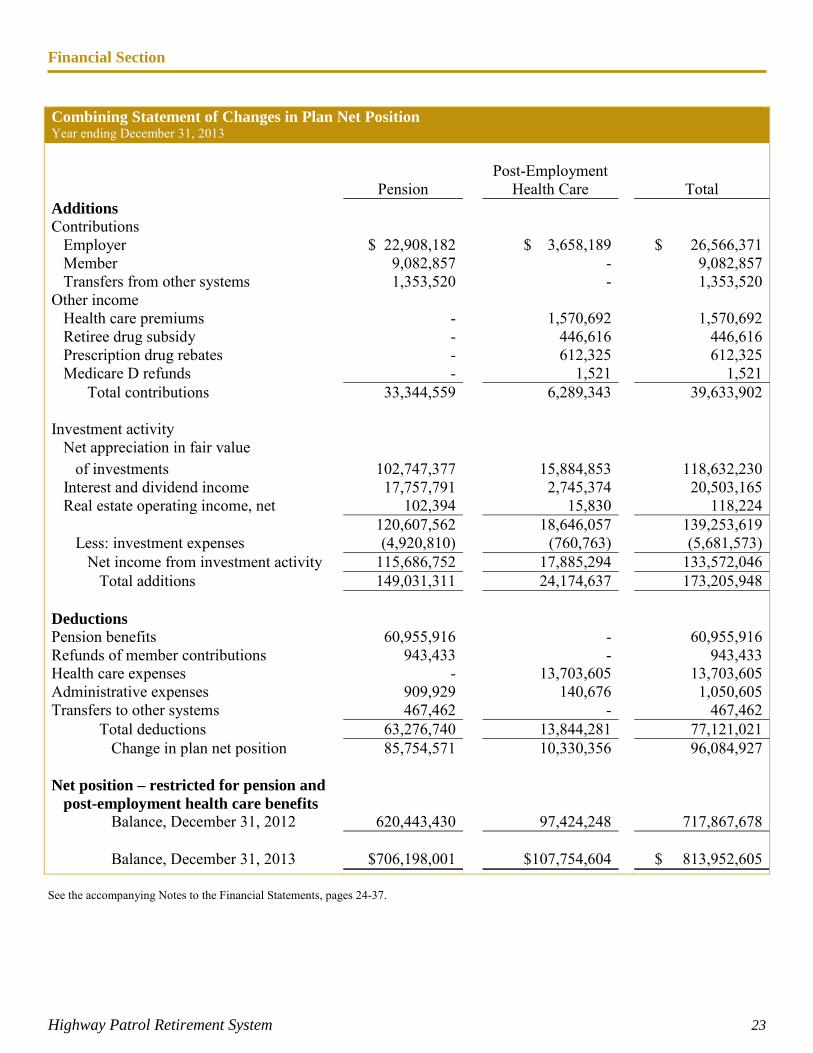
Combining Statement of Changes in Plan Net Position Year ending December 31, 2013 Post-Employment Pension Health Care Total Additions Contributions Employer $ 22,908,182 $ 3,658,189 $ 26,566,371 Member 9,082,857 - 9,082,857 Transfers from other systems 1,353,520 - 1,353,520 Other income Health care premiums - 1,570,692 1,570,692 Retiree drug subsidy - 446,616 446,616 Prescription drug rebates - 612,325 612,325 Medicare D refunds - 1,521 1,521 Total contributions 33,344,559 6,289,343 39,633,902 Investment activity Net appreciation in fair value of investments 102,747,377 15,884,853 118,632,230 Interest and dividend income 17,757,791 2,745,374 20,503,165 Real estate operating income, net 102,394 15,830 118,224 120,607,562 18,646,057 139,253,619 Less: investment expenses (4,920,810) (760,763) (5,681,573) Net income from investment activity 115,686,752 17,885,294 133,572,046 Total additions 149,031,311 24,174,637 173,205,948 Deductions Pension benefits 60,955,916 - 60,955,916 Refunds of member contributions 943,433 - 943,433 Health care expenses - 13,703,605 13,703,605 Administrative expenses 909,929 140,676 1,050,605 Transfers to other systems 467,462 - 467,462 Total deductions 63,276,740 13,844,281 77,121,021 Change in plan net position 85,754,571 10,330,356 96,084,927 Net position – restricted for pension and post-employment health care benefits Balance, December 31, 2012 620,443,430 97,424,248 717,867,678 Balance, December 31, 2013 $706,198,001 $107,754,604 $ 813,952,605
See the accompanying Notes to the Financial Statements, pages 24-37.
Financial Section
Notes to the Financial Statements
Highway Patrol Retirement System 24
Note 1 Summary of Significant Accounting Policies
Basis of Accounting HPRS financial statements are prepared using the accrual basis of accounting, under which expenses are recorded when incurred and revenues are recorded when earned and measurable. Member and employer contributions are recognized in the period in which the contributions are due. Benefits and refunds are recognized when due and payable in accordance with the terms of the plan. Investment purchases and sales are recorded at the trade date. Administrative expenses are financed by investment income.
The accounting and reporting policies of HPRS conform to generally accepted accounting principles in the United States of America (GAAP). The preparation of financial statements in conformity with GAAP requires management to make estimates and assumptions that affect the reported assets and liabilities, disclosure of contingent assets and liabilities, and the reported revenues and expenses during the accounting period. Actual results could differ from these estimates.
GASB (Governmental Accounting Standards Board) requires that plan assets be split between pension benefits and health care. To meet this requirement, plan assets and liabilities not specifically identifiable to a plan were proportionately allocated to the pension and post-employment health care plans.
Investment Accounting Income on all investments is recognized on the accrual basis. Gains and losses on sales and exchanges, recognized at the trade date, are determined using the average cost of equity securities sold, and for all other investments, the specific cost of securities sold. All investments are reported at fair value. Fair value is the amount that the plan could reasonably expect to receive in a current sale between a willing buyer and a willing seller, other than in a forced or liquidation sale. Securities traded on a national exchange are valued at the last reported sales price at the current exchange rate. Fair values of real estate and private equity investments are based on information provided by the fund’s managers or by independent appraisals. Net appreciation (or depreciation) in fair value of investments is determined by calculating the change in the fair value between the beginning of the year and the end of the year, less purchases at cost, plus sales at fair value. Investment expenses consist of expenses directly related to HPRS investment operations, as well as an allocation of certain administrative expenses. Use of Estimates In preparing financial statements in conformity with GAAP, the management of HPRS makes estimates and assumptions that affect (1) the reported amounts of assets
Financial Section
Notes to the Financial Statements
Highway Patrol Retirement System 25
and liabilities, (2) disclosures of contingent assets and liabilities, and (3) the amount of revenues and expenses during the reporting period. Actual results could differ from those estimates and assumptions. Certain investment assets, including private equity and real estate, use estimates in reporting fair value in the financial statements. These estimates are subject to uncertainty in the near term, which could result in changes in the values reported for those assets in the Combining Statement of Plan Net Position. Capital Assets When acquired, an item of property or equipment in excess of $5,000 is capitalized at cost. An improvement in excess of $5,000 that extends the useful life of an asset is capitalized. An expenditure for maintenance or repair of an asset is expensed as incurred. Depreciation is computed using the straight-line method over the useful life of each asset (typically, between three and ten years).
Accrued Health Care Liabilities Accrued health care liabilities are based upon estimates furnished by the claims administrators. These estimates have been developed from prior claims experience. In general, costs of member health care benefits are recognized as claims are incurred and premiums are paid. Health care benefit expenses of $13,703,605 for 2013 are shown on the accompanying Combining Statement of Changes in Plan Net Position. Contributions and Benefits Based on statutory requirements, employer and employee contributions are recognized when due. In accordance with the terms of the plan, benefits and refunds are recognized when due and payable. Federal Income Tax Status HPRS is a qualified entity under Section 501(a) of the Internal Revenue Code and is, therefore, exempt from federal income taxes. Changes in Accounting Principles GASB issued Statement No. 66, Technical Corrections – 2012 – an amendment of GASB Statements No. 10 and No. 62. This statement is effective for reporting periods beginning after December 15, 2012. Statement No. 66 resolves conflicting accounting and financial reporting guidance that could diminish the consistency of final reporting. Management has determined this statement does not impact HPRS. GASB issued Statement No. 67, Financial Reporting for Pension Plans – an amendment of GASB Statement No. 25. This statement is effective for reporting periods beginning after June 15, 2013, and establishes standards for measuring and recognizing liabilities, deferred outflows and inflows of resources, and expenses/expenditures. For defined benefit pensions, Statement No. 67 identifies the methods and assumptions that should be used to project benefit payments, discount projected benefit payments to their actuarial present value, and attribute that present value to periods of employee service. This statement enhances note disclosures and
Financial Section
Notes to the Financial Statements
Highway Patrol Retirement System 26
required supplementary information for both defined benefit and defined contribution plans. Management is currently evaluating this statement and its impact to HPRS financial statements. GASB issued Statement No. 68, Accounting and Financial Reporting for Pensions – an amendment of GASB Statement No. 27. This statement is effective for reporting periods beginning after June 15, 2014. This statement significantly changes accounting and financial reporting for government employers (and non-employer contributing entities) that provide pension benefits through a qualifying trust – requiring a “net pension liability” on the statement of net position. Under Statement No. 68, the pension liability is determined considering various factors including cost-of-living increases, future salary increases, and future service credits. The impact on the net pension liability of differences between expected and actual investment returns will be recognized in pension expense over a closed, five-year period. This statement also enhances note disclosures and required supplementary information. Management is currently evaluating this statement and its impact to HPRS financial statements.
GASB issued Statement No. 69, Government Combinations and Disposals of Government Operations. This statement is effective for reporting periods beginning after December 15, 2013. This statement requires disclosures to be made about government combinations and disposals of government operations to enable financial statement users to evaluate the nature and financial effects of these transactions. Management has determined this statement does not impact HPRS. GASB issued Statement No. 70, Accounting and Financial Reporting for Nonexchange Financial Guarantees, which specifies the information required to be disclosed by governments that extend nonexchange financial guarantees. This statement is effective for reporting periods beginning after June 15, 2013. Management has determined this statement does not impact HPRS.
GASB issued Statement No. 71, Pension Transition for Contributions Made Subsequent to Measurement Date – an amendment of GASB Statement No. 68. This statement should be applied simultaneously with the provisions of Statement No. 68. This statement amends paragraph 137 of Statement No. 68 to require that, at transition, a government recognize a beginning deferred outflow of resources for its pension contributions, if any, made subsequent to the measurement date at the beginning net pension liability. Management is currently evaluating this statement and its impact to HPRS financial statements.
Note 2 Plan Description
Organization HPRS is a single-employer retirement system for employees of the Ohio State Highway Patrol, including officers with arrest authority, cadets in training at the Highway Patrol Training Academy, and members of the radio division who were hired prior to November 2, 1989. HPRS was created by Ohio Revised Code Chapter
Financial Section
Notes to the Financial Statements
Highway Patrol Retirement System 27
5505 and is administered by a Board of Trustees consisting of five active members, two retired members, three appointed members, and one ex-officio member. The Board appoints an executive director, chief investment officer, actuary, investment consultant, medical advisor, and internal auditor. HPRS administers both a defined benefit pension plan and a post-employment health care plan, which is considered to be an “other post-employment benefit,” or OPEB. Financial information for pensions and OPEB are presented separately in the combining financial statements. HPRS, a separate financial reporting entity in accordance with criteria established by GASB Statement No. 39 (an amendment to No. 14), is a component unit of the State of Ohio. HPRS does not have financial accountability over any other entities.
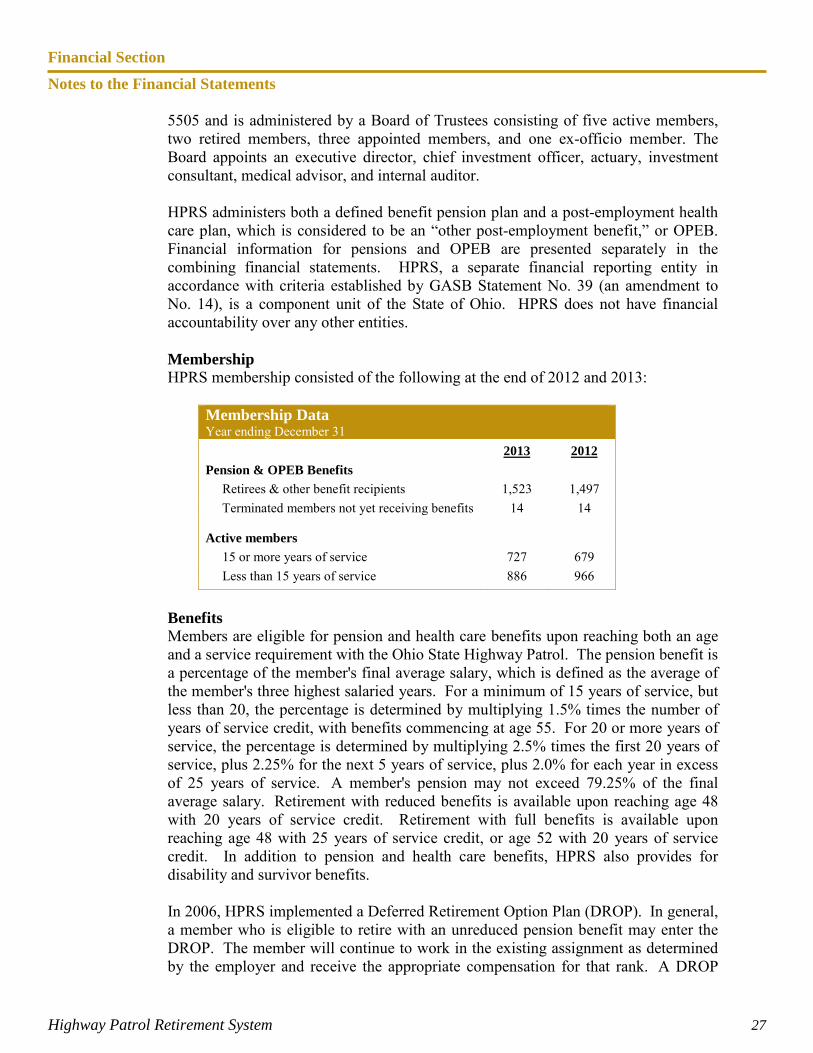
Membership HPRS membership consisted of the following at the end of 2012 and 2013:
Membership Data Year ending December 31 2013 2012 Pension & OPEB Benefits Retirees & other benefit recipients 1,523 1,497 Terminated members not yet receiving benefits 14 14 Active members 15 or more years of service 727 679 Less than 15 years of service 886 966
Benefits Members are eligible for pension and health care benefits upon reaching both an age and a service requirement with the Ohio State Highway Patrol. The pension benefit is a percentage of the member's final average salary, which is defined as the average of the member's three highest salaried years. For a minimum of 15 years of service, but less than 20, the percentage is determined by multiplying 1.5% times the number of years of service credit, with benefits commencing at age 55. For 20 or more years of service, the percentage is determined by multiplying 2.5% times the first 20 years of service, plus 2.25% for the next 5 years of service, plus 2.0% for each year in excess of 25 years of service. A member's pension may not exceed 79.25% of the final average salary. Retirement with reduced benefits is available upon reaching age 48 with 20 years of service credit. Retirement with full benefits is available upon reaching age 48 with 25 years of service credit, or age 52 with 20 years of service credit. In addition to pension and health care benefits, HPRS also provides for disability and survivor benefits. In 2006, HPRS implemented a Deferred Retirement Option Plan (DROP). In general, a member who is eligible to retire with an unreduced pension benefit may enter the DROP. The member will continue to work in the existing assignment as determined by the employer and receive the appropriate compensation for that rank. A DROP
Financial Section
Notes to the Financial Statements
Highway Patrol Retirement System 28
member does not accumulate additional pension service credit; however, instead of receiving a monthly pension benefit, the member accrues that benefit in a tax-deferred account until employment with the Ohio State Highway Patrol is terminated. At December 31, 2013, HPRS had a DROP liability of $22,770,174 to 134 DROP participants. Contributions The Ohio Revised Code requires contributions by both active members and the Ohio State Highway Patrol. Both the member and employer contribution rates were established by the Ohio General Assembly, and any change in the rates required legislative action. Legislative action occurred in 2012 and became effective in 2013. The HPRS Board was granted the authority to adjust employee contributions between a range of 10.0-14.0% of payroll. In 2013, the member contribution rate was 10.0% of payroll and the employer contribution rate was 26.5%. Based on the December 31, 2011, actuarial valuation, the Board allocated the employer contribution rate to pension benefits effective January 1, 2012, and OPEB as follows:
Pension OPEB Total 24.75% 1.75% 26.50%
Based on the December 31, 2012, actuarial valuation, the Board allocated the employer contribution rate to pension benefits effective January 1, 2013, and OPEB as follows:
Pension OPEB Total 22.85% 3.65% 26.50%
In August 2013, the Board exercised the new authority granted by Legislature and voted to set the employee contribution rate at 11.5% and the COLA for retirees at 1.5% beginning in 2014, and 12.5% and 1.25% respectively for 2015. These changes brought HPRS into compliance with the 30-year amortization requirement. Upon request of a member who terminates employment with the Ohio State Highway Patrol, member contributions are refunded. If a member dies while active in the service of the Ohio State Highway Patrol, member contributions are refunded to the member's beneficiary, provided that no survivor benefits are payable. A member with credited service in Ohio Public Employees Retirement System (OPERS), School Employees Retirement System (SERS), State Teachers Retirement System (STRS), Ohio Police & Fire Pension Fund (OP&F), or Cincinnati Retirement System (CRS) may transfer that service credit to HPRS. Similarly, a member with
Financial Section
Notes to the Financial Statements
Highway Patrol Retirement System 29
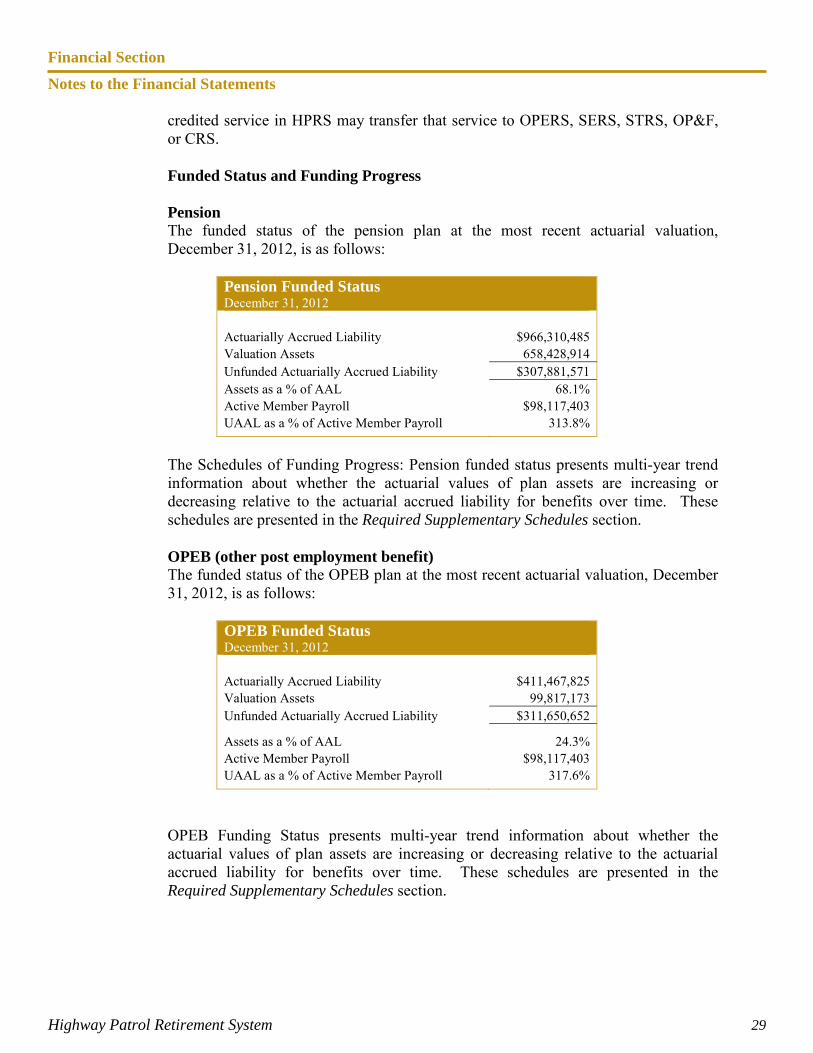
credited service in HPRS may transfer that service to OPERS, SERS, STRS, OP&F, or CRS. Funded Status and Funding Progress Pension The funded status of the pension plan at the most recent actuarial valuation, December 31, 2012, is as follows:
Pension Funded Status December 31, 2012 Actuarially Accrued Liability $966,310,485 Valuation Assets 658,428,914 Unfunded Actuarially Accrued Liability $307,881,571 Assets as a % of AAL 68.1% Active Member Payroll $98,117,403 UAAL as a % of Active Member Payroll 313.8%
The Schedules of Funding Progress: Pension funded status presents multi-year trend information about whether the actuarial values of plan assets are increasing or decreasing relative to the actuarial accrued liability for benefits over time. These schedules are presented in the Required Supplementary Schedules section. OPEB (other post employment benefit) The funded status of the OPEB plan at the most recent actuarial valuation, December 31, 2012, is as follows:
OPEB Funded Status December 31, 2012 Actuarially Accrued Liability $411,467,825 Valuation Assets 99,817,173 Unfunded Actuarially Accrued Liability $311,650,652
Assets as a % of AAL 24.3% Active Member Payroll $98,117,403 UAAL as a % of Active Member Payroll 317.6%
OPEB Funding Status presents multi-year trend information about whether the actuarial values of plan assets are increasing or decreasing relative to the actuarial accrued liability for benefits over time. These schedules are presented in the Required Supplementary Schedules section.
Financial Section
Notes to the Financial Statements
Highway Patrol Retirement System 30
Actuarial Assumptions and Methods An entry age normal actuarial cost method of valuation is used in determining benefit liabilities and normal cost. Differences between assumed experience and actual experience (“actuarial gains and losses”) become part of actuarially accrued liabilities. Unfunded actuarially accrued liabilities are amortized to produce payments (principal and interest) that are a level percent of payroll contributions. The health care coverage provided by HPRS is considered to be another OPEB as described in GASB Statement 45. Health care benefits are not guaranteed and are subject to change at any time. The OPEB valuation is based on the substantive plan as it is currently presented to plan members, including the historical pattern of cost-sharing between the plan and benefit recipients. The actuarial methods and assumptions do not explicitly incorporate the potential effects of legal or contractual funding limitations on the pattern of cost sharing in the future. The actuarially determined amounts for the OPEB plan are subject to continual revision as results are compared to past expectations and new estimates are made about the future. The actuarial calculations of the OPEB plan reflect a long-term perspective. The asset valuation method fully recognizes assumed investment income each year. Differences between actual and expected investment income are phased in over a closed four-year period. Other actuarial assumptions and methods are as follows:
• projected investment return of 8.0% for pension assets and 5.0% for OPEB assets, compounded annually, net of administration expenses,
• projected salary increases of 4.0%, compounded annually, attributable to inflation,
• projected price inflation of 3.0%, compounded annually, • additional projected salary increases attributable to seniority and merit,
ranging from 0.3% to 10.0% per year, depending on service, • post-employment mortality life expectancies of members based on RP-2000
Combined Healthy Male and Female Tables projected to 2020 using Projection Scale AA,
• probabilities of early withdrawal from active service based on actual plan experience,
• for disability retirement, impaired longevity is based on the RP-2000 Combined Healthy Male and Female Tables, set forward 5 years,
• 50% of disability retirements is assumed to be duty-related and 50% is assumed to be non-duty-related,
• health care inflation of 4.0%, compounded annually, plus an additional declining percentage ranging from 5.0% - 0.5% through 2021,
• OPEB recipients are eligible for Medicare at age 65 or at the time of a social security disability,
Financial Section
Notes to the Financial Statements
Highway Patrol Retirement System 31
• employer contributions are assumed to be received in equal installments throughout the year, and
• maximum contribution rates have not been considered in the projection of actuarially accrued liabilities for pension or OPEB benefits.
Note 3 Net Position
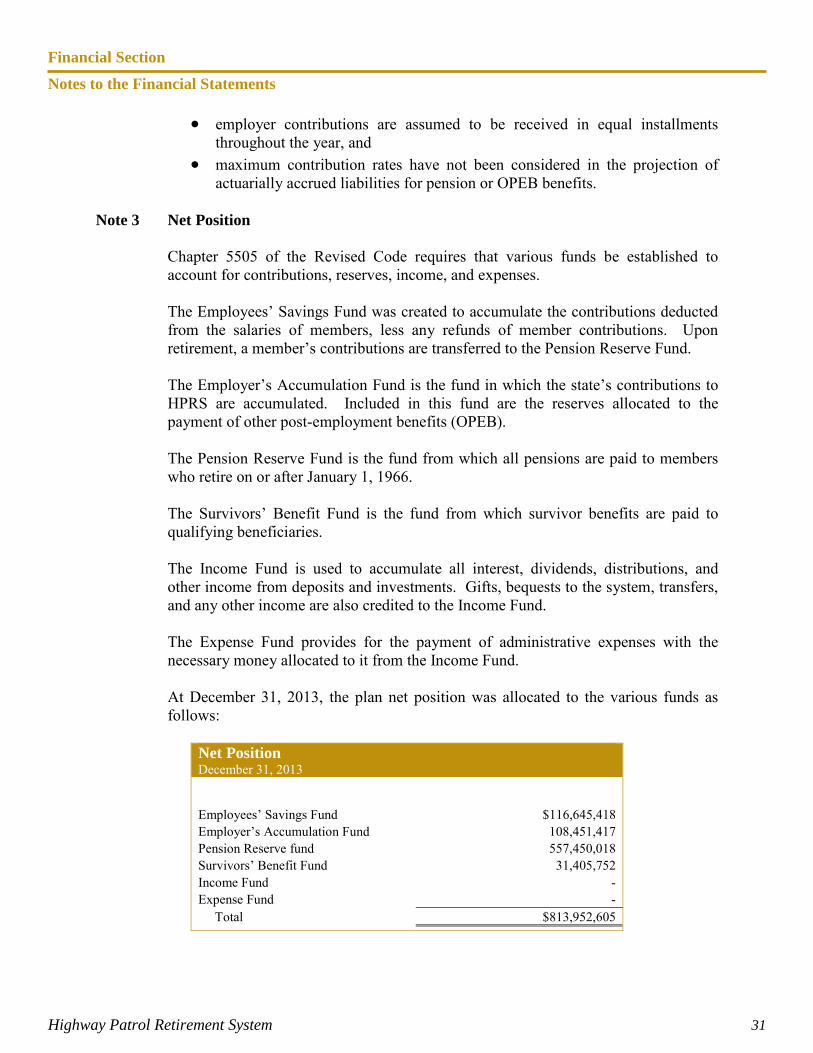
Chapter 5505 of the Revised Code requires that various funds be established to account for contributions, reserves, income, and expenses. The Employees’ Savings Fund was created to accumulate the contributions deducted from the salaries of members, less any refunds of member contributions. Upon retirement, a member’s contributions are transferred to the Pension Reserve Fund. The Employer’s Accumulation Fund is the fund in which the state’s contributions to HPRS are accumulated. Included in this fund are the reserves allocated to the payment of other post-employment benefits (OPEB). The Pension Reserve Fund is the fund from which all pensions are paid to members who retire on or after January 1, 1966. The Survivors’ Benefit Fund is the fund from which survivor benefits are paid to qualifying beneficiaries. The Income Fund is used to accumulate all interest, dividends, distributions, and other income from deposits and investments. Gifts, bequests to the system, transfers, and any other income are also credited to the Income Fund. The Expense Fund provides for the payment of administrative expenses with the necessary money allocated to it from the Income Fund. At December 31, 2013, the plan net position was allocated to the various funds as follows:
Net Position December 31, 2013
Employees’ Savings Fund $116,645,418 Employer’s Accumulation Fund 108,451,417 Pension Reserve fund 557,450,018 Survivors’ Benefit Fund 31,405,752 Income Fund - Expense Fund - Total $813,952,605
Financial Section
Notes to the Financial Statements
Highway Patrol Retirement System 32
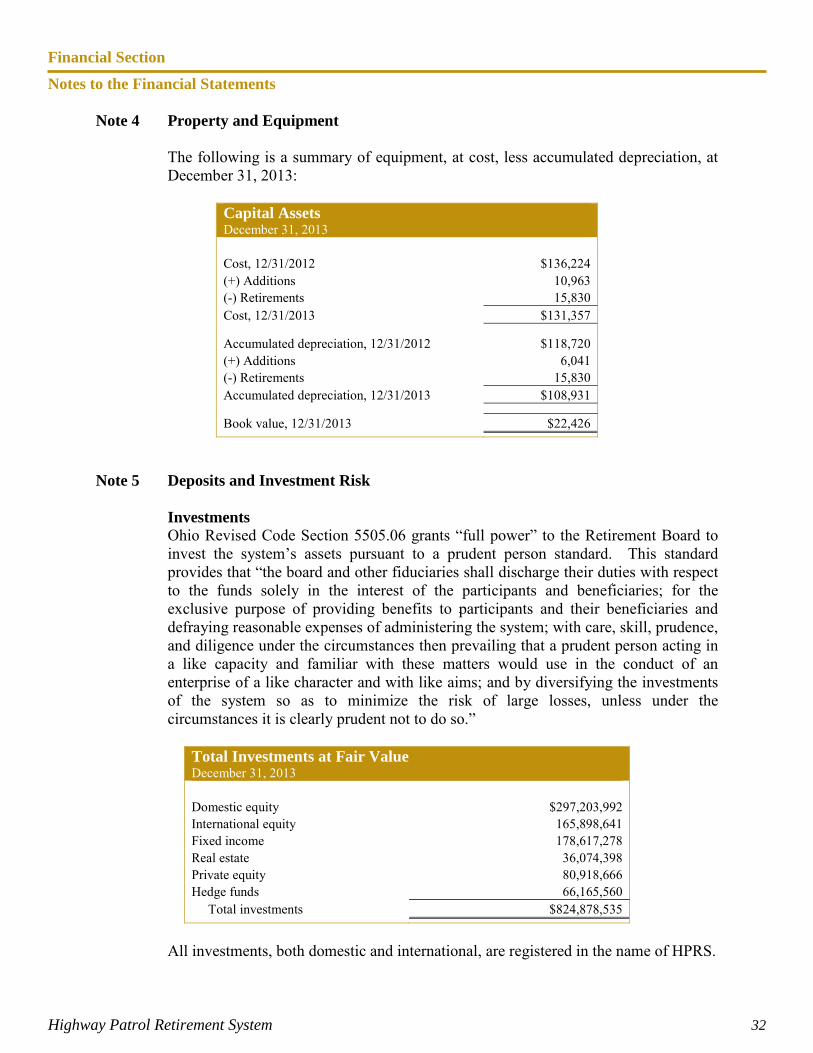
Note 4 Property and Equipment The following is a summary of equipment, at cost, less accumulated depreciation, at December 31, 2013:
Capital Assets December 31, 2013 Cost, 12/31/2012 $136,224 (+) Additions 10,963 (-) Retirements 15,830 Cost, 12/31/2013 $131,357
Accumulated depreciation, 12/31/2012 $118,720 (+) Additions 6,041 (-) Retirements 15,830 Accumulated depreciation, 12/31/2013 $108,931 Book value, 12/31/2013 $22,426
Note 5 Deposits and Investment Risk
Investments Ohio Revised Code Section 5505.06 grants “full power” to the Retirement Board to invest the system’s assets pursuant to a prudent person standard. This standard provides that “the board and other fiduciaries shall discharge their duties with respect to the funds solely in the interest of the participants and beneficiaries; for the exclusive purpose of providing benefits to participants and their beneficiaries and defraying reasonable expenses of administering the system; with care, skill, prudence, and diligence under the circumstances then prevailing that a prudent person acting in a like capacity and familiar with these matters would use in the conduct of an enterprise of a like character and with like aims; and by diversifying the investments of the system so as to minimize the risk of large losses, unless under the circumstances it is clearly prudent not to do so.”
Total Investments at Fair Value December 31, 2013 Domestic equity $297,203,992 International equity 165,898,641 Fixed income 178,617,278 Real estate 36,074,398 Private equity 80,918,666 Hedge funds 66,165,560 Total investments $824,878,535
All investments, both domestic and international, are registered in the name of HPRS.
Financial Section
Notes to the Financial Statements
Highway Patrol Retirement System 33
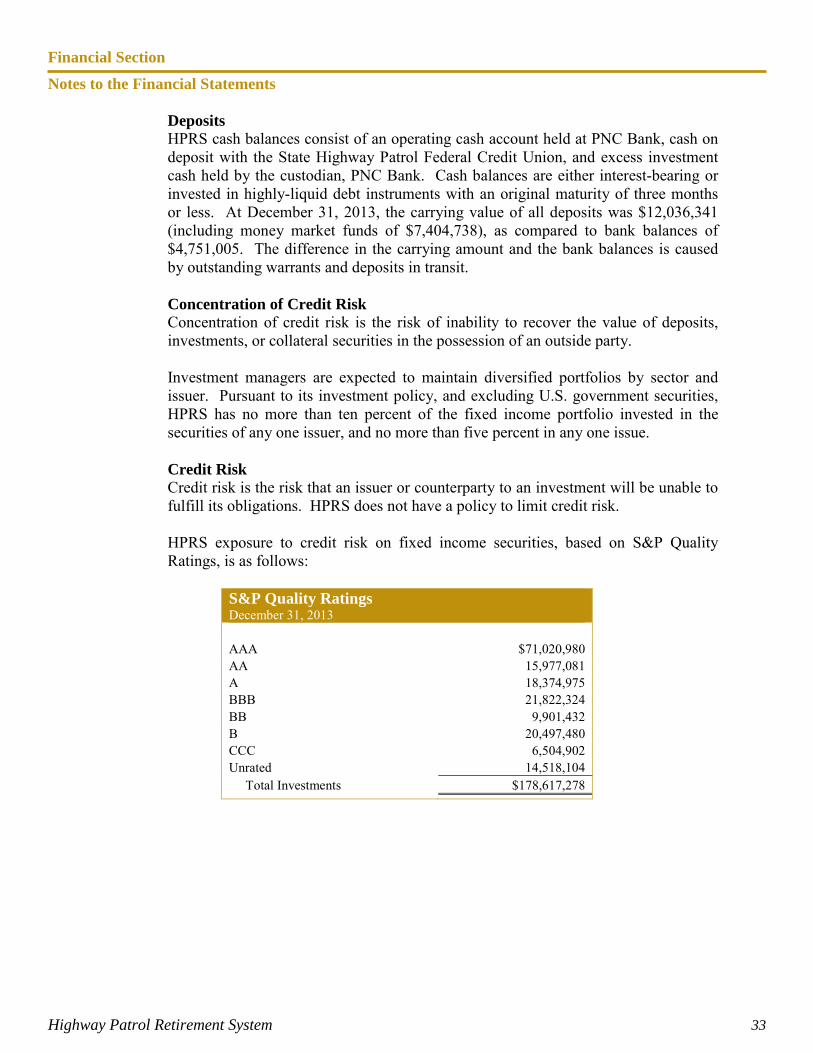
Deposits HPRS cash balances consist of an operating cash account held at PNC Bank, cash on deposit with the State Highway Patrol Federal Credit Union, and excess investment cash held by the custodian, PNC Bank. Cash balances are either interest-bearing or invested in highly-liquid debt instruments with an original maturity of three months or less. At December 31, 2013, the carrying value of all deposits was $12,036,341 (including money market funds of $7,404,738), as compared to bank balances of $4,751,005. The difference in the carrying amount and the bank balances is caused by outstanding warrants and deposits in transit.
Concentration of Credit Risk Concentration of credit risk is the risk of inability to recover the value of deposits, investments, or collateral securities in the possession of an outside party. Investment managers are expected to maintain diversified portfolios by sector and issuer. Pursuant to its investment policy, and excluding U.S. government securities, HPRS has no more than ten percent of the fixed income portfolio invested in the securities of any one issuer, and no more than five percent in any one issue. Credit Risk Credit risk is the risk that an issuer or counterparty to an investment will be unable to fulfill its obligations. HPRS does not have a policy to limit credit risk.
HPRS exposure to credit risk on fixed income securities, based on S&P Quality Ratings, is as follows:
S&P Quality Ratings December 31, 2013 AAA $71,020,980 AA 15,977,081 A 18,374,975 BBB 21,822,324 BB 9,901,432 B 20,497,480 CCC 6,504,902 Unrated 14,518,104 Total Investments $178,617,278
Financial Section
Notes to the Financial Statements
Highway Patrol Retirement System 34
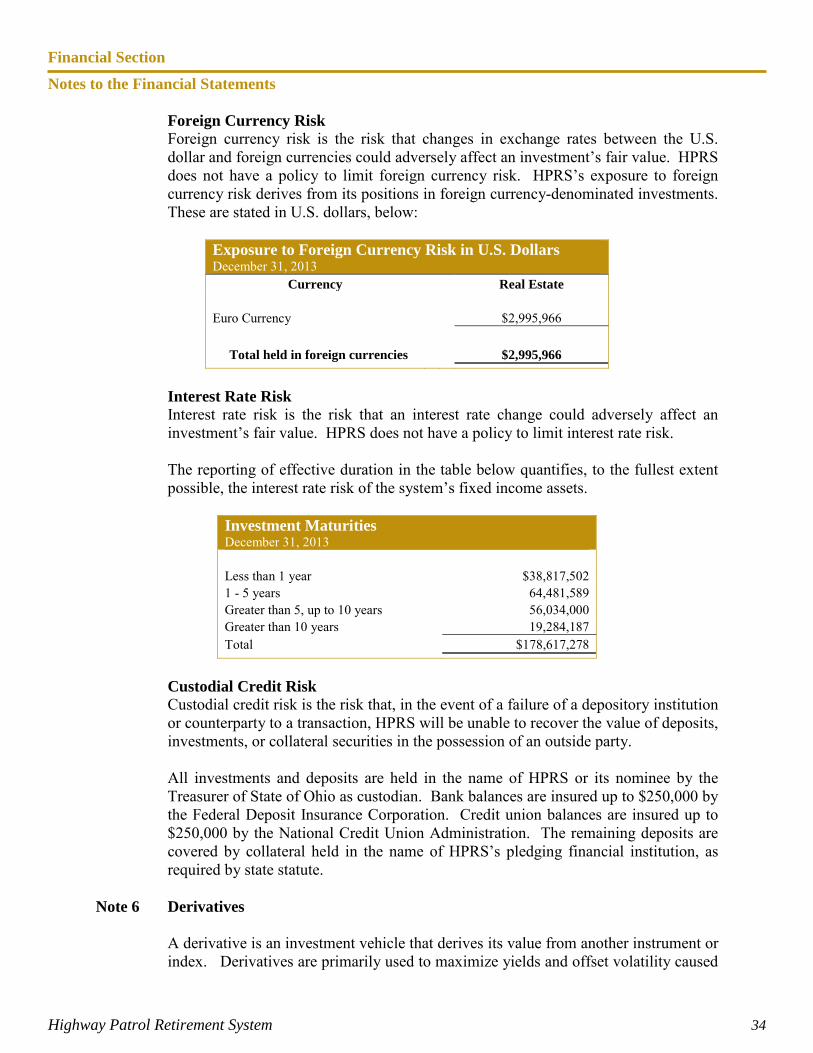
Foreign Currency Risk Foreign currency risk is the risk that changes in exchange rates between the U.S. dollar and foreign currencies could adversely affect an investment’s fair value. HPRS does not have a policy to limit foreign currency risk. HPRS’s exposure to foreign currency risk derives from its positions in foreign currency-denominated investments. These are stated in U.S. dollars, below:
Exposure to Foreign Currency Risk in U.S. Dollars December 31, 2013
Currency Real Estate
Euro Currency
$2,995,966
Total held in foreign currencies
$2,995,966
Interest Rate Risk Interest rate risk is the risk that an interest rate change could adversely affect an investment’s fair value. HPRS does not have a policy to limit interest rate risk. The reporting of effective duration in the table below quantifies, to the fullest extent possible, the interest rate risk of the system’s fixed income assets.
Investment Maturities December 31, 2013 Less than 1 year $38,817,502 1 - 5 years 64,481,589 Greater than 5, up to 10 years 56,034,000 Greater than 10 years 19,284,187 Total $178,617,278
Custodial Credit Risk Custodial credit risk is the risk that, in the event of a failure of a depository institution or counterparty to a transaction, HPRS will be unable to recover the value of deposits, investments, or collateral securities in the possession of an outside party. All investments and deposits are held in the name of HPRS or its nominee by the Treasurer of State of Ohio as custodian. Bank balances are insured up to $250,000 by the Federal Deposit Insurance Corporation. Credit union balances are insured up to $250,000 by the National Credit Union Administration. The remaining deposits are covered by collateral held in the name of HPRS’s pledging financial institution, as required by state statute.
Note 6 Derivatives
A derivative is an investment vehicle that derives its value from another instrument or index. Derivatives are primarily used to maximize yields and offset volatility caused
Financial Section
Notes to the Financial Statements
Highway Patrol Retirement System 35
by interest rate and currency fluctuations. These instruments leave investors exposed to various credit, market, and legal risks. At December 31, 2013, HPRS did not have any direct investments in derivatives; however, it held shares in commingled funds that had incidental exposure to derivatives.
Note 7 Pension and OPEB Benefits for Employees
Pension The employees of HPRS are members of the Ohio Public Employee Retirement System (OPERS), which administers three separate pension plans as described below:
1. The Traditional Pension Plan - a cost sharing, multiple-employer defined benefit pension plan.
2. The Member-Directed Plan - a defined contribution plan in which the
member invests both member and employer contributions (employer contributions vest over five years at 20% per year). Under the Member-Directed Plan, members accumulate retirement assets equal to the value of member and (vested) employer contributions, plus any investment earnings.
3. The Combined Plan - a cost sharing, multiple-employer defined benefit
pension plan. Under the Combined Plan, OPERS invests employer contributions to provide a formula retirement benefit similar in nature to, but less than, the Traditional Pension Plan benefit. Member contributions, the investment of which are self-directed by the members, accumulate retirement assets in a manner similar to the Member-Directed Plan.
OPERS provides retirement, disability, survivor and death benefits and annual cost-of-living adjustments to members of the Traditional Pension and Combined Plans. Members of the Member-Directed Plan do not qualify for ancillary benefits. Authority to establish and amend benefits is provided in Chapter 145 of the Ohio Revised Code.
The Ohio Revised Code provides statutory authority for member and employer contributions. For 2013, member and employer contribution rates were consistent across all three plans. While members in the state and local divisions may participate in all three plans, law enforcement and public safety divisions exist only within the Traditional Pension Plan. The 2013 member contribution rates were 10.00% of covered payroll for members in state and local classifications. Public safety and law enforcement members contributed 12.00% and 12.60%, respectively. Effective January 1, 2014, the member contribution rates for public safety and law enforcement members increased to 12.00% and 13.00% respectively. The 2013 employer
Financial Section
Notes to the Financial Statements
Highway Patrol Retirement System 36
contribution rate was 14.00% of covered payroll. The law enforcement and public safety division employer contribution rate was 18.10% of covered payroll. HPRS employer contributions to OPERS for the years ending December 31, 2013, 2012, and 2011, were $98,036, $83,482, and $75,680, respectively, which were equal to the required contributions for each year. In June 2012, the Governmental Accounting Standards Board (GASB) issued GASB Statement No. 68, Accounting and Financial Reporting for Pensions. This accounting standard replaces GASB Statement 27, and it is effective for employer fiscal years beginning after June 15, 2014.
OPEB As described above, OPERS administers three separate pension plans — the Traditional Pension Plan, the Member-Directed Plan, and the Combined Plan. OPERS maintains a cost-sharing multiple employer defined benefit post-employment health care plan, which includes a medical plan, prescription drug program, and Medicare Part B premium reimbursement to qualifying members of both the Traditional Pension and the Combined Plans. Members of the Member-Directed Plan do not qualify for ancillary benefits, including post-employment health care coverage. In order to qualify for post-employment health care coverage, age-and-service retirees under the Traditional Pension and Combined Plans must have ten or more years of qualifying Ohio service credit. Health care coverage for disability benefit recipients and qualified survivor benefit recipients is available. The health care coverage provided by OPERS meets the definition of an “other post-employment benefit” as described in GASB Statement 45. The Ohio Revised Code permits, but does not mandate, OPERS to provide the OPEB Plan to its eligible members and beneficiaries. Authority to establish and amend the OPEB Plan is provided in Chapter 145 of the Ohio Revised Code. OPERS issues a stand-alone financial report. Interested parties may obtain a copy by visiting https://www.opers.org/investments/cafr.shtml, by writing to OPERS, 277 East Town Street, Columbus, OH 43215-4642, or by calling 614-222-5601 or 800-222-7377.
Funding Policy The Ohio Revised Code provides the statutory authority requiring public employers to fund post-retirement health care coverage through their contributions to OPERS. A portion of each employer’s contribution to OPERS is set aside for the funding of post-retirement health care coverage. Employer contribution rates are expressed as a percentage of the covered payroll of active members. In 2013, state and local employers contributed at a rate of 14.00% of covered payroll and public safety and law enforcement employers contributed at
Financial Section
Notes to the Financial Statements
Highway Patrol Retirement System 37
18.10%. These are the maximum employer contribution rates permitted by the Ohio Revised Code. Active members do not make contributions to the OPEB Plan. OPERS’ Post Employment Health Care plan was established under, and is administrated in accordance with, Internal Revenue Code 401(h). Each year, the OPERS Board of Trustees determines the portion of the employer contribution rate that will be set aside for funding of post employment health care benefits. The portion of employer contributions allocated to health care for members in the Traditional Plan was 1.00% during calendar year 2013. The portion of employer contributions allocated to health care for members in the Combined Plan was 1.00% during calendar year 2013. Effective January 1, 2014, the portion of employer contributions allocated to health care was raised to 2 percent for both plans, as recommended by the OPERS Actuary. The OPERS Board of Trustees is also authorized to establish rules for the retiree or their surviving beneficiaries to pay a portion of the health care benefits provided. Payment amounts vary depending on the number of covered dependents and the coverage selected. Annual OPEB Cost The rates stated above are the contractually required contribution rates for OPERS. HPRS employer contributions to OPERS for OPEB benefits for the year ending December 31, 2013, were $7,003, which were equal to the required contributions for the year, and included in the employer contribution amount listed earlier in this Note. Health Care Plan Changes to the health care plan were adopted by the OPERS Board of Trustees on September 19, 2012, with a transition plan commencing January 1, 2014. With the recent passage of pension legislation under SB 343 and the approved health care changes, OPERS expects to be able to consistently allocate 4 percent of the employer contributions toward the health care fund after the end of the transition period.
Note 8 Risk Management HPRS purchases insurance coverage for general liability, property damage, and employee and public official liability with varying policy limits. In the past three years, no settlements have exceeded insurance coverage, and coverage has not been significantly reduced.
Note 9 Contingent Liabilities
At any given time, HPRS is a party to various litigation actions. While the final outcome of any action can not be determined, management does not expect that the liability, if any, for these legal actions will have a material adverse effect on the financial position of HPRS.
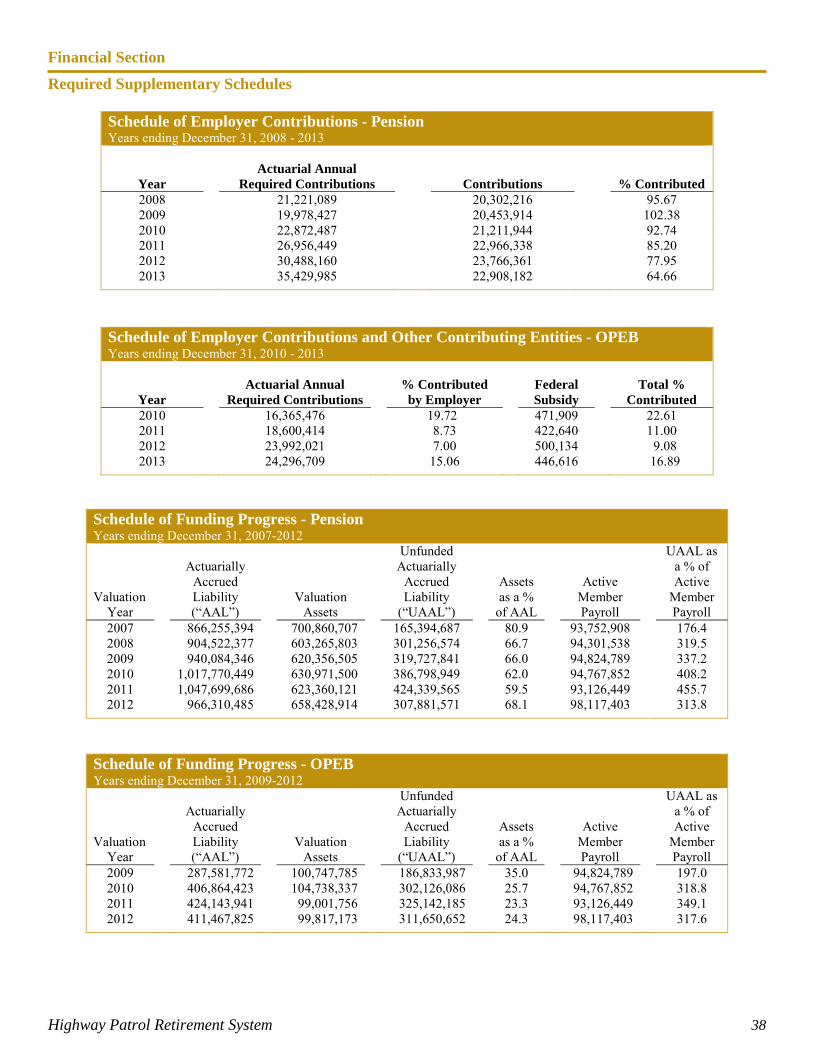
Financial Section
Required Supplementary Schedules
Highway Patrol Retirement System 38
Schedule of Employer Contributions - Pension Years ending December 31, 2008 - 2013
Actuarial Annual Year Required Contributions Contributions % Contributed 2008 21,221,089 20,302,216 95.67 2009 19,978,427 20,453,914 102.38 2010 22,872,487 21,211,944 92.74 2011 26,956,449 22,966,338 85.20 2012 30,488,160 23,766,361 77.95 2013 35,429,985 22,908,182 64.66
Schedule of Employer Contributions and Other Contributing Entities - OPEB Years ending December 31, 2010 - 2013
Actuarial Annual % Contributed Federal Total %
Year Required Contributions by Employer Subsidy Contributed 2010 16,365,476 19.72 471,909 22.61 2011 18,600,414 8.73 422,640 11.00 2012 23,992,021 7.00 500,134 9.08 2013 24,296,709 15.06 446,616 16.89
Schedule of Funding Progress - Pension Years ending December 31, 2007-2012
Valuation Year
Actuarially
Accrued Liability (“AAL”)
Valuation Assets
Unfunded Actuarially
Accrued Liability
(“UAAL”)
Assets as a %
of AAL
Active Member Payroll
UAAL as a % of Active
Member Payroll
2007 866,255,394 700,860,707 165,394,687 80.9 93,752,908 176.4 2008 904,522,377 603,265,803 301,256,574 66.7 94,301,538 319.5 2009 940,084,346 620,356,505 319,727,841 66.0 94,824,789 337.2 2010 1,017,770,449 630,971,500 386,798,949 62.0 94,767,852 408.2 2011 1,047,699,686 623,360,121 424,339,565 59.5 93,126,449 455.7 2012 966,310,485 658,428,914 307,881,571 68.1 98,117,403 313.8
Schedule of Funding Progress - OPEB Years ending December 31, 2009-2012
Valuation Year
Actuarially
Accrued Liability (“AAL”)
Valuation Assets
Unfunded Actuarially
Accrued Liability
(“UAAL”)
Assets as a %
of AAL
Active Member Payroll
UAAL as a % of Active
Member Payroll
2009 287,581,772 100,747,785 186,833,987 35.0 94,824,789 197.0 2010 406,864,423 104,738,337 302,126,086 25.7 94,767,852 318.8 2011 424,143,941 99,001,756 325,142,185 23.3 93,126,449 349.1 2012 411,467,825 99,817,173 311,650,652 24.3 98,117,403 317.6
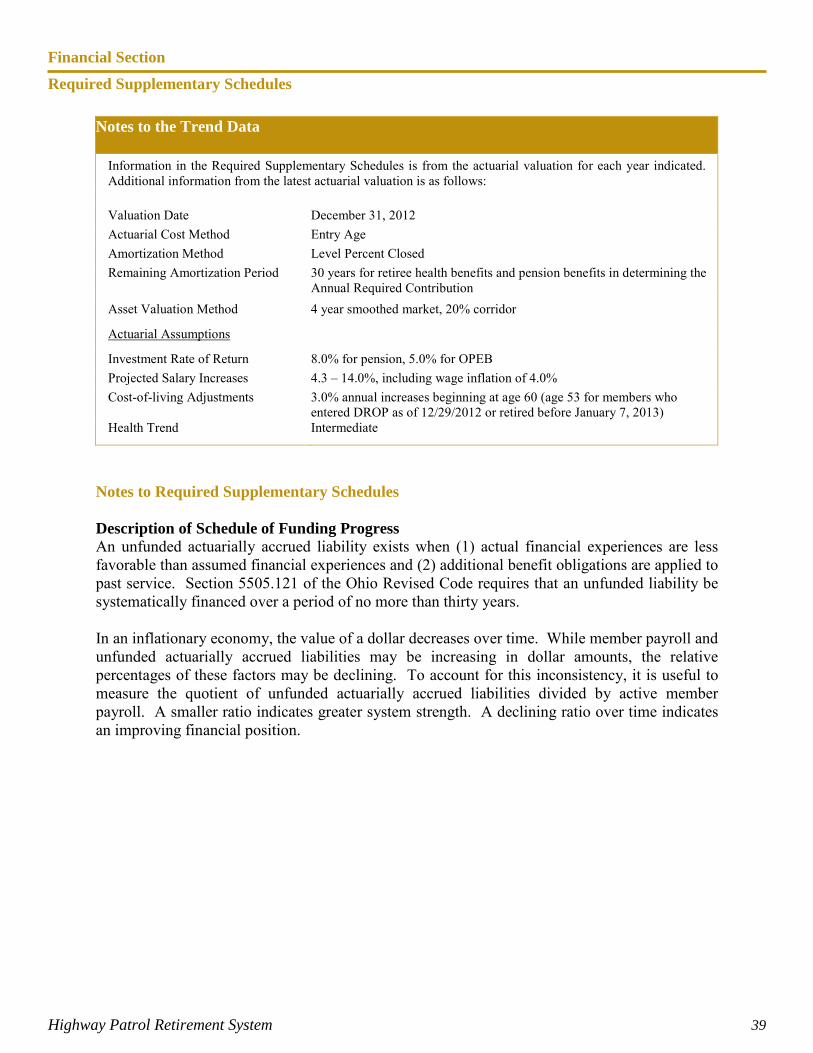
Financial Section
Required Supplementary Schedules
Highway Patrol Retirement System 39
Notes to Required Supplementary Schedules Description of Schedule of Funding Progress An unfunded actuarially accrued liability exists when (1) actual financial experiences are less favorable than assumed financial experiences and (2) additional benefit obligations are applied to past service. Section 5505.121 of the Ohio Revised Code requires that an unfunded liability be systematically financed over a period of no more than thirty years. In an inflationary economy, the value of a dollar decreases over time. While member payroll and unfunded actuarially accrued liabilities may be increasing in dollar amounts, the relative percentages of these factors may be declining. To account for this inconsistency, it is useful to measure the quotient of unfunded actuarially accrued liabilities divided by active member payroll. A smaller ratio indicates greater system strength. A declining ratio over time indicates an improving financial position.
Notes to the Trend Data
Information in the Required Supplementary Schedules is from the actuarial valuation for each year indicated. Additional information from the latest actuarial valuation is as follows:
Valuation Date December 31, 2012 Actuarial Cost Method Entry Age Amortization Method Level Percent Closed Remaining Amortization Period 30 years for retiree health benefits and pension benefits in determining the
Annual Required Contribution Asset Valuation Method 4 year smoothed market, 20% corridor Actuarial Assumptions Investment Rate of Return 8.0% for pension, 5.0% for OPEB Projected Salary Increases 4.3 – 14.0%, including wage inflation of 4.0% Cost-of-living Adjustments 3.0% annual increases beginning at age 60 (age 53 for members who
entered DROP as of 12/29/2012 or retired before January 7, 2013) Health Trend Intermediate
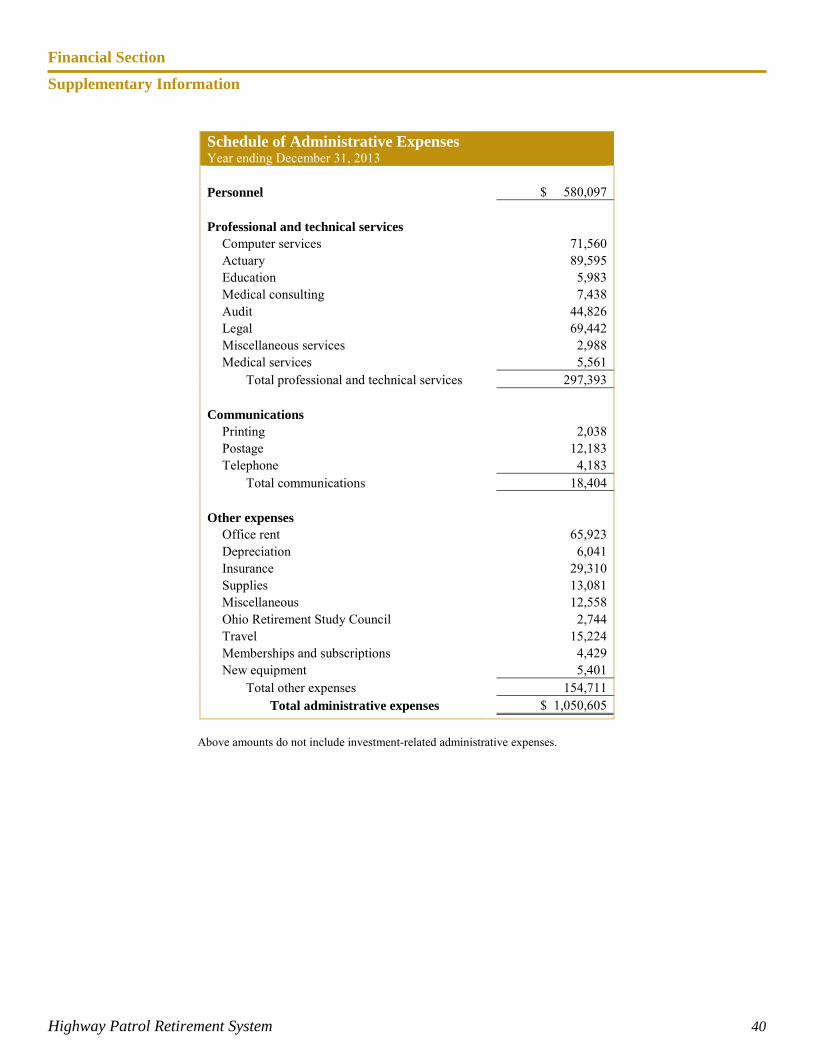
Financial Section
Supplementary Information
Highway Patrol Retirement System 40
Above amounts do not include investment-related administrative expenses.
Schedule of Administrative Expenses Year ending December 31, 2013 Personnel $ 580,097 Professional and technical services
Computer services 71,560 Actuary 89,595 Education 5,983 Medical consulting 7,438 Audit 44,826 Legal 69,442 Miscellaneous services 2,988 Medical services 5,561
Total professional and technical services 297,393 Communications
Printing 2,038 Postage 12,183 Telephone 4,183
Total communications 18,404 Other expenses
Office rent 65,923 Depreciation 6,041 Insurance 29,310 Supplies 13,081 Miscellaneous 12,558 Ohio Retirement Study Council 2,744 Travel 15,224 Memberships and subscriptions 4,429 New equipment 5,401
Total other expenses 154,711 Total administrative expenses $ 1,050,605
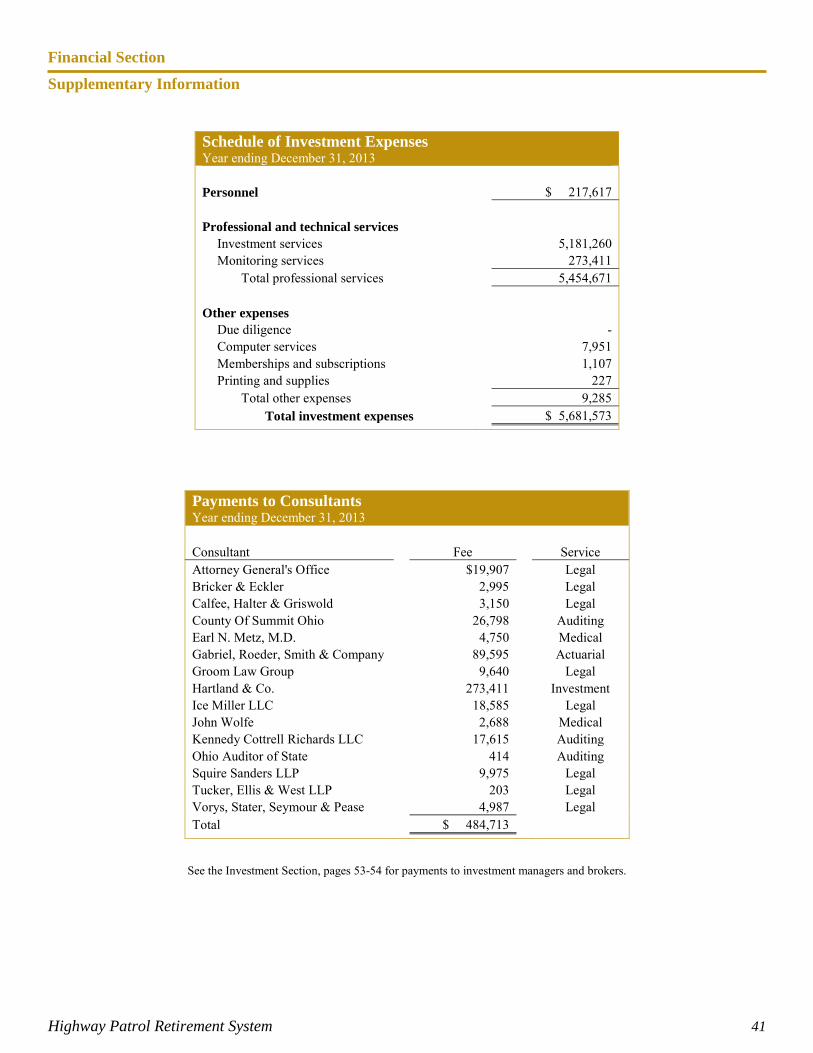
Financial Section
Supplementary Information
Highway Patrol Retirement System 41
See the Investment Section, pages 53-54 for payments to investment managers and brokers.
Schedule of Investment Expenses Year ending December 31, 2013 Personnel $ 217,617 Professional and technical services
Investment services 5,181,260 Monitoring services 273,411
Total professional services 5,454,671 Other expenses
Due diligence - Computer services 7,951 Memberships and subscriptions 1,107 Printing and supplies 227
Total other expenses 9,285 Total investment expenses $ 5,681,573
Payments to Consultants Year ending December 31, 2013 Consultant Fee Service Attorney General's Office $19,907 Legal Bricker & Eckler 2,995 Legal Calfee, Halter & Griswold 3,150 Legal County Of Summit Ohio 26,798 Auditing Earl N. Metz, M.D. 4,750 Medical Gabriel, Roeder, Smith & Company 89,595 Actuarial Groom Law Group 9,640 Legal Hartland & Co. 273,411 Investment Ice Miller LLC 18,585 Legal John Wolfe 2,688 Medical Kennedy Cottrell Richards LLC 17,615 Auditing Ohio Auditor of State 414 Auditing Squire Sanders LLP 9,975 Legal Tucker, Ellis & West LLP 203 Legal Vorys, Stater, Seymour & Pease 4,987 Legal Total $ 484,713
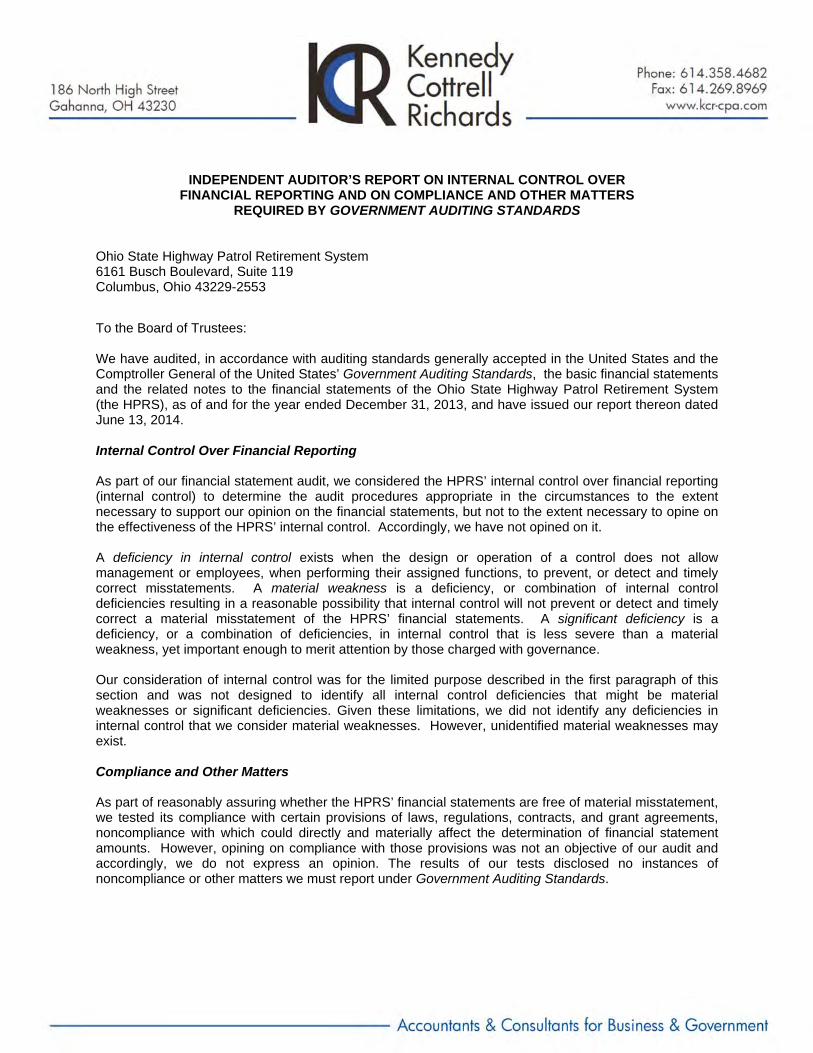
INDEPENDENT AUDITOR’S REPORT ON INTERNAL CONTROL OVER FINANCIAL REPORTING AND ON COMPLIANCE AND OTHER MATTERS
REQUIRED BY GOVERNMENT AUDITING STANDARDS Ohio State Highway Patrol Retirement System 6161 Busch Boulevard, Suite 119 Columbus, Ohio 43229-2553
To the Board of Trustees: We have audited, in accordance with auditing standards generally accepted in the United States and the Comptroller General of the United States’ Government Auditing Standards, the basic financial statements and the related notes to the financial statements of the Ohio State Highway Patrol Retirement System (the HPRS), as of and for the year ended December 31, 2013, and have issued our report thereon dated June 13, 2014.
Internal Control Over Financial Reporting As part of our financial statement audit, we considered the HPRS’ internal control over financial reporting (internal control) to determine the audit procedures appropriate in the circumstances to the extent necessary to support our opinion on the financial statements, but not to the extent necessary to opine on the effectiveness of the HPRS’ internal control. Accordingly, we have not opined on it. A deficiency in internal control exists when the design or operation of a control does not allow management or employees, when performing their assigned functions, to prevent, or detect and timely correct misstatements. A material weakness is a deficiency, or combination of internal control deficiencies resulting in a reasonable possibility that internal control will not prevent or detect and timely correct a material misstatement of the HPRS’ financial statements. A significant deficiency is a deficiency, or a combination of deficiencies, in internal control that is less severe than a material weakness, yet important enough to merit attention by those charged with governance. Our consideration of internal control was for the limited purpose described in the first paragraph of this section and was not designed to identify all internal control deficiencies that might be material weaknesses or significant deficiencies. Given these limitations, we did not identify any deficiencies in internal control that we consider material weaknesses. However, unidentified material weaknesses may exist. Compliance and Other Matters
As part of reasonably assuring whether the HPRS’ financial statements are free of material misstatement, we tested its compliance with certain provisions of laws, regulations, contracts, and grant agreements, noncompliance with which could directly and materially affect the determination of financial statement amounts. However, opining on compliance with those provisions was not an objective of our audit and accordingly, we do not express an opinion. The results of our tests disclosed no instances of noncompliance or other matters we must report under Government Auditing Standards.
Ohio State Highway Patrol Retirement System Independent Auditor’s Report on Internal Control Over Financial Reporting and Compliance and Other Matters Required by Government Auditing Standards Page 2
Purpose of this Report
This report only describes the scope of our internal control and compliance testing and our testing results, and does not opine on the effectiveness of the HPRS’ internal control or on compliance. This report is an integral part of an audit performed under Government Auditing Standards in considering the HPRS’ internal control and compliance. Accordingly, this communication is not suitable for any other purpose.
Kennedy Cottrell Richards LLC June 13, 2014

Highway Patrol Retirement System
This page intentionally left blank.

IInnvveessttmmeenntt SSeeccttiioonn
Investment Section
Highway Patrol Retirement System 46
Investment Overview Introduction Chapter 5505 of the Ohio Revised Code and the Board-adopted Investment Policy govern investment activity at HPRS. Per Ohio Revised Code 5505.06, “The Board shall have full power to invest the funds. The Board and other fiduciaries shall discharge their duties with respect to the funds solely in the interest of the participants and beneficiaries; for the exclusive purpose of providing benefits to participants and their beneficiaries and defraying reasonable expenses of administering the system; with care, skill, prudence, and diligence under the circumstances then prevailing that a prudent person acting in a like capacity and familiar with these matters would use in the conduct of an enterprise of a like character and with like aims; and by diversifying the investments of the system so as to minimize the risk of large losses, unless under the circumstances it is clearly prudent not to do so.” HPRS’s total investment portfolio, as reflected in the Combining Statement of Plan Net Position, (pages 22-23) is comprised of the Pension (Defined Benefit) and Post-Employment Health Care portfolios’ assets. Defined Benefit portfolio assets originate from member and employer contributions to the system. The management of these assets is the responsibility of the HPRS Investment Committee, under the direction of the Board of Trustees, and HPRS’s Investment Consultant, Hartland & Company. Hartland & Company assists the Board with the construction and diversification of HPRS’s investment portfolio and manager selection. Additionally, they assist with matters of investment policy and asset allocation recommendations, and provide monthly and quarterly performance reviews. Investment Policy The Board-adopted Investment Policy (pages 55-72) provides information on HPRS’s investment policies and performance objectives. The policy establishes asset allocation targets, risk tolerances, return objectives, and other guidelines, such as defining the responsibilities of the fiduciaries who implement the strategies and manage HPRS’s investment portfolio. Investment Summary HPRS’s Investment Summary (page 47) includes the total fund assets of the Pension and Post-Employment Health Care portfolios. All investments are reported at fair value. Fair value is the amount that the plan could reasonably expect to receive in a current sale between a willing buyer and a willing seller, other than in a forced or liquidation sale. A complete listing of assets held at December 31, 2013 is available from HPRS upon request. Investment Performance As shown in the Schedule of Investment Results (page 49), performance information is reported gross-of-fees (net-of-fees for alternative investments) versus benchmark for the total fund and each asset class over selected periods. All returns are calculated in U.S. Dollars using a time-weighted rate of return. Net-of-fees returns are available from HPRS upon request.
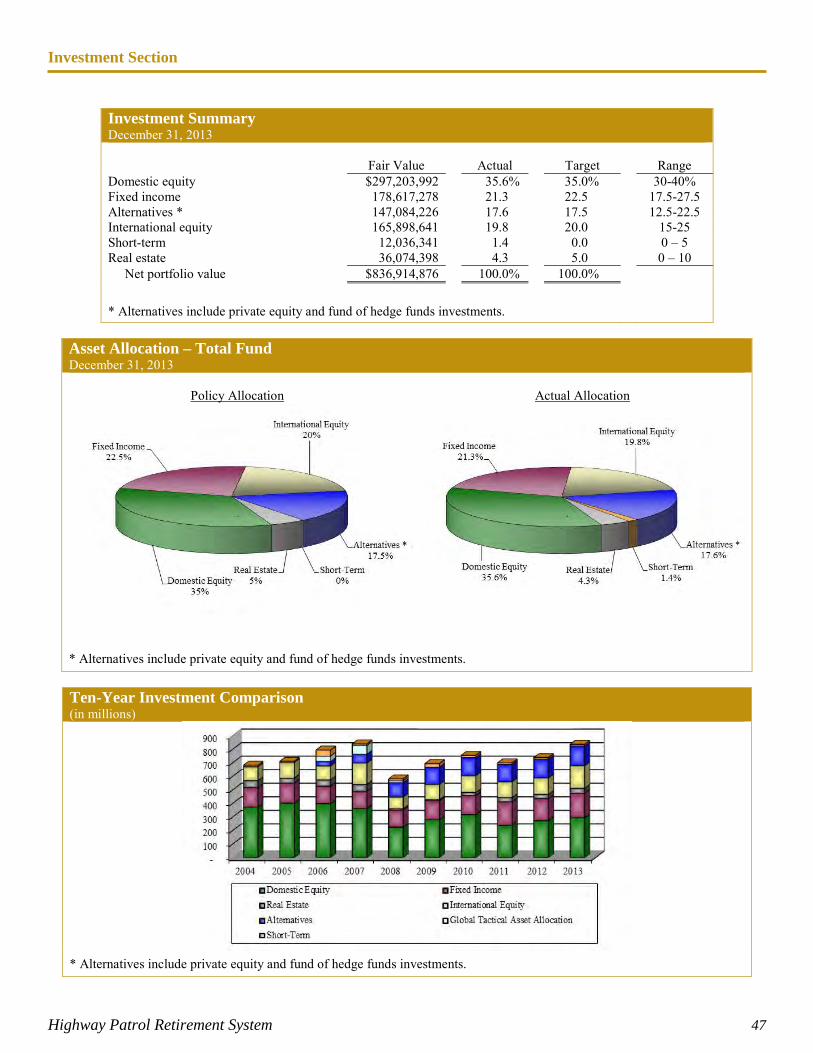
Investment Section
Highway Patrol Retirement System 47
Investment Summary December 31, 2013
Fair Value Actual Target Range
Domestic equity $297,203,992 35.6% 35.0% 30-40% Fixed income 178,617,278 21.3 22.5 17.5-27.5 Alternatives * 147,084,226 17.6 17.5 12.5-22.5 International equity 165,898,641 19.8 20.0 15-25 Short-term 12,036,341 1.4 0.0 0 – 5 Real estate 36,074,398 4.3 5.0 0 – 10 Net portfolio value $836,914,876 100.0% 100.0% * Alternatives include private equity and fund of hedge funds investments.
Asset Allocation – Total Fund December 31, 2013
Policy Allocation
Actual Allocation
* Alternatives include private equity and fund of hedge funds investments.
Ten-Year Investment Comparison (in millions)
* Alternatives include private equity and fund of hedge funds investments.
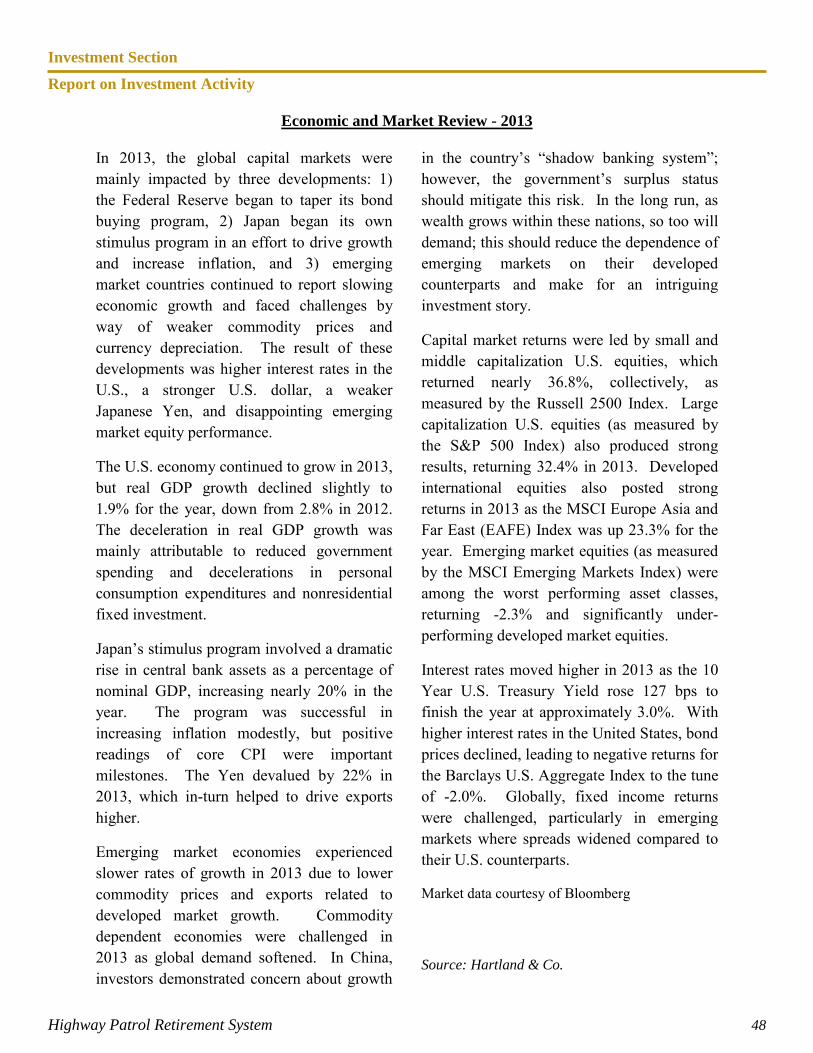
Investment Section
Report on Investment Activity
Highway Patrol Retirement System 48
Economic and Market Review - 2013 In 2013, the global capital markets were mainly impacted by three developments: 1) the Federal Reserve began to taper its bond buying program, 2) Japan began its own stimulus program in an effort to drive growth and increase inflation, and 3) emerging market countries continued to report slowing economic growth and faced challenges by way of weaker commodity prices and currency depreciation. The result of these developments was higher interest rates in the U.S., a stronger U.S. dollar, a weaker Japanese Yen, and disappointing emerging market equity performance.
The U.S. economy continued to grow in 2013, but real GDP growth declined slightly to 1.9% for the year, down from 2.8% in 2012. The deceleration in real GDP growth was mainly attributable to reduced government spending and decelerations in personal consumption expenditures and nonresidential fixed investment.
Japan’s stimulus program involved a dramatic rise in central bank assets as a percentage of nominal GDP, increasing nearly 20% in the year. The program was successful in increasing inflation modestly, but positive readings of core CPI were important milestones. The Yen devalued by 22% in 2013, which in-turn helped to drive exports higher.
Emerging market economies experienced slower rates of growth in 2013 due to lower commodity prices and exports related to developed market growth. Commodity dependent economies were challenged in 2013 as global demand softened. In China, investors demonstrated concern about growth
in the country’s “shadow banking system”; however, the government’s surplus status should mitigate this risk. In the long run, as wealth grows within these nations, so too will demand; this should reduce the dependence of emerging markets on their developed counterparts and make for an intriguing investment story.
Capital market returns were led by small and middle capitalization U.S. equities, which returned nearly 36.8%, collectively, as measured by the Russell 2500 Index. Large capitalization U.S. equities (as measured by the S&P 500 Index) also produced strong results, returning 32.4% in 2013. Developed international equities also posted strong returns in 2013 as the MSCI Europe Asia and Far East (EAFE) Index was up 23.3% for the year. Emerging market equities (as measured by the MSCI Emerging Markets Index) were among the worst performing asset classes, returning -2.3% and significantly under-performing developed market equities.
Interest rates moved higher in 2013 as the 10 Year U.S. Treasury Yield rose 127 bps to finish the year at approximately 3.0%. With higher interest rates in the United States, bond prices declined, leading to negative returns for the Barclays U.S. Aggregate Index to the tune of -2.0%. Globally, fixed income returns were challenged, particularly in emerging markets where spreads widened compared to their U.S. counterparts.
Market data courtesy of Bloomberg
Source: Hartland & Co.
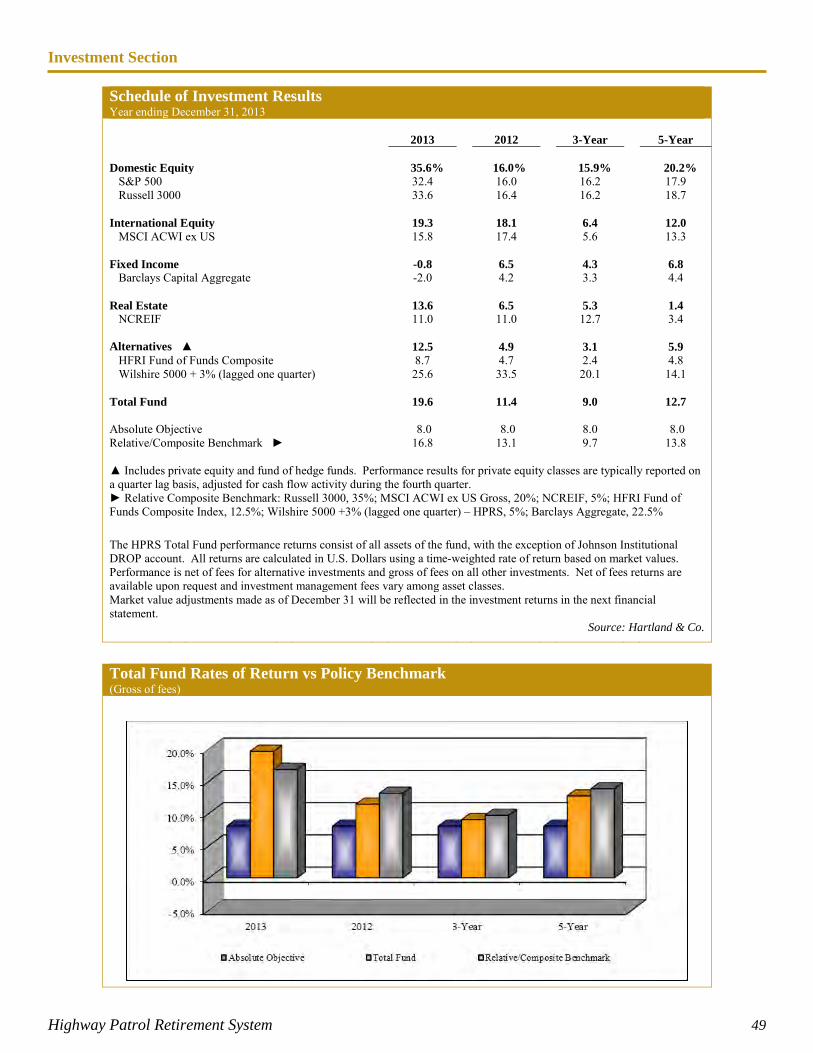
Investment Section
Highway Patrol Retirement System 49
Schedule of Investment Results Year ending December 31, 2013
2013
2012
3-Year
5-Year
Domestic Equity 35.6% 16.0% 15.9% 20.2% S&P 500 32.4 16.0 16.2 17.9 Russell 3000 33.6 16.4 16.2 18.7 International Equity 19.3 18.1 6.4 12.0 MSCI ACWI ex US 15.8 17.4 5.6 13.3 Fixed Income -0.8 6.5 4.3 6.8 Barclays Capital Aggregate -2.0 4.2 3.3 4.4 Real Estate 13.6 6.5 5.3 1.4 NCREIF 11.0 11.0 12.7 3.4 Alternatives ▲ 12.5 4.9 3.1 5.9 HFRI Fund of Funds Composite 8.7 4.7 2.4 4.8 Wilshire 5000 + 3% (lagged one quarter) 25.6 33.5 20.1 14.1 Total Fund 19.6 11.4 9.0 12.7 Absolute Objective 8.0 8.0 8.0 8.0 Relative/Composite Benchmark ► 16.8 13.1 9.7 13.8 ▲ Includes private equity and fund of hedge funds. Performance results for private equity classes are typically reported on a quarter lag basis, adjusted for cash flow activity during the fourth quarter. ► Relative Composite Benchmark: Russell 3000, 35%; MSCI ACWI ex US Gross, 20%; NCREIF, 5%; HFRI Fund of Funds Composite Index, 12.5%; Wilshire 5000 +3% (lagged one quarter) – HPRS, 5%; Barclays Aggregate, 22.5% The HPRS Total Fund performance returns consist of all assets of the fund, with the exception of Johnson Institutional DROP account. All returns are calculated in U.S. Dollars using a time-weighted rate of return based on market values. Performance is net of fees for alternative investments and gross of fees on all other investments. Net of fees returns are available upon request and investment management fees vary among asset classes. Market value adjustments made as of December 31 will be reflected in the investment returns in the next financial statement. Source: Hartland & Co.
Total Fund Rates of Return vs Policy Benchmark (Gross of fees)
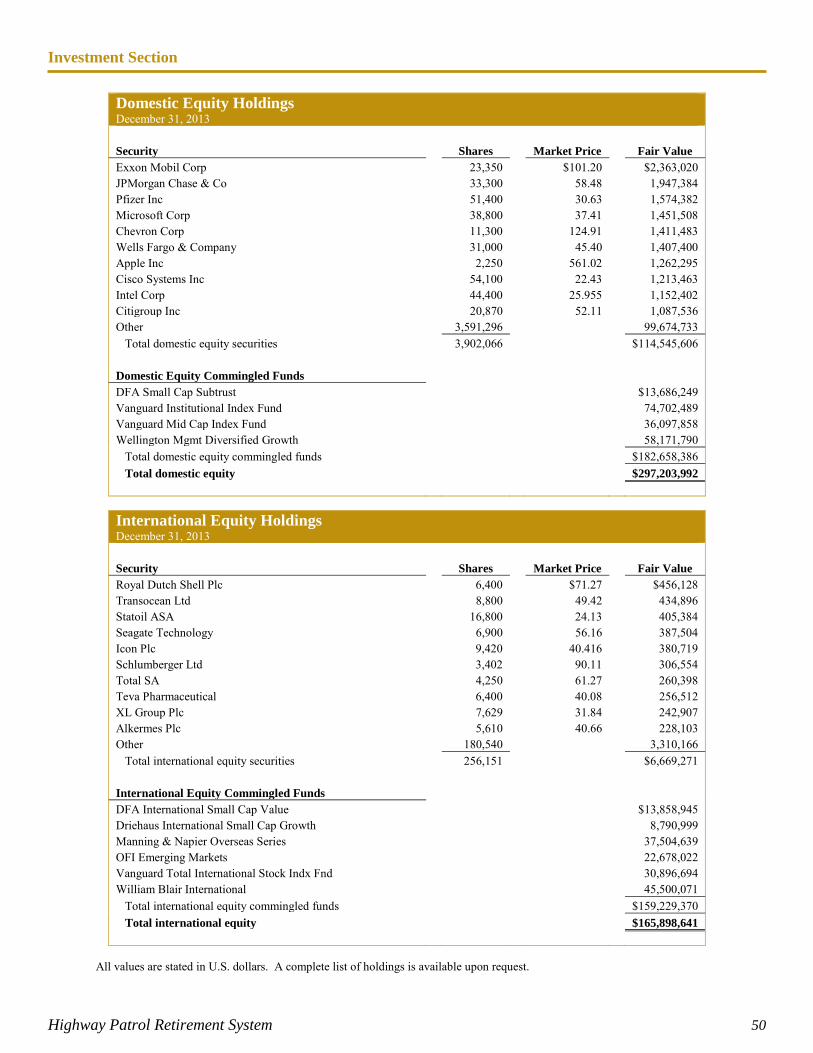
Investment Section
Highway Patrol Retirement System 50
Domestic Equity Holdings December 31, 2013 Security Shares Market Price Fair Value Exxon Mobil Corp 23,350 $101.20 $2,363,020 JPMorgan Chase & Co 33,300 58.48 1,947,384 Pfizer Inc 51,400 30.63 1,574,382 Microsoft Corp 38,800 37.41 1,451,508 Chevron Corp 11,300 124.91 1,411,483 Wells Fargo & Company 31,000 45.40 1,407,400 Apple Inc 2,250 561.02 1,262,295 Cisco Systems Inc 54,100 22.43 1,213,463 Intel Corp 44,400 25.955 1,152,402 Citigroup Inc 20,870 52.11 1,087,536 Other 3,591,296 99,674,733 Total domestic equity securities 3,902,066 $114,545,606 Domestic Equity Commingled Funds DFA Small Cap Subtrust $13,686,249 Vanguard Institutional Index Fund 74,702,489 Vanguard Mid Cap Index Fund 36,097,858 Wellington Mgmt Diversified Growth 58,171,790 Total domestic equity commingled funds $182,658,386 Total domestic equity $297,203,992
International Equity Holdings December 31, 2013 Security Shares Market Price Fair Value Royal Dutch Shell Plc 6,400 $71.27 $456,128 Transocean Ltd 8,800 49.42 434,896 Statoil ASA 16,800 24.13 405,384 Seagate Technology 6,900 56.16 387,504 Icon Plc 9,420 40.416 380,719 Schlumberger Ltd 3,402 90.11 306,554 Total SA 4,250 61.27 260,398 Teva Pharmaceutical 6,400 40.08 256,512 XL Group Plc 7,629 31.84 242,907 Alkermes Plc 5,610 40.66 228,103 Other 180,540 3,310,166 Total international equity securities 256,151 $6,669,271 International Equity Commingled Funds DFA International Small Cap Value $13,858,945 Driehaus International Small Cap Growth 8,790,999 Manning & Napier Overseas Series 37,504,639 OFI Emerging Markets 22,678,022 Vanguard Total International Stock Indx Fnd 30,896,694 William Blair International 45,500,071 Total international equity commingled funds $159,229,370 Total international equity $165,898,641
All values are stated in U.S. dollars. A complete list of holdings is available upon request.
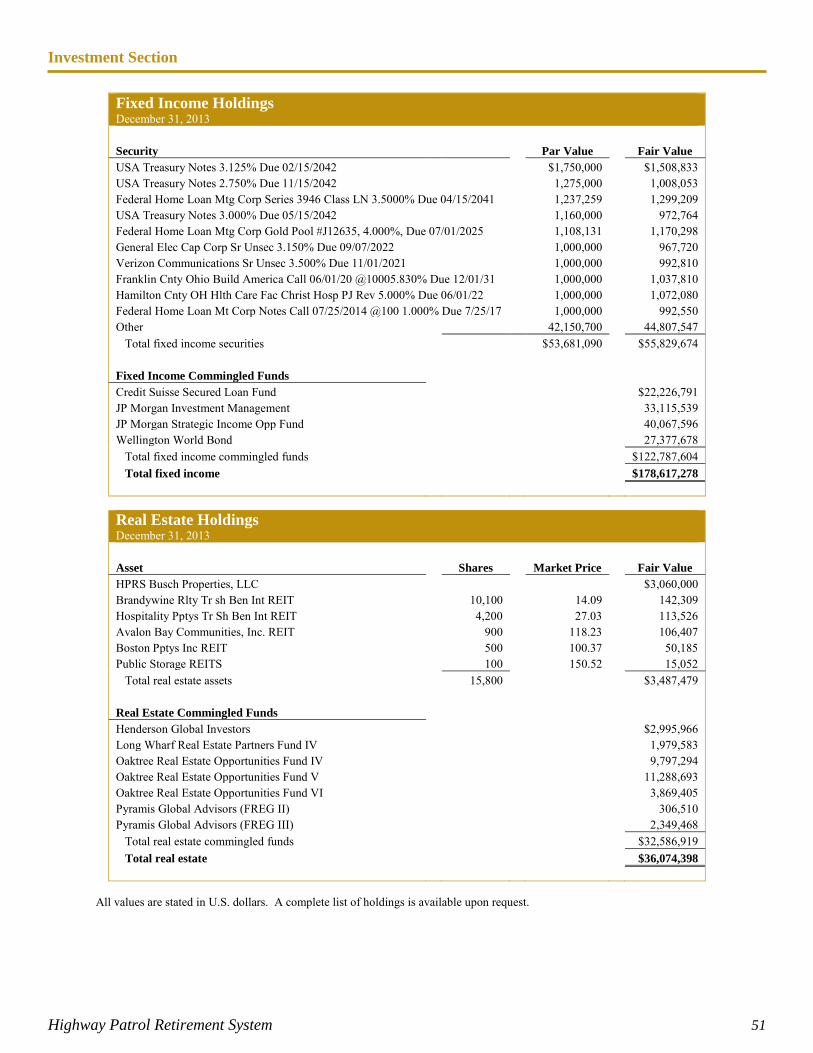
Investment Section
Highway Patrol Retirement System 51
Fixed Income Holdings December 31, 2013 Security Par Value Fair Value USA Treasury Notes 3.125% Due 02/15/2042 $1,750,000 $1,508,833 USA Treasury Notes 2.750% Due 11/15/2042 1,275,000 1,008,053 Federal Home Loan Mtg Corp Series 3946 Class LN 3.5000% Due 04/15/2041 1,237,259 1,299,209 USA Treasury Notes 3.000% Due 05/15/2042 1,160,000 972,764 Federal Home Loan Mtg Corp Gold Pool #J12635, 4.000%, Due 07/01/2025 1,108,131 1,170,298 General Elec Cap Corp Sr Unsec 3.150% Due 09/07/2022 1,000,000 967,720 Verizon Communications Sr Unsec 3.500% Due 11/01/2021 1,000,000 992,810 Franklin Cnty Ohio Build America Call 06/01/20 @10005.830% Due 12/01/31 1,000,000 1,037,810 Hamilton Cnty OH Hlth Care Fac Christ Hosp PJ Rev 5.000% Due 06/01/22 1,000,000 1,072,080 Federal Home Loan Mt Corp Notes Call 07/25/2014 @100 1.000% Due 7/25/17 1,000,000 992,550 Other 42,150,700 44,807,547 Total fixed income securities $53,681,090 $55,829,674 Fixed Income Commingled Funds Credit Suisse Secured Loan Fund $22,226,791 JP Morgan Investment Management 33,115,539 JP Morgan Strategic Income Opp Fund 40,067,596 Wellington World Bond 27,377,678 Total fixed income commingled funds $122,787,604 Total fixed income $178,617,278
Real Estate Holdings December 31, 2013 Asset Shares Market Price Fair Value HPRS Busch Properties, LLC $3,060,000 Brandywine Rlty Tr sh Ben Int REIT 10,100 14.09 142,309 Hospitality Pptys Tr Sh Ben Int REIT 4,200 27.03 113,526 Avalon Bay Communities, Inc. REIT 900 118.23 106,407 Boston Pptys Inc REIT 500 100.37 50,185 Public Storage REITS 100 150.52 15,052 Total real estate assets 15,800 $3,487,479 Real Estate Commingled Funds Henderson Global Investors $2,995,966 Long Wharf Real Estate Partners Fund IV 1,979,583 Oaktree Real Estate Opportunities Fund IV 9,797,294 Oaktree Real Estate Opportunities Fund V 11,288,693 Oaktree Real Estate Opportunities Fund VI 3,869,405 Pyramis Global Advisors (FREG II) 306,510 Pyramis Global Advisors (FREG III) 2,349,468 Total real estate commingled funds $32,586,919 Total real estate $36,074,398
All values are stated in U.S. dollars. A complete list of holdings is available upon request.
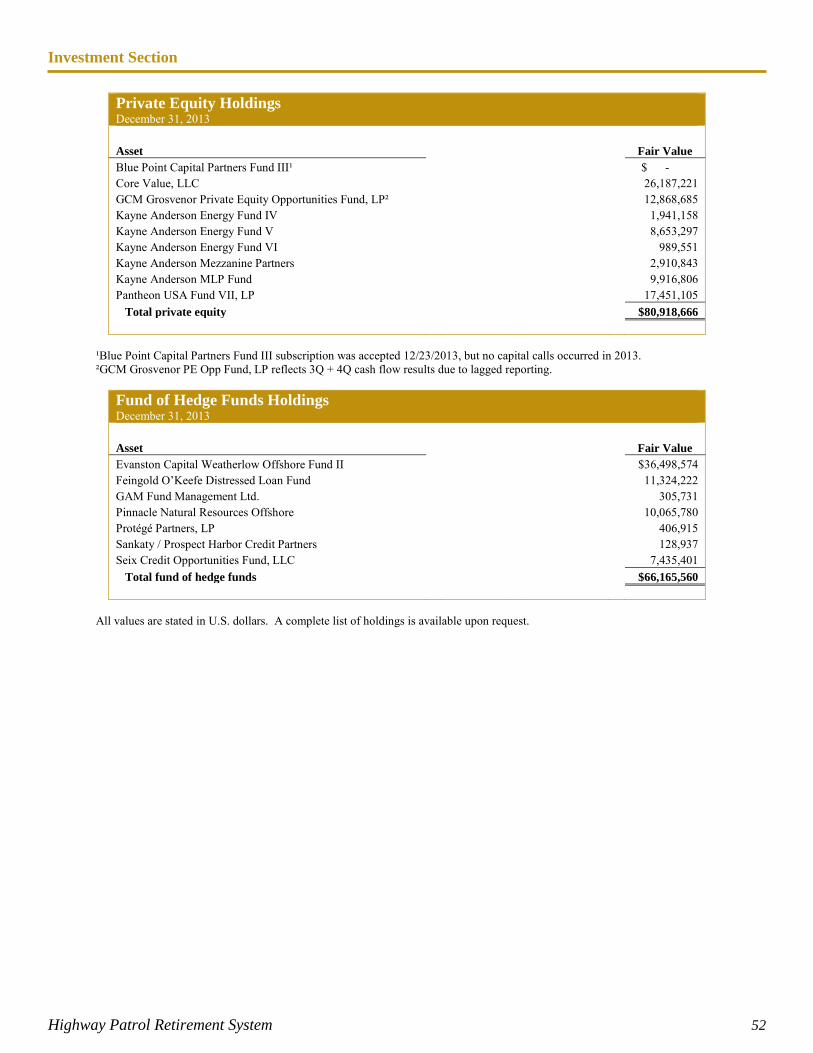
Investment Section
Highway Patrol Retirement System 52
Private Equity Holdings December 31, 2013 Asset Fair Value Blue Point Capital Partners Fund III¹ $ - Core Value, LLC 26,187,221 GCM Grosvenor Private Equity Opportunities Fund, LP² 12,868,685 Kayne Anderson Energy Fund IV 1,941,158 Kayne Anderson Energy Fund V 8,653,297 Kayne Anderson Energy Fund VI 989,551 Kayne Anderson Mezzanine Partners 2,910,843 Kayne Anderson MLP Fund 9,916,806 Pantheon USA Fund VII, LP 17,451,105 Total private equity $80,918,666
¹Blue Point Capital Partners Fund III subscription was accepted 12/23/2013, but no capital calls occurred in 2013. ²GCM Grosvenor PE Opp Fund, LP reflects 3Q + 4Q cash flow results due to lagged reporting.
Fund of Hedge Funds Holdings December 31, 2013 Asset Fair Value Evanston Capital Weatherlow Offshore Fund II $36,498,574 Feingold O’Keefe Distressed Loan Fund 11,324,222 GAM Fund Management Ltd. 305,731 Pinnacle Natural Resources Offshore 10,065,780 Protégé Partners, LP 406,915 Sankaty / Prospect Harbor Credit Partners 128,937 Seix Credit Opportunities Fund, LLC 7,435,401 Total fund of hedge funds $66,165,560
All values are stated in U.S. dollars. A complete list of holdings is available upon request.
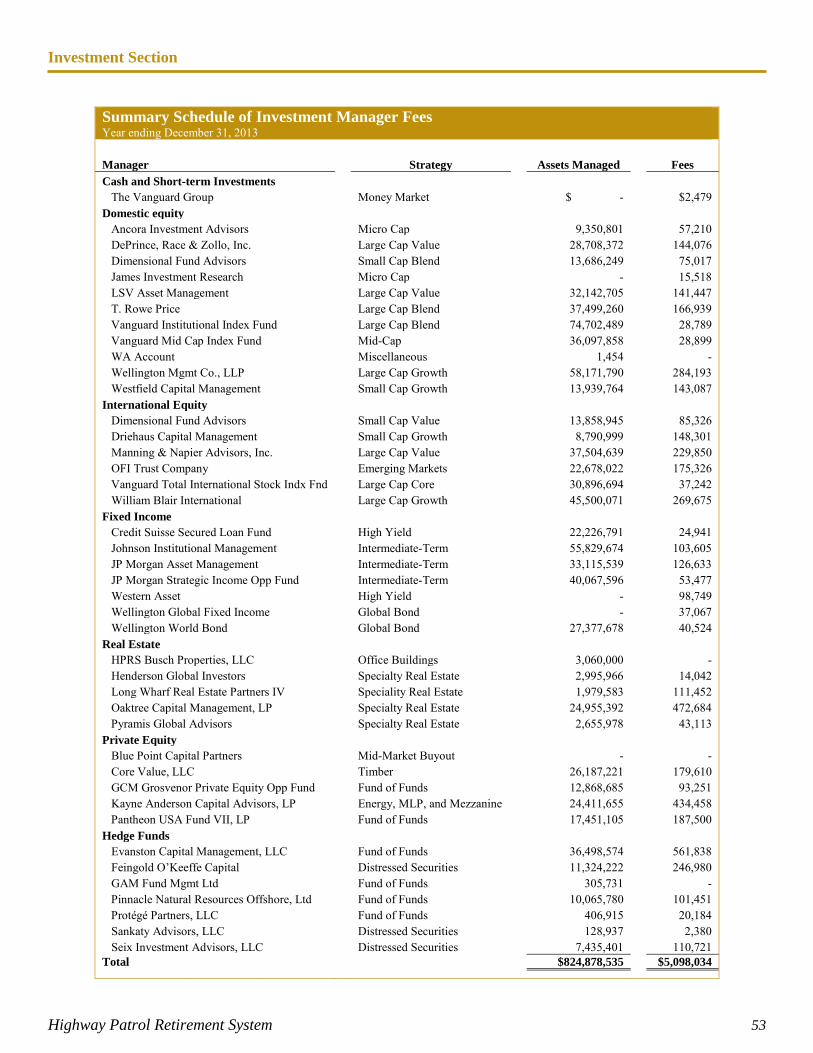
Investment Section
Highway Patrol Retirement System 53
Summary Schedule of Investment Manager Fees Year ending December 31, 2013 Manager Strategy Assets Managed Fees Cash and Short-term Investments The Vanguard Group Money Market $ - $2,479 Domestic equity Ancora Investment Advisors Micro Cap 9,350,801 57,210 DePrince, Race & Zollo, Inc. Large Cap Value 28,708,372 144,076 Dimensional Fund Advisors Small Cap Blend 13,686,249 75,017 James Investment Research Micro Cap - 15,518 LSV Asset Management Large Cap Value 32,142,705 141,447 T. Rowe Price Large Cap Blend 37,499,260 166,939 Vanguard Institutional Index Fund Large Cap Blend 74,702,489 28,789 Vanguard Mid Cap Index Fund Mid-Cap 36,097,858 28,899 WA Account Miscellaneous 1,454 - Wellington Mgmt Co., LLP Large Cap Growth 58,171,790 284,193 Westfield Capital Management Small Cap Growth 13,939,764 143,087 International Equity Dimensional Fund Advisors Small Cap Value 13,858,945 85,326 Driehaus Capital Management Small Cap Growth 8,790,999 148,301 Manning & Napier Advisors, Inc. Large Cap Value 37,504,639 229,850 OFI Trust Company Emerging Markets 22,678,022 175,326 Vanguard Total International Stock Indx Fnd Large Cap Core 30,896,694 37,242 William Blair International Large Cap Growth 45,500,071 269,675 Fixed Income Credit Suisse Secured Loan Fund High Yield 22,226,791 24,941 Johnson Institutional Management Intermediate-Term 55,829,674 103,605 JP Morgan Asset Management Intermediate-Term 33,115,539 126,633 JP Morgan Strategic Income Opp Fund Intermediate-Term 40,067,596 53,477 Western Asset High Yield - 98,749 Wellington Global Fixed Income Global Bond - 37,067 Wellington World Bond Global Bond 27,377,678 40,524 Real Estate HPRS Busch Properties, LLC Office Buildings 3,060,000 - Henderson Global Investors Specialty Real Estate 2,995,966 14,042 Long Wharf Real Estate Partners IV Speciality Real Estate 1,979,583 111,452 Oaktree Capital Management, LP Specialty Real Estate 24,955,392 472,684 Pyramis Global Advisors Specialty Real Estate 2,655,978 43,113 Private Equity Blue Point Capital Partners Mid-Market Buyout - - Core Value, LLC Timber 26,187,221 179,610 GCM Grosvenor Private Equity Opp Fund Fund of Funds 12,868,685 93,251 Kayne Anderson Capital Advisors, LP Energy, MLP, and Mezzanine 24,411,655 434,458 Pantheon USA Fund VII, LP Fund of Funds 17,451,105 187,500 Hedge Funds Evanston Capital Management, LLC Fund of Funds 36,498,574 561,838 Feingold O’Keeffe Capital Distressed Securities 11,324,222 246,980 GAM Fund Mgmt Ltd Fund of Funds 305,731 - Pinnacle Natural Resources Offshore, Ltd Fund of Funds 10,065,780 101,451 Protégé Partners, LLC Fund of Funds 406,915 20,184 Sankaty Advisors, LLC Distressed Securities 128,937 2,380 Seix Investment Advisors, LLC Distressed Securities 7,435,401 110,721 Total $824,878,535 $5,098,034
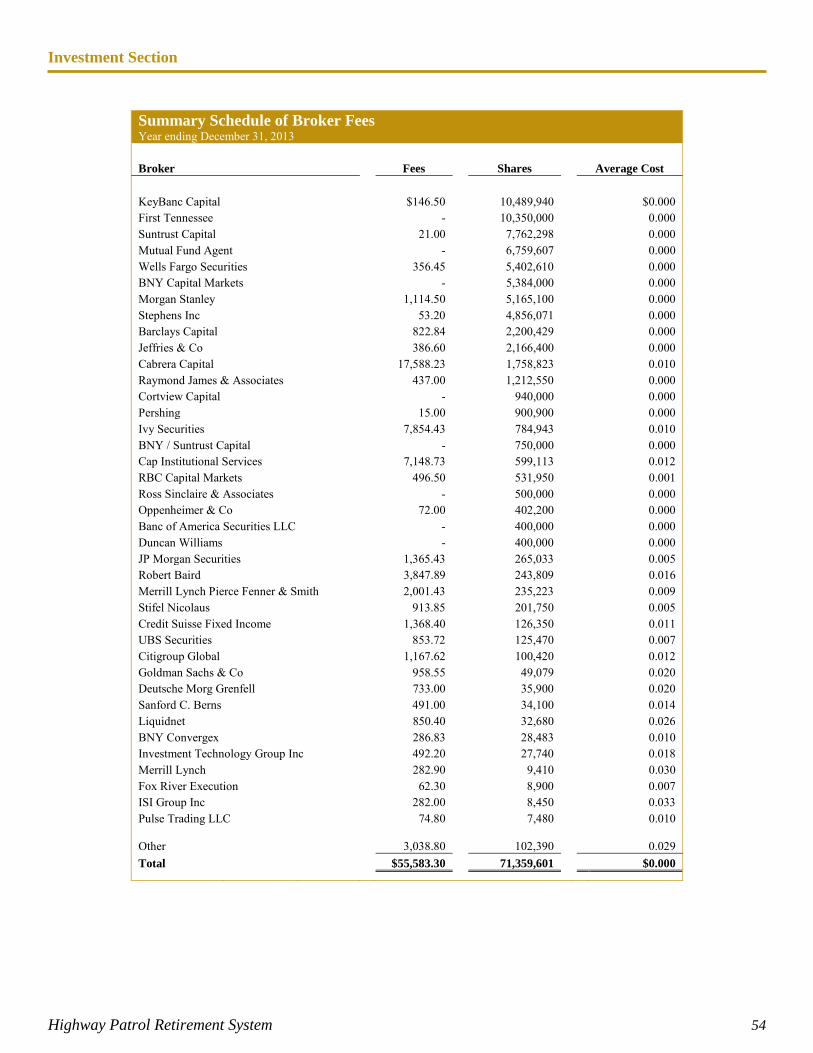
Investment Section
Highway Patrol Retirement System 54
Summary Schedule of Broker Fees Year ending December 31, 2013 Broker Fees Shares Average Cost KeyBanc Capital $146.50 10,489,940 $0.000 First Tennessee - 10,350,000 0.000 Suntrust Capital 21.00 7,762,298 0.000 Mutual Fund Agent - 6,759,607 0.000 Wells Fargo Securities 356.45 5,402,610 0.000 BNY Capital Markets - 5,384,000 0.000 Morgan Stanley 1,114.50 5,165,100 0.000 Stephens Inc 53.20 4,856,071 0.000 Barclays Capital 822.84 2,200,429 0.000 Jeffries & Co 386.60 2,166,400 0.000 Cabrera Capital 17,588.23 1,758,823 0.010 Raymond James & Associates 437.00 1,212,550 0.000 Cortview Capital - 940,000 0.000 Pershing 15.00 900,900 0.000 Ivy Securities 7,854.43 784,943 0.010 BNY / Suntrust Capital - 750,000 0.000 Cap Institutional Services 7,148.73 599,113 0.012 RBC Capital Markets 496.50 531,950 0.001 Ross Sinclaire & Associates - 500,000 0.000 Oppenheimer & Co 72.00 402,200 0.000 Banc of America Securities LLC - 400,000 0.000 Duncan Williams - 400,000 0.000 JP Morgan Securities 1,365.43 265,033 0.005 Robert Baird 3,847.89 243,809 0.016 Merrill Lynch Pierce Fenner & Smith 2,001.43 235,223 0.009 Stifel Nicolaus 913.85 201,750 0.005 Credit Suisse Fixed Income 1,368.40 126,350 0.011 UBS Securities 853.72 125,470 0.007 Citigroup Global 1,167.62 100,420 0.012 Goldman Sachs & Co 958.55 49,079 0.020 Deutsche Morg Grenfell 733.00 35,900 0.020 Sanford C. Berns 491.00 34,100 0.014 Liquidnet 850.40 32,680 0.026 BNY Convergex 286.83 28,483 0.010 Investment Technology Group Inc 492.20 27,740 0.018 Merrill Lynch 282.90 9,410 0.030 Fox River Execution 62.30 8,900 0.007 ISI Group Inc 282.00 8,450 0.033 Pulse Trading LLC 74.80 7,480 0.010
Other
3,038.80 102,390 0.029 Total $55,583.30 71,359,601 $0.000
Investment Section
Investment Objectives, Policies, and Guidelines
Highway Patrol Retirement System 55
HPRS Investment Policy Introduction The State Highway Patrol Retirement System was established by section 5505.02 of the Ohio Revised Code (ORC) for State Highway Patrol employees, as defined in division (A) of ORC section 5505.01. Pursuant to ORC section 5505.04, the administration and management of the Highway Patrol Retirement System are vested in the State Highway Patrol Retirement Board. Members of the State Highway Patrol Retirement Board are the trustees of the funds created by ORC section 5505.03. The board has full power to create and adopt, in regular meetings, an investment committee, policies, objectives, or criteria for the operation of the investment program that include asset allocation targets and ranges, risk factors, asset class benchmarks, time horizons, total return objectives, and performance evaluation guidelines. The funds created by ORC section 5505.03 and managed by the Retirement Board are the employees’ savings fund, the employer’s accumulation fund, the pension reserve fund, the survivors’ benefit fund, the income fund, and the expense fund. These funds are for the exclusive purpose of operating the Retirement System and providing benefits to any qualified employee in the uniform division of the State Highway Patrol, any qualified employee in the radio division hired prior to November 2, 1989, and any State Highway Patrol cadet attending training school pursuant to ORC section 5503.05, whose attendance at the school began on or after June 30, 1991. “Employee” includes the superintendent of the State Highway Patrol. Purpose and Duties The primary objective of the State Highway Patrol Retirement System is to provide eligible members and beneficiaries with scheduled pension benefits. Although the State Highway Patrol Retirement System is not governed by the Employees Retirement Income Security Act of 1974 (ERISA), the basic provisions contained in that act are recognized and will serve as guidance to the management of the fund. In particular, the prudent person guidelines are to be followed with regard to the investment management of the fund. These guidelines require the Board and other system fiduciaries to exercise care, skill, prudence, and diligence -- under the circumstances then prevailing -- that a prudent person acting in a like capacity and familiar with such matters would use in the conduct of an enterprise of a like character with like aims. A secondary objective of the fund is to maintain a sufficient degree of liquidity in order to meet unanticipated demands and changing environments. Members of the Retirement Board and other fiduciaries of the Retirement System fully accept the duty to incur only reasonable expenses in the operation of the State Highway Patrol Retirement System. Investment Goals Consistent with prudent standards for preservation of capital and maintenance of liquidity, the goal of the fund is to earn the highest possible rate of return consistent with the fund's tolerance for risk as determined periodically by the Board in its role as a fiduciary. This objective should ensure adequate funds to meet scheduled benefits while maintaining level contributions. In meeting these objectives, the Board will give consideration to investments that enhance the
Investment Section
Investment Objectives, Policies, and Guidelines
Highway Patrol Retirement System 56
welfare of the State of Ohio, and Ohio citizens, where such investments offer safety and quality of return comparable to other investments currently available. Equal consideration will be given to investments otherwise qualifying under this section that involve minority-owned and controlled firms, or firms owned and controlled by women, either alone or in joint venture with other firms. Policies Diversification of assets will ensure that adverse or unexpected results from a security class will not have a detrimental impact on the entire portfolio. Diversification is interpreted to include diversification by asset type, performance and risk characteristic, number of investments, and by investment style of management organizations. These guidelines may be implemented through specific directions or instructions to investment managers, and those directions or instructions may contain other more specific restrictions on diversification of assets by percentage holdings, by quality, or other factors. Asset classes and ranges considered appropriate for investment of fund assets are to be determined by the Board in accordance with these investment guidelines. Asset class constraints only apply to separate account mandates. Assignment of responsibilities for each asset category, including components of each asset category, may be assigned to one or more management firms that may be "specialty" managers (i.e., managing only one type of asset class). The Board will, at least annually, establish a policy with the goal to increase utilization of Ohio-qualified investment managers, when an Ohio-qualified investment manager offers quality, services, and safety comparable to other investment managers otherwise available. The Board will, at least annually, establish a policy with the goal to increase utilization of Ohio-qualified agents for the execution of domestic equity and fixed income trades on behalf of the retirement system, when an Ohio-qualified agent offers quality, services, and safety comparable to other agents otherwise available. In order to achieve the return objectives, the fund will employ the following strategies for specific asset classes:
1. U.S. equities will represent from 30 to 40 percent of the market value of total fund assets with a targeted average of 35 percent. The term "equities" includes common stock, convertible bonds, and convertible stock. 2. Non-U.S. equities will represent from 15 to 25 percent of the market value of total fund assets with a targeted average of 20 percent. 3. U.S. fixed income obligations, including cash, will represent from 17.5 to 27.5 percent of the market value of total fund assets with a targeted average of 22.5 percent. Intermediate term bonds may include contractual payments, preferred stocks, and bonds

Investment Section
Investment Objectives, Policies, and Guidelines
Highway Patrol Retirement System 57
with a maturity date greater than one year and less than or equal to ten years. Long-term bonds have a maturity date greater than ten years. 4. Investments in real estate and alternatives will represent from 17.5 to 27.5 percent of the market value of total fund assets with a targeted average of 22.5 percent. The term “alternatives” includes hedge funds, private equity, and Global Tactical Asset Allocation.
Short-Term The purpose of the short-term cash component is to provide liquidity for short-term obligations. Cash equivalent investments may include the following:
• Short-Term Maturity Securities • U.S. Treasury Bills • U.S. Government Repurchase Agreements • Commercial Paper • Commingled Investment Funds
Fixed Income The purpose of the fixed income component is to provide a deflation hedge, to reduce the overall volatility of the pension assets in relation to the liability, and to produce current income. A core bond allocation will be diversified as to type of security, issuer, coupon, and maturity. Qualifying bonds, at the time of purchase, will be rated as investment-grade by at least two nationally-recognized bond rating services. Generally, the average maturity of a fixed income allocation will be ten years or less, although individual securities may be longer. An alternative bond allocation may invest in (1) high-yield or other non-investment-grade bonds, (2) non-United States bonds, or (3) bonds issued by emerging countries. No more than ten percent of a fixed income allocation will be invested in the securities of any one issuer, and no more than five percent in any one issue, with the exception of U.S. government securities. Diversification of the bond portfolio will be accomplished by investing in a combination of U.S. government bonds, U.S. agency bonds, domestic corporate bonds, high yield bonds, and non-U.S. bonds. Managers are prohibited from using derivative instruments. Equities The purpose of the equity component is to provide for growth in principal, while at the same time preserve the purchasing power of the portfolio’s assets. It is recognized that the equity in the portfolio will represent a greater assumption of market volatility and risk as well as high total return over the long-term.
Investment Section
Investment Objectives, Policies, and Guidelines
Highway Patrol Retirement System 58
Qualifying equities will be listed on an established stock market and be readily marketable. They may be held in separate or commingled accounts. At least 67% of the value of a large cap domestic mandate will be invested in securities with a market capitalization of more than $5 billion. At least 67% of the value of a small/mid cap domestic mandate will be invested in securities with a market capitalization of more than $500 million. Micro cap mandates are excluded from this guideline. At least 50% of the value of an international mandate (excluding small cap) will be invested in securities with a market capitalization of more than $1 billion. Each equity manager will diversify the portfolio in an attempt to minimize the impact of substantial losses in any specific industry or issuer. An equity manager may not --
• hold more than 15% of the account value in a single issuer, • where a sector is greater than 10% of the benchmark, allow that sector to exceed 50%
of the portfolio, • where a sector is 10% or less of the benchmark, allow that sector to exceed 30% of
the portfolio, • invest in international-domiciled securities exceeding 20% of portfolio value in a
domestic mandate, • allow one country to be more than 20 percentage points above the country weighting
of the relative benchmark in an international mandate, or • invest in emerging markets exceeding 35% of portfolio value in a developed
international mandate. Equity managers are prohibited from investing in the following:
• Private placements • Unregistered or restricted stock • Derivatives • Margin Trading/Short Sales • Commodities • Real Estate Property (excluding REITs) • Guaranteed Insurance Contracts • Securities issued by Highway Patrol Retirement System or its affiliates.
Real Estate The purpose of the real estate component is to provide for growth of principal while at the same time preserve the purchasing power of the portfolio’s assets. In addition, the real estate component seeks to enhance the overall portfolio by providing income, a hedge on inflation and modest diversification.
Investment Section
Investment Objectives, Policies, and Guidelines
Highway Patrol Retirement System 59
The fund may invest in improved or unimproved real property, mortgage collective investment funds (Real Estate Investment Trusts or Real Estate Funds), notes secured by real property, mortgage-backed bonds, and pass-through securities backed by mortgages. The real estate portfolio will be constructed and managed to --
• provide sufficient diversity to protect against adverse conditions in any single market sector,
• provide diversity among geographical locations, property types, and property sizes, • provide relatively stable returns consistent with the overall U.S. commercial real
estate market, • provide a strong current income stream with the potential for long-term principal
growth, • primarily contain fully developed, fully leased properties, and • minimize the use of debt financing.
Alternatives The purpose of the alternatives component is to provide diversification, risk reduction and to enhance the overall risk-adjusted return of the portfolio. The fund may invest in alternatives with individual fund managers or with fund of funds managers. Performance Comparative performance measurement of the total fund and its components will be conducted at least quarterly. Active large cap equity managers are expected to exceed benchmark performance by 50 bps over rolling three and five year periods, net-of-fees, and rank in the upper 40th percentile relative to peers. The objective of each active small/mid cap equity and international manager is to exceed benchmark performance by 100 bps over rolling three and five year periods, net-of-fees, and rank in the upper 40th percentile relative to peers. All other managers are expected to exceed benchmark performance over rolling three and five year periods, net-of-fees, and rank in the upper 40th percentile relative to peers. The broad benchmarks for each type of manager, subject to revision, are as follows: Large cap equity – S&P 500
Mid cap equity – Russell Mid Cap Small cap equity – Russell 2000 Micro cap equity – Russell Micro Cap International equity – MSCI ACWI ex-US Fixed income – Barclays Capital Aggregate Real estate – NCREIF
Investment Section
Investment Objectives, Policies, and Guidelines
Highway Patrol Retirement System 60
Hedge funds – HFRI Fund of Funds Private equity/GTAA – Wilshire 5000 + 3%, lagged one quarter
Over a market cycle, the total fund return is expected to exceed the following benchmarks: • A minimum return target of eight percent, representing the fund's actuarial
assumption, and also representing the long-term inflation rate of three percent plus a risk premium of five percent.
• A composite reference benchmark composed of 35% Russell 3000 Index, 20% MSCI ACWI ex-US Index, 5% NCREIF, 12.5% HFRI Fund of Funds, 5% Wilshire 5000 + 3% (lagged one quarter), and 22.5% Barclays Capital Aggregate Index.
Directed Brokerage In separately-managed equity accounts, HPRS investment managers are expected to use brokers that are under contract with HPRS to provide execution-only brokerage. Every five years, these brokers will be selected through a Request for Proposal process. An investment manager may be excused from the directed brokerage requirement if it can document favorable execution. Manager Selection Each new investment manager will be selected through a Request for Proposal process, as follows:
• The Investment Committee will authorize the issuance of an RFP that is posted on the HPRS website and disseminated as a press release to at least three nationally recognized investment trade publications.
• Responses that meet the RFP requirements will be subjected to a due diligence analysis by the HPRS Investment Consultant.
• One or more finalists will be selected to be interviewed by the Investment Committee. • The Investment Committee will recommend the hiring of an investment manager to
the Retirement Board. • The Investment Committee may recommend the hiring of a separate investment
manager to the Retirement Board, contingent upon unsatisfactory contract negotiations with the primary selection.
• The Chief Investment Officer will negotiate contract terms with the selected investment manager.
• The Chief Investment Officer may conduct an onsite due diligence visit to the selected investment manager’s premises.
An existing manager may be selected for an additional mandate without the need for an RFP process. All other aspects of the Investment Process must be followed with regard to the selection of an investment manager.

Investment Section
Investment Objectives, Policies, and Guidelines
Highway Patrol Retirement System 61
Roles and Responsibilities Board The role of the Board is supervisory, and discretion is delegated to investment managers who must adhere to the general guidelines established by the Board. The primary role of the Board is to --
• establish performance goals, • identify and review appropriate investment policy and guidelines, • retain outside investment and actuarial counsel, • reject, modify, or approve a recommendation from the Investment Committee
regarding the decision to hire or terminate a manager, and • review the results of the fund on a regular basis and implement necessary changes in
the investment policies, objectives, asset allocation, and investment managers as needed.
Investment Committee The Investment Committee will, at least quarterly, review the performance of the overall portfolio and selected components against their investment goals and policies. The Investment Committee will require investment managers to provide a comprehensive written quarterly report that includes the following:
• a review of investment performance, including the investment manager’s relative performance,
• a review of the HPRS investment, • a report on the investment manager’s current investment outlook or forecast, and • a strategy for the future.
The Investment Committee will, at least biannually, consider whether the manager continues to operate in the manner represented when retained and outlined in the agreement between the Investment Committee and the investment manager. The Investment Committee will require their manager to report key personnel staffing changes to the Investment Committee on or before the effective date of such changes. While the actual frequency and the nature of reviews will vary according to asset class, the liquidity of markets, and perhaps logistics, the regulations above should be seen as the minimum standards for effective monitoring of managers. The elected Chair, or Vice-Chair, will report to the Board at regularly scheduled meetings. Other roles of the Investment Committee include the following:
• approve the initiation of a search, • validate that the search process was carried out appropriately, • select and evaluate the finalists, • attend manager presentations at HPRS’s offices when necessary, • request additional information, if warranted, and • select the manager(s) that will be recommended to the Board for hiring.
Investment Section
Investment Objectives, Policies, and Guidelines
Highway Patrol Retirement System 62
Staff The Chief Investment Officer (CIO), who is responsible for the day-to-day management of the investment program, is employed by, and is directly responsible to, the Retirement Board. A complete job description is available from HPRS upon request. Other roles of the staff include the following:
• post the RFP to HPRS’s website, • oversee the work of the investment consultant, • ensure the process is completed in an appropriate manner, • ensure the Investment Committee and Board receive appropriate information, • coordinate the development and execution of manager contracts and guidelines, and • conduct on-site due diligence with selected finalist firm if deemed appropriate.
Investment Consultant An Investment Consultant is employed by, and is directly responsible to, the Retirement Board. The consultant is a fiduciary to the system, attends Investment Committee and Board meetings, provides quarterly investment monitoring reports, and works with the CIO to implement the Investment Policy of the Retirement Board. Other roles of the investment consultant include the following:
• identify the need for new managers, • develop the Request for Proposal (RFP), • evaluate proposals, • assist the Investment Committee in identifying finalists, • attend manager presentations at HPRS’s office when necessary, • discuss candidates with the Investment Committee and the Board, • conduct on-site due diligence with finalist firms, • conduct on-site due diligence with existing managers when necessary, • prepare comprehensive written search reports, • assist in the development of investment manager guidelines, • conduct and provide the HPRS staff with comprehensive written search reports , and • at least every three years, the investment consultant will provide a written manager
structure review. This review will go beyond a customary statistical review to elaborate on the following aspects of the manager structure: including the number of managers, allocations to managers, active versus passive management, investment management fees, and overall risk levels of the portfolio,
• provide the HPRS staff with written reviews of the investment managers in the portfolio when necessary. These reviews should include both relevant statistical data as well as qualitative assessments of the manager’s performance and portfolio strategy,
• provide HPRS staff with a quarterly report that documents managers’ compliance with the guidelines they are to operate within, and
• attend the ORSC or other legislative meetings with the Executive Director as needed.
Investment Section
Investment Objectives, Policies, and Guidelines
Highway Patrol Retirement System 63
Custodian As provided in ORC section 5505.11, the Treasurer of State is the custodian of HPRS funds. The Treasurer appoints a banking institution as a subcustodian, which acts as the custodian of HPRS funds. All disbursements are processed under the direction of the Treasurer after authorization by the Board. Investment Managers Managers are expected to --
• acknowledge the acceptance of this document, • act as a fiduciary to the system, • meet with the Board, or Investment Committee when requested, to review investment
activity and results, • hold and maintain errors and omissions insurance and provide proof of this insurance, • provide performance measurement data, explanation, and other communication as
required by the investment consultant, • provide frequent communication with HPRS and the investment consultant on all
significant matters pertaining to the investment of assets, • promptly notify HPRS and the Investment Consultant of any significant changes in
the manager’s investment strategy, organizational structure, financial condition, or personnel assigned to manage HPRS assets, and
• vote the proxies of the fund’s assets, consistent with the manager’s internal voting process.
Asset Allocation The definition of asset allocation targets and ranges is the single most important investment decision that the Board faces. An optimal mix of investments will produce returns that consistently meet the long-term assumed rate of return at a prudent level of risk. Periodic Reviews Asset allocation should be reviewed at least annually to ensure that the plan is on track to achieve the investment goals and that all the major assumptions used to establish the plan remain reasonable. A comprehensive review of asset allocation in the form of asset-liability modeling should be conducted every five years, or whenever a major structural change occurs in liabilities or investment assets. An asset allocation plan may require reconsideration when it becomes apparent that the assets are not keeping pace with the liabilities of a plan. This may occur not only as a result of the assets not performing as expected but also because the liabilities may not be behaving as expected. A new asset allocation review may be necessary when various asset classes are either failing to achieve their expected long-term returns or exhibiting volatility or correlation characteristics much different than expected.
Investment Section
Investment Objectives, Policies, and Guidelines
Highway Patrol Retirement System 64
The Investment Consultant will conduct risk budgeting to monitor the active risk that each asset class introduces into the portfolio to ensure it remains consistent with the Board’s risk tolerance on a periodic basis. Rebalancing Policy In order to maintain the desired asset allocation mix, the portfolio will be reviewed quarterly to determine compliance with asset allocation targets and ranges. Strategic decisions will be based on trading costs, liquidity needs and the relative weighting of each manager. To the extent that an asset class is outside of the allowable range, the Chief Investment Officer and the Investment Consultant will develop a plan for compliance. Without formal Board approval, the Chief Investment Officer may authorize one or more rebalancing transactions to implement the plan. To the extent that an asset class varies from the target, the Chief Investment Officer and the investment consultant may develop a plan for tighter compliance. Provided that rebalancing may be achieved at minimal cost (e.g., through commingled funds with no direct trading expense), without formal Board approval, the Chief Investment Officer may authorize one or more rebalancing transactions to implement the plan. Securities Lending The Board may authorize an external service provider to conduct securities lending activities. Shareholder Activities Each investment manager is responsible for voting the proxies of the fund’s assets, consistent with the manager’s internal voting process. Unless the Board takes specific action to do so, HPRS does not take positions on shareholder proposals. Monitoring and Reporting Periodically, to accomplish the goal of earning the highest rate of return, HPRS may elect to have existing managers present to the Investment Committee, a subset of the Investment Committee or to the Investment Consultant. This comprehensive performance review should go well beyond simply reviewing the manager’s performance relative to the benchmark. It should encompass: ensuring compliance with the investment guidelines, ensuring compliance with reporting requirements, ensuring continuity of the investment process and philosophy, and ensuring consistency of strategy (no “style drift”). In short, the review is intended to assure that the reasons for originally selecting the manager are still intact. The manager’s presentation should begin with an organizational overview, including discussion of the firm’s mission, history, ownership, assets, clients, etc. Any pertinent organizational or staff changes (resignations, hires, etc.) should be highlighted, and biographies of key personnel should always be included. Any pending legal or regulatory issues should be disclosed. A thorough review should restate the portfolio objectives and account guidelines.
Investment Section
Investment Objectives, Policies, and Guidelines
Highway Patrol Retirement System 65
The investment universe should be reviewed, highlighting allowed or prohibited types of securities and what, if any, derivative use is allowed. Perhaps most importantly, Investment Committee members should inquire about and be comfortable with the manager’s risk management procedures. The manager should offer a market overview, reviewing and analyzing trends and conditions in the relevant market. He should compare the portfolio structure to the benchmark, highlighting significant over-weightings or under-weightings in sectors. Similar comparisons should be shown for major portfolio characteristics (for stocks, cap size, P/E valuation, etc.; for bonds, maturity, coupon, etc.). Major holdings should be listed; if possible, all holdings should be listed. Analysis of performance should begin with confirmation that the manager is using the benchmark(s) agreed to in the account guidelines. Appropriate time periods for performance appraisal should be both short-term (quarter, year-to-date, past 12 months) and long-term (i.e., three years, five years, since inception). Performance should ideally be presented in both gross and net terms, but it should at least be clear which returns are being presented. Just as important as the appropriate presentation of relevant performance figures is the discussion of performance attribution. The manager should explicitly present the factors (sectors, securities, duration, etc.) that enhanced performance and that had a negative impact. As part of the presentation, the manager should present the firm’s and/or department’s outlook for the economy, the market and the portfolio. For managers of nontraditional asset classes like real estate and alternative investments, the monitoring process will be different, tempered by such facts as the absence of public markets for the underlying investments, the lack of obvious benchmarks and the much longer investment time horizons. Annual Review In light of rapid changes in the capital markets and in investment management techniques, these guidelines will be reviewed by the Board on an annual basis. Changes and exceptions to these guidelines may be made at any time with the approval of the Board.
Investment Section
Investment Objectives, Policies, and Guidelines
Highway Patrol Retirement System 66
Investment Process
I. Organize and Formalize
A. Organize
1. Manage investments in accordance with applicable laws and written investment policy statements (IPS)
2. Define, document, and acknowledge the roles and responsibilities of all involved parties (fiduciaries and non-fiduciaries)
3. Service agreements and contracts are in writing, and do not contain provisions that conflict with fiduciary standards of care
4. Assets are within the jurisdiction of appropriate courts, and are protected from theft and embezzlement
B. Formalize
1. Identify an investment time horizon 2. Identify a targeted risk level 3. Identify an expected, modeled return to meet investment objectives 4. Select asset classes which are consistent with the identified risk, return, and time
horizon 5. Select asset classes which are consistent with implementation and monitoring
constraints 6. Ensure that IPS contains the detail to define, implement, and manage a specific
investment strategy
II. Search, Selection, and Monitoring
A. Search and Selection
1. Due diligence procedures
After asset allocation, the most important decision facing HPRS is the selection of investment managers. This process is generally as much an art as a science, and it typically takes several years to reliably determine whether the effort has been successful. An investment management firm should be selected not because of its relationship with a particular Investment Committee member or with any other party, not because it made the glitziest presentation, and not necessarily just because it had superior performance in the recent past. While investment management fees should be a valid consideration, they should not necessarily be a decisive factor. A search for an investment manager should incorporate an examination of ownership and organizational factors pertaining to the firm, an understanding of its investment
Investment Section
Investment Objectives, Policies, and Guidelines
Highway Patrol Retirement System 67
philosophy as well as the process by which it implements that philosophy, as well as a thorough assessment of past performance and how relevant it might be for anticipating future returns. The HPRS search for an investment manager begins with a decision as to how the mandate would fit in with overall asset allocation. The process should end with the selection of a manager in whom the Investment Committee and Board has confidence not only for its capability to fulfill its investment mandate but also for the likelihood of being treated as an important client and receiving excellent client service. Since investment styles go in and out of favor, since very few managers outperform their benchmarks year-in and year-out, and since all firms are subject to organizational and personnel change, there are no “sure things” in investment manager selection. However, it is fair to say that the keys to a successful relationship between a client and a manager involve not just a determination of investment expertise but also the establishment of a sense of overall comfort and mutual respect.
2. Document decisions on all investment managers (including passive)
Request for Proposal The Investment Committee will authorize the issuance of an RFP that is posted on the HPRS website and disseminated as a press release to at least three nationally recognized investment trade publications. Responses that meet the RFP requirements will be subjected to a due diligence analysis by the HPRS Investment Consultant. Due Diligence Meeting The Chief Investment Officer and/or the Executive Director may conduct an onsite due diligence visit to the selected investment manager’s premises. The meetings will focus on:
• Performance Review • Portfolio Review • Organizational Review • Operational Review • Strategy Review • Management Review
Archiving Information An electronic record will be stored with all aspects of the search.
B. Monitoring
1. Manager Assessments
Investment Section
Investment Objectives, Policies, and Guidelines
Highway Patrol Retirement System 68
Regular Oversight
• The Investment Committee will, at least biannually, consider whether the manager continues to operate in the manner represented when retained and outlined in the agreement between the Investment Committee and the investment manager.
• The Investment Committee will require its manager to report key personnel staffing changes to the Investment Committee on or before the effective date of such changes.
• The Investment Consultant will perform onsite due diligence on every manager before an initial investment is made and will perform additional onsite due diligence periodically through normal travel and when appropriate. A written due diligence report summarizing the visit will be made available to the Investment Committee and the Board.
• While the actual frequency and the nature of reviews will vary according to asset class, the liquidity of markets, and perhaps logistics, the regulations above should be seen as the minimum standards for effective monitoring of managers.
The Investment Committee may request a presentation by existing managers if it believes the reasons for originally selecting the manager are no longer intact.
2. "Watch list" and termination procedures are followed for underperforming investment options
Watch List A fundamental part of the monitoring process is the Investment Committee’s annual determination that a manager is satisfactorily fulfilling the assigned mandate. Possible reasons for placing a manager on a watch list are 1) orga-nizational issues such as a change in firm ownership or control, significant change in team composition or responsibilities, or departure of key personnel, 2) below average performance over both short and longer-term periods or performance inconsistent with the manager’s style and mandate, or 3) other factors such as a material undisclosed guideline violation, uncorrected contract violation, unsatisfactory client service, or major regulatory or other proceedings affecting the firm. Termination Reasons to consider the termination of a manager may be either 1) qualitative, such as major personnel changes or other organizational issues, or 2) quantitative, involving measurable underperformance over a full market cycle or clear evidence of deviation from the manager’s mandate. They may involve policy issues, such as
Investment Section
Investment Objectives, Policies, and Guidelines
Highway Patrol Retirement System 69
violation of investment policies or change in basic investment strategy, or even communication issues, such as failure to adhere to reporting requirements. There are no hard and fast rules as to what constitutes sufficient and decisive justification to terminate a manager. In the end, it is simply a matter of the Investment Committee no longer being comfortable with and no longer having confidence in a manager. Termination can come about by a change in any of the factors that led to the manager’s hiring. This could include the Investment Committee simply making an adjustment to its asset allocation that lowers or eliminates exposure to a particular asset class or subclass; in such circumstances, a manager would be terminated despite having satisfactorily fulfilled its mandate in every way.
III. Implementation
1. Define target asset allocation and ranges
Over time, asset allocation generally accounts for a very high percentage (as much as 90%, by some estimates) of the investment return of a retirement system portfolio. Basic Objective The objective of asset allocation is to develop an investment program that will, at the minimum, meet or exceed the Investment Committee’s assumed actuarial rate/spending rate on a consistent basis. It accomplishes this by seeking to achieve the highest possible rate of total return consistent with prudent levels of risk and liquidity. Another goal is to achieve sufficient diversification that will deliver the expected return while preserving capital and avoiding large losses. In accomplishing these goals, the investment program will ensure that funds are managed with care, skill, prudence, and diligence. Primary Components In determining asset allocation, the primary components are 1) analysis of the current and expected financial condition of the System, including existing assets and future liabilities, and 2) expectations of long-term returns from the capital markets and the outlook for inflation. Asset classes considered viable for inclusion in an asset allocation study can be any aggregation of financial or real assets that have risk, return, and correlation characteristics that are clearly different from those of other asset classes and where the inclusion or exclusion has a definable affect on the risk and return expectations of the portfolio’s total return. All included asset classes should have some clear value to the portfolio such as diversification benefit, return enhancement, or liquidity that is sufficiently different from that of other asset classes.
Investment Section
Investment Objectives, Policies, and Guidelines
Highway Patrol Retirement System 70
Asset classes considered for inclusion must have sufficient data and history to allow for an objective assessment of the viability or potential benefit of the asset class to the plan. There must be a sufficient basis for developing expected investment returns, risks, and correlations to other asset classes. Eligible asset classes must have sufficient size, liquidity, and cost efficiency to allow the System to invest amounts meaningful enough to have an impact on total return. Methodology An asset allocation plan is typically developed using a combination of quantitative and qualitative techniques. For each prospective asset class, the process requires a projected annualized return, an estimate of volatility (usually expressed as the standard deviation of expected returns), and an estimate of the asset class’s correlation to the broad stock market. Using computerized simulation programs, several possible portfolios will be developed and considered, each having slightly different asset allocation distributions. The Investment Committee will consider the various alternative asset allocation plans, each of which will have its own projected return and projected volatility. The Investment Committee will consider all the alternatives and select the one that they are most comfortable with in the context of the likelihood of achieving a particular return with a level of risk that all deem acceptable. Since purely quantitative simulation analysis will often produce asset allocation alternatives that may not appear practical or realistic, such as assigning unacceptably high allocations to certain nontraditional asset classes, the process is as much an art as it is science.
IV. Model and Optimization
A. Conduct an Asset Liability Study
B. Conduct an Experience Study
C. Document sources of return data for each asset class
1. Historical
Historical returns provide a factual picture of how asset classes have performed over time and through various market conditions. They are also helpful in analyzing how asset classes have performed relative to other asset classes over time or in specific time periods (correlation). The limitation of historical analysis is that it is all based on series of events that have happened in the past that may or may not occur in the future.
2. Projected - Black Litterman
In order to improve upon the historical returns, the Black-Litterman model is used to develop projected returns. Black Litterman is a mathematical model for portfolio allocation developed in 1990 at Goldman Sachs by Fischer Black and Robert Litterman. It seeks to overcome problems that institutional investors have encountered in applying modern portfolio theory in practice. The model starts with
Investment Section
Investment Objectives, Policies, and Guidelines
Highway Patrol Retirement System 71
the equilibrium assumption that the asset allocation of a certain asset class should be proportional to the market values of that asset class, and then modifies that to take into account the specific opinions about asset returns to arrive at an asset allocation.
D. Optimization – Efficient Frontier
The asset allocation process starts with a detailed study to determine how assets are to be managed for the benefit of the organization, as detailed above. The next step is to construct portfolios that are likely to deliver the highest possible return at an acceptable level of risk by utilizing the Modern Portfolio Theory. Once the target risk/reward level has been identified, various portfolios are plotted along an Efficient Frontier to optimize the amount of return contributed by each asset class while minimizing the overall level of risk for the resulting portfolio. Asset allocation targets are generated via the modeling and optimization process. Once presented to the Investment Committee and adopted by the Board, these targets are memorialized in the Investment Policy Statement along with tolerance ranges showing the allowable deviation from target.
V. Risk Management
A. Background
The assumption of risk within the investment portfolio is necessary in order for the System to meet its obligations because there are no risk free assets which generate the required level of return. The assumption of risk should therefore be managed through a risk budgeting process.
B. Risk Budgeting
Risk budgeting is the process of determining the desired level of risk within the overall portfolio and allocating the risk within the various asset classes. Risk budgets will change over time for various reasons, including (but not limited to) changes in asset allocation, return assumption revisions, correlation between asset classes, and changes to funding levels, and therefore should be reviewed periodically to ensure that the current budget reflects all available information.
C. Monitoring
Risk will be monitored through various forms of analysis and reporting in an attempt to understand risk within the plan, and to ensure adequate compensation for the risk that is taken. Analysis will occur on various levels from individual manager portfolios up through and including the total Plan level. In addition to relative performance evaluation, an analysis of diversification, tracking error, standard deviation, and other risk measures will be conducted and reported.
Investment Section
Investment Objectives, Policies, and Guidelines
Highway Patrol Retirement System 72
The Investment Committee will review portfolios, asset classes, and total Plan information periodically for compliance within the overall risk budget. Portfolios or asset classes out of compliance with guidelines will be brought into compliance, or a plan for doing so will be developed. Alternatively, justification for maintaining the exposure will be provided to the Investment Committee.
D. Reporting
Reports will be assembled and presented to the Investment Committee periodically. Summary reports will be assembled and presented to the Board of Trustees periodically.
Approved, No Revisions, December 19, 2013 Revised, February 21, 2013 Revised, February 23, 2012 Revised, October 27, 2011 Revised, August 26, 2010 Revised, April 22, 2010 Revised, February 25, 2010 Revised, April 23, 2009 Revised, October 25, 2007 Revised, June 16, 2005 Revised, June 26, 2003 Revised, November 15, 2001 Revised, June 22, 1999 Revised, March 13, 1997 Adopted and approved, September 7, 1994 Revised, June 29, 1994 Revised, September 5, 1990 Revised, June 1, 1988 Adopted and approved, June 11, 1986

AAccttuuaarriiaall SSeeccttiioonn
May 16, 2014 The Retirement Board Ohio State Highway Patrol Retirement System 6161 Busch Boulevard, Suite 119 Columbus, Ohio 43229 Dear Board Members: The basic financial objective of the Highway Patrol Retirement System (HPRS) is to establish and receive contributions which:
when expressed in terms of percents of active member payroll will remain approximately level from generation to generation, and
when combined with present assets and future investment return will be sufficient to meet the financial obligations of HPRS to present and future retirees and beneficiaries.
The financial objective is addressed within the annual actuarial valuation. The valuation process develops contribution rates that are sufficient to fund the plan’s current cost (i.e., the costs assigned by the valuation method to the year of service about to be rendered), as well as to fund unfunded actuarial accrued liabilities as a level percent of active member payroll over a finite period. The most recent valuations were completed based upon population data, asset data, and plan provisions as of December 31, 2012 and an actuarial valuation report was issued as of that date. The plan administrative staff provides the actuary with data for the actuarial valuation. The actuary relies on the data after reviewing it for internal and year-to-year consistency. The actuary summarizes and tabulates population data in order to analyze longer term trends. The plan’s external auditor also audits the actuarial data annually. The actuary prepared or assisted in preparing the following supporting schedules for the Comprehensive Annual Financial Report:
Actuarial Section Summary of Assumptions Funding Method, Asset Valuation Method, Interest Rate Payroll Growth Probabilities of Age & Service Retirement Probabilities of Separation from Active Employment Before Age & Service Retirement Health Care and Medicare Short-Term Solvency Test Recent Experience in the Health Care Fund Membership Data Analysis of Financial Experience Supplementary Schedules Schedule of Funding Progress Schedule of Employer Contributions
Notes to Trend Data
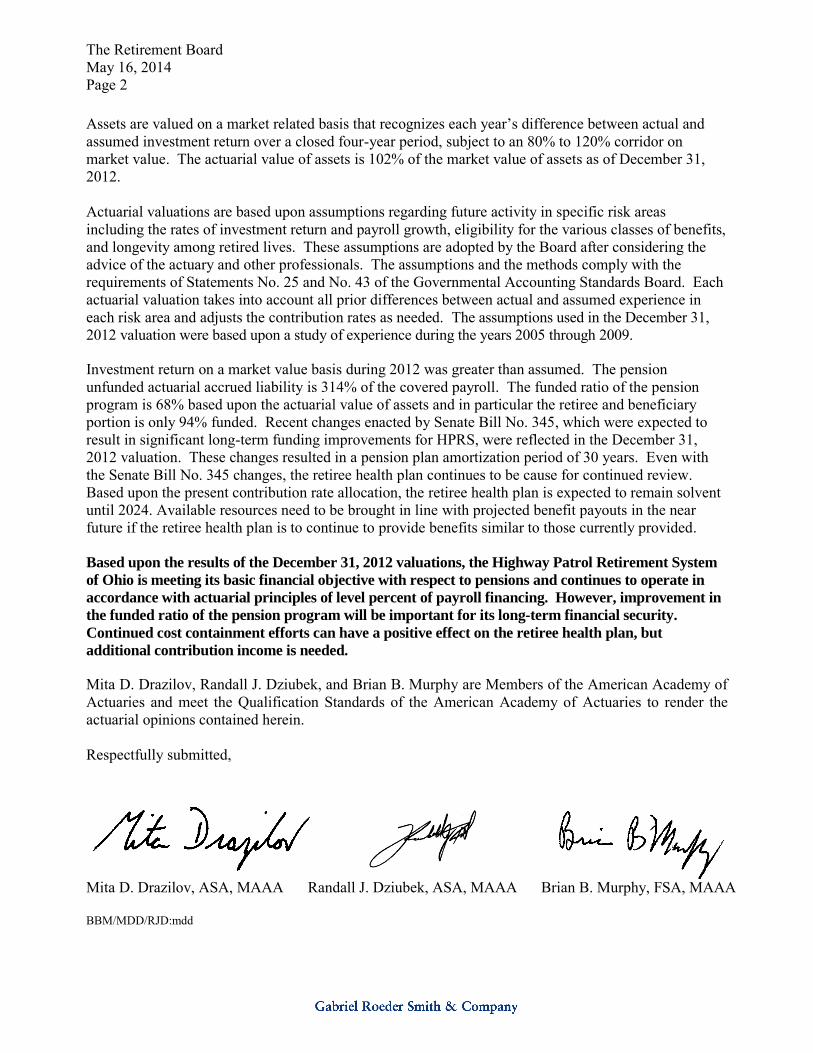
The Retirement Board May 16, 2014 Page 2
Assets are valued on a market related basis that recognizes each year’s difference between actual and assumed investment return over a closed four-year period, subject to an 80% to 120% corridor on market value. The actuarial value of assets is 102% of the market value of assets as of December 31, 2012. Actuarial valuations are based upon assumptions regarding future activity in specific risk areas including the rates of investment return and payroll growth, eligibility for the various classes of benefits, and longevity among retired lives. These assumptions are adopted by the Board after considering the advice of the actuary and other professionals. The assumptions and the methods comply with the requirements of Statements No. 25 and No. 43 of the Governmental Accounting Standards Board. Each actuarial valuation takes into account all prior differences between actual and assumed experience in each risk area and adjusts the contribution rates as needed. The assumptions used in the December 31, 2012 valuation were based upon a study of experience during the years 2005 through 2009. Investment return on a market value basis during 2012 was greater than assumed. The pension unfunded actuarial accrued liability is 314% of the covered payroll. The funded ratio of the pension program is 68% based upon the actuarial value of assets and in particular the retiree and beneficiary portion is only 94% funded. Recent changes enacted by Senate Bill No. 345, which were expected to result in significant long-term funding improvements for HPRS, were reflected in the December 31, 2012 valuation. These changes resulted in a pension plan amortization period of 30 years. Even with the Senate Bill No. 345 changes, the retiree health plan continues to be cause for continued review. Based upon the present contribution rate allocation, the retiree health plan is expected to remain solvent until 2024. Available resources need to be brought in line with projected benefit payouts in the near future if the retiree health plan is to continue to provide benefits similar to those currently provided. Based upon the results of the December 31, 2012 valuations, the Highway Patrol Retirement System
of Ohio is meeting its basic financial objective with respect to pensions and continues to operate in
accordance with actuarial principles of level percent of payroll financing. However, improvement in
the funded ratio of the pension program will be important for its long-term financial security.
Continued cost containment efforts can have a positive effect on the retiree health plan, but
additional contribution income is needed. Mita D. Drazilov, Randall J. Dziubek, and Brian B. Murphy are Members of the American Academy of Actuaries and meet the Qualification Standards of the American Academy of Actuaries to render the actuarial opinions contained herein. Respectfully submitted,
Mita D. Drazilov, ASA, MAAA Randall J. Dziubek, ASA, MAAA Brian B. Murphy, FSA, MAAA BBM/MDD/RJD:mdd
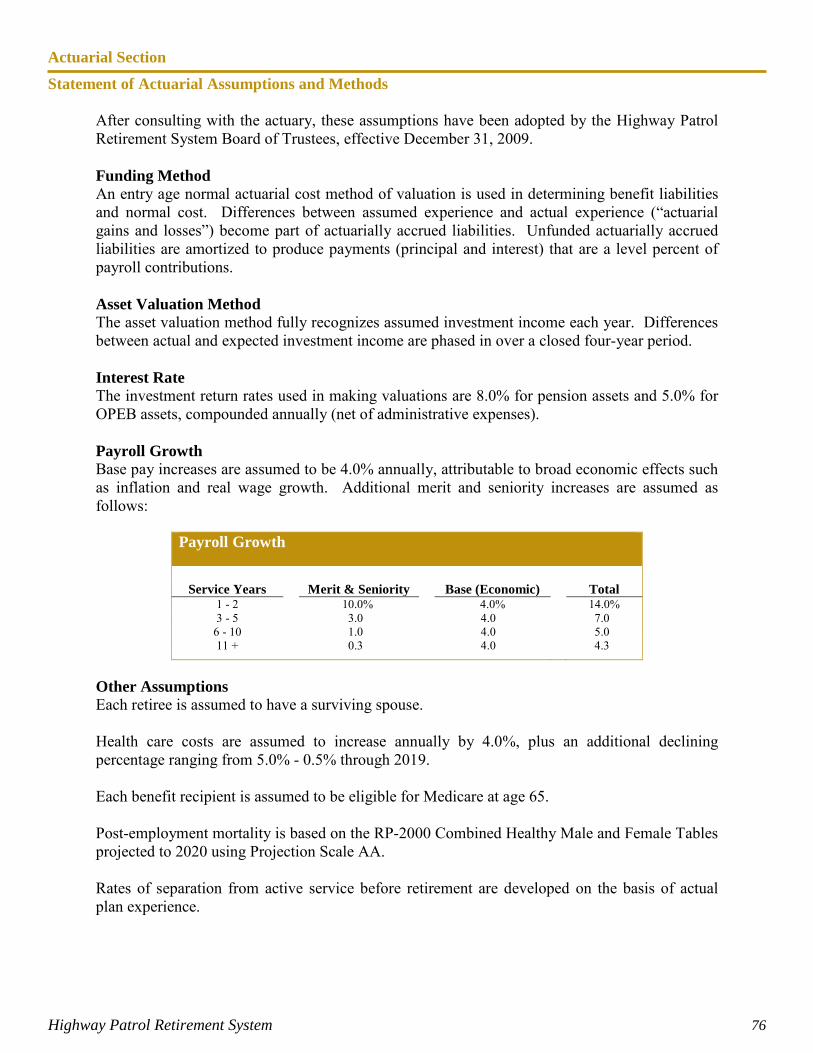
Actuarial Section
Statement of Actuarial Assumptions and Methods
Highway Patrol Retirement System 76
After consulting with the actuary, these assumptions have been adopted by the Highway Patrol Retirement System Board of Trustees, effective December 31, 2009. Funding Method An entry age normal actuarial cost method of valuation is used in determining benefit liabilities and normal cost. Differences between assumed experience and actual experience (“actuarial gains and losses”) become part of actuarially accrued liabilities. Unfunded actuarially accrued liabilities are amortized to produce payments (principal and interest) that are a level percent of payroll contributions. Asset Valuation Method The asset valuation method fully recognizes assumed investment income each year. Differences between actual and expected investment income are phased in over a closed four-year period. Interest Rate The investment return rates used in making valuations are 8.0% for pension assets and 5.0% for OPEB assets, compounded annually (net of administrative expenses). Payroll Growth Base pay increases are assumed to be 4.0% annually, attributable to broad economic effects such as inflation and real wage growth. Additional merit and seniority increases are assumed as follows:
Payroll Growth
Service Years Merit & Seniority Base (Economic) Total
1 - 2 10.0% 4.0% 14.0% 3 - 5 3.0 4.0 7.0
6 - 10 1.0 4.0 5.0 11 + 0.3 4.0 4.3
Other Assumptions Each retiree is assumed to have a surviving spouse. Health care costs are assumed to increase annually by 4.0%, plus an additional declining percentage ranging from 5.0% - 0.5% through 2019. Each benefit recipient is assumed to be eligible for Medicare at age 65. Post-employment mortality is based on the RP-2000 Combined Healthy Male and Female Tables projected to 2020 using Projection Scale AA. Rates of separation from active service before retirement are developed on the basis of actual plan experience.
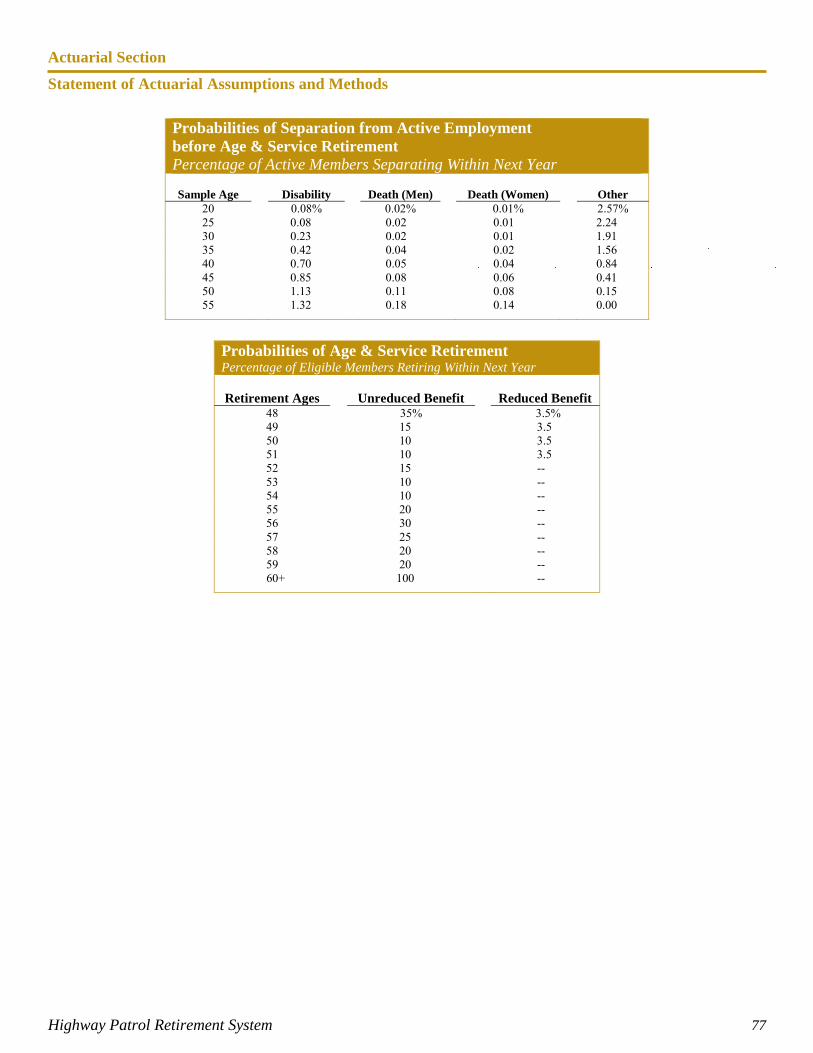
Actuarial Section
Statement of Actuarial Assumptions and Methods
Highway Patrol Retirement System 77
Probabilities of Age & Service Retirement Percentage of Eligible Members Retiring Within Next Year
Retirement Ages Unreduced Benefit Reduced Benefit
48 35% 3.5% 49 15 3.5 50 10 3.5 51 10 3.5 52 15 -- 53 10 -- 54 10 -- 55 20 -- 56 30 -- 57 25 -- 58 20 -- 59 20 --
60+ 100 --
Probabilities of Separation from Active Employment before Age & Service Retirement Percentage of Active Members Separating Within Next Year
Sample Age
Disability
Death (Men)
Death (Women)
Other
20 0.08% 0.02% 0.01% 2.57% 25 0.08 0.02 0.01 2.24 30 0.23 0.02 0.01 1.91 35 0.42 0.04 0.02 1.56 40 0.70 0.05 0.04 0.84 45 0.85 0.08 0.06 0.41 50 1.13 0.11 0.08 0.15 55 1.32 0.18 0.14 0.00
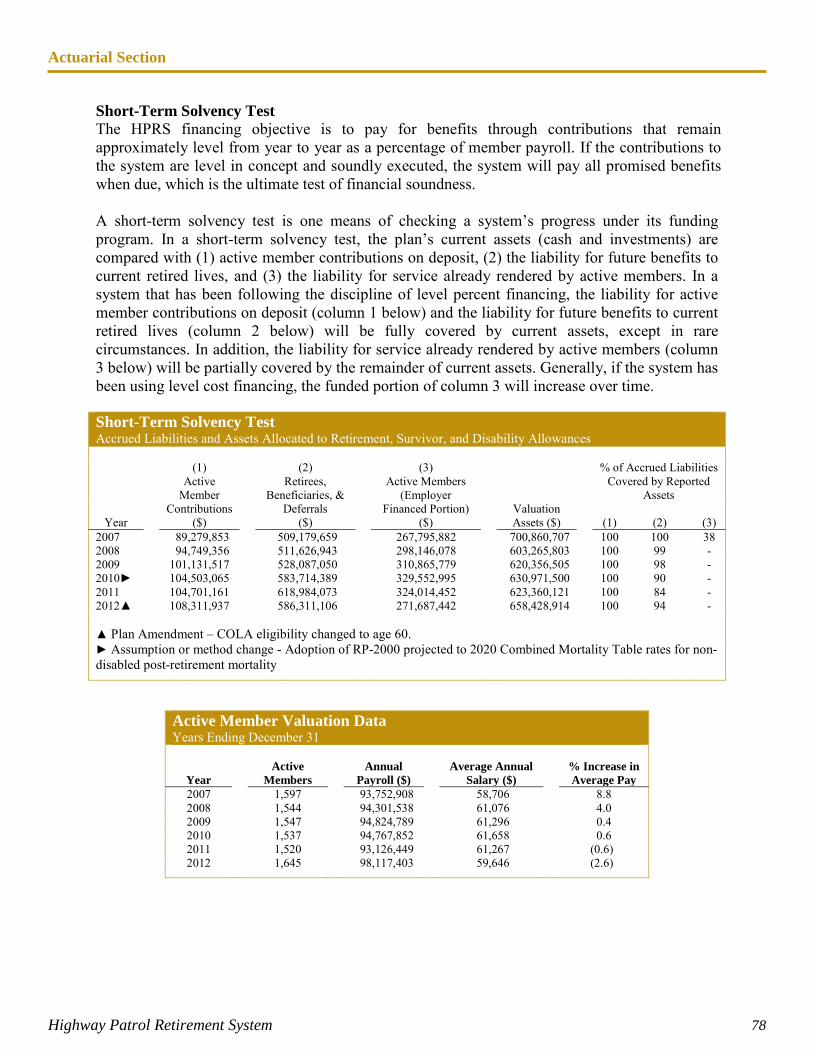
Actuarial Section
Highway Patrol Retirement System 78
Short-Term Solvency Test The HPRS financing objective is to pay for benefits through contributions that remain approximately level from year to year as a percentage of member payroll. If the contributions to the system are level in concept and soundly executed, the system will pay all promised benefits when due, which is the ultimate test of financial soundness. A short-term solvency test is one means of checking a system’s progress under its funding program. In a short-term solvency test, the plan’s current assets (cash and investments) are compared with (1) active member contributions on deposit, (2) the liability for future benefits to current retired lives, and (3) the liability for service already rendered by active members. In a system that has been following the discipline of level percent financing, the liability for active member contributions on deposit (column 1 below) and the liability for future benefits to current retired lives (column 2 below) will be fully covered by current assets, except in rare circumstances. In addition, the liability for service already rendered by active members (column 3 below) will be partially covered by the remainder of current assets. Generally, if the system has been using level cost financing, the funded portion of column 3 will increase over time. Short-Term Solvency Test Accrued Liabilities and Assets Allocated to Retirement, Survivor, and Disability Allowances
(1) Active
Member Contributions
($)
(2) Retirees,
Beneficiaries, & Deferrals
($)
(3) Active Members
(Employer Financed Portion)
($)
Valuation Assets ($)
% of Accrued Liabilities Covered by Reported
Assets
Year (1) (2) (3) 2007 89,279,853 509,179,659 267,795,882 700,860,707 100 100 38 2008 94,749,356 511,626,943 298,146,078 603,265,803 100 99 - 2009 101,131,517 528,087,050 310,865,779 620,356,505 100 98 - 2010► 104,503,065 583,714,389 329,552,995 630,971,500 100 90 - 2011 104,701,161 618,984,073 324,014,452 623,360,121 100 84 - 2012▲ 108,311,937 586,311,106 271,687,442 658,428,914 100 94 - ▲ Plan Amendment – COLA eligibility changed to age 60. ► Assumption or method change - Adoption of RP-2000 projected to 2020 Combined Mortality Table rates for non-disabled post-retirement mortality
Active Member Valuation Data Years Ending December 31
Year Active
Members Annual
Payroll ($) Average Annual
Salary ($) % Increase in Average Pay
2007 1,597 93,752,908 58,706 8.8 2008 1,544 94,301,538 61,076 4.0 2009 1,547 94,824,789 61,296 0.4 2010 1,537 94,767,852 61,658 0.6 2011 1,520 93,126,449 61,267 (0.6) 2012 1,645 98,117,403 59,646 (2.6)
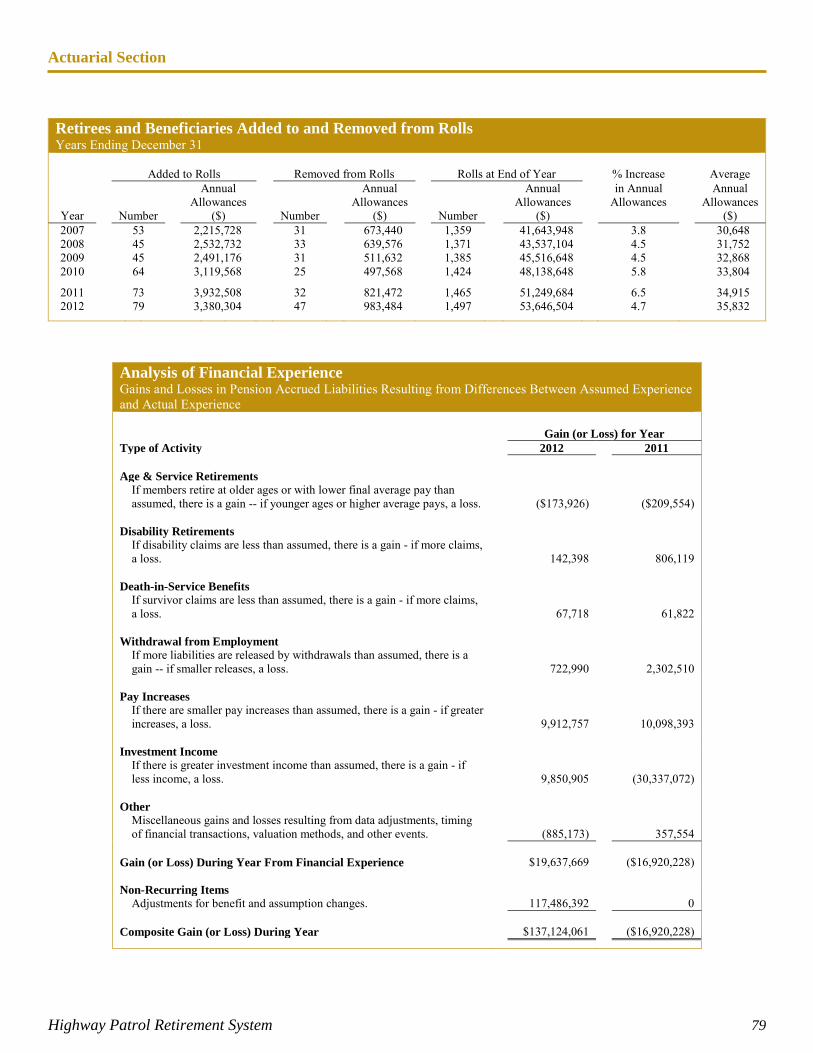
Actuarial Section
Highway Patrol Retirement System 79
Retirees and Beneficiaries Added to and Removed from Rolls Years Ending December 31
Added to Rolls Removed from Rolls Rolls at End of Year % Increase Average
Year Number
Annual Allowances
($) Number
Annual Allowances
($) Number
Annual Allowances
($)
in Annual Allowances
Annual Allowances
($) 2007 53 2,215,728 31 673,440 1,359 41,643,948 3.8 30,648 2008 45 2,532,732 33 639,576 1,371 43,537,104 4.5 31,752 2009 45 2,491,176 31 511,632 1,385 45,516,648 4.5 32,868 2010 64 3,119,568 25 497,568 1,424 48,138,648 5.8 33,804
2011 73 3,932,508 32 821,472 1,465 51,249,684 6.5 34,915 2012 79 3,380,304 47 983,484 1,497 53,646,504 4.7 35,832
Analysis of Financial Experience Gains and Losses in Pension Accrued Liabilities Resulting from Differences Between Assumed Experience and Actual Experience
Gain (or Loss) for Year
Type of Activity 2012 2011 Age & Service Retirements
If members retire at older ages or with lower final average pay than assumed, there is a gain -- if younger ages or higher average pays, a loss. ($173,926) ($209,554)
Disability Retirements
If disability claims are less than assumed, there is a gain - if more claims, a loss. 142,398 806,119
Death-in-Service Benefits
If survivor claims are less than assumed, there is a gain - if more claims, a loss. 67,718 61,822
Withdrawal from Employment
If more liabilities are released by withdrawals than assumed, there is a gain -- if smaller releases, a loss. 722,990 2,302,510
Pay Increases
If there are smaller pay increases than assumed, there is a gain - if greater increases, a loss. 9,912,757 10,098,393
Investment Income
If there is greater investment income than assumed, there is a gain - if less income, a loss. 9,850,905 (30,337,072)
Other
Miscellaneous gains and losses resulting from data adjustments, timing of financial transactions, valuation methods, and other events. (885,173) 357,554
Gain (or Loss) During Year From Financial Experience $19,637,669 ($16,920,228) Non-Recurring Items
Adjustments for benefit and assumption changes. 117,486,392 0 Composite Gain (or Loss) During Year $137,124,061 ($16,920,228)
Actuarial Section
Summary of Plan Provisions
Highway Patrol Retirement System 80
Purpose In 1941, the Highway Patrol Retirement System (HPRS) was created by the Ohio General Assembly to provide for retirement and survivor benefits for members and dependents. Administration The general administration and management of HPRS are vested in the Highway Patrol Retirement System Board of Trustees under Ohio Revised Code Chapter 5505. The eleven-member Board consists of the Superintendent of the State Highway Patrol, three appointed members, five elected active members, and two elected retired members. The appointed members are investment experts designated by the Governor, the Treasurer of State, and the General Assembly. The active members are elected to four-year terms by members of the plan. Any contributing member is eligible to become an active member candidate, and each contributing member is eligible to vote in the active member election process. Any retiree who is an Ohio resident and who has not served as a statutory or active member of the Board during the past three years is eligible to become a retired member candidate. Each retiree is eligible to vote in the retired member election. DROP members are eligible to become a candidate and vote in the retired member election. The Superintendent of the State Highway Patrol serves by virtue of the office held. A chairperson and vice-chairperson are elected by the Board annually. All regular Board meetings are considered to be public meetings. While the Board members serve without compensation, they are not expected to suffer any loss because of absence from regular employment while engaged in official Board duties. In addition, the members of the Board are reimbursed for actual and necessary expenses. Employer Contributions Ohio law requires that the Board certify the employer contribution rate to the Office of Budget and Management in even-numbered years. The employer rate may not be lower than the member rate, nor may it exceed three times the member rate. The employer contribution rate was 26.5% in 2013. Member Contributions Each member of HPRS, through payroll deduction, must contribute the legally-established contribution rate as a percentage of salary. Individual member accounts are maintained by HPRS and, upon termination of employment, the amount contributed is refundable in lieu of the payment of a pension benefit. The member contribution rate was 10% in 2013. Service Credit Prior to retirement, the following types of additional service credit may be purchased: (1) military service, (2) prior refunded full-time service as a contributing member of the State Highway Patrol Retirement System, the Ohio Police & Fire Pension Fund, the State Teachers Retirement System of Ohio, the School Employees Retirement System of Ohio, the Ohio Public Employees Retirement System, and the Cincinnati Retirement System. Military service and prior refunded full-time service in HPRS and the Ohio Police & Fire Pension Fund may be used to meet the minimum service requirement in order to qualify for unreduced pension benefits. In the case of prior service
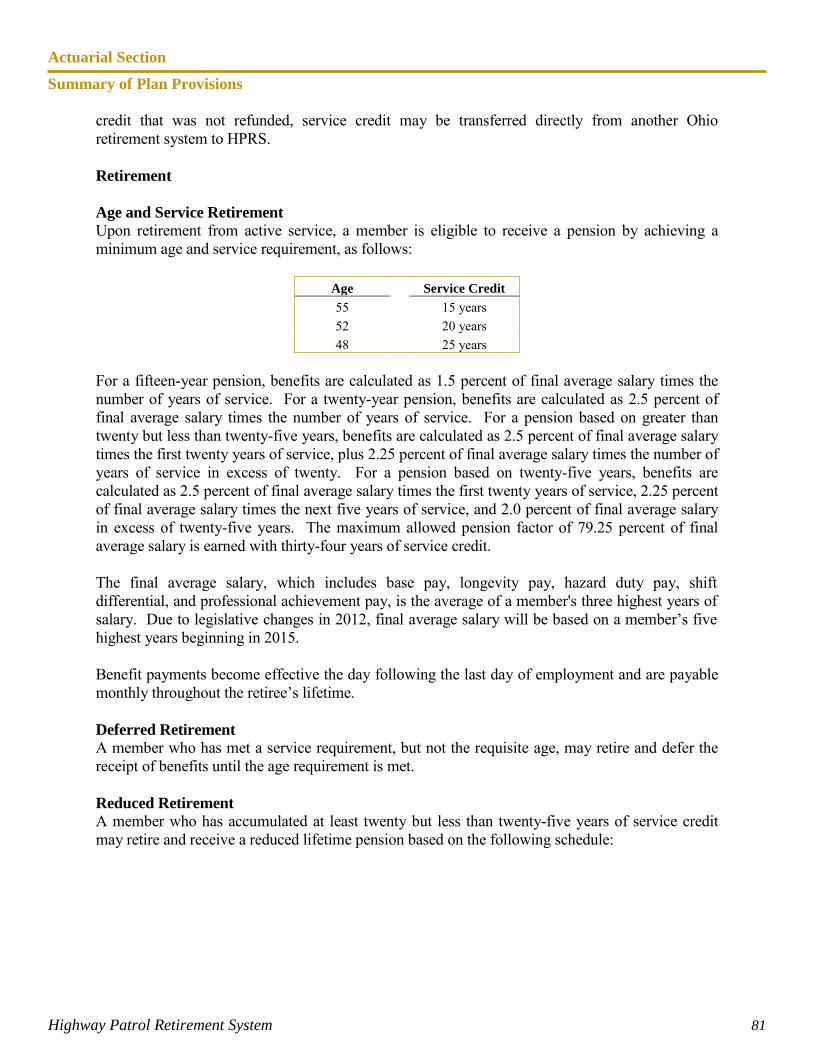
Actuarial Section
Summary of Plan Provisions
Highway Patrol Retirement System 81
credit that was not refunded, service credit may be transferred directly from another Ohio retirement system to HPRS. Retirement Age and Service Retirement Upon retirement from active service, a member is eligible to receive a pension by achieving a minimum age and service requirement, as follows:
Age Service Credit 55 15 years 52 20 years 48 25 years
For a fifteen-year pension, benefits are calculated as 1.5 percent of final average salary times the number of years of service. For a twenty-year pension, benefits are calculated as 2.5 percent of final average salary times the number of years of service. For a pension based on greater than twenty but less than twenty-five years, benefits are calculated as 2.5 percent of final average salary times the first twenty years of service, plus 2.25 percent of final average salary times the number of years of service in excess of twenty. For a pension based on twenty-five years, benefits are calculated as 2.5 percent of final average salary times the first twenty years of service, 2.25 percent of final average salary times the next five years of service, and 2.0 percent of final average salary in excess of twenty-five years. The maximum allowed pension factor of 79.25 percent of final average salary is earned with thirty-four years of service credit. The final average salary, which includes base pay, longevity pay, hazard duty pay, shift differential, and professional achievement pay, is the average of a member's three highest years of salary. Due to legislative changes in 2012, final average salary will be based on a member’s five highest years beginning in 2015. Benefit payments become effective the day following the last day of employment and are payable monthly throughout the retiree’s lifetime. Deferred Retirement A member who has met a service requirement, but not the requisite age, may retire and defer the receipt of benefits until the age requirement is met. Reduced Retirement A member who has accumulated at least twenty but less than twenty-five years of service credit may retire and receive a reduced lifetime pension based on the following schedule:
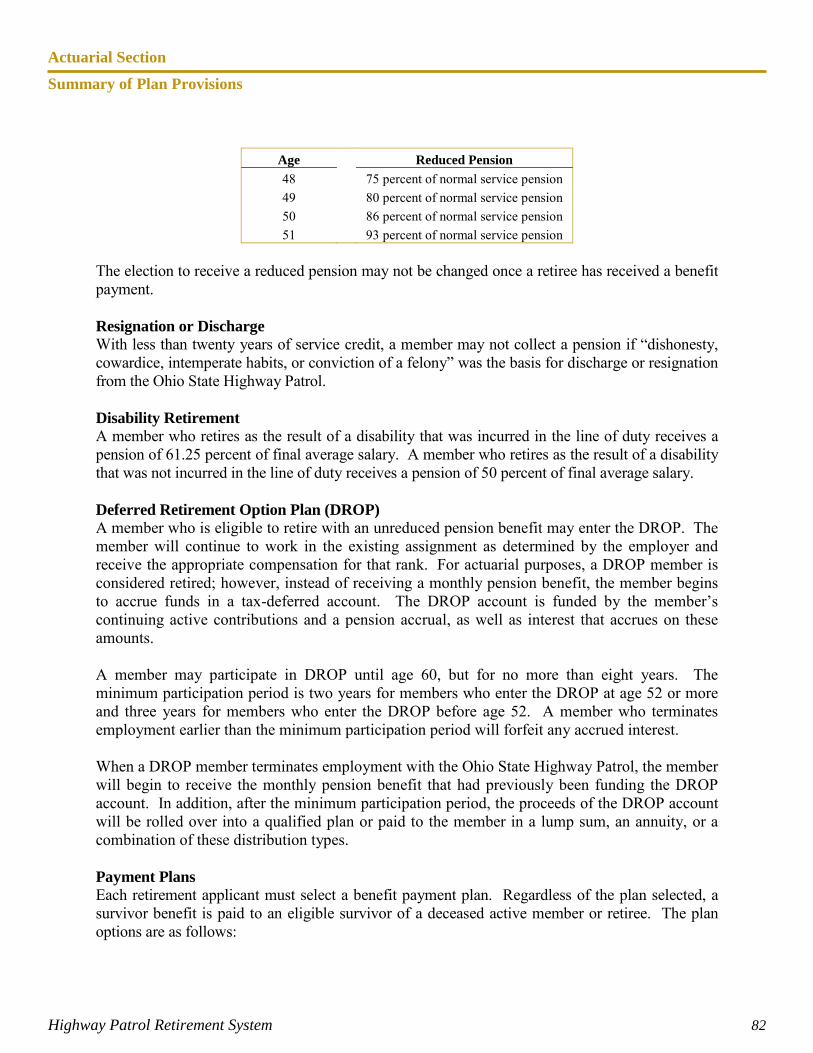
Actuarial Section
Summary of Plan Provisions
Highway Patrol Retirement System 82
Age Reduced Pension 48 75 percent of normal service pension 49 80 percent of normal service pension 50 86 percent of normal service pension 51 93 percent of normal service pension
The election to receive a reduced pension may not be changed once a retiree has received a benefit payment. Resignation or Discharge With less than twenty years of service credit, a member may not collect a pension if “dishonesty, cowardice, intemperate habits, or conviction of a felony” was the basis for discharge or resignation from the Ohio State Highway Patrol. Disability Retirement A member who retires as the result of a disability that was incurred in the line of duty receives a pension of 61.25 percent of final average salary. A member who retires as the result of a disability that was not incurred in the line of duty receives a pension of 50 percent of final average salary. Deferred Retirement Option Plan (DROP) A member who is eligible to retire with an unreduced pension benefit may enter the DROP. The member will continue to work in the existing assignment as determined by the employer and receive the appropriate compensation for that rank. For actuarial purposes, a DROP member is considered retired; however, instead of receiving a monthly pension benefit, the member begins to accrue funds in a tax-deferred account. The DROP account is funded by the member’s continuing active contributions and a pension accrual, as well as interest that accrues on these amounts. A member may participate in DROP until age 60, but for no more than eight years. The minimum participation period is two years for members who enter the DROP at age 52 or more and three years for members who enter the DROP before age 52. A member who terminates employment earlier than the minimum participation period will forfeit any accrued interest. When a DROP member terminates employment with the Ohio State Highway Patrol, the member will begin to receive the monthly pension benefit that had previously been funding the DROP account. In addition, after the minimum participation period, the proceeds of the DROP account will be rolled over into a qualified plan or paid to the member in a lump sum, an annuity, or a combination of these distribution types. Payment Plans Each retirement applicant must select a benefit payment plan. Regardless of the plan selected, a survivor benefit is paid to an eligible survivor of a deceased active member or retiree. The plan options are as follows:
Actuarial Section
Summary of Plan Provisions
Highway Patrol Retirement System 83
Plan 1 - Single Life Annuity This plan pays the highest monthly benefit, calculated as a percentage of final average salary, and is limited to the lifetime of the retiree. A member who receives a disability retirement may only receive a single life annuity. Plan 2 - Joint and Survivor Annuity This plan pays a reduced monthly benefit for a member’s lifetime and provides for a monthly benefit to a surviving beneficiary. Plan 3 - Life Annuity Certain and Continuous This plan is an annuity, payable for a guaranteed minimum period. If a retiree dies before the end of the period, the pension benefit is paid to the designated beneficiary for the remainder of the period. Partial Lump Sum (PLUS) Distribution In addition to selecting one of the three retirement payment plans, a retiree may elect to receive a lump sum cash payment, either as a taxable distribution, or as a rollover to a tax-qualified plan. Following this payment, a retiree will receive a reduced monthly benefit for life. To be eligible for a PLUS distribution, a retiree must have attained age 51 with at least 25 years of total service, or age 52 with at least 20 years of total service. The lump sum amount may not be less than six times the monthly single life pension and not more than sixty times the monthly single life pension. Survivor Benefits A surviving spouse of a deceased retiree, or of an active member who was eligible to receive a retirement pension at the time of death, receives a monthly benefit equal to one-half the deceased member’s monthly pension benefit (minimum, $900). A surviving spouse of an active member who was not eligible for a retirement benefit at the time of death receives a monthly survivor benefit of $900. Each surviving dependent child receives $150 monthly until age 18. If the child is a full-time student, this benefit continues until age 23. Health Care A comprehensive Preferred Provider medical health care plan is currently offered to all benefit recipients and dependents. Benefit recipients may elect to cover spouses and dependent children by authorizing the appropriate premium deduction. Dental and vision coverage is also available to benefit recipients and dependents. The Board, which has the authority to implement changes, annually evaluates the premiums and plan design. Medicare Benefit recipients who submit proof of Medicare Part B coverage are reimbursed for all or part of the basic Part B premium, as determined annually by the Board.
Actuarial Section
Summary of Plan Provisions
Highway Patrol Retirement System 84
Cost of Living The Board has been vested with the responsibility to establish a COLA rate each year between 0.0-3.0%. In August 2013, the Board set a COLA rate of 1.5% effective January 1, 2014. All COLAs granted in 2013 were 3.0%. Benefit recipients are eligible for a COLA increase after age 60 for pension effective dates on or after January 7, 2013. For pension effective dates prior to January 7, 2013, at age 53 and thereafter, each retiree receives an annual COLA equal to 3.0%. Each survivor benefit recipient is eligible for a COLA increase after receiving benefits for twelve months. Each disability benefit recipient is eligible for a COLA increase after receiving benefits for sixty months, or at age 53, whichever occurs first. Death After Retirement Upon the death of a retiree, a lump sum payment of $5,000 is paid to the surviving spouse, or to the retiree’s estate if there is no surviving spouse.

SSttaattiissttiiccaall SSeeccttiioonn
Statistical Section
Introduction
Highway Patrol Retirement System 86
The objectives of the statistical section are to provide financial statement users with additional historical perspective, context, and relevant details that will assist in using information in the financial statements, notes to the financial statements, and required supplementary information in order to better understand and assess HPRS’s overall financial condition. The schedules, beginning on page 87, show financial trend information that will assist users in understanding and assessing how HPRS’s financial condition has changed over the past ten years. The financial trend schedules presented are --
• Changes in Net Position • Benefit Deductions from Net Position by Type
The schedules, beginning on page 88, show demographic and economic information. This information is designed to assist in understanding the environment in which HPRS operates. The demographic and economic information and the operating information presented include --
• Principal Participating Employer • Benefit Recipient by Type of Benefit • Average Benefit Payments • Other Post-Employment Benefit Payments
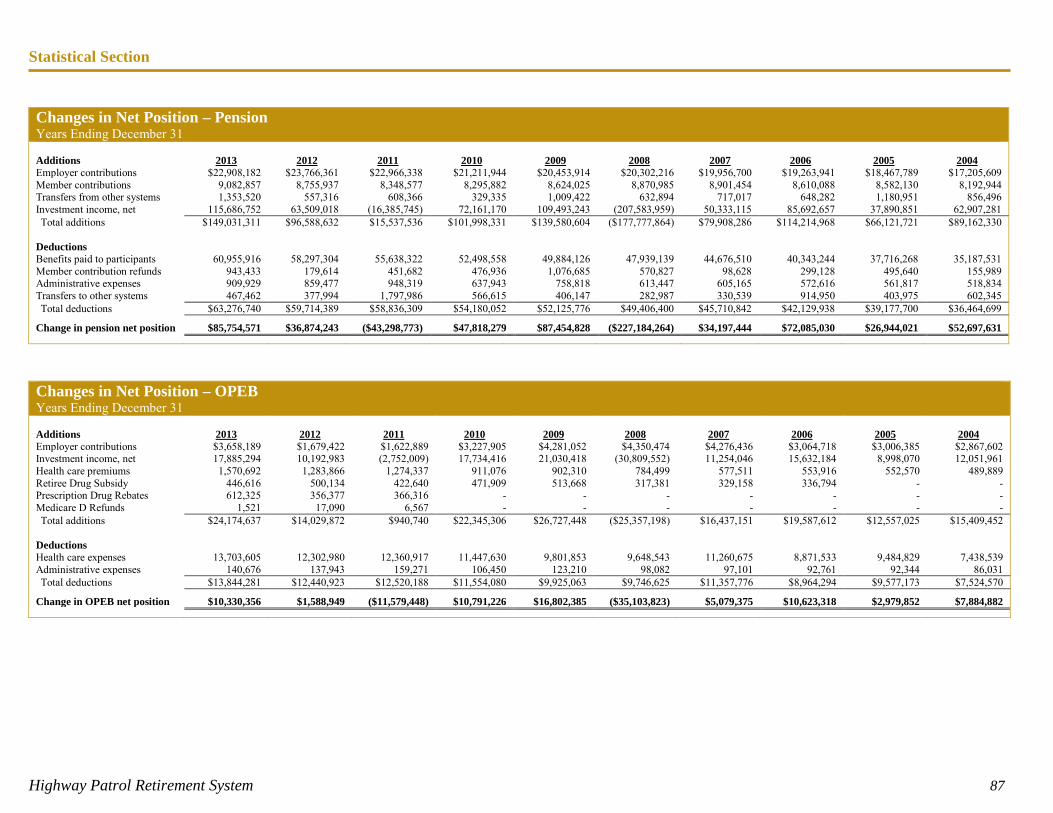
Statistical Section
Highway Patrol Retirement System 87
Changes in Net Position – Pension Years Ending December 31 Additions 2013 2012 2011 2010 2009 2008 2007 2006 2005 2004 Employer contributions $22,908,182 $23,766,361 $22,966,338 $21,211,944 $20,453,914 $20,302,216 $19,956,700 $19,263,941 $18,467,789 $17,205,609 Member contributions 9,082,857 8,755,937 8,348,577 8,295,882 8,624,025 8,870,985 8,901,454 8,610,088 8,582,130 8,192,944 Transfers from other systems 1,353,520 557,316 608,366 329,335 1,009,422 632,894 717,017 648,282 1,180,951 856,496 Investment income, net 115,686,752 63,509,018 (16,385,745) 72,161,170 109,493,243 (207,583,959) 50,333,115 85,692,657 37,890,851 62,907,281 Total additions $149,031,311 $96,588,632 $15,537,536 $101,998,331 $139,580,604 ($177,777,864) $79,908,286 $114,214,968 $66,121,721 $89,162,330
Deductions Benefits paid to participants 60,955,916 58,297,304 55,638,322 52,498,558 49,884,126 47,939,139 44,676,510 40,343,244 37,716,268 35,187,531 Member contribution refunds 943,433 179,614 451,682 476,936 1,076,685 570,827 98,628 299,128 495,640 155,989 Administrative expenses 909,929 859,477 948,319 637,943 758,818 613,447 605,165 572,616 561,817 518,834 Transfers to other systems 467,462 377,994 1,797,986 566,615 406,147 282,987 330,539 914,950 403,975 602,345 Total deductions $63,276,740 $59,714,389 $58,836,309 $54,180,052 $52,125,776 $49,406,400 $45,710,842 $42,129,938 $39,177,700 $36,464,699
Change in pension net position $85,754,571 $36,874,243 ($43,298,773) $47,818,279 $87,454,828 ($227,184,264) $34,197,444 $72,085,030 $26,944,021 $52,697,631
Changes in Net Position – OPEB Years Ending December 31 Additions 2013 2012 2011 2010 2009 2008 2007 2006 2005 2004 Employer contributions $3,658,189 $1,679,422 $1,622,889 $3,227,905 $4,281,052 $4,350,474 $4,276,436 $3,064,718 $3,006,385 $2,867,602 Investment income, net 17,885,294 10,192,983 (2,752,009) 17,734,416 21,030,418 (30,809,552) 11,254,046 15,632,184 8,998,070 12,051,961 Health care premiums 1,570,692 1,283,866 1,274,337 911,076 902,310 784,499 577,511 553,916 552,570 489,889 Retiree Drug Subsidy 446,616 500,134 422,640 471,909 513,668 317,381 329,158 336,794 - - Prescription Drug Rebates 612,325 356,377 366,316 - - - - - - - Medicare D Refunds 1,521 17,090 6,567 - - - - - - - Total additions $24,174,637 $14,029,872 $940,740 $22,345,306 $26,727,448 ($25,357,198) $16,437,151 $19,587,612 $12,557,025 $15,409,452
Deductions Health care expenses 13,703,605 12,302,980 12,360,917 11,447,630 9,801,853 9,648,543 11,260,675 8,871,533 9,484,829 7,438,539 Administrative expenses 140,676 137,943 159,271 106,450 123,210 98,082 97,101 92,761 92,344 86,031 Total deductions $13,844,281 $12,440,923 $12,520,188 $11,554,080 $9,925,063 $9,746,625 $11,357,776 $8,964,294 $9,577,173 $7,524,570
Change in OPEB net position $10,330,356 $1,588,949 ($11,579,448) $10,791,226 $16,802,385 ($35,103,823) $5,079,375 $10,623,318 $2,979,852 $7,884,882
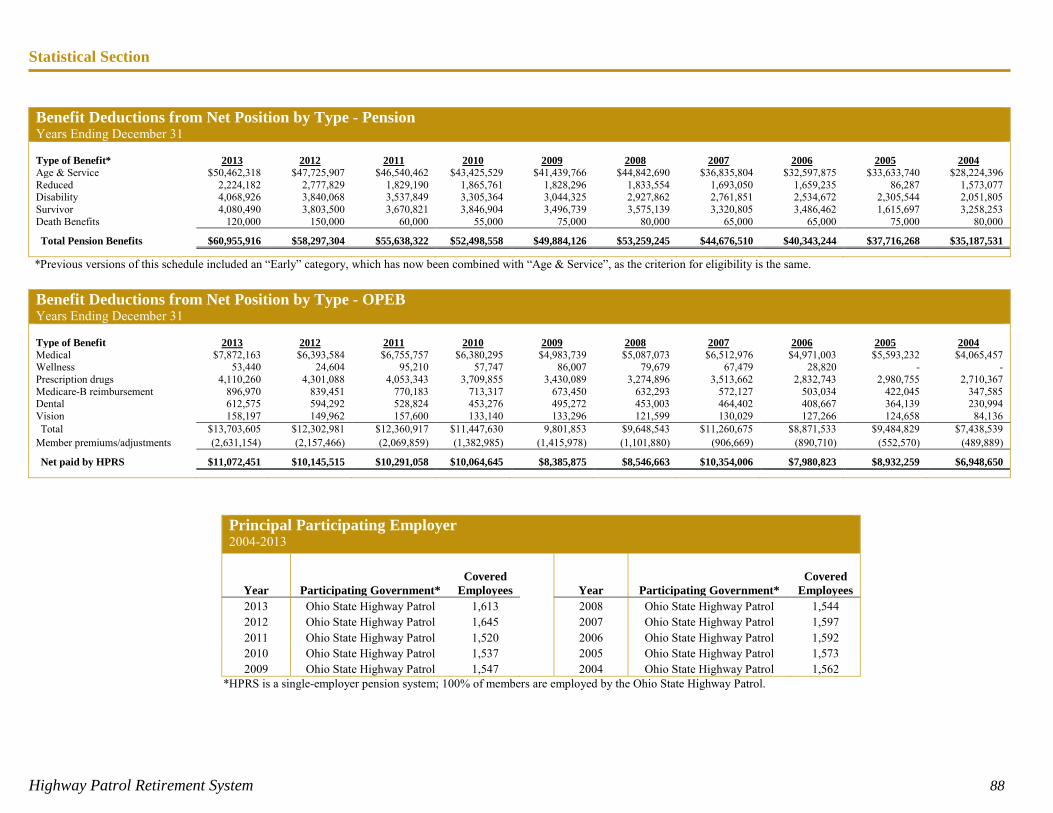
Statistical Section
Highway Patrol Retirement System 88
Benefit Deductions from Net Position by Type - Pension Years Ending December 31 Type of Benefit* 2013 2012 2011 2010 2009 2008 2007 2006 2005 2004 Age & Service $50,462,318 $47,725,907 $46,540,462 $43,425,529 $41,439,766 $44,842,690 $36,835,804 $32,597,875 $33,633,740 $28,224,396 Reduced 2,224,182 2,777,829 1,829,190 1,865,761 1,828,296 1,833,554 1,693,050 1,659,235 86,287 1,573,077 Disability 4,068,926 3,840,068 3,537,849 3,305,364 3,044,325 2,927,862 2,761,851 2,534,672 2,305,544 2,051,805 Survivor 4,080,490 3,803,500 3,670,821 3,846,904 3,496,739 3,575,139 3,320,805 3,486,462 1,615,697 3,258,253 Death Benefits 120,000 150,000 60,000 55,000 75,000 80,000 65,000 65,000 75,000 80,000
Total Pension Benefits $60,955,916 $58,297,304 $55,638,322 $52,498,558 $49,884,126 $53,259,245 $44,676,510 $40,343,244 $37,716,268 $35,187,531
*Previous versions of this schedule included an “Early” category, which has now been combined with “Age & Service”, as the criterion for eligibility is the same.
Benefit Deductions from Net Position by Type - OPEB Years Ending December 31 Type of Benefit 2013 2012 2011 2010 2009 2008 2007 2006 2005 2004 Medical $7,872,163 $6,393,584 $6,755,757 $6,380,295 $4,983,739 $5,087,073 $6,512,976 $4,971,003 $5,593,232 $4,065,457 Wellness 53,440 24,604 95,210 57,747 86,007 79,679 67,479 28,820 - - Prescription drugs 4,110,260 4,301,088 4,053,343 3,709,855 3,430,089 3,274,896 3,513,662 2,832,743 2,980,755 2,710,367 Medicare-B reimbursement 896,970 839,451 770,183 713,317 673,450 632,293 572,127 503,034 422,045 347,585 Dental 612,575 594,292 528,824 453,276 495,272 453,003 464,402 408,667 364,139 230,994 Vision 158,197 149,962 157,600 133,140 133,296 121,599 130,029 127,266 124,658 84,136 Total $13,703,605 $12,302,981 $12,360,917 $11,447,630 9,801,853 $9,648,543 $11,260,675 $8,871,533 $9,484,829 $7,438,539
Member premiums/adjustments (2,631,154) (2,157,466) (2,069,859) (1,382,985) (1,415,978) (1,101,880) (906,669) (890,710) (552,570) (489,889)
Net paid by HPRS $11,072,451 $10,145,515 $10,291,058 $10,064,645 $8,385,875 $8,546,663 $10,354,006 $7,980,823 $8,932,259 $6,948,650
Principal Participating Employer 2004-2013
Year Participating Government* Covered
Employees
Year Participating Government* Covered
Employees 2013 Ohio State Highway Patrol 1,613 2008 Ohio State Highway Patrol 1,544 2012 Ohio State Highway Patrol 1,645 2007 Ohio State Highway Patrol 1,597 2011 Ohio State Highway Patrol 1,520 2006 Ohio State Highway Patrol 1,592 2010 Ohio State Highway Patrol 1,537 2005 Ohio State Highway Patrol 1,573 2009 Ohio State Highway Patrol 1,547 2004 Ohio State Highway Patrol 1,562
*HPRS is a single-employer pension system; 100% of members are employed by the Ohio State Highway Patrol.
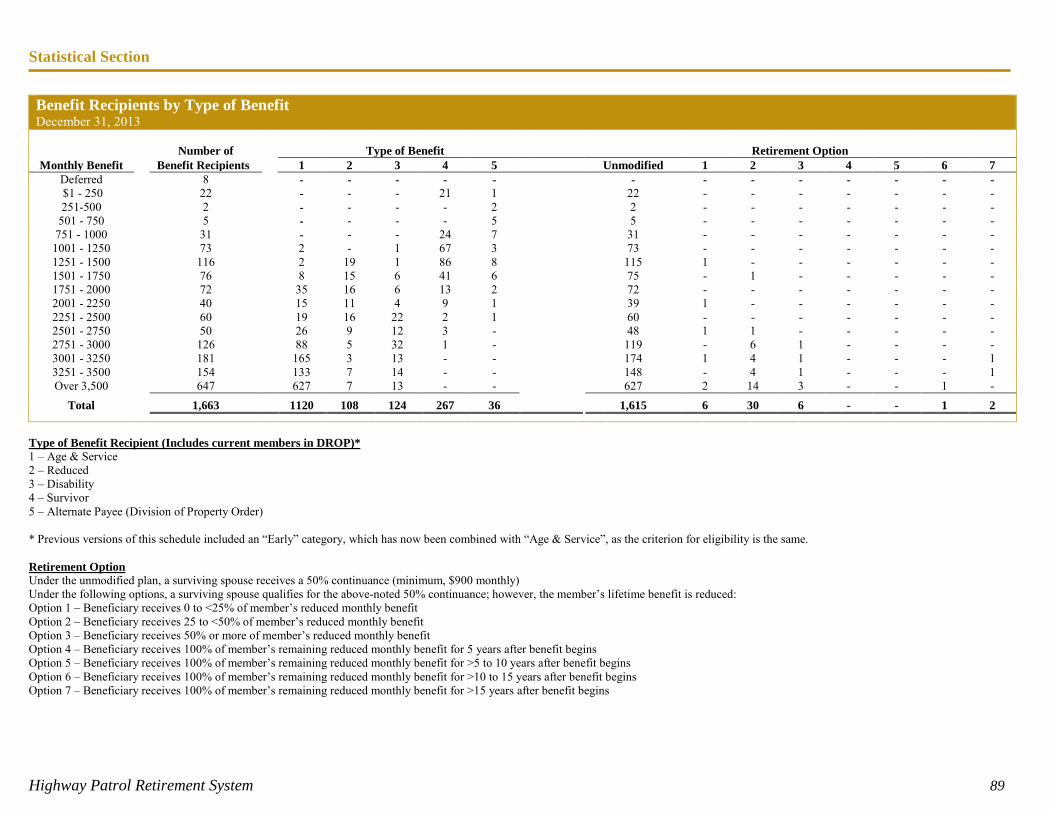
Statistical Section
Highway Patrol Retirement System 89
Benefit Recipients by Type of Benefit December 31, 2013 Number of Type of Benefit Retirement Option Monthly Benefit Benefit Recipients 1 2 3 4 5 Unmodified 1 2 3 4 5 6 7
Deferred 8 - - - - - - - - - - - - - $1 - 250 22 - - - 21 1 22 - - - - - - - 251-500 2 - - - - 2 2 - - - - - - -
501 - 750 5 - - - - 5 5 - - - - - - - 751 - 1000 31 - - - 24 7 31 - - - - - - -
1001 - 1250 73 2 - 1 67 3 73 - - - - - - - 1251 - 1500 116 2 19 1 86 8 115 1 - - - - - - 1501 - 1750 76 8 15 6 41 6 75 - 1 - - - - - 1751 - 2000 72 35 16 6 13 2 72 - - - - - - - 2001 - 2250 40 15 11 4 9 1 39 1 - - - - - - 2251 - 2500 60 19 16 22 2 1 60 - - - - - - - 2501 - 2750 50 26 9 12 3 - 48 1 1 - - - - - 2751 - 3000 126 88 5 32 1 - 119 - 6 1 - - - - 3001 - 3250 181 165 3 13 - - 174 1 4 1 - - - 1 3251 - 3500 154 133 7 14 - - 148 - 4 1 - - - 1 Over 3,500 647 627 7 13 - - 627 2 14 3 - - 1 -
Total 1,663 1120 108 124 267 36 1,615 6 30 6 - - 1 2
Type of Benefit Recipient (Includes current members in DROP)* 1 – Age & Service 2 – Reduced 3 – Disability 4 – Survivor 5 – Alternate Payee (Division of Property Order) * Previous versions of this schedule included an “Early” category, which has now been combined with “Age & Service”, as the criterion for eligibility is the same. Retirement Option Under the unmodified plan, a surviving spouse receives a 50% continuance (minimum, $900 monthly) Under the following options, a surviving spouse qualifies for the above-noted 50% continuance; however, the member’s lifetime benefit is reduced: Option 1 – Beneficiary receives 0 to <25% of member’s reduced monthly benefit Option 2 – Beneficiary receives 25 to <50% of member’s reduced monthly benefit Option 3 – Beneficiary receives 50% or more of member’s reduced monthly benefit Option 4 – Beneficiary receives 100% of member’s remaining reduced monthly benefit for 5 years after benefit begins Option 5 – Beneficiary receives 100% of member’s remaining reduced monthly benefit for >5 to 10 years after benefit begins Option 6 – Beneficiary receives 100% of member’s remaining reduced monthly benefit for >10 to 15 years after benefit begins Option 7 – Beneficiary receives 100% of member’s remaining reduced monthly benefit for >15 years after benefit begins
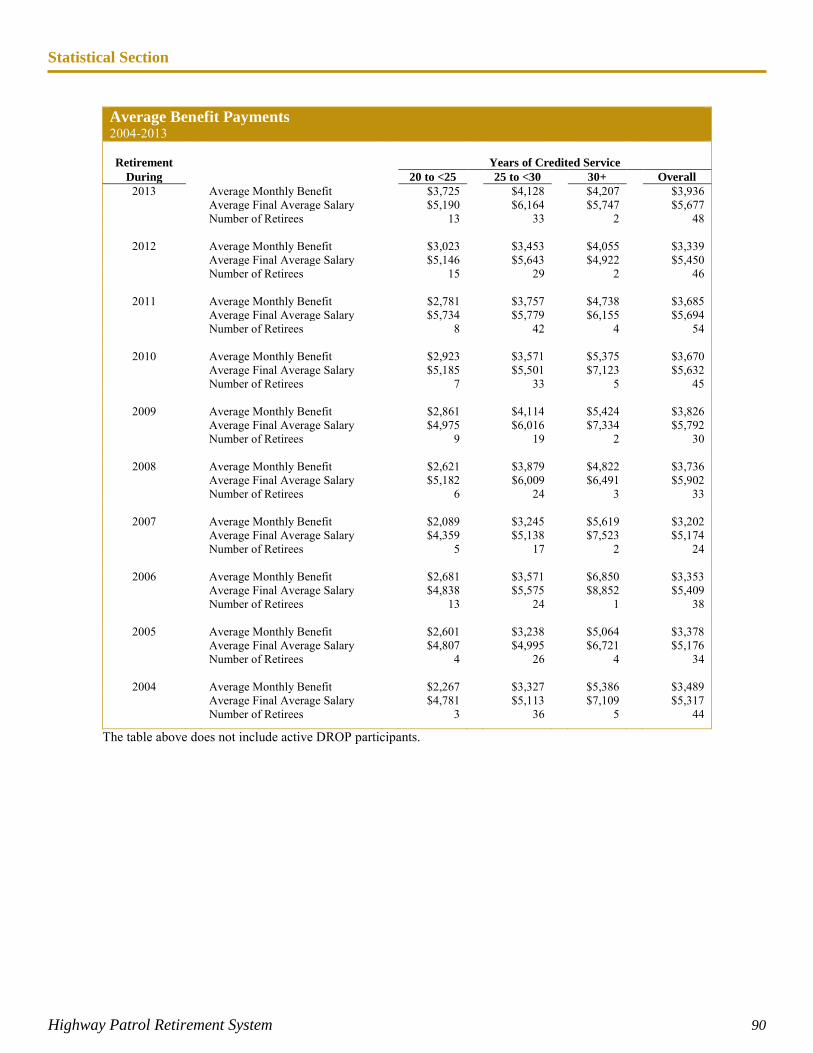
Statistical Section
Highway Patrol Retirement System 90
Average Benefit Payments 2004-2013
Retirement Years of Credited Service
During 20 to <25 25 to <30 30+ Overall 2013 Average Monthly Benefit $3,725 $4,128 $4,207 $3,936
Average Final Average Salary $5,190 $6,164 $5,747 $5,677 Number of Retirees 13 33 2 48
2012 Average Monthly Benefit $3,023 $3,453 $4,055 $3,339 Average Final Average Salary $5,146 $5,643 $4,922 $5,450 Number of Retirees 15 29 2 46
2011 Average Monthly Benefit $2,781 $3,757 $4,738 $3,685 Average Final Average Salary $5,734 $5,779 $6,155 $5,694 Number of Retirees 8 42 4 54
2010 Average Monthly Benefit $2,923 $3,571 $5,375 $3,670 Average Final Average Salary $5,185 $5,501 $7,123 $5,632 Number of Retirees 7 33 5 45
2009 Average Monthly Benefit $2,861 $4,114 $5,424 $3,826 Average Final Average Salary $4,975 $6,016 $7,334 $5,792 Number of Retirees 9 19 2 30
2008 Average Monthly Benefit $2,621 $3,879 $4,822 $3,736 Average Final Average Salary $5,182 $6,009 $6,491 $5,902 Number of Retirees 6 24 3 33
2007 Average Monthly Benefit $2,089 $3,245 $5,619 $3,202 Average Final Average Salary $4,359 $5,138 $7,523 $5,174 Number of Retirees 5 17 2 24
2006 Average Monthly Benefit $2,681 $3,571 $6,850 $3,353 Average Final Average Salary $4,838 $5,575 $8,852 $5,409 Number of Retirees 13 24 1 38
2005 Average Monthly Benefit $2,601 $3,238 $5,064 $3,378 Average Final Average Salary $4,807 $4,995 $6,721 $5,176 Number of Retirees 4 26 4 34
2004 Average Monthly Benefit $2,267 $3,327 $5,386 $3,489 Average Final Average Salary $4,781 $5,113 $7,109 $5,317 Number of Retirees 3 36 5 44
The table above does not include active DROP participants.
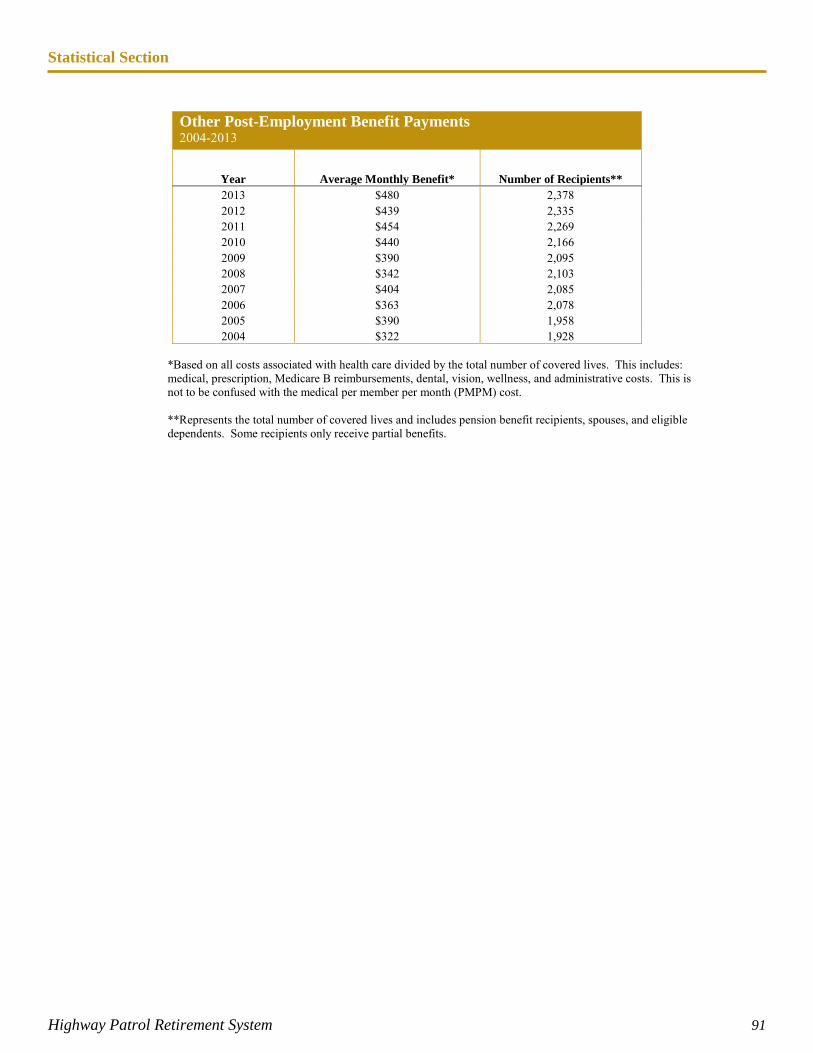
Statistical Section
Highway Patrol Retirement System 91
Other Post-Employment Benefit Payments 2004-2013
Year Average Monthly Benefit* Number of Recipients** 2013 $480 2,378 2012 $439 2,335 2011 $454 2,269 2010 $440 2,166 2009 $390 2,095 2008 $342 2,103 2007 $404 2,085 2006 $363 2,078 2005 $390 1,958 2004 $322 1,928
*Based on all costs associated with health care divided by the total number of covered lives. This includes: medical, prescription, Medicare B reimbursements, dental, vision, wellness, and administrative costs. This is not to be confused with the medical per member per month (PMPM) cost. **Represents the total number of covered lives and includes pension benefit recipients, spouses, and eligible dependents. Some recipients only receive partial benefits.
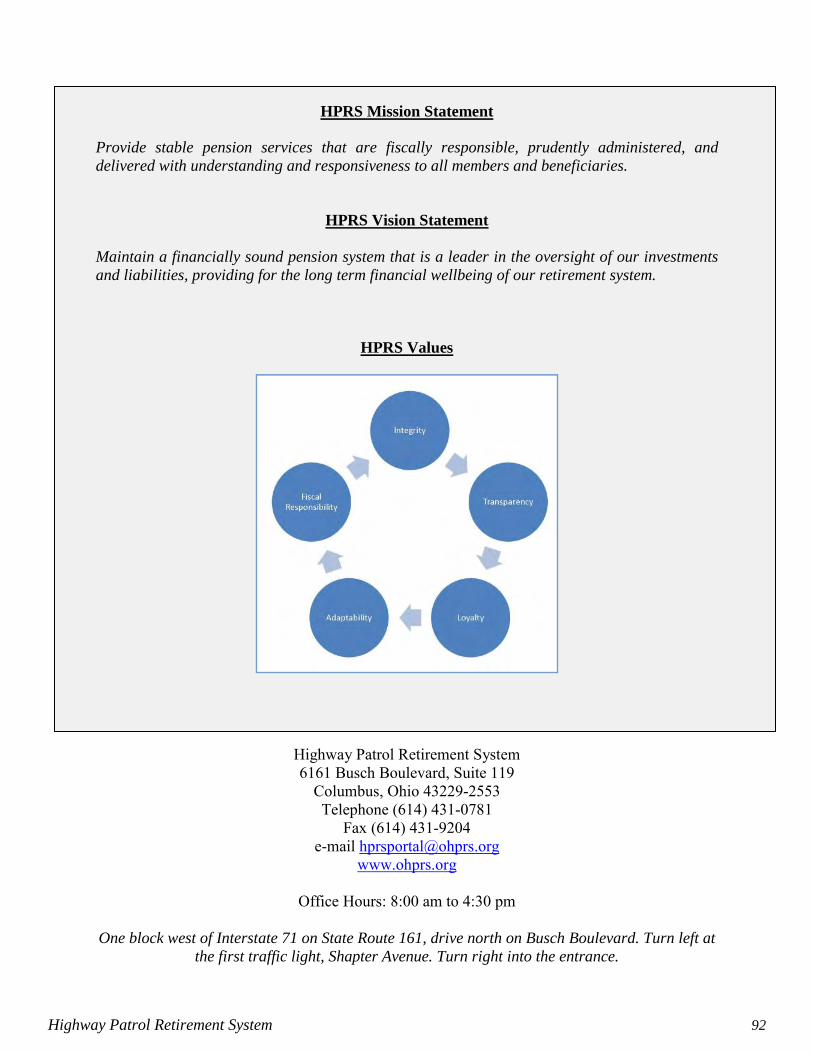
Highway Patrol Retirement System 92
HPRS Mission Statement
Provide stable pension services that are fiscally responsible, prudently administered, and delivered with understanding and responsiveness to all members and beneficiaries.
HPRS Vision Statement
Maintain a financially sound pension system that is a leader in the oversight of our investments and liabilities, providing for the long term financial wellbeing of our retirement system.
HPRS Values
Highway Patrol Retirement System 6161 Busch Boulevard, Suite 119
Columbus, Ohio 43229-2553 Telephone (614) 431-0781
Fax (614) 431-9204 e-mail [email protected]
www.ohprs.org
Office Hours: 8:00 am to 4:30 pm
One block west of Interstate 71 on State Route 161, drive north on Busch Boulevard. Turn left at the first traffic light, Shapter Avenue. Turn right into the entrance.
88EastBroadStreet,FourthFloor,Columbus,Ohio43215‐3506Phone:614‐466‐4514or800‐282‐0370Fax:614‐466‐4490
www.ohioauditor.gov
OHIO STATE HIGHWAY PATROL RETIREMENT SYSTEM
FRANKLIN COUNTY
CLERK’S CERTIFICATION This is a true and correct copy of the report which is required to be filed in the Office of the Auditor of State pursuant to Section 117.26, Revised Code, and which is filed in Columbus, Ohio.
CLERK OF THE BUREAU CERTIFIED JULY 22, 2014


![New York Tribune.(New York, NY) 1880-12-01 [p 4]](https://img.pdfslide.tips/doc/110x75/61fba4aaa9b9a962290377dc/new-york-tribunenew-york-ny-1880-12-01-p-4.jpg)