Embed Size (px)
Citation preview
Ct
LFa
b
c
d
a
ARRA
KSFBP
1
m(dsf
ierl
h1
Medical Engineering & Physics 36 (2014) 1246–1252
Contents lists available at ScienceDirect
Medical Engineering & Physics
jo ur nal home p ag e: www.elsev ier .com/ locate /medengphy
omprehensive evaluation of PCA-based finite element modelling ofhe human femur
orenzo Grassi a, Enrico Schileob,∗, Christelle Boichonc, Marco Vicecontid,ulvia Taddeia
Laboratorio di Tecnologia Medica, Istituto Ortopedico Rizzoli, Bologna, ItalyLaboratorio di Bioingegneria Computazionale, Istituto Ortopedico Rizzoli, Bologna, ItalyAnsys France, Lyon, FranceDepartment of Mechanical Engineering and INSIGNEO Institute, University of Sheffield, Sheffield, UK
r t i c l e i n f o
rticle history:eceived 22 May 2013eceived in revised form 9 June 2014ccepted 28 June 2014
eywords:tatistical shape modellingemurone biomechanicsrincipal component analysis
a b s t r a c t
Computed tomography (CT)-based finite element (FE) reconstructions describe shape and density dis-tribution of bones. Both shape and density distribution, however, can vary a lot between individuals.Shape/density indexation (usually achieved by principal component analysis—PCA) can be used to syn-thesize realistic models, thus overcoming the shortage of CT-based models, and helping e.g. to studyfracture determinants, or steer prostheses design. The aim of this study was to describe a PCA-based sta-tistical modelling algorithm, and test it on a large CT-based population of femora, to see if it can accuratelydescribe and reproduce bone shape, density distribution, and biomechanics.
To this aim, 115 CT-datasets showing normal femoral anatomy were collected and characterized. Iso-topological FE meshes were built. Shape and density indexation procedures were performed on the meshdatabase. The completeness of the database was evaluated through a convergence study. The accuracy inreconstructing bones not belonging to the indexation database was evaluated through (i) leave-one-outtests (ii) comparison of calculated vs. in-vitro measured strains.
Fifty indexation modes for shape and 40 for density were necessary to achieve reconstruction errors
below pixel size for shape, and below 10% for density. Similar errors for density, and slightly higher errorsfor shape were obtained when reconstructing bones not belonging to the database. The in-vitro strainprediction accuracy of the reconstructed FE models was comparable to state-of-the-art studies.In summary, the results indicate that the proposed statistical modelling tools are able to accuratelydescribe a population of femora through finite element models.
. Introduction
Biomechanical properties of bones are often investigated byeans of three-dimensional (3D) reconstruction and finite element
FE) model generation, usually from computed tomography (CT)ata. This is because 3D FE models of bones can reproduce bothhape and material properties, which are acknowledged to be keyactors in determining their biomechanical behaviour.
The variability of shape and densitometry among individualss high, and the possible changes induced by pathologies may
ven enhance it. In order to properly and generally answer manyesearch questions it would be helpful to have available large col-ections of models that can completely describe a whole population∗ Corresponding author. Tel.: +39 051 6366554; fax: +39 051 6366974.E-mail address: [email protected] (E. Schileo).
ttp://dx.doi.org/10.1016/j.medengphy.2014.06.021350-4533/© 2014 IPEM. Published by Elsevier Ltd. All rights reserved.
© 2014 IPEM. Published by Elsevier Ltd. All rights reserved.
(i.e. a group that can be categorized by a unique general determi-nant, be it ethnicity, pathological status, etc.). Conversely, one ofthe most common limitations of FE bone modelling studies [1–4]is the limited size of the bone database investigated, which usuallycannot be stated to be representative of a population, and may failto achieve a good statistical power if used to discriminate betweendifferent conditions [5].
Unfortunately, the availability of large bone databases is oftenscarce, due to different reasons (CT scans cannot be executed onvolunteer subjects, having access to clinical archives is difficultfor privacy reasons, in-vitro cadaver specimens are scarcelyavailable). One alternative is to generate large datasets of bonesusing statistical models. Limiting the view to the femoral bone,
the availability of a database of realistic femora generated fromstatistical models allowed researchers to overcome limitationsdue to the small sample size when investigating bone fracturerisk [6], analyzing the influence of anatomy on biomechanics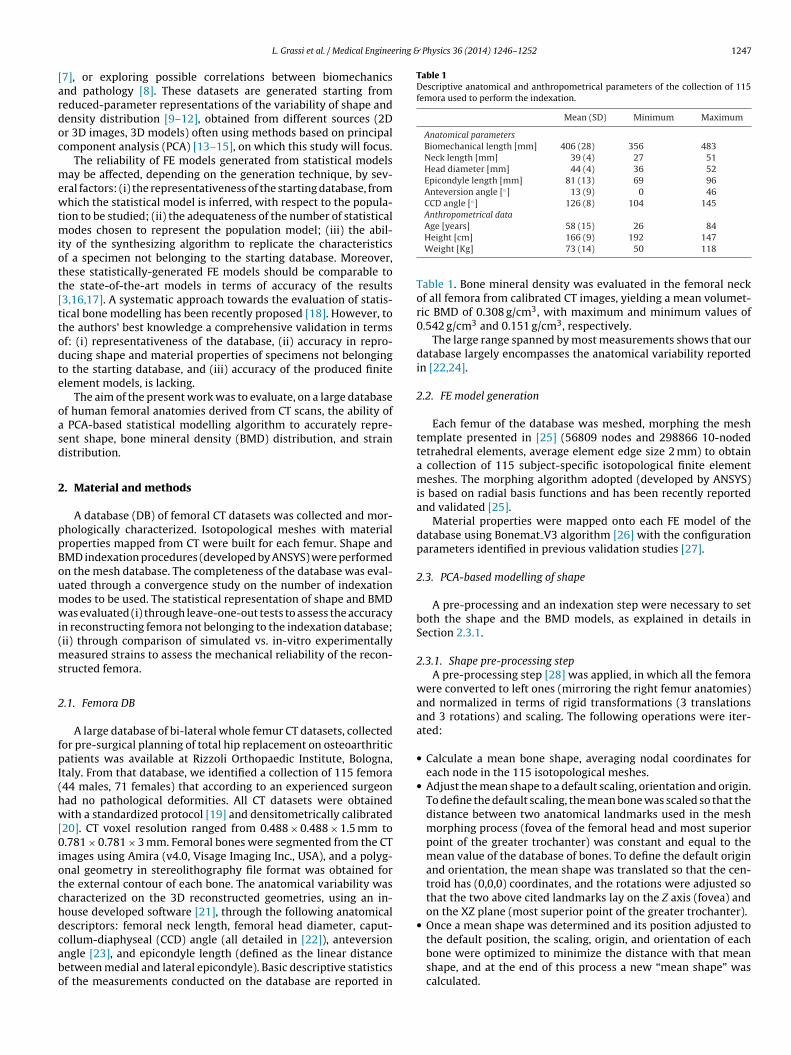
ring & Physics 36 (2014) 1246–1252 1247
[ardoc
mewtmiott[ttodte
oasd
2
ppBoumwi(ms
2
fpI(hw[0iotchdcabo
Table 1Descriptive anatomical and anthropometrical parameters of the collection of 115femora used to perform the indexation.
Mean (SD) Minimum Maximum
Anatomical parametersBiomechanical length [mm] 406 (28) 356 483Neck length [mm] 39 (4) 27 51Head diameter [mm] 44 (4) 36 52Epicondyle length [mm] 81 (13) 69 96Anteversion angle [◦] 13 (9) 0 46CCD angle [◦] 126 (8) 104 145Anthropometrical data
L. Grassi et al. / Medical Enginee
7], or exploring possible correlations between biomechanicsnd pathology [8]. These datasets are generated starting fromeduced-parameter representations of the variability of shape andensity distribution [9–12], obtained from different sources (2Dr 3D images, 3D models) often using methods based on principalomponent analysis (PCA) [13–15], on which this study will focus.
The reliability of FE models generated from statistical modelsay be affected, depending on the generation technique, by sev-
ral factors: (i) the representativeness of the starting database, fromhich the statistical model is inferred, with respect to the popula-
ion to be studied; (ii) the adequateness of the number of statisticalodes chosen to represent the population model; (iii) the abil-
ty of the synthesizing algorithm to replicate the characteristicsf a specimen not belonging to the starting database. Moreover,hese statistically-generated FE models should be comparable tohe state-of-the-art models in terms of accuracy of the results3,16,17]. A systematic approach towards the evaluation of statis-ical bone modelling has been recently proposed [18]. However, tohe authors’ best knowledge a comprehensive validation in termsf: (i) representativeness of the database, (ii) accuracy in repro-ucing shape and material properties of specimens not belongingo the starting database, and (iii) accuracy of the produced finitelement models, is lacking.
The aim of the present work was to evaluate, on a large databasef human femoral anatomies derived from CT scans, the ability of
PCA-based statistical modelling algorithm to accurately repre-ent shape, bone mineral density (BMD) distribution, and strainistribution.
. Material and methods
A database (DB) of femoral CT datasets was collected and mor-hologically characterized. Isotopological meshes with materialroperties mapped from CT were built for each femur. Shape andMD indexation procedures (developed by ANSYS) were performedn the mesh database. The completeness of the database was eval-ated through a convergence study on the number of indexationodes to be used. The statistical representation of shape and BMDas evaluated (i) through leave-one-out tests to assess the accuracy
n reconstructing femora not belonging to the indexation database;ii) through comparison of simulated vs. in-vitro experimentally
easured strains to assess the mechanical reliability of the recon-tructed femora.
.1. Femora DB
A large database of bi-lateral whole femur CT datasets, collectedor pre-surgical planning of total hip replacement on osteoarthriticatients was available at Rizzoli Orthopaedic Institute, Bologna,
taly. From that database, we identified a collection of 115 femora44 males, 71 females) that according to an experienced surgeonad no pathological deformities. All CT datasets were obtainedith a standardized protocol [19] and densitometrically calibrated
20]. CT voxel resolution ranged from 0.488 × 0.488 × 1.5 mm to.781 × 0.781 × 3 mm. Femoral bones were segmented from the CT
mages using Amira (v4.0, Visage Imaging Inc., USA), and a polyg-nal geometry in stereolithography file format was obtained forhe external contour of each bone. The anatomical variability washaracterized on the 3D reconstructed geometries, using an in-ouse developed software [21], through the following anatomicalescriptors: femoral neck length, femoral head diameter, caput-
ollum-diaphyseal (CCD) angle (all detailed in [22]), anteversionngle [23], and epicondyle length (defined as the linear distanceetween medial and lateral epicondyle). Basic descriptive statisticsf the measurements conducted on the database are reported inAge [years] 58 (15) 26 84Height [cm] 166 (9) 192 147Weight [Kg] 73 (14) 50 118
Table 1. Bone mineral density was evaluated in the femoral neckof all femora from calibrated CT images, yielding a mean volumet-ric BMD of 0.308 g/cm3, with maximum and minimum values of0.542 g/cm3 and 0.151 g/cm3, respectively.
The large range spanned by most measurements shows that ourdatabase largely encompasses the anatomical variability reportedin [22,24].
2.2. FE model generation
Each femur of the database was meshed, morphing the meshtemplate presented in [25] (56809 nodes and 298866 10-nodedtetrahedral elements, average element edge size 2 mm) to obtaina collection of 115 subject-specific isotopological finite elementmeshes. The morphing algorithm adopted (developed by ANSYS)is based on radial basis functions and has been recently reportedand validated [25].
Material properties were mapped onto each FE model of thedatabase using Bonemat V3 algorithm [26] with the configurationparameters identified in previous validation studies [27].
2.3. PCA-based modelling of shape
A pre-processing and an indexation step were necessary to setboth the shape and the BMD models, as explained in details inSection 2.3.1.
2.3.1. Shape pre-processing stepA pre-processing step [28] was applied, in which all the femora
were converted to left ones (mirroring the right femur anatomies)and normalized in terms of rigid transformations (3 translationsand 3 rotations) and scaling. The following operations were iter-ated:
• Calculate a mean bone shape, averaging nodal coordinates foreach node in the 115 isotopological meshes.
• Adjust the mean shape to a default scaling, orientation and origin.To define the default scaling, the mean bone was scaled so that thedistance between two anatomical landmarks used in the meshmorphing process (fovea of the femoral head and most superiorpoint of the greater trochanter) was constant and equal to themean value of the database of bones. To define the default originand orientation, the mean shape was translated so that the cen-troid has (0,0,0) coordinates, and the rotations were adjusted sothat the two above cited landmarks lay on the Z axis (fovea) andon the XZ plane (most superior point of the greater trochanter).
• Once a mean shape was determined and its position adjusted to
the default position, the scaling, origin, and orientation of eachbone were optimized to minimize the distance with that meanshape, and at the end of this process a new “mean shape” wascalculated.
1 ring &
int
2
Fnss(lbcf
X
ws
tasat
˛
wmobd
2
tBbi
vetr
dmep
˛
mY
248 L. Grassi et al. / Medical Enginee
The iteration was repeated until convergence of the mean shape,.e. when the vector of the differences of mean shape nodal coordi-ates between iterations j and j−1 had a norm below a thresholdhat was set to 10−8.
.3.2. Shape indexation procedureA matrix “A” was built to include the shape of all isotopological
E meshes (115 columns = number of bones; rows = nodal coordi-ates of each mesh). The nodal coordinates of the mean femur wereubtracted from the matrix “A” and a PCA was applied [29]: it con-ists in determining the singular value decomposition of the matrixor the eigenvalue decomposition of the covariance matrix) and iteads to the determination of shape modes (the eigenvectors). Eachone of the DB could therefore be approximated through a scalingoefficient, 6 rigid body modes (translations and rotations) and theollowing expression:
mean +n∑
i=1
˛iXi
here n is the number of modes considered, Xmean is the meanhape and the Xi vector contains the orthonormal modes.
In order to project a new femur in the indexed space, a mesh iso-opological with the indexed database should be obtained through
mesh morphing procedure. Then the scaling and rigid body modeshould be removed, and finally a standard inner product should bepplied to get the coefficients that minimize the distance betweenhe target anatomy and the projection output.
The coordinates on the mode Xi are determined by:
i = Xi ×(
Xpatient − Xmean
)=
3∗nnodes∑
j=1
Xi [j] ×(
Xpatient − Xmean
)[j]
here × denotes the inner product, where Xi is the vector of the ithode, Xmean is the vector of the mean shape of the initial database
f bones, Xpatient is the vector of the morphed mesh of the patientone after removing the scaling and rigid body modes. (Xj,mean,patientimension = 3* number of nodes).
.4. PCA-based modelling of BMD
The statistical modelling of the BMD distribution was similaro the shape statistical modelling. A matrix “B” which contains theMD value of each element for all the femora in the database wasuilt (115 columns = number of bones; rows = BMD of each element
n a mesh).For each element ID of the isotopological mesh, a mean BMD
alue was calculated over the 115 bones. Then for each element ofach bone in the population the mean BMD value was subtractedo the element BMD value. A PCA process was finally applied to theesulting matrix.
Analogously to the shape projection, the BMD projection proce-ure for a target femur BMD consisted in first obtaining a morphedesh, isotopological with the indexed database and including an
lement-wise BMD definition, and then projecting the vector of theatient BMD distribution in the base of modes (inner product):
The coordinate on the ith BMD mode Yi is ˛i, determined by:
i = Yi ×(
Ypatient − Ymean
)=
nelem∑
j=1
Yi [j] ×(
Ypatient − Ymean
)[j]
where Yi is the vector of the ith mode, Ymean is the vector of theean BMD of the initial database of bones (dimension = nelem),
patient is the vector of the BMD values in the morphed mesh of the
Physics 36 (2014) 1246–1252
patient bone (Yi,mean,patient dimension = number of elements of themorphed mesh).
2.5. Evaluation procedure
2.5.1. Selection of shape and BMD modesFirst, the appropriate number of modes to be used for the statis-
tical representation of shape and BMD modes was set. Therefore,shape and BMD indexation were performed on all the femora ofthe database using an increasing number of modes, until the meanreconstruction error on the whole database was comparable tothe resolution of the CT data (for shape) and below 10% of rela-tive percentage error (for BMD). A relative error metric was chosenfor the BMD because of the wide range usually spanned by thisscalar value within a bone. The relative BMD error was defined asthe ratio between the Euclidean norm of the error vector and thenorm of the real BMD values vector. The effect of the first threeshape modes on the femur geometry was represented by generat-ing femur instances with the minimum and maximum eigenvaluesrecorded among the projection of all database specimens.
2.5.2. Leave one out testsOnce the number of indexation modes to be used for projections
was set, leave-one-out tests were performed on all the specimensto assess the accuracy of shape and BMD projection in reconstruc-ting femora not belonging to the indexation database. Since thedatabase is made of iso-topological FE meshes, a node-to-node dis-tance optimization criterion was adopted for the shape projection.Mean and peak errors with respect to the model generated from CTwith the standard procedure were calculated for each leave-one-out loop.
2.5.3. Strain prediction accuracy.Strain prediction accuracy was checked in eight femoral
anatomies, not belonging to the training database, for which in-vitro experimental strain measurements obtained on the proximalhalf of the femur are available. Details of the experiments are avail-able in [16], and here briefly summarised.
The eight strain-evaluated femurs were four paired couples offresh-frozen femora coming from four male donors. The donorswere older, taller and heavier than the average of the population,but well within the minimum and maximum values observed inthe whole population. In terms of anatomical parameters, they cov-ered quite a large span of the observed population variability, butfor most parameters they were not centred near the mean of thepopulation (detailed data in Supplementary on-line table).
All femora were tested under six reproducible quasi-axial load-ing conditions, mimicking the range of admissible directions for thehip joint reaction force during daily activities. The distal third wasrigidly constrained. The proximal half of each femur was instru-mented with 15 triaxial strain gauges, distributed around eachaspect of the femoral head, neck, proximal metaphysis, and dia-physis, yielding a total of more than 1400 measurements for thewhole sample. Digitisation was available for all femora, and made itpossible to accurately identify in the models the loading points andthe measurement locations. On the same eight femora, a high strainprediction accuracy using a standard subject-specific FE modellingchain was reported [2]. In the following, we will refer to this FEmodelling technique as “standard procedure”.
In the present study, the eight femora were modelled both interms of shape and BMD using the statistical modelling tool. The
element-by-element difference in BMD with respect to the originalmodel was computed for each reconstructed bone to provide amap of BMD changes. In order to evaluate the strain predictionaccuracy of the projected FE models, the FE analyses described in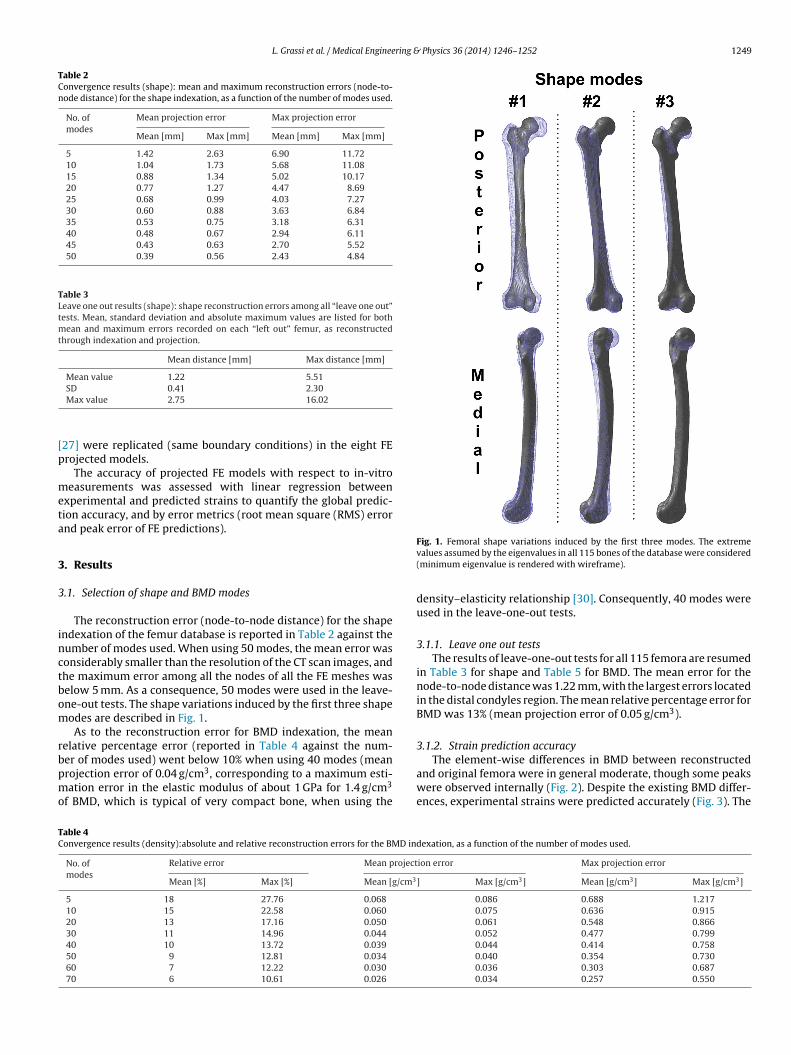
L. Grassi et al. / Medical Engineering & Physics 36 (2014) 1246–1252 1249
Table 2Convergence results (shape): mean and maximum reconstruction errors (node-to-node distance) for the shape indexation, as a function of the number of modes used.
No. ofmodes
Mean projection error Max projection error
Mean [mm] Max [mm] Mean [mm] Max [mm]
5 1.42 2.63 6.90 11.7210 1.04 1.73 5.68 11.0815 0.88 1.34 5.02 10.1720 0.77 1.27 4.47 8.6925 0.68 0.99 4.03 7.2730 0.60 0.88 3.63 6.8435 0.53 0.75 3.18 6.3140 0.48 0.67 2.94 6.1145 0.43 0.63 2.70 5.5250 0.39 0.56 2.43 4.84
Table 3Leave one out results (shape): shape reconstruction errors among all “leave one out”tests. Mean, standard deviation and absolute maximum values are listed for bothmean and maximum errors recorded on each “left out” femur, as reconstructedthrough indexation and projection.
Mean distance [mm] Max distance [mm]
Mean value 1.22 5.51
[p
meta
3
3
inctbom
rbpmo
The element-wise differences in BMD between reconstructed
TC
SD 0.41 2.30Max value 2.75 16.02
27] were replicated (same boundary conditions) in the eight FErojected models.
The accuracy of projected FE models with respect to in-vitroeasurements was assessed with linear regression between
xperimental and predicted strains to quantify the global predic-ion accuracy, and by error metrics (root mean square (RMS) errornd peak error of FE predictions).
. Results
.1. Selection of shape and BMD modes
The reconstruction error (node-to-node distance) for the shapendexation of the femur database is reported in Table 2 against theumber of modes used. When using 50 modes, the mean error wasonsiderably smaller than the resolution of the CT scan images, andhe maximum error among all the nodes of all the FE meshes waselow 5 mm. As a consequence, 50 modes were used in the leave-ne-out tests. The shape variations induced by the first three shapeodes are described in Fig. 1.As to the reconstruction error for BMD indexation, the mean
elative percentage error (reported in Table 4 against the num-er of modes used) went below 10% when using 40 modes (mean
rojection error of 0.04 g/cm3, corresponding to a maximum esti-ation error in the elastic modulus of about 1 GPa for 1.4 g/cm3f BMD, which is typical of very compact bone, when using the
able 4onvergence results (density):absolute and relative reconstruction errors for the BMD in
No. ofmodes
Relative error Mean project
Mean [%] Max [%] Mean [g/cm3
5 18 27.76 0.068
10 15 22.58 0.060
20 13 17.16 0.050
30 11 14.96 0.044
40 10 13.72 0.039
50 9 12.81 0.034
60 7 12.22 0.030
70 6 10.61 0.026
Fig. 1. Femoral shape variations induced by the first three modes. The extremevalues assumed by the eigenvalues in all 115 bones of the database were considered(minimum eigenvalue is rendered with wireframe).
density–elasticity relationship [30]. Consequently, 40 modes wereused in the leave-one-out tests.
3.1.1. Leave one out testsThe results of leave-one-out tests for all 115 femora are resumed
in Table 3 for shape and Table 5 for BMD. The mean error for thenode-to-node distance was 1.22 mm, with the largest errors locatedin the distal condyles region. The mean relative percentage error forBMD was 13% (mean projection error of 0.05 g/cm3).
3.1.2. Strain prediction accuracy
and original femora were in general moderate, though some peakswere observed internally (Fig. 2). Despite the existing BMD differ-ences, experimental strains were predicted accurately (Fig. 3). The
dexation, as a function of the number of modes used.
ion error Max projection error
] Max [g/cm3] Mean [g/cm3] Max [g/cm3]
0.086 0.688 1.2170.075 0.636 0.9150.061 0.548 0.8660.052 0.477 0.7990.044 0.414 0.7580.040 0.354 0.7300.036 0.303 0.6870.034 0.257 0.550
1250 L. Grassi et al. / Medical Engineering &
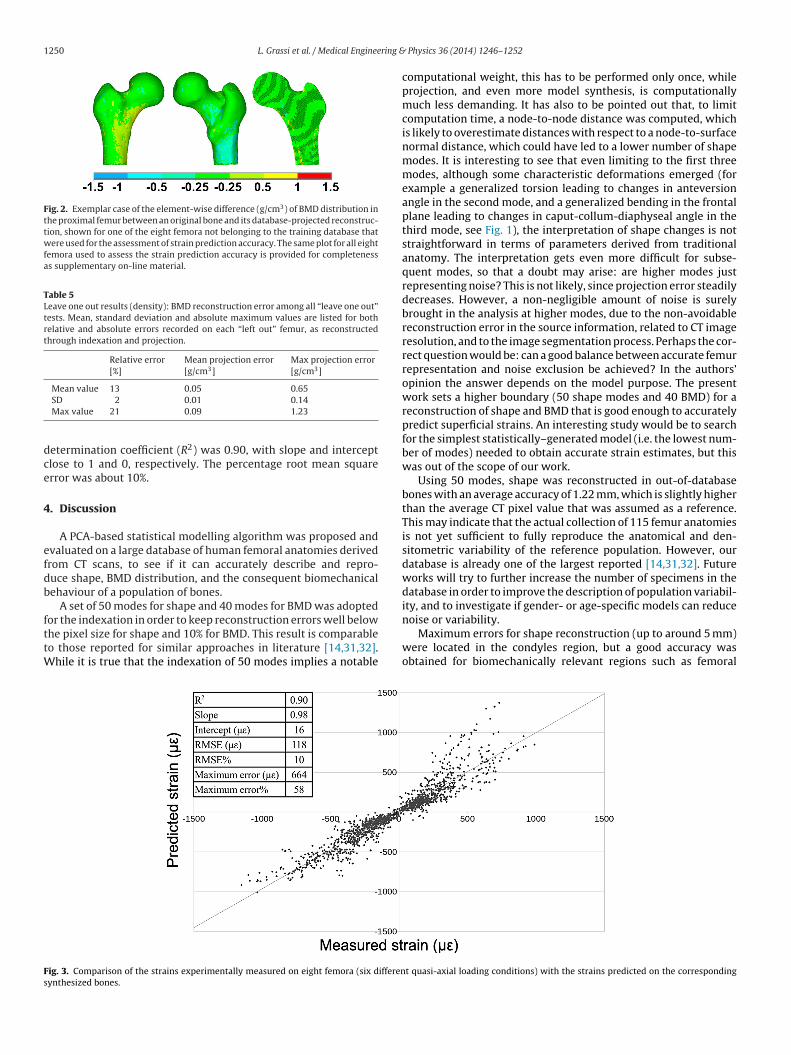
Fig. 2. Exemplar case of the element-wise difference (g/cm3) of BMD distribution inthe proximal femur between an original bone and its database-projected reconstruc-tion, shown for one of the eight femora not belonging to the training database thatwere used for the assessment of strain prediction accuracy. The same plot for all eightfemora used to assess the strain prediction accuracy is provided for completenessas supplementary on-line material.
Table 5Leave one out results (density): BMD reconstruction error among all “leave one out”tests. Mean, standard deviation and absolute maximum values are listed for bothrelative and absolute errors recorded on each “left out” femur, as reconstructedthrough indexation and projection.
Relative error[%]
Mean projection error[g/cm3]
Max projection error[g/cm3]
Mean value 13 0.05 0.65
dce
4
efdb
fttW
Fs
SD 2 0.01 0.14Max value 21 0.09 1.23
etermination coefficient (R2) was 0.90, with slope and interceptlose to 1 and 0, respectively. The percentage root mean squarerror was about 10%.
. Discussion
A PCA-based statistical modelling algorithm was proposed andvaluated on a large database of human femoral anatomies derivedrom CT scans, to see if it can accurately describe and repro-uce shape, BMD distribution, and the consequent biomechanicalehaviour of a population of bones.
A set of 50 modes for shape and 40 modes for BMD was adopted
or the indexation in order to keep reconstruction errors well belowhe pixel size for shape and 10% for BMD. This result is comparableo those reported for similar approaches in literature [14,31,32].hile it is true that the indexation of 50 modes implies a notable
ig. 3. Comparison of the strains experimentally measured on eight femora (six differenynthesized bones.
Physics 36 (2014) 1246–1252
computational weight, this has to be performed only once, whileprojection, and even more model synthesis, is computationallymuch less demanding. It has also to be pointed out that, to limitcomputation time, a node-to-node distance was computed, whichis likely to overestimate distances with respect to a node-to-surfacenormal distance, which could have led to a lower number of shapemodes. It is interesting to see that even limiting to the first threemodes, although some characteristic deformations emerged (forexample a generalized torsion leading to changes in anteversionangle in the second mode, and a generalized bending in the frontalplane leading to changes in caput-collum-diaphyseal angle in thethird mode, see Fig. 1), the interpretation of shape changes is notstraightforward in terms of parameters derived from traditionalanatomy. The interpretation gets even more difficult for subse-quent modes, so that a doubt may arise: are higher modes justrepresenting noise? This is not likely, since projection error steadilydecreases. However, a non-negligible amount of noise is surelybrought in the analysis at higher modes, due to the non-avoidablereconstruction error in the source information, related to CT imageresolution, and to the image segmentation process. Perhaps the cor-rect question would be: can a good balance between accurate femurrepresentation and noise exclusion be achieved? In the authors’opinion the answer depends on the model purpose. The presentwork sets a higher boundary (50 shape modes and 40 BMD) for areconstruction of shape and BMD that is good enough to accuratelypredict superficial strains. An interesting study would be to searchfor the simplest statistically–generated model (i.e. the lowest num-ber of modes) needed to obtain accurate strain estimates, but thiswas out of the scope of our work.
Using 50 modes, shape was reconstructed in out-of-databasebones with an average accuracy of 1.22 mm, which is slightly higherthan the average CT pixel value that was assumed as a reference.This may indicate that the actual collection of 115 femur anatomiesis not yet sufficient to fully reproduce the anatomical and den-sitometric variability of the reference population. However, ourdatabase is already one of the largest reported [14,31,32]. Futureworks will try to further increase the number of specimens in thedatabase in order to improve the description of population variabil-ity, and to investigate if gender- or age-specific models can reduce
noise or variability.Maximum errors for shape reconstruction (up to around 5 mm)were located in the condyles region, but a good accuracy wasobtained for biomechanically relevant regions such as femoral
t quasi-axial loading conditions) with the strains predicted on the corresponding
ring &
ss24acomHfwpm
eoiT0vrm
prvpotkrtfwatcotdclio
raednaLwudiswo
o[pftd
L. Grassi et al. / Medical Enginee
haft and femoral neck (from preliminary elaborations on a sub-et of proximal femora, the maximum error ranged from 1.3 to.8 mm, and the mean error was approximately 0.5 mm). Using0 modes BMD was reconstructed in out-of-database bones withn average error of 0.05 g/cm3, corresponding to less than 10% forompact bone (BMD > 0.6, corresponding to a wet apparent densityf 1 g/cm3 according to [2]), an amount not likely to significantlyodify FE models results when looking at superficial bone strains.owever, looking more in detail to the BMD maps of reconstructed
emora at the proximal femur, we found that while low errorsere diffusely reported on the surface, small peak error areas wereresent internally (Fig. 2), likely due to element distortions in theorphing process.Despite the above reported increase in the shape-reconstruction
rror and the reported peak BMD errors, good performances werebtained when computing the in-vitro strain prediction accuracyn a set of bones not belonging to the training database (Fig. 3).he obtained results were encouraging, showing a correlation of.9 with respect to the experimental measurements, with only aery mild degradation of all indicators with respect to the accuracyesults of the reference procedure [2] and of other state-of-the-artodels [33,34].All the reported findings suggest that in the proximal femur the
roposed statistical modelling technique is robust and well cor-oborated. Therefore, it could be prospectively used to study theariables affecting the proximal femoral fracture, the design of hiprostheses or fixation devices, or to characterize the degenerationf femoral head in hip osteoarthritis. Further studies may be neededo better characterize the distal epiphysis, and therefore addressnee-related designs and pathologies. A preliminary explorationevealed that caution and further studies are needed also to assesshe ability of the indexation tool to produce databases of realisticemur instances from random combinations of eigenvalues. In fact,hen eigenvalues were set for all shape modes to extreme (10th
nd 90th percentile) but also to 1st and 3rd quartile values amonghose extracted from the 115 femora database, unrealistic modifi-ations of the mean anatomy were produced. Similar results werebtained when using the extreme eigenvalues recorded for the firsten modes, so the observed unrealistic deformations should not beue to the use of noise-related modes. The fact that not all linearombinations of modes can bring to realistic bone appearance high-ights the complexity of the highly multidimensional space of bonendexation, and points to the need of finding appropriate metricsr sub-space partitions.
Another aspect that would need to be studied, and whose lackepresents a limitation of the present work, is the coupling of shapend BMD variations. A relationship between the two is likely toxist, but since shape and BMD have different units (distance vs.ensity) normalization coefficients or relative weights would beeeded in the indexation. The choice to address separately shapend BMD was thus taken for simplicity, and to exclude any bias.ooking at the problem from a broader perspective, the extent tohich shape and BMD are coupled is a complex issue. In a pop-lation, small and big femora irrespective of high or osteoporoticensity can coexist, as well as curved and straight ones, etc. In an
ndividual, shape and BMD evolution due to aging and osteoporosiseem to be largely decoupled. Shape and BMD coupling/decouplingarrants further investigation, which was however out of the scope
f the present work.Another limitation is the 3D-to-3D nature of this work, as
pposed to approaches that start from images to build models35,36], or to 2D-to-3D approaches [37,38]. The rationale of the
resent study was to robustly define the pre-requisites neededor (i) characterizing bones (or populations of bones) throughheir shape/BMD indexation/projection properties, and (ii) pro-ucing new bone instances from a shape/BMD indexation space,Physics 36 (2014) 1246–1252 1251
rather than to find a new method to derive models from imag-ing data, or to enrich the information available from 2D imagingsources. Nevertheless, the proposed technique could be in thefuture adapted to attempt a 3D reconstruction based on projectionof two-dimensional data (e.g. 2D representations of the proximalfemur from radiographs).
To the authors’ knowledge this is the first work reporting a com-bined validation of shape and BMD reconstruction accuracy on alarge database of clinical in-vivo CT scans, and an in-vitro validationwith respect to experimental measurements for a sub-sample of thepopulation. Moreover, the database comprised a high variability ofvolumetric bone mineral densities at the femoral neck, encompass-ing normal and osteoporotic subjects, and thus corroborating thegenerality of the proposed technique. Theoretically, the proposedtechnique is not even limited to the femoral bone, and could beapplied to other bones with no changes but the anatomical land-marks to be identified for the mesh morphing.
In summary, the results of the present study indicate that theproposed shape and BMD indexation algorithms are comprehen-sively able to reliably describe a population of femora throughaccurate finite element models.
Declarations
None.
Funding
This work was partially funded through the EU grant VPHOP(FP7-ICT #223865), and from the Italian Program of Donation forResearch “5 per mille”, years 2009 and 2010.
Ethical approval
Not required.
Acknowledgements
The authors would like to thank Mauro Ansaloni for the valuablehelp in the data processing, and especially Ilaria Palmadori for herhelp in the revision of the manuscript.
Appendix A. Supplementary data
Supplementary data associated with this article can be found,in the online version, at http://dx.doi.org/10.1016/j.medengphy.2014.06.021.
Conflict of interest statement
None declared.
References
[1] Keyak JH, Skinner HB, Fleming JA. Effect of force direction on femoral fractureload for two types of loading conditions. J Orthop Res 2001;19:539–44.
[2] Schileo E, Dall’ara E, Taddei F, Malandrino A, Schotkamp T, Baleani M, VicecontiM. An accurate estimation of bone density improves the accuracy of subject-specific finite element models. J Biomech 2008;41:2483–91.
[3] Bessho M, Ohnishi I, Matsumoto T, Ohashi S, Matsuyama J, Tobita K, Kaneko M,Nakamura K. Prediction of proximal femur strength using a CT-based nonlinearfinite element method: differences in predicted fracture load and site withchanging load and boundary conditions. Bone 2009;45:226–31.
[4] Speirs AD, Heller MO, Duda GN, Taylor WR. Physiologically based boundaryconditions in finite element modelling. J Biomech 2007;40:2318–23.
[5] Radcliffe IAJ, Prescott P, Man HS, Taylor M. Determination of suitable sam-ple sizes for multi-patient based finite element studies. Med Eng Phys2007;29:1065–72.
1 ring &
[
[
[
[
[
[
[
[
[
[
[
[
[
[
[
[
[
[
[
[
[
[
[
[
[
[
[
[
tion of the USA).
252 L. Grassi et al. / Medical Enginee
[6] Bryan R, Nair PB, Taylor M. Use of a statistical model of the whole femurin a large scale, multi-model study of femoral neck fracture risk. J Biomech2009;42:2171–6.
[7] Baldwin MA, Langenderfer JE, Rullkoetter PJ, Laz PJ. Development ofsubject-specific and statistical shape models of the knee using an efficientsegmentation and mesh-morphing approach. Comput Methods ProgramsBiomed 2010;97:232–40.
[8] Bredbenner TL, Eliason TD, Potter RS, Mason RL, Havill LM, Nicolella DP.Statistical shape modeling describes variation in tibia and femur surface geom-etry between Control and Incidence groups from the osteoarthritis initiativedatabase. J Biomech 2010;43:1780–6.
[9] Cootes TF, Taylor CJ, Cooper DH, Graham J. Active shape models-their trainingand application. Comput Vision Image Understanding 1995;61:38–59.
10] Davies R, Twining C, Taylor C. Statistical models of shape: optimization andevaluation. London: Springer; 2008. p. 302.
11] Lebailly F, Lima LVPC, Clairemidi A, Aubert B, Guerard S, Chaibi Y, GuiseJde, Fontaine C, Skalli W. Semi-automated stereoradiographic upper limb 3Dreconstructions using a combined parametric and statistical model: a prelimi-nary study. Surg Radiol Anat 2012;34:757–65.
12] Väänänen SP, Isaksson H, Julkunen P, Sirola J, Kröger H, Jurvelin JS. Assess-ment of the 3-D shape and mechanics of the proximal femur using a shapetemplate and a bone mineral density image. Biomech Model Mechanobiol2011;10:529–38.
13] Whitmarsh T, Fritscher KD, Humbert L, Rio Barquero LM Del, Roth T, Kammer-lander C, Blauth M, Schubert R, Frangi AF. A statistical model of shape and bonemineral density distribution of the proximal femur for fracture risk assessment.In: Proceedings of MICCAI. 2011. p. 393–400, 14.
14] Bryan R, Mohan PS, Hopkins A, Galloway F, Taylor M, Nair PB. Statisticalmodelling of the whole human femur incorporating geometric and materialproperties. Med Eng Phys 2010;32:57–65.
15] Kozic N, Weber S, Büchler P, Lutz C, Reimers N, González Ballester MA, ReyesM. Optimisation of orthopaedic implant design using statistical shape spaceanalysis based on level sets. Med Image Anal 2010;14:265–75.
16] Schileo E, Taddei F, Malandrino A, Cristofolini L, Viceconti M. Subject-specificfinite element models can accurately predict strain levels in long bones. JBiomech 2007;40:2982–9.
17] Trabelsi N, Yosibash Z, Wutte C, Augat P, Eberle S. Patient-specific finite ele-ment analysis of the human femur-A double-blinded biomechanical validation.J Biomech 2011;44:1666–72.
18] Bonaretti S. Statistical models of shape and density for population-based analy-sis of bone mechanics with applications to fracture risk assessment and implantdesign. In: PhD thesis. University of Bern; 2011.
19] Lattanzi R, Baruffaldi F, Zannoni C, Viceconti M. Specialised CT scan proto-cols for 3-D pre-operative planning of total hip replacement. Med Eng Phys2004;26:237–45.
20] Kalender WA, Felsenberg D, Genant HK, Fischer M, Dequeker J, Reeve J.The European Spine Phantom—a tool for standardization and quality con-
trol in spinal bone mineral measurements by DXA and QCT. Eur J Radiol1995;20:83–92.21] Viceconti M, Taddei F, Montanari L, Testi D, Leardini A, Clapworthy G, SintJan SVan. Multimod data manager: a tool for data fusion. Comput MethodsPrograms Biomed 2007;87:148–59.
[
Physics 36 (2014) 1246–1252
22] Noble PC, Box GG, Kamaric E, Fink MJ, Alexander JW, Tullos HS. The effect ofaging on the shape of the proximal femur. Clin Orthop Relat Res 1995:31–44.
23] Murphy SB, Simon SR, Kijewski PK, Wilkinson RH, Griscom NT. Femoral ante-version. J Bone Joint Surg Am 1987;69:1169–76.
24] Sugano N, Noble PC, Kamaric E. A comparison of alternative methods of mea-suring femoral anteversion. J Comput Assist Tomogr 1998;22:610–4.
25] Grassi L, Hraiech N, Schileo E, Ansaloni M, Rochette M, Viceconti M. Evalua-tion of the generality and accuracy of a new mesh morphing procedure for thehuman femur. Med Eng Phys 2011;33:112–20.
26] Taddei F, Schileo E, Helgason B, Cristofolini L, Viceconti M. The material map-ping strategy influences the accuracy of CT-based finite element models ofbones: an evaluation against experimental measurements. Med Eng Phys2007;29:973–9.
27] Schileo E, Taddei F, Cristofolini L, Viceconti M. Subject-specific finite elementmodels implementing a maximum principal strain criterion are able to estimatefailure risk and fracture location on human femurs tested in vitro. J Biomech2008;41:356–67.
28] Cootes TF, Taylor CJ, Cooper DH, Graham J. Training models of shape from setsof examples. Training 1992;557:9–18.
29] Boichon C, Rochette M, Schileo E, Grassi L, Taddei F, Viceconti M. Shape index-ing of human femora using morphing and principal component analysis. In:Proceedings of the first VPH congress. 2010. p. 3–5.
30] Morgan E. Trabecular bone modulus–density relationships depend on anatomicsite. J Biomech 2003;36:897–904.
31] Schuler B, Fritscher KD, Kuhn V, Eckstein F, Link TM, Schubert R. Assessment ofthe individual fracture risk of the proximal femur by using statistical appear-ance models. Med Phys 2010;37:2560–71.
32] Belenguer Querol L, Büchler P, Rueckert D, Nolte LP, González Ballester MA.Statistical finite element model for bone shape and biomechanical properties.Med Image Comput Comput Assist Interv 2006;9:405–11.
33] Bessho M, Ohnishi I, Matsuyama J, Matsumoto T, Imai K, Nakamura K. Predic-tion of strength and strain of the proximal femur by a CT-based finite elementmethod. J Biomech 2007;40:1745–53.
34] Trabelsi N, Yosibash Z, Milgrom C. Validation of subject-specific auto-mated p-FE analysis of the proximal femur. J Biomech 2009;42:234–41.
35] Fritscher KD, Grünerbl A, Schubert R. 3D image segmentation using com-bined shape-intensity prior models. Int J Comput Assisted Radiol Surg2007;1:341–50.
36] Schmid J, Magnenat-Thalmann N. MRI bone segmentation using deformablemodels and shape priors. In: International conference on medical image com-puting and computer-assisted intervention. 2008. p. 119–26, 11.
37] Langton CM, Pisharody S, Keyak JH. Generation of a 3D proximal femurshape from a single projection 2D radiographic image. Osteoporos Int2009;20:455–61 (A journal established as result of cooperation between theEuropean Foundation for Osteoporosis and the National Osteoporosis Founda-
38] Väänänen SP, Jurvelin JS, Isaksson H. Estimation of 3D shape, internal den-sity and mechanics of proximal femur by combining bone mineral densityimages with shape and density templates. Biomech Model Mechanobiol2012;11:791–800.