Embed Size (px)
Citation preview
Notes
The Nuts ‘n Bolts of Media Planning Chapter 4. CONCEPTS OF MEDIA PLANNING AND STRATEGY
121
Chapter 4
Concepts of Media Planning and Strategy
Chapter Topics
• Media terminology and concepts
• The macro and micro media decision
• The Media Square
• Coverage and Reach
• Reach Build or Cumulative Reach
• Effective Reach
• Frequency
• Duplication
• Cost-efficiency
• Gross Rating Points
• Exercises
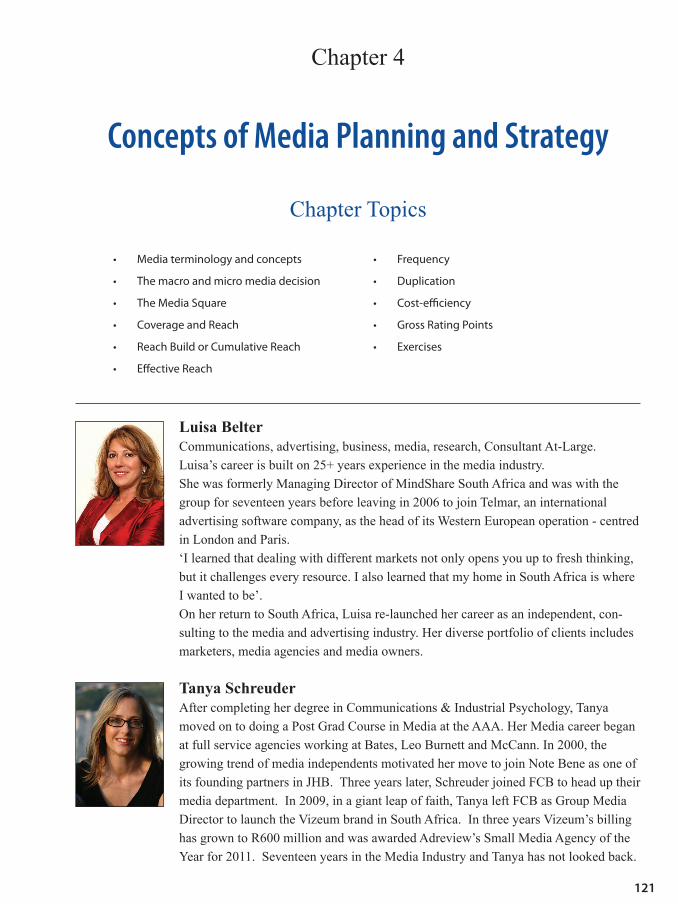
Luisa BelterCommunications, advertising, business, media, research, Consultant At-Large.Luisa’s career is built on 25+ years experience in the media industry.She was formerly Managing Director of MindShare South Africa and was with the group for seventeen years before leaving in 2006 to join Telmar, an international advertising software company, as the head of its Western European operation - centred in London and Paris. ‘I learned that dealing with different markets not only opens you up to fresh thinking, but it challenges every resource. I also learned that my home in South Africa is where I wanted to be’. On her return to South Africa, Luisa re-launched her career as an independent, con-sulting to the media and advertising industry. Her diverse portfolio of clients includes marketers, media agencies and media owners.
Tanya SchreuderAfter completing her degree in Communications & Industrial Psychology, Tanya moved on to doing a Post Grad Course in Media at the AAA. Her Media career began at full service agencies working at Bates, Leo Burnett and McCann. In 2000, the growing trend of media independents motivated her move to join Note Bene as one of its founding partners in JHB. Three years later, Schreuder joined FCB to head up their media department. In 2009, in a giant leap of faith, Tanya left FCB as Group Media Director to launch the Vizeum brand in South Africa. In three years Vizeum’s billing has grown to R600 million and was awarded Adreview’s Small Media Agency of the Year for 2011. Seventeen years in the Media Industry and Tanya has not looked back.
NotesNotes
Chapter 4. CONCEPTS OF MEDIA PLANNING AND STRATEGY The Nuts ‘n Bolts of Media Planning The Nuts ‘n Bolts of Media Planning Chapter 4. CONCEPTS OF MEDIA PLANNING AND STRATEGY
122 123
Having read this chapter you should know how to:
1. Distinguish between a macro and micro media decision, and how to begin your approach.
2. Make a distinction between the four key factors in the media square that will drive your thought process.
3. Be able to differentiate between cover and reach.
4. Understand how reach builds and how to calculate reach and frequency.
5. Understand the meaning of effective reach, what considerations to take into account and how to apply it to a plan.
6. Distinguish between average frequency, frequency distribution, effective frequency; what these mean to a plan and why they are relevant to the planning process.
7. The concept of duplication and its importance in building a plan at the micro level.
8. The inter-relationships between all these concepts and why they dynamically inform your daily decisions.
9. Calculatingcost-efficiencyofaudiencedeliveryforamediacampaign.
10. Understanding ratings and their relationship to reach and frequency.
11. Calculating GRPs generated by a schedule.
12.ApplyingGRPsasameansofcomparisonincost-efficiencycalculations.
13.UnderstandwhatanIndexisanditsroleinrefiningyourmediaselection.
Media Terminology and Concepts
The media planner and strategist need to understand the mechanics of media terminology, concepts and their applications, in the context of reality. When applying the concepts, test them against what you know to be true in human behaviour. This is when concepts really come alive and begin to make sense in the development of a media strategy.
The aim of any communication is to be meaningful, relevant, understood, remembered, and to ultimately illicit a response from the target audience.
The macro and micro media decision
These are also referred to as the Inter-media decision or the Intra-media de-cision. The macro (Inter) media decision refers to the over-arching selection of media channels in preference to one another. For example: Television versus radio or magazines versus newspapers or an event versus socialmediachannels,oranyconfigurationofthesestatedcommunicationmedia channels or more.The planner must follow a technical and creative process when selecting the correct media channels and eliminating those not suitable to the business, marketing, communication and media objectives task.
The rule of thumb is that the media channel’s implicit characteristics must be compatible with the nature of the communication task and advertising theme. For example:
A funky, fun, young and trendy technology brand would look out of place in a serious, technical educational magazine. On the other hand, the planner may want the ad to stand out, targeting a highly sophisticated, small, propeller-head type audience - or have a terrificallywarpedsenseofhumour!
In practice, this often means that a media channel may be eliminated from the selection even if, from a creative point of view, it has the innate ability andcharacteristicstoconveytheadvertisingmessage.Atfirstglancetelevi-sion may deliver against all the metrics, but if you don’t have the budget to produceandflighttheTVCthenthechannelisnotviable.Thisisnottosaythatlessexpensivesolutionscan’tbefound.Intoday’smoreflexiblemediaenvironmenttherearemanycostefficienttelevisionsolutionswhichcanbeapplied-fromtheangleofbothproductionandon-airflighting.Sponsor-ships, stings, squeeze-backs, product placement, packaged production and airtime,infomercialsandsoforthcanfulfillamultitudeofcommunicationtaskswithoutbreakingthebank-orhavingtosellakidney!
Additionally, many of the smaller digital channels provide exciting and bespokesolutionstailor-madetoyourspecificrequirements.
How to begin making the macro media decision
First examine the business, marketing, communication and creative task, which should be supplied to you in the client brief. If creative executions exist, have a look at those too before you begin the process. If you are one of those unfortunate individuals not to have received a brief, the table
Macro and micro media decision
Keywords
NotesNotes
Chapter 4. CONCEPTS OF MEDIA PLANNING AND STRATEGY The Nuts ‘n Bolts of Media Planning The Nuts ‘n Bolts of Media Planning Chapter 4. CONCEPTS OF MEDIA PLANNING AND STRATEGY
124 125
illustrated below may give you some idea of the communication tasks and behaviours automatically inherent in the characteristics of a media channel.
Use the above table to inform the macro media decision making process. Remember that you will still need to examine all the available research studies and metrics relevant to your target market, in order to complete the process and get the full picture.
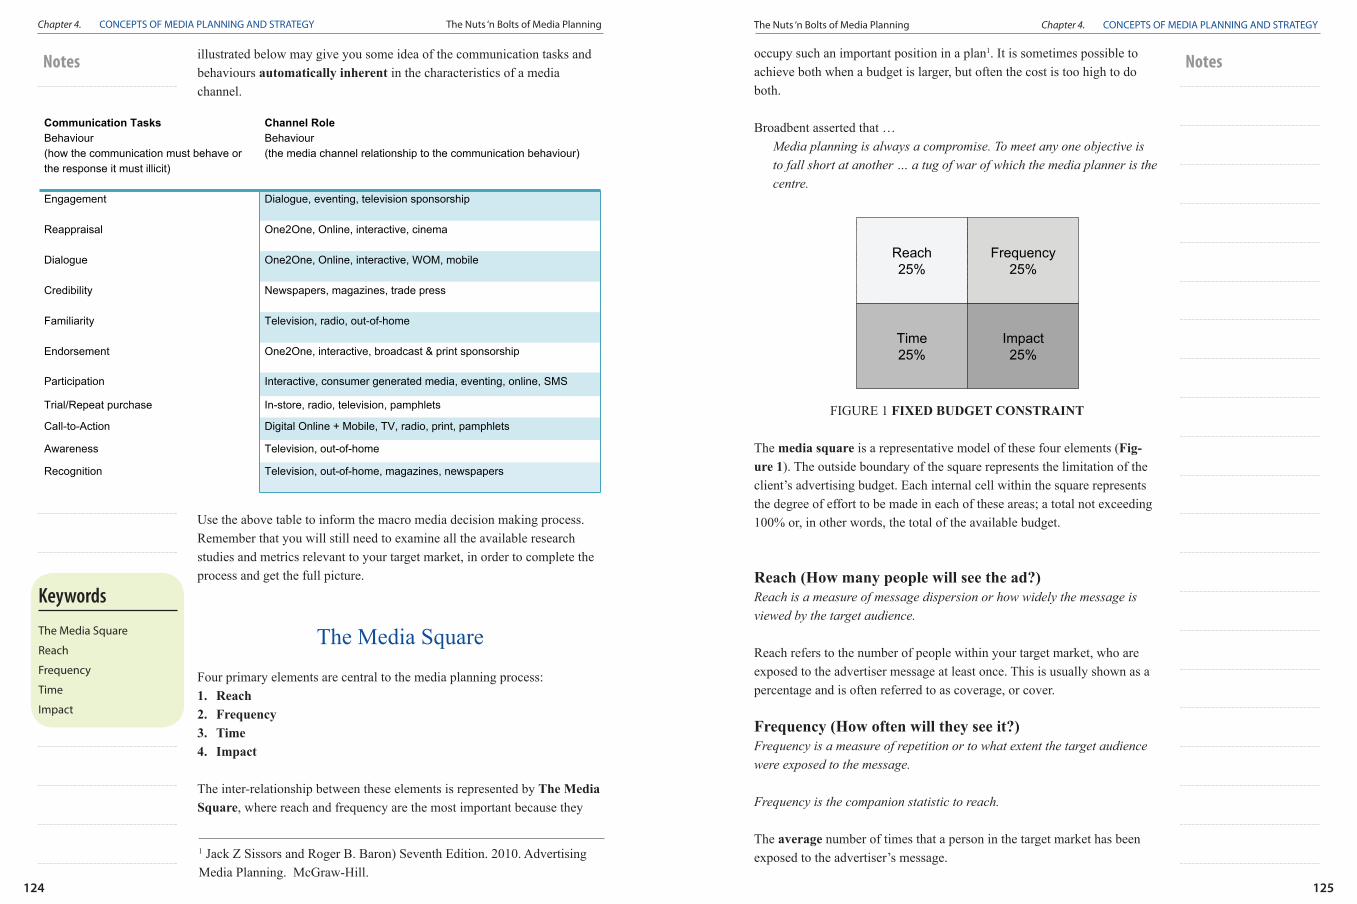
The Media Square
Four primary elements are central to the media planning process:1. Reach2. Frequency3. Time4. Impact
The inter-relationship between these elements is represented by The Media Square, where reach and frequency are the most important because they
Communication Tasks Behaviour (how the communication must behave or the response it must illicit)
Channel RoleBehaviour (the media channel relationship to the communication behaviour)
Engagement Dialogue, eventing, television sponsorship
Reappraisal One2One, Online, interactive, cinema
Dialogue One2One, Online, interactive, WOM, mobile
Credibility Newspapers, magazines, trade press
Familiarity Television, radio, out-of-home
Endorsement One2One, interactive, broadcast & print sponsorship
Participation Interactive, consumer generated media, eventing, online, SMS
Trial/Repeat purchase In-store, radio, television, pamphlets
Call-to-Action Digital Online + Mobile, TV, radio, print, pamphlets
Awareness Television, out-of-home
Recognition Television, out-of-home, magazines, newspapers
occupy such an important position in a plan1. It is sometimes possible to achieve both when a budget is larger, but often the cost is too high to do both.
Broadbent asserted that … Media planning is always a compromise. To meet any one objective is
to fall short at another … a tug of war of which the media planner is the centre.
FIGURE 1 FIXED BUDGET CONSTRAINT
The media square is a representative model of these four elements (Fig-ure 1). The outside boundary of the square represents the limitation of the client’s advertising budget. Each internal cell within the square represents the degree of effort to be made in each of these areas; a total not exceeding 100% or, in other words, the total of the available budget.
Reach (How many people will see the ad?)Reach is a measure of message dispersion or how widely the message is viewed by the target audience.
Reach refers to the number of people within your target market, who are exposed to the advertiser message at least once. This is usually shown as a percentage and is often referred to as coverage, or cover.
Frequency (How often will they see it?)Frequency is a measure of repetition or to what extent the target audience were exposed to the message.
Frequency is the companion statistic to reach.
The average number of times that a person in the target market has been exposed to the advertiser’s message.1 Jack Z Sissors and Roger B. Baron) Seventh Edition. 2010. Advertising
Media Planning. McGraw-Hill.
The Media Square
Reach25%
Reach25%
Time25%
Impact25%
Frequency25%
Fixed budget constraint
The Media Square
Reach
Frequency
Time
Impact
Keywords
NotesNotes
Chapter 4. CONCEPTS OF MEDIA PLANNING AND STRATEGY The Nuts ‘n Bolts of Media Planning The Nuts ‘n Bolts of Media Planning Chapter 4. CONCEPTS OF MEDIA PLANNING AND STRATEGY
126 127
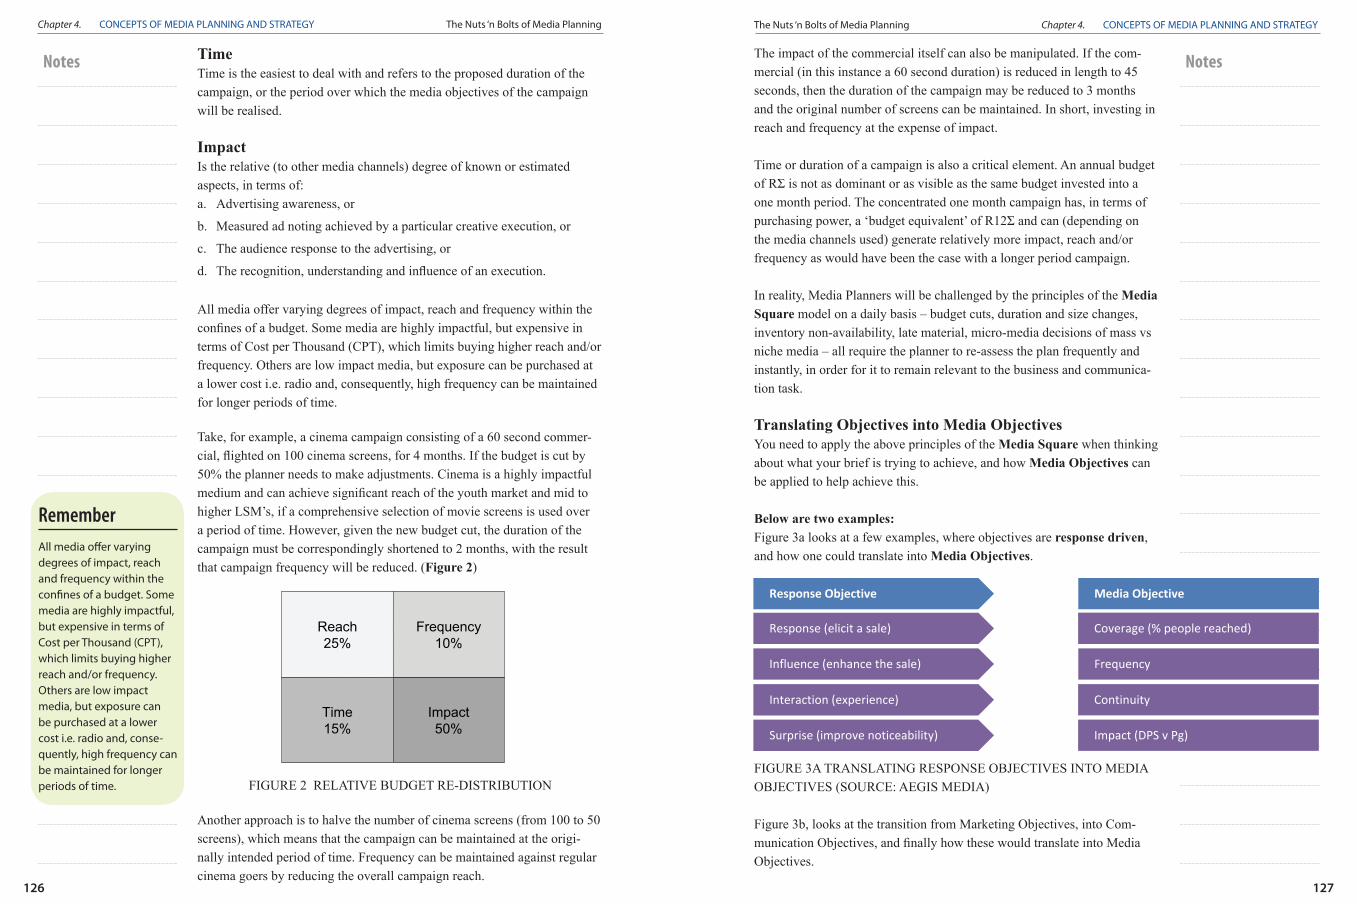
TimeTime is the easiest to deal with and refers to the proposed duration of the campaign, or the period over which the media objectives of the campaign will be realised.
Impact Is the relative (to other media channels) degree of known or estimated aspects, in terms of: a. Advertising awareness, or
b. Measured ad noting achieved by a particular creative execution, or
c. The audience response to the advertising, or
d. Therecognition,understandingandinfluenceofanexecution.
All media offer varying degrees of impact, reach and frequency within the confinesofabudget.Somemediaarehighlyimpactful,butexpensiveinterms of Cost per Thousand (CPT), which limits buying higher reach and/or frequency. Others are low impact media, but exposure can be purchased at a lower cost i.e. radio and, consequently, high frequency can be maintained for longer periods of time.
Take, for example, a cinema campaign consisting of a 60 second commer-cial,flightedon100cinemascreens,for4months.Ifthebudgetiscutby50% the planner needs to make adjustments. Cinema is a highly impactful mediumandcanachievesignificantreachoftheyouthmarketandmidtohigher LSM’s, if a comprehensive selection of movie screens is used over a period of time. However, given the new budget cut, the duration of the campaign must be correspondingly shortened to 2 months, with the result that campaign frequency will be reduced. (Figure 2)
FIGURE 2 RELATIVE BUDGET RE-DISTRIBUTION
Another approach is to halve the number of cinema screens (from 100 to 50 screens), which means that the campaign can be maintained at the origi-nally intended period of time. Frequency can be maintained against regular cinema goers by reducing the overall campaign reach.
The Media SquareCinema example
Reach25%
Reach25%
Time15%
Impact50%
Frequency10%
Relative budget re-distribution
The impact of the commercial itself can also be manipulated. If the com-mercial (in this instance a 60 second duration) is reduced in length to 45 seconds, then the duration of the campaign may be reduced to 3 months and the original number of screens can be maintained. In short, investing in reach and frequency at the expense of impact.
Time or duration of a campaign is also a critical element. An annual budget ofRΣisnotasdominantorasvisibleasthesamebudgetinvestedintoaone month period. The concentrated one month campaign has, in terms of purchasingpower,a‘budgetequivalent’ofR12Σandcan(dependingonthe media channels used) generate relatively more impact, reach and/or frequency as would have been the case with a longer period campaign.
In reality, Media Planners will be challenged by the principles of the Media Square model on a daily basis – budget cuts, duration and size changes, inventory non-availability, late material, micro-media decisions of mass vs niche media – all require the planner to re-assess the plan frequently and instantly, in order for it to remain relevant to the business and communica-tion task.
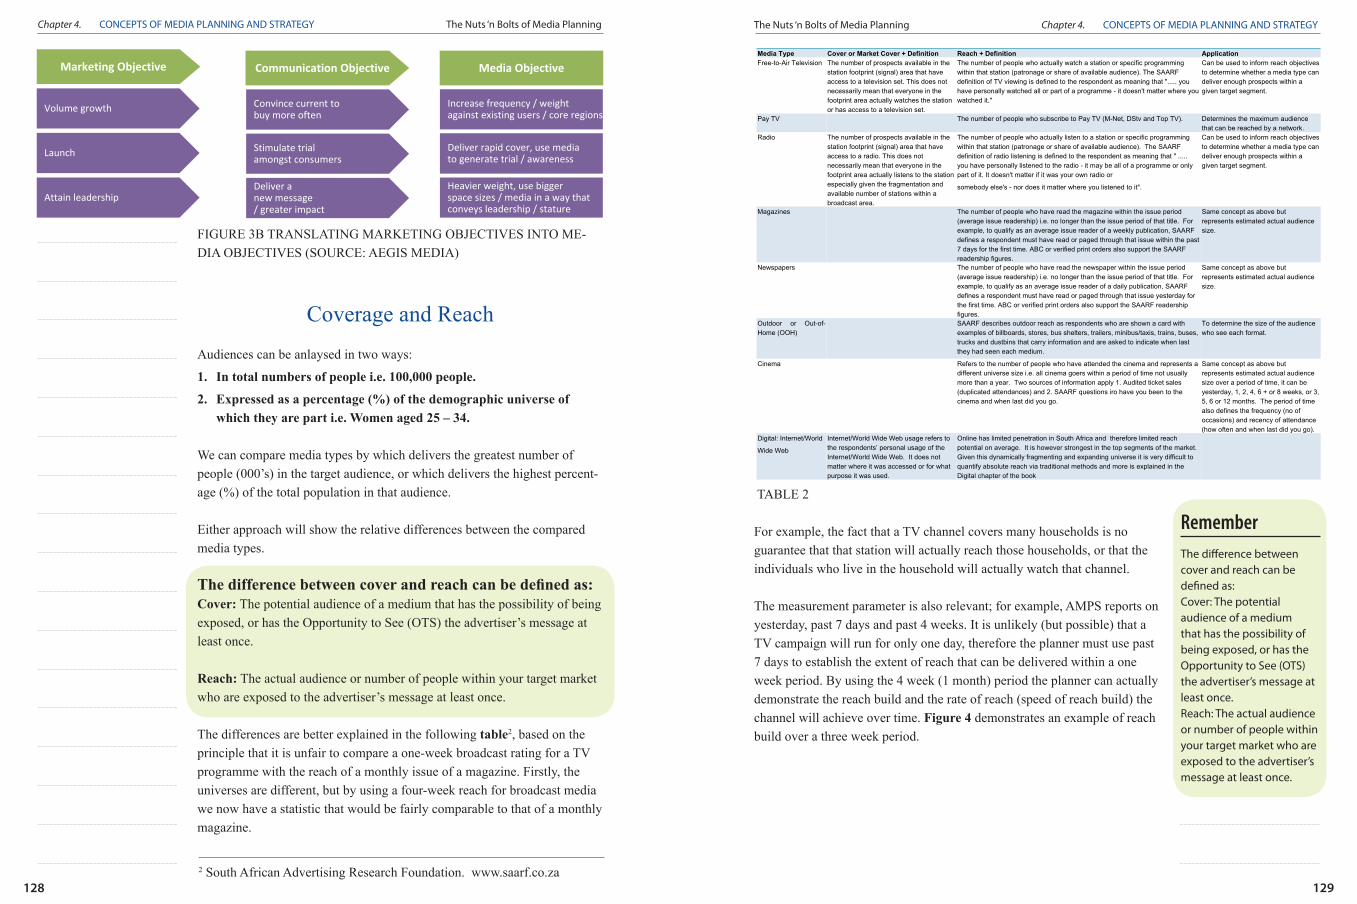
Translating Objectives into Media ObjectivesYou need to apply the above principles of the Media Square when thinking about what your brief is trying to achieve, and how Media Objectives can be applied to help achieve this.
Below are two examples:Figure 3a looks at a few examples, where objectives are response driven, and how one could translate into Media Objectives.
FIGURE 3A TRANSLATING RESPONSE OBJECTIVES INTO MEDIA OBJECTIVES (SOURCE: AEGIS MEDIA)
Figure 3b, looks at the transition from Marketing Objectives, into Com-municationObjectives,andfinallyhowthesewouldtranslateintoMediaObjectives.
Response Objective
Response (elicit a sale)
Influence (enhance the sale)
Interaction (experience)
Surprise (improve noticeability)
Media Objective
Coverage (% people reached)
Frequency
Continuity
Impact (DPS v Pg)
Translating objectives into media objectives
Think about what you are trying to achieve and how media objectives can help to achieve thisAll media offer varying degrees of impact, reach and frequency within the confines of a budget. Some media are highly impactful, but expensive in terms of Cost per Thousand (CPT), which limits buying higher reach and/or frequency. Others are low impact media, but exposure can be purchased at a lower cost i.e. radio and, conse-quently, high frequency can be maintained for longer periods of time.
Remember
NotesNotes
Chapter 4. CONCEPTS OF MEDIA PLANNING AND STRATEGY The Nuts ‘n Bolts of Media Planning The Nuts ‘n Bolts of Media Planning Chapter 4. CONCEPTS OF MEDIA PLANNING AND STRATEGY
128 129
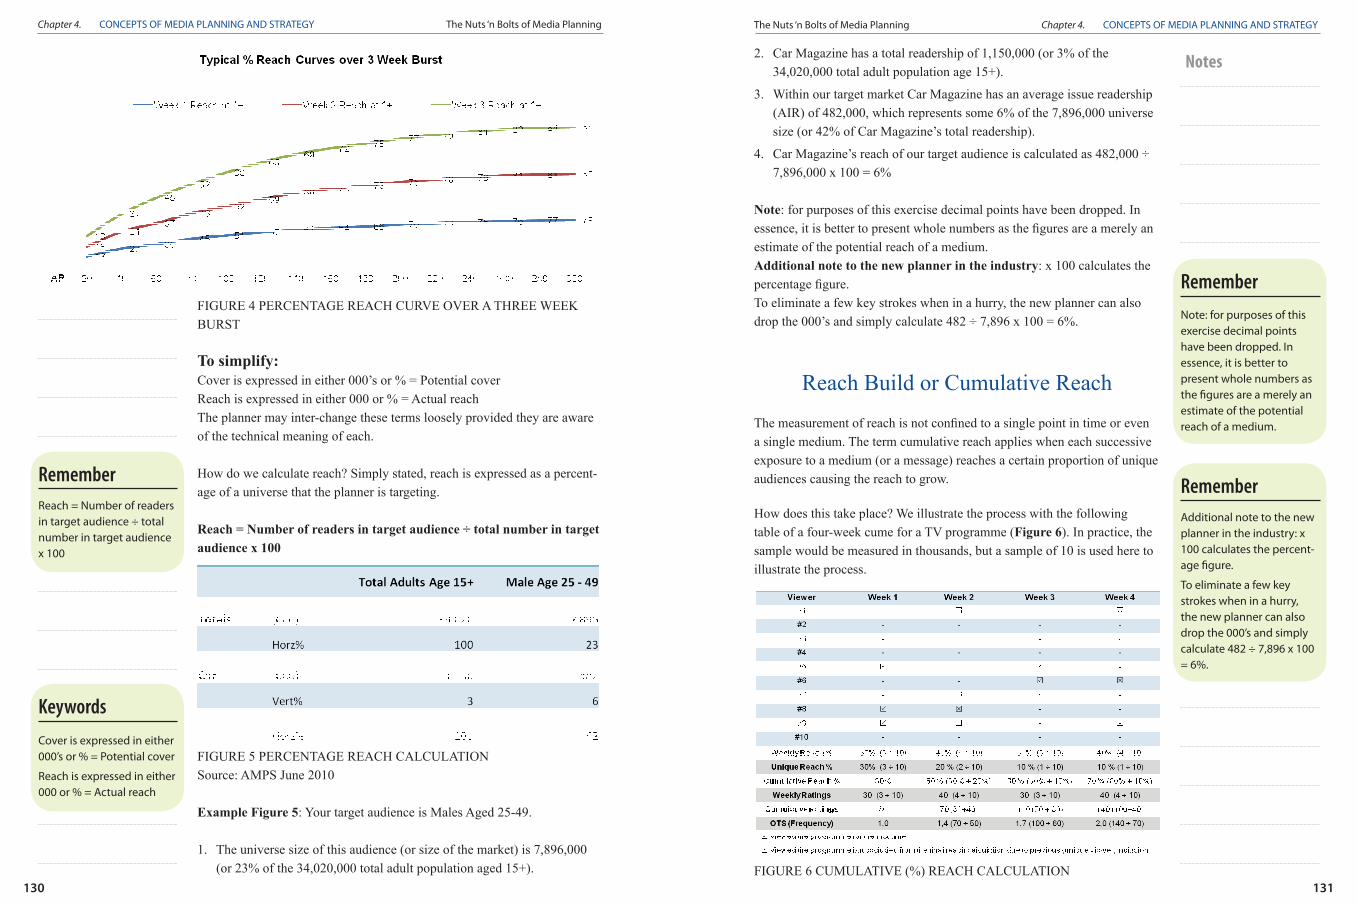
Cover vs ReachMedia Type Cover or Market Cover + Definition Reach + Definition ApplicationFree-to-Air Television The number of prospects available in the
station footprint (signal) area that have access to a television set. This does not necessarily mean that everyone in the footprint area actually watches the station or has access to a television set.
The number of people who actually watch a station or specific programming within that station (patronage or share of available audience). The SAARF definition of TV viewing is defined to the respondent as meaning that "..... you have personally watched all or part of a programme - it doesn't matter where you watched it."
Can be used to inform reach objectives to determine whether a media type can deliver enough prospects within a given target segment.
Pay TV The number of people who subscribe to Pay TV (M-Net, DStv and Top TV). Determines the maximum audience that can be reached by a network.
Radio The number of prospects available in the station footprint (signal) area that have access to a radio. This does not necessarily mean that everyone in the footprint area actually listens to the station especially given the fragmentation and available number of stations within a broadcast area.
The number of people who actually listen to a station or specific programming within that station (patronage or share of available audience). The SAARF definition of radio listening is defined to the respondent as meaning that " ..... you have personally listened to the radio - it may be all of a programme or only part of it. It doesn't matter if it was your own radio or
somebody else's - nor does it matter where you listened to it".
Can be used to inform reach objectives to determine whether a media type can deliver enough prospects within a given target segment.
Magazines The number of people who have read the magazine within the issue period (average issue readership) i.e. no longer than the issue period of that title. For example, to qualify as an average issue reader of a weekly publication, SAARF defines a respondent must have read or paged through that issue within the past 7 days for the first time. ABC or verified print orders also support the SAARF readership figures.
Same concept as above but represents estimated actual audience size.
Newspapers The number of people who have read the newspaper within the issue period (average issue readership) i.e. no longer than the issue period of that title. For example, to qualify as an average issue reader of a daily publication, SAARF defines a respondent must have read or paged through that issue yesterday for the first time. ABC or verified print orders also support the SAARF readership figures.
Same concept as above but represents estimated actual audience size.
Outdoor or Out-of-Home (OOH)
SAARF describes outdoor reach as respondents who are shown a card with examples of billboards, stores, bus shelters, trailers, minibus/taxis, trains, buses, trucks and dustbins that carry information and are asked to indicate when last they had seen each medium.
To determine the size of the audience who see each format.
Cinema Refers to the number of people who have attended the cinema and represents a different universe size i.e. all cinema goers within a period of time not usually more than a year. Two sources of information apply 1. Audited ticket sales (duplicated attendances) and 2. SAARF questions iro have you been to the cinema and when last did you go.
Same concept as above but represents estimated actual audience size over a period of time, it can be yesterday, 1, 2, 4, 6 + or 8 weeks, or 3, 5, 6 or 12 months. The period of time also defines the frequency (no of occasions) and recency of attendance (how often and when last did you go).
Digital: Internet/World
Wide Web
Internet/World Wide Web usage refers to the respondents’ personal usage of the Internet/World Wide Web. It does not matter where it was accessed or for what purpose it was used.
Online has limited penetration in South Africa and therefore limited reach potential on average. It is however strongest in the top segments of the market. Given this dynamically fragmenting and expanding universe it is very difficult to quantify absolute reach via traditional methods and more is explained in the Digital chapter of the book
FIGURE 3B TRANSLATING MARKETING OBJECTIVES INTO ME-DIA OBJECTIVES (SOURCE: AEGIS MEDIA)
Coverage and Reach
Audiences can be anlaysed in two ways:
1. In total numbers of people i.e. 100,000 people.
2. Expressed as a percentage (%) of the demographic universe of which they are part i.e. Women aged 25 – 34.
We can compare media types by which delivers the greatest number of people (000’s) in the target audience, or which delivers the highest percent-age (%) of the total population in that audience.
Either approach will show the relative differences between the compared media types.
The difference between cover and reach can be defined as:Cover: The potential audience of a medium that has the possibility of being exposed, or has the Opportunity to See (OTS) the advertiser’s message at least once.
Reach: The actual audience or number of people within your target market who are exposed to the advertiser’s message at least once.
The differences are better explained in the following table2, based on the principle that it is unfair to compare a one-week broadcast rating for a TV programme with the reach of a monthly issue of a magazine. Firstly, the universes are different, but by using a four-week reach for broadcast media we now have a statistic that would be fairly comparable to that of a monthly magazine.
Marketing Objective Communication Objective Media Objective
Volume growth
Launch
Attain leadership
Convince current to buy more often
Stimulate trialamongst consumers
Deliver a new message / greater impact
Increase frequency / weightagainst existing users / core regions
Deliver rapid cover, use mediato generate trial / awareness
Heavier weight, use bigger space sizes / media in a way that conveys leadership / stature
Translating objectives into media objectives
2 South African Advertising Research Foundation. www.saarf.co.za
TABLE 2
For example, the fact that a TV channel covers many households is no guarantee that that station will actually reach those households, or that the individuals who live in the household will actually watch that channel.
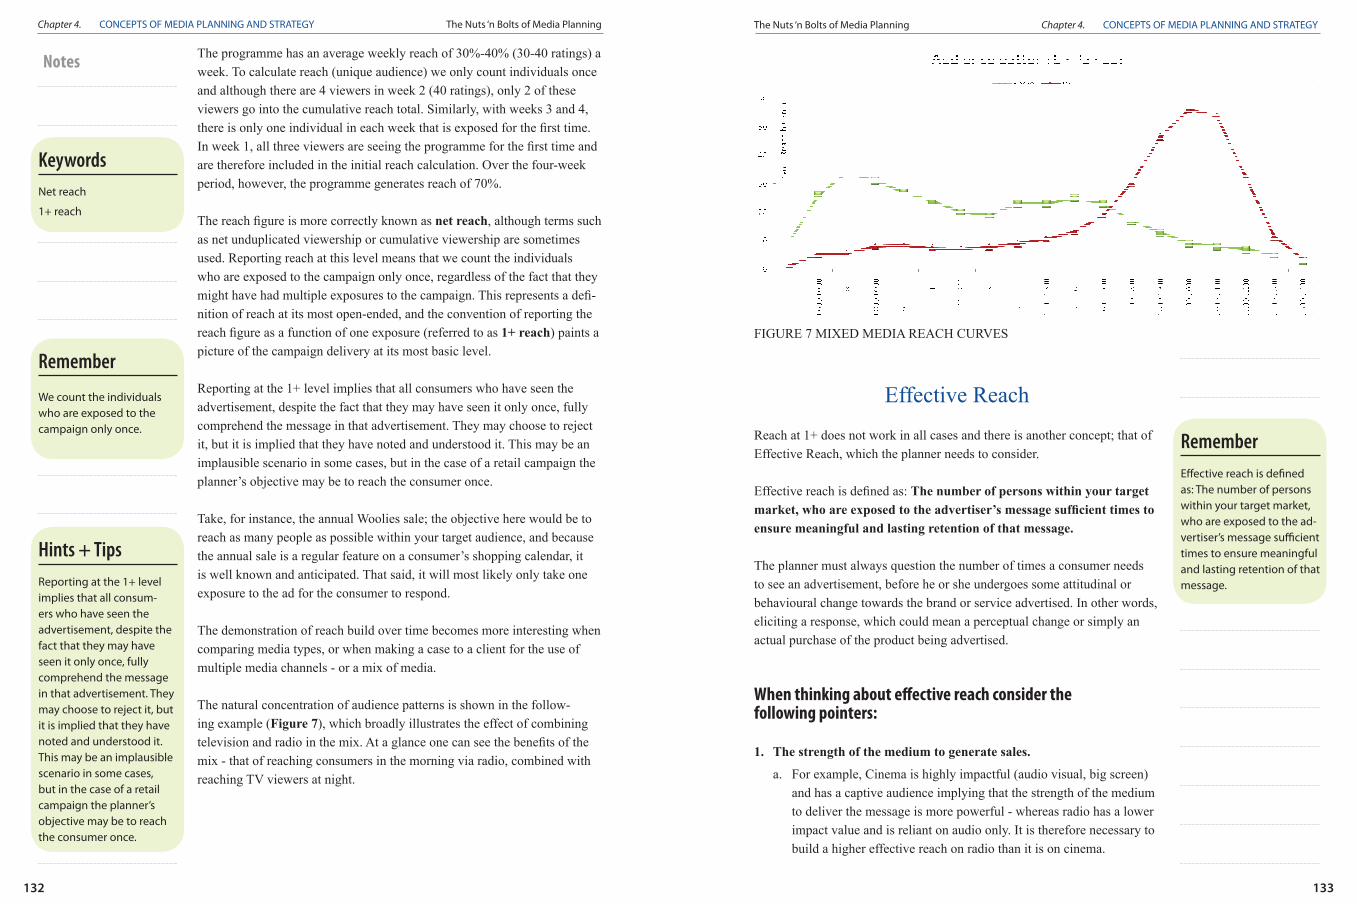
The measurement parameter is also relevant; for example, AMPS reports on yesterday, past 7 days and past 4 weeks. It is unlikely (but possible) that a TV campaign will run for only one day, therefore the planner must use past 7 days to establish the extent of reach that can be delivered within a one week period. By using the 4 week (1 month) period the planner can actually demonstrate the reach build and the rate of reach (speed of reach build) the channel will achieve over time. Figure 4 demonstrates an example of reach build over a three week period.
The difference between cover and reach can be defined as:Cover: The potential audience of a medium that has the possibility of being exposed, or has the Opportunity to See (OTS) the advertiser’s message at least once.Reach: The actual audience or number of people within your target market who are exposed to the advertiser’s message at least once.
Remember
NotesNotes
Chapter 4. CONCEPTS OF MEDIA PLANNING AND STRATEGY The Nuts ‘n Bolts of Media Planning The Nuts ‘n Bolts of Media Planning Chapter 4. CONCEPTS OF MEDIA PLANNING AND STRATEGY
130 131
Source: Telmar Transmit
Television
Figure 3 TV (%) Reach Build over 3 weeksFIGURE 4 PERCENTAGE REACH CURVE OVER A THREE WEEK BURST
To simplify:Cover is expressed in either 000’s or % = Potential coverReach is expressed in either 000 or % = Actual reachThe planner may inter-change these terms loosely provided they are aware of the technical meaning of each.
How do we calculate reach? Simply stated, reach is expressed as a percent-age of a universe that the planner is targeting.
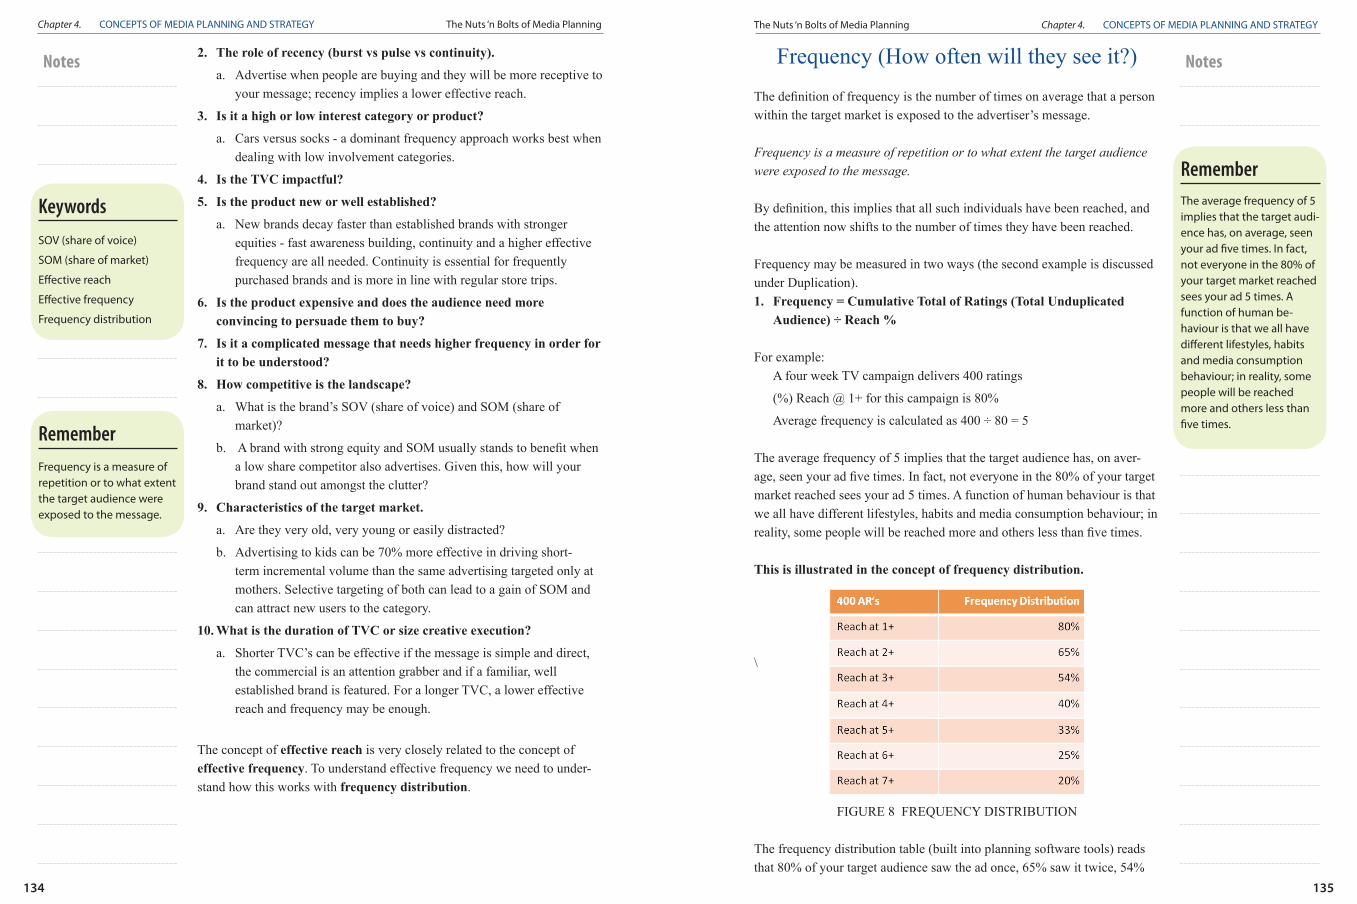
Reach = Number of readers in target audience ÷ total number in target audience x 100
FIGURE 5 PERCENTAGE REACH CALCULATIONSource: AMPS June 2010
Example Figure 5: Your target audience is Males Aged 25-49.
1. The universe size of this audience (or size of the market) is 7,896,000 (or 23% of the 34,020,000 total adult population aged 15+).
Reach calculation
Figure 4 (%) Reach Calculation
2. Car Magazine has a total readership of 1,150,000 (or 3% of the 34,020,000 total adult population age 15+).
3. Within our target market Car Magazine has an average issue readership (AIR) of 482,000, which represents some 6% of the 7,896,000 universe size (or 42% of Car Magazine’s total readership).
4. Car Magazine’s reach of our target audience is calculated as 482,000 ÷ 7,896,000 x 100 = 6%
Note: for purposes of this exercise decimal points have been dropped. In essence,itisbettertopresentwholenumbersasthefiguresareamerelyanestimate of the potential reach of a medium.Additional note to the new planner in the industry: x 100 calculates the percentagefigure.To eliminate a few key strokes when in a hurry, the new planner can also drop the 000’s and simply calculate 482 ÷ 7,896 x 100 = 6%.
Reach Build or Cumulative Reach
Themeasurementofreachisnotconfinedtoasinglepointintimeorevena single medium. The term cumulative reach applies when each successive exposure to a medium (or a message) reaches a certain proportion of unique audiences causing the reach to grow.
How does this take place? We illustrate the process with the following table of a four-week cume for a TV programme (Figure 6). In practice, the sample would be measured in thousands, but a sample of 10 is used here to illustrate the process.
FIGURE 6 CUMULATIVE (%) REACH CALCULATIONFigure 5 Cumulative (%) Reach Calculation
Cumulative Reach calculation
Cover is expressed in either 000’s or % = Potential cover
Reach is expressed in either 000 or % = Actual reach
Reach = Number of readers in target audience ÷ total number in target audience x 100
Note: for purposes of this exercise decimal points have been dropped. In essence, it is better to present whole numbers as the figures are a merely an estimate of the potential reach of a medium.
Additional note to the new planner in the industry: x 100 calculates the percent-age figure.
To eliminate a few key strokes when in a hurry, the new planner can also drop the 000’s and simply calculate 482 ÷ 7,896 x 100 = 6%.
Keywords
Remember
Remember
Remember
NotesNotes
Chapter 4. CONCEPTS OF MEDIA PLANNING AND STRATEGY The Nuts ‘n Bolts of Media Planning The Nuts ‘n Bolts of Media Planning Chapter 4. CONCEPTS OF MEDIA PLANNING AND STRATEGY
132 133
The programme has an average weekly reach of 30%-40% (30-40 ratings) a week. To calculate reach (unique audience) we only count individuals once and although there are 4 viewers in week 2 (40 ratings), only 2 of these viewers go into the cumulative reach total. Similarly, with weeks 3 and 4, thereisonlyoneindividualineachweekthatisexposedforthefirsttime.Inweek1,allthreeviewersareseeingtheprogrammeforthefirsttimeandare therefore included in the initial reach calculation. Over the four-week period, however, the programme generates reach of 70%.
Thereachfigureismorecorrectlyknownasnet reach, although terms such as net unduplicated viewership or cumulative viewership are sometimes used. Reporting reach at this level means that we count the individuals who are exposed to the campaign only once, regardless of the fact that they mighthavehadmultipleexposurestothecampaign.Thisrepresentsadefi-nition of reach at its most open-ended, and the convention of reporting the reachfigureasafunctionofoneexposure(referredtoas1+ reach) paints a picture of the campaign delivery at its most basic level.
Reporting at the 1+ level implies that all consumers who have seen the advertisement, despite the fact that they may have seen it only once, fully comprehend the message in that advertisement. They may choose to reject it, but it is implied that they have noted and understood it. This may be an implausible scenario in some cases, but in the case of a retail campaign the planner’s objective may be to reach the consumer once.
Take, for instance, the annual Woolies sale; the objective here would be to reach as many people as possible within your target audience, and because the annual sale is a regular feature on a consumer’s shopping calendar, it is well known and anticipated. That said, it will most likely only take one exposure to the ad for the consumer to respond.
The demonstration of reach build over time becomes more interesting when comparing media types, or when making a case to a client for the use of multiple media channels - or a mix of media.
The natural concentration of audience patterns is shown in the follow-ing example (Figure 7), which broadly illustrates the effect of combining televisionandradiointhemix.Ataglanceonecanseethebenefitsofthemix - that of reaching consumers in the morning via radio, combined with reaching TV viewers at night.
FIGURE 7 MIXED MEDIA REACH CURVES
Effective Reach
Reach at 1+ does not work in all cases and there is another concept; that of Effective Reach, which the planner needs to consider.
Effectivereachisdefinedas:The number of persons within your target market, who are exposed to the advertiser’s message sufficient times to ensure meaningful and lasting retention of that message.
The planner must always question the number of times a consumer needs to see an advertisement, before he or she undergoes some attitudinal or behavioural change towards the brand or service advertised. In other words, eliciting a response, which could mean a perceptual change or simply an actual purchase of the product being advertised.
When thinking about effective reach consider the following pointers:
1. The strength of the medium to generate sales.
a. For example, Cinema is highly impactful (audio visual, big screen) and has a captive audience implying that the strength of the medium to deliver the message is more powerful - whereas radio has a lower impact value and is reliant on audio only. It is therefore necessary to build a higher effective reach on radio than it is on cinema.
Mixed media reach curves
Figure 6 Mixed Media Reach Curves
Net reach
1+ reach
We count the individuals who are exposed to the campaign only once.
Effective reach is defined as: The number of persons within your target market, who are exposed to the ad-vertiser’s message sufficient times to ensure meaningful and lasting retention of that message.
Reporting at the 1+ level implies that all consum-ers who have seen the advertisement, despite the fact that they may have seen it only once, fully comprehend the message in that advertisement. They may choose to reject it, but it is implied that they have noted and understood it. This may be an implausible scenario in some cases, but in the case of a retail campaign the planner’s objective may be to reach the consumer once.
Keywords
Remember
Remember
Hints + Tips
NotesNotes
Chapter 4. CONCEPTS OF MEDIA PLANNING AND STRATEGY The Nuts ‘n Bolts of Media Planning The Nuts ‘n Bolts of Media Planning Chapter 4. CONCEPTS OF MEDIA PLANNING AND STRATEGY
134 135
2. The role of recency (burst vs pulse vs continuity).
a. Advertise when people are buying and they will be more receptive to your message; recency implies a lower effective reach.
3. Is it a high or low interest category or product?
a. Cars versus socks - a dominant frequency approach works best when dealing with low involvement categories.
4. Is the TVC impactful?
5. Is the product new or well established?
a. New brands decay faster than established brands with stronger equities - fast awareness building, continuity and a higher effective frequency are all needed. Continuity is essential for frequently purchased brands and is more in line with regular store trips.
6. Is the product expensive and does the audience need more convincing to persuade them to buy?
7. Is it a complicated message that needs higher frequency in order for it to be understood?
8. How competitive is the landscape?
a. What is the brand’s SOV (share of voice) and SOM (share of market)?
b. AbrandwithstrongequityandSOMusuallystandstobenefitwhena low share competitor also advertises. Given this, how will your brand stand out amongst the clutter?
9. Characteristics of the target market.
a. Are they very old, very young or easily distracted?
b. Advertising to kids can be 70% more effective in driving short-term incremental volume than the same advertising targeted only at mothers. Selective targeting of both can lead to a gain of SOM and can attract new users to the category.
10. What is the duration of TVC or size creative execution?
a. Shorter TVC’s can be effective if the message is simple and direct, the commercial is an attention grabber and if a familiar, well established brand is featured. For a longer TVC, a lower effective reach and frequency may be enough.
The concept of effective reach is very closely related to the concept of effective frequency. To understand effective frequency we need to under-stand how this works with frequency distribution.
Frequency (How often will they see it?)
Thedefinitionoffrequencyisthenumberoftimesonaveragethatapersonwithin the target market is exposed to the advertiser’s message.
Frequency is a measure of repetition or to what extent the target audience were exposed to the message.
Bydefinition,thisimpliesthatallsuchindividualshavebeenreached,andthe attention now shifts to the number of times they have been reached.
Frequency may be measured in two ways (the second example is discussed under Duplication).1. Frequency = Cumulative Total of Ratings (Total Unduplicated
Audience) ÷ Reach %
For example: A four week TV campaign delivers 400 ratings
(%) Reach @ 1+ for this campaign is 80%
Average frequency is calculated as 400 ÷ 80 = 5
The average frequency of 5 implies that the target audience has, on aver-age,seenyouradfivetimes.Infact,noteveryoneinthe80%ofyourtargetmarket reached sees your ad 5 times. A function of human behaviour is that we all have different lifestyles, habits and media consumption behaviour; in reality,somepeoplewillbereachedmoreandotherslessthanfivetimes.
This is illustrated in the concept of frequency distribution.
\
FIGURE 8 FREQUENCY DISTRIBUTION
The frequency distribution table (built into planning software tools) reads that 80% of your target audience saw the ad once, 65% saw it twice, 54%
Frequency distribution table
SOV (share of voice)
SOM (share of market)
Effective reach
Effective frequency
Frequency distribution
Keywords
Frequency is a measure of repetition or to what extent the target audience were exposed to the message.
Remember
The average frequency of 5 implies that the target audi-ence has, on average, seen your ad five times. In fact, not everyone in the 80% of your target market reached sees your ad 5 times. A function of human be-haviour is that we all have different lifestyles, habits and media consumption behaviour; in reality, some people will be reached more and others less than five times.
Remember
NotesNotes
Chapter 4. CONCEPTS OF MEDIA PLANNING AND STRATEGY The Nuts ‘n Bolts of Media Planning The Nuts ‘n Bolts of Media Planning Chapter 4. CONCEPTS OF MEDIA PLANNING AND STRATEGY
136 137
saw it three times and so on. Frequency is not necessarily built consecu-tively. In reality, target audience number 1 (let’s call him Bob) may see the adonthefirstdayofflightingandthesecondtimeonlythreedayslater-bywhichtimethecampaignhasbeenflightingforthreedays,butBobhasonlybeen exposed twice. Harry ( or target audience no 2), on the other hand, only watches TV on the weekend because he is an executive and spends most of his evenings working; he thus reserves his leisure viewing for when he is more relaxed. Harry will not be reached during the week and there will be at least a one week interval before he can be reached again, and a third weekend before he may be reached a third time. By now the campaign is well under way and 54% of the target market may have already seen it more than three times. The example also shows that frequency build is not sequential. This ties the concepts of reach build, effective reach and ef-fective frequency together because they are all inter-connected.
Relationships amongst reach, frequency, continuity, market size and ad size. Instrategythesefivecomponentsaresointer-linkedthatthestrategistcannot plan for one without simultaneously considering the others. This is primarilyinformedbythefixedbudgetsize,whichmeanstheplannermusttrade off (as shown in the Media Square); when one of these components is emphasised the others have to yield3.
Duplication
This brings us to the concept of duplication, defined as:Duplicationisthedegreeofoverlapbetweenconsumersofspecificmediaand refers to the behaviour among consumers to consume more than one media type - and probably more than one vehicle within that media type.
Duplication has two important natural qualities:
1. It builds reach (It is in fact a variation of cumulative reach).
2. It builds frequency.
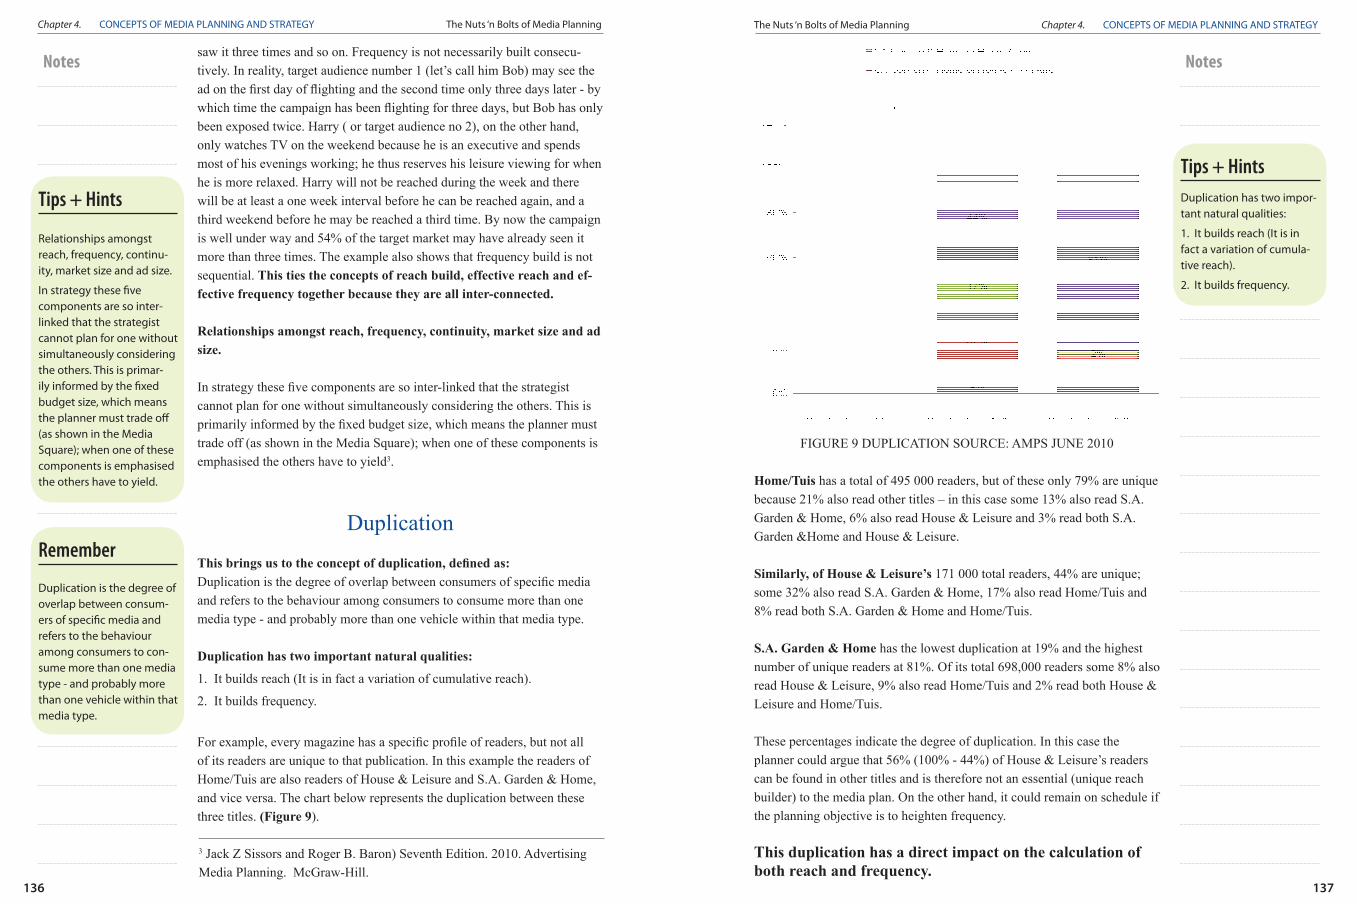
Forexample,everymagazinehasaspecificprofileofreaders,butnotallof its readers are unique to that publication. In this example the readers of Home/Tuis are also readers of House & Leisure and S.A. Garden & Home, and vice versa. The chart below represents the duplication between these three titles. (Figure 9).
FIGURE 9 DUPLICATION SOURCE: AMPS JUNE 2010
Home/Tuis has a total of 495 000 readers, but of these only 79% are unique because 21% also read other titles – in this case some 13% also read S.A. Garden & Home, 6% also read House & Leisure and 3% read both S.A. Garden &Home and House & Leisure.
Similarly, of House & Leisure’s 171 000 total readers, 44% are unique; some 32% also read S.A. Garden & Home, 17% also read Home/Tuis and 8% read both S.A. Garden & Home and Home/Tuis.
S.A. Garden & Home has the lowest duplication at 19% and the highest number of unique readers at 81%. Of its total 698,000 readers some 8% also read House & Leisure, 9% also read Home/Tuis and 2% read both House & Leisure and Home/Tuis.
These percentages indicate the degree of duplication. In this case the planner could argue that 56% (100% - 44%) of House & Leisure’s readers can be found in other titles and is therefore not an essential (unique reach builder) to the media plan. On the other hand, it could remain on schedule if the planning objective is to heighten frequency.
This duplication has a direct impact on the calculation of both reach and frequency.
3 Jack Z Sissors and Roger B. Baron) Seventh Edition. 2010. Advertising Media Planning. McGraw-Hill.
Duplication
Relationships amongst reach, frequency, continu-ity, market size and ad size.
In strategy these five components are so inter-linked that the strategist cannot plan for one without simultaneously considering the others. This is primar-ily informed by the fixed budget size, which means the planner must trade off (as shown in the Media Square); when one of these components is emphasised the others have to yield.
Duplication is the degree of overlap between consum-ers of specific media and refers to the behaviour among consumers to con-sume more than one media type - and probably more than one vehicle within that media type.
Duplication has two impor-tant natural qualities:
1. It builds reach (It is in fact a variation of cumula-tive reach).
2. It builds frequency.
Tips + Hints
Remember
Tips + Hints
NotesNotes
Chapter 4. CONCEPTS OF MEDIA PLANNING AND STRATEGY The Nuts ‘n Bolts of Media Planning The Nuts ‘n Bolts of Media Planning Chapter 4. CONCEPTS OF MEDIA PLANNING AND STRATEGY
138 139
When the total number of readers for the three publications is added to-gether, their combined readership equals 1 364 000 and the unique readers amount to 1,033,000 (calculate for each individual title - total 000’s reader-shipx%uniquereaders=000uniquereaders,thensumallthreefigurestoobtain your total unique readers). If the duplication is taken into consider-ation the unduplicated or net reach is considerably less.
Thefrequencyinthisexamplecanbecalculatedeitherbythefirstformula(total ratings ÷ reach %) or by a second method: Frequency = Gross duplicated reach ÷ gross unduplicated reach.In our magazine example:Gross duplicated reach (total combined readership) of 1,364,000 ÷ 1,033,000 gross unduplicated reach (total unique readers) = 1.3 frequency.
In applying the five key concepts of reach, frequency, continuity, market size and ad size to media strategy, the planner additionally has to consider numerous other variables. The table below (figure 10) will serve as a good reference and guideline.
FIGURE 10 MEDIA STRATEGY VARIABLES
Media Strategy variables
Cost-efficiency
We now understand the need for restrictions when setting media objectives, because in a media planner’s world many decisions revolve around avail-able budget. As a media planner, cost-efficiency will become part of your daily vocabulary, and will always be an important element to your client’s schedule.BUTcostefficiencycannotreplaceeffectivenessofagreatmediaidea. Great media ideas may come at a premium, but these can also deliver on ROI for your client, which you may not have achieved by simply select-ing the most cost effective title.
Quitesimplyput,cost-efficiencyforamediaschedulereferstotherelativebalance of effectively meeting reach and frequency goals at the lowest cost.
Cost per thousand is:Amonetaryfigurewhichindicatesthecostofreaching1000membersofthe selected target market.
Note: It is essential when working out CPT to compare apples with apples e.g. FPFC vs. FPFC rate. The term is often referred to as CPM (Cost per Mille) or CPT (Cost per Thousand), but the notation R/000 is the most widely used notation. ThisR/000figureiscalculatedasfollows…R/000 = Total Cost of Schedule in Rands ÷ Number of Measured units … in 000s
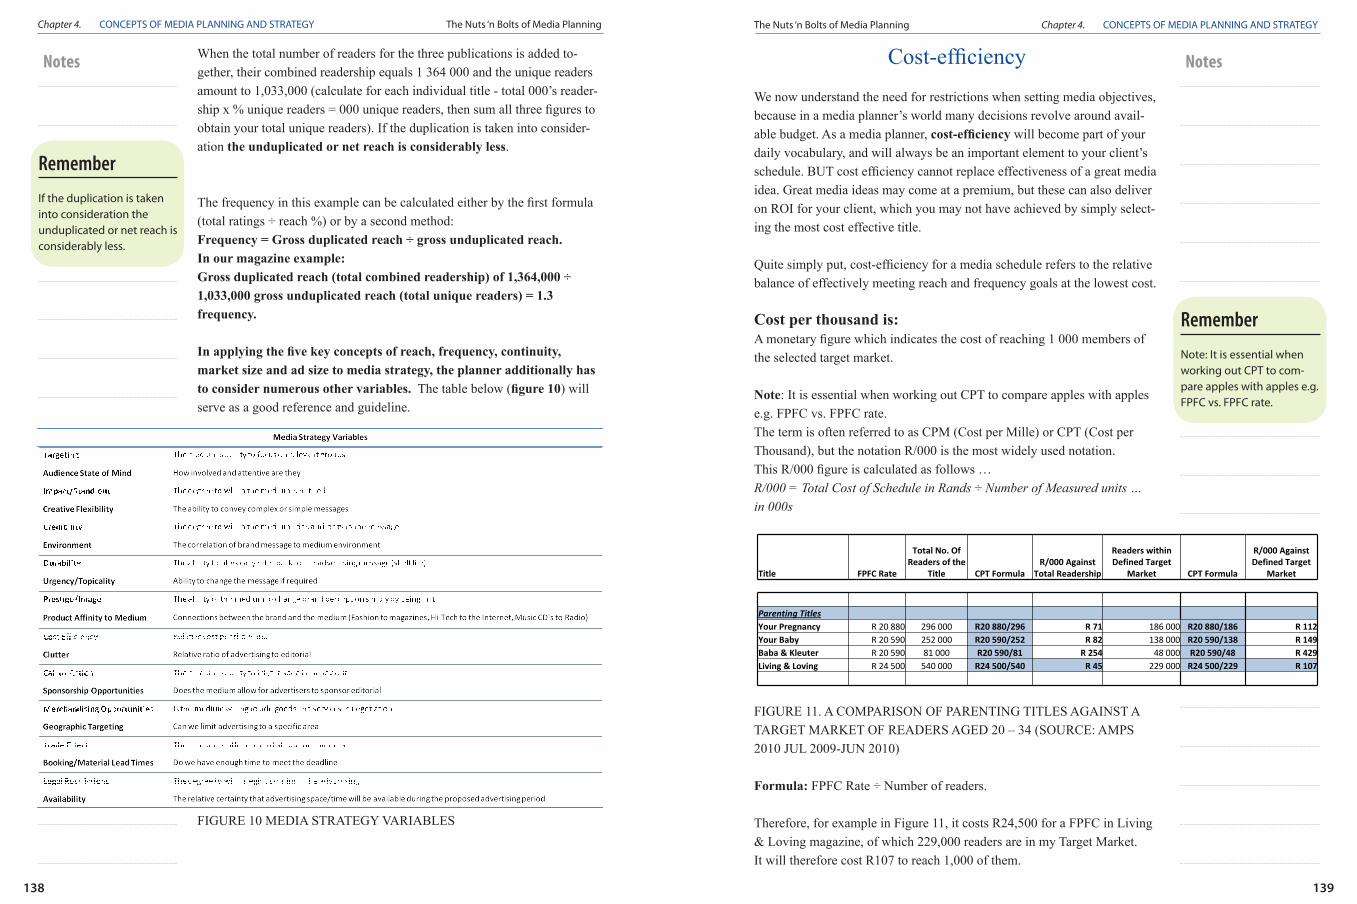
FIGURE 11. A COMPARISON OF PARENTING TITLES AGAINST A TARGET MARKET OF READERS AGED 20 – 34 (SOURCE: AMPS 2010 JUL 2009-JUN 2010)
Formula: FPFC Rate ÷ Number of readers.
Therefore, for example in Figure 11, it costs R24,500 for a FPFC in Living & Loving magazine, of which 229,000 readers are in my Target Market. It will therefore cost R107 to reach 1,000 of them.
CPT Table
Title FPFC Rate
Total No. Of Readers of the
Title CPT FormulaR/000 Against
Total Readership
Readers within Defined Target
Market CPT Formula
R/000 Against Defined Target
Market
Parenting Titles Your Pregnancy R 20 880 296 000 R20 880/296 R 71 186 000 R20 880/186 R 112Your Baby R 20 590 252 000 R20 590/252 R 82 138 000 R20 590/138 R 149Baba & Kleuter R 20 590 81 000 R20 590/81 R 254 48 000 R20 590/48 R 429Living & Loving R 24 500 540 000 R24 500/540 R 45 229 000 R24 500/229 R 107
If the duplication is taken into consideration the unduplicated or net reach is considerably less.
Note: It is essential when working out CPT to com-pare apples with apples e.g. FPFC vs. FPFC rate.
Remember
Remember
NotesNotes
Chapter 4. CONCEPTS OF MEDIA PLANNING AND STRATEGY The Nuts ‘n Bolts of Media Planning The Nuts ‘n Bolts of Media Planning Chapter 4. CONCEPTS OF MEDIA PLANNING AND STRATEGY
140 141
WhencomparingCPTagainsttotalreadershiporthedefinedtargetmarket(Readers aged 20-34), Living & Loving would be the most cost effective.
Note that in the example, for both the R/000 total readership and R/000 definedtargetmarketreadershipcalculations,theinsertioncostisdivided,not by the full amount of readership or circulation, but with these amounts reduced to units of thousands.
Gross Rating Points (GRPs)
Weighting your media refers to determining the potential exposures of your advertising message to your target audience that each of your chosen media can produce. Basically, by weighting your media, you are trying to deter-mine how much advertising is enough to reach your objectives. To do this, you’ll come up with a total number of gross rating points. To do that, you need to ensure an understanding of reach, frequency, and impressions.
Media planners calculate total Reach, average Frequency, and GRPs as part of the planning of a campaign. The goal is to obtain the highest possible GRPs at the lowest possible cost, while remaining focused on the target market.
Reach x Frequency = GRP’s. For example 70% Reach x 3.5 OTS = 245 GRP’sand therefore we can conclude from this simple equation that: Reach % = GRPs ÷ Frequency or Frequency = GRPs ÷ Reach %
After the campaign, you can calculate actual Reach x Frequency = GRPs to produce a measurable result.
A Rating Point is one percent of the potential audience. So what does that mean? For example, if 19 percent of your target market is watching a TV programme that contains your TV commercial then you will have 25 Rat-ing Points.
Ifthenexttimetheshowisflighted,and36percentofyourmarketiswatching, you then have a total of 19 + 36 = 55 - and so GRPs accumulate throughoutthecampaign.Theword‘gross’reflectsthatthecalculationdouble-counts (actually, multiple-counts) the audience; that is to say, it is possible to reach a percentage higher than 100, due to duplication.
Gross Rating Points could also be applied to other media besides televi-sion; namely, radio, print and billboards.
Applying GRPs to Out of Home, for example: If you have a billboard at a hightrafficintersectionand5%ofyourtargetmarketisexposedtothesitetwice a day, over a 3 month period (90 days), then GRP’s = 5 x 2 x 90 = 900.
Note: Always refer to your campaign objectives to assist you in determin-ing which schedule is better; this is not only a numbers game, you need to combine insights too.
GRP’s can also be used to compare different campaigns and establish cost efficiency.
HOWEVER:– Schedule A: 20% Reach @ 5 OTS = 100 GRPs
– Schedule B: 50% Reach @ 2 OTS = 100 GRPs
Which is the better campaign? The answer lies in what your objectives are.
Index
An Index is a form of percentage that relates numbers to a base, with the base being 100. It is used to demonstrate what is average, above average or below average. For example, an Index can be used to help determine theageprofileofaproductortofurtherdefineamagazineschedule.
Or simply put: An ‘efficiency indicator’ in media planning. It shows the weightofaspecificTargetAudiencecomparedtothetotalpopulationincaseofaspecificprogramme/medium.Ifafigureishigherthan1(100%),it means that the programme/medium is well targeted for our Target Audi-ence.
The higher this index, the better the targeting is. Too close to the average (105 - 110) and the targeting differentiation is not significant enough.
As an example, we want to determine which magazine delivers best against Target Market X. We therefore want to determine which magazines deliver profileswiththegreatestrelativeconcentrationofreaderswithinourtargetmarket. Using an Index is one of the ways to determine which titles to select. Looking at Figure 12, using a combination of Reach and Index, you
Note that in the example, for both the R/000 total readership and R/000 de-fined target market reader-ship calculations, the inser-tion cost is divided, not by the full amount of reader-ship or circulation, but with these amounts reduced to units of thousands.
Note: Always refer to your campaign objectives to assist you in determining which schedule is better; this is not only a numbers game, you need to combine insights too.
The word ‘gross’ reflects that the calculation double-counts (actually, multiple-counts) the audience; that is to say, it is possible to reach a percentage higher than 100, due to duplication.
Remember
Tips + Hints
Remember
NotesNotes
Chapter 4. CONCEPTS OF MEDIA PLANNING AND STRATEGY The Nuts ‘n Bolts of Media Planning The Nuts ‘n Bolts of Media Planning Chapter 4. CONCEPTS OF MEDIA PLANNING AND STRATEGY
142 143
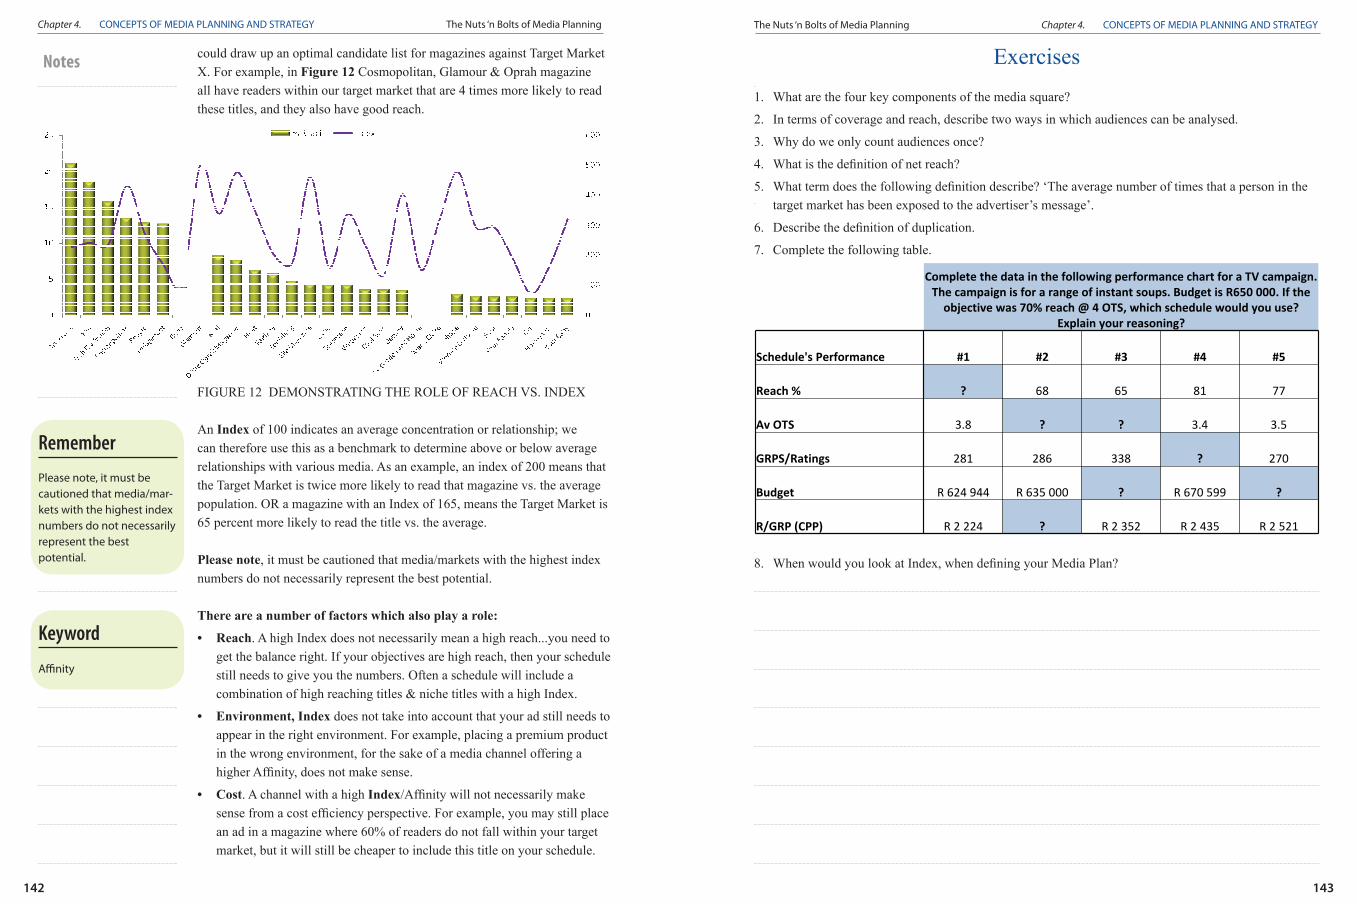
Notescould draw up an optimal candidate list for magazines against Target Market X. For example, in Figure 12 Cosmopolitan, Glamour & Oprah magazine all have readers within our target market that are 4 times more likely to read these titles, and they also have good reach.
FIGURE 12 DEMONSTRATING THE ROLE OF REACH VS. INDEX
An Index of 100 indicates an average concentration or relationship; we can therefore use this as a benchmark to determine above or below average relationships with various media. As an example, an index of 200 means that the Target Market is twice more likely to read that magazine vs. the average population. OR a magazine with an Index of 165, means the Target Market is 65 percent more likely to read the title vs. the average.
Please note, it must be cautioned that media/markets with the highest index numbers do not necessarily represent the best potential.
There are a number of factors which also play a role:
• Reach. A high Index does not necessarily mean a high reach...you need to get the balance right. If your objectives are high reach, then your schedule still needs to give you the numbers. Often a schedule will include a combination of high reaching titles & niche titles with a high Index.
• Environment, Index does not take into account that your ad still needs to appear in the right environment. For example, placing a premium product in the wrong environment, for the sake of a media channel offering a higherAffinity,doesnotmakesense.
• Cost. A channel with a high Index/Affinitywillnotnecessarilymakesensefromacostefficiencyperspective.Forexample,youmaystillplacean ad in a magazine where 60% of readers do not fall within your target market, but it will still be cheaper to include this title on your schedule.
Figure 12 Demonstrating the role of reach vs. indexFigure 12 Demonstrating the role of reach vs. index Exercises
1. What are the four key components of the media square?
2. In terms of coverage and reach, describe two ways in which audiences can be analysed.
3. Why do we only count audiences once?
4. Whatisthedefinitionofnetreach?
5. Whattermdoesthefollowingdefinitiondescribe?‘Theaveragenumberoftimesthatapersoninthetarget market has been exposed to the advertiser’s message’.
6. Describethedefinitionofduplication.
7. Complete the following table.
8. WhenwouldyoulookatIndex,whendefiningyourMediaPlan?
GRP Exercise
Complete the data in the following performance chart for a TV campaign. The campaign is for a range of instant soups. Budget is R650 000. If the objective was 70% reach @ 4 OTS, which schedule would you use?
Explain your reasoning?
Schedule's Performance #1 #2 #3 #4 #5
Reach % ? 68 65 81 77
Av OTS 3.8 ? ? 3.4 3.5
GRPS/Ratings 281 286 338 ? 270
Budget R 624 944 R 635 000 ? R 670 599 ?
R/GRP (CPP) R 2 224 ? R 2 352 R 2 435 R 2 521
Please note, it must be cautioned that media/mar-kets with the highest index numbers do not necessarily represent the best potential.
Affinity
Remember
Keyword

Notes
Chapter 4. CONCEPTS OF MEDIA PLANNING AND STRATEGY The Nuts ‘n Bolts of Media Planning
144 144
Notes