Embed Size (px)
Citation preview
1
Condominium Conversions in San Francisco: GIS Analysis ofDeterminants
by
J. M. Pogodzinski, Economics Department and Urban and Regional Planning Department, San Jose State University
Alicia T. Parker, Urban and Regional Planning Department, San Jose State University
Tito Vandermeyden, GIS Manager, Nextbus, Inc.
Download Presentation
Go to http://www.pogodzinski.net/ and click on “ESRI UC 2007 Presentation”
OverviewRelationship to earlier paperBackground Concerning Condominium Conversions in San FranciscoData about Condominium Conversions in San FranciscoEconomics of Condominium ConversionsGIS Application to Condominium Conversions
Supply-sideDemand-side (in earlier paper)
2
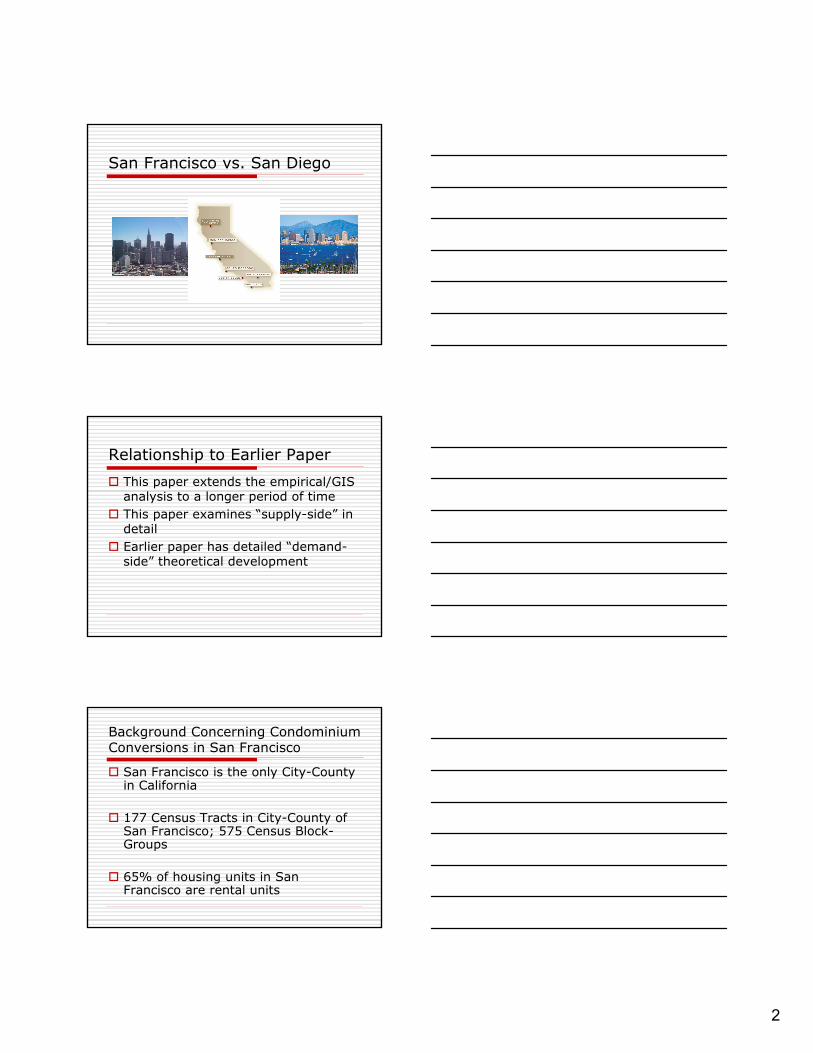
San Francisco vs. San Diego
Relationship to Earlier Paper
This paper extends the empirical/GIS analysis to a longer period of timeThis paper examines “supply-side” in detailEarlier paper has detailed “demand-side” theoretical development
Background Concerning Condominium Conversions in San Francisco
San Francisco is the only City-County in California
177 Census Tracts in City-County of San Francisco; 575 Census Block-Groups
65% of housing units in San Francisco are rental units
3
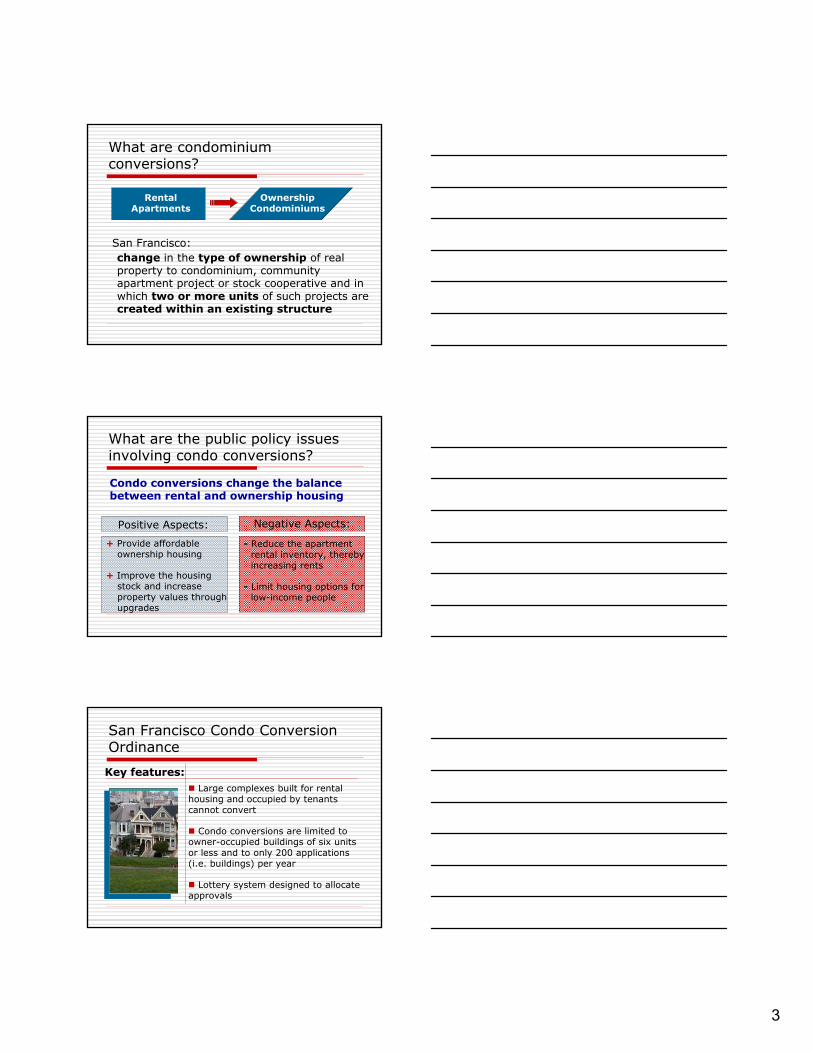
What are condominium conversions?
change in the type of ownership of real property to condominium, community apartment project or stock cooperative and in which two or more units of such projects are created within an existing structure
Ownership Condominiums
Rental Apartments
San Francisco:
What are the public policy issues involving condo conversions?
Condo conversions change the balance between rental and ownership housing
Positive Aspects: Negative Aspects:
+ Provide affordable ownership housing
+ Improve the housing stock and increase property values through upgrades
- Reduce the apartment rental inventory, thereby increasing rents
- Limit housing options for low-income people
San Francisco Condo Conversion Ordinance
Key features:Large complexes built for rental
housing and occupied by tenants cannot convert
Condo conversions are limited to owner-occupied buildings of six units or less and to only 200 applications (i.e. buildings) per year
Lottery system designed to allocate approvals
4
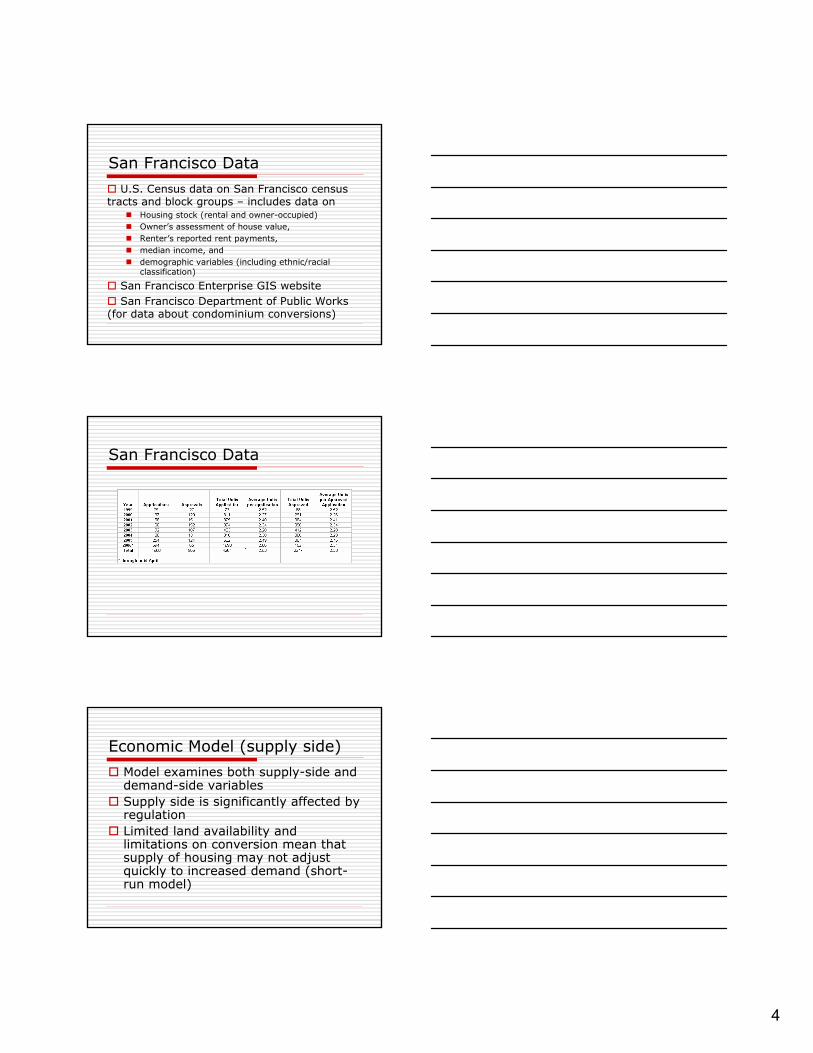
San Francisco Data
U.S. Census data on San Francisco census tracts and block groups – includes data on
Housing stock (rental and owner-occupied)Owner’s assessment of house value, Renter’s reported rent payments, median income, and demographic variables (including ethnic/racial classification)
San Francisco Enterprise GIS websiteSan Francisco Department of Public Works
(for data about condominium conversions)
San Francisco Data
Economic Model (supply side)
Model examines both supply-side and demand-side variablesSupply side is significantly affected by regulationLimited land availability and limitations on conversion mean that supply of housing may not adjust quickly to increased demand (short-run model)
5
Economic Model (demand side)Economic literature on tenure choice
Tenure choice model focuses on comparing the satisfaction a household derives from owning vs. the satisfaction it derives from renting (Henderson and Ioannides [1983])
Tenure choice model can also be modified to apply to different types of ownership (e.g., tenants in common vs. individuated ownership)
Tenure type within the same structure may yield different levels of satisfaction and be associated with different costs
Model Expectations (supply side)In the short run, more conversions should occur where the
supply of potential conversions is the greatest
Suggests looking at absolute or relative measures of supply of rental housing
Measures include proportion of rental housing to owner-occupied housing and proportion of rental housing in one area relative to the city-wide stock of rental housing
Suggests looking at more refined measure of rental housing in appropriate sized units
Measures include the proportion of rental housing in buildings with a specified number of units in one area relative to the city-wide number of rental units in buildings with the specified number of units
Model Expectations (demand side)Whether owning or renting is better for a particular
household depends on several factors
Price vs. rent for comparable properties (mortgage interest rate affects the cost of owner-occupied housing)
Expect price-to-rent ratio to be positively related with tendency to own; speculation on increase in house value also a possible explanation
Income: owner-occupied housing is assumed to be a “normal” good, like HDTVs, unlike shoe repairs.
Expect income to be positively related to tendency to own
6
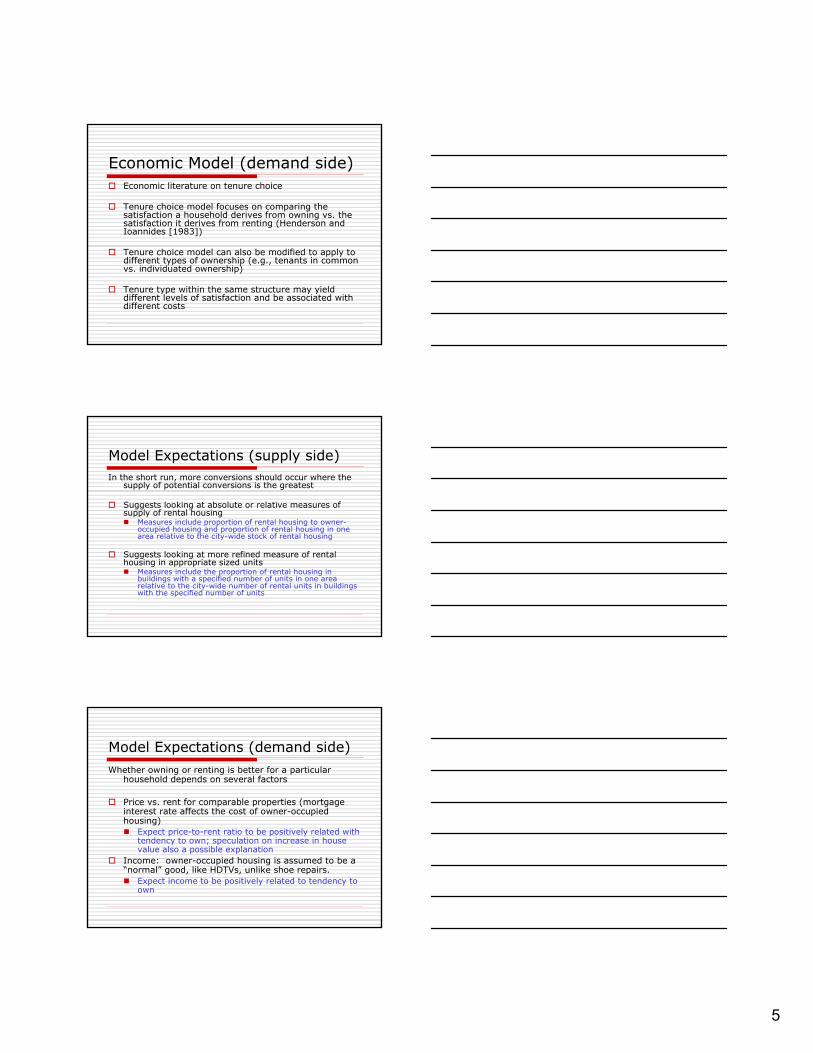
Empirical Methods
Create GIS layers of variables
1) Rental and Owner-occupied housing units
2) price-to-rent ratio 3) median income 4) percent Asian and 5) percent African American
Geocode addresses for various years between 2000and 2006
Create map overlays of condo conversions with layers representing the main variables of interest
Geocode addresses of all conversions
Map conversions and variables
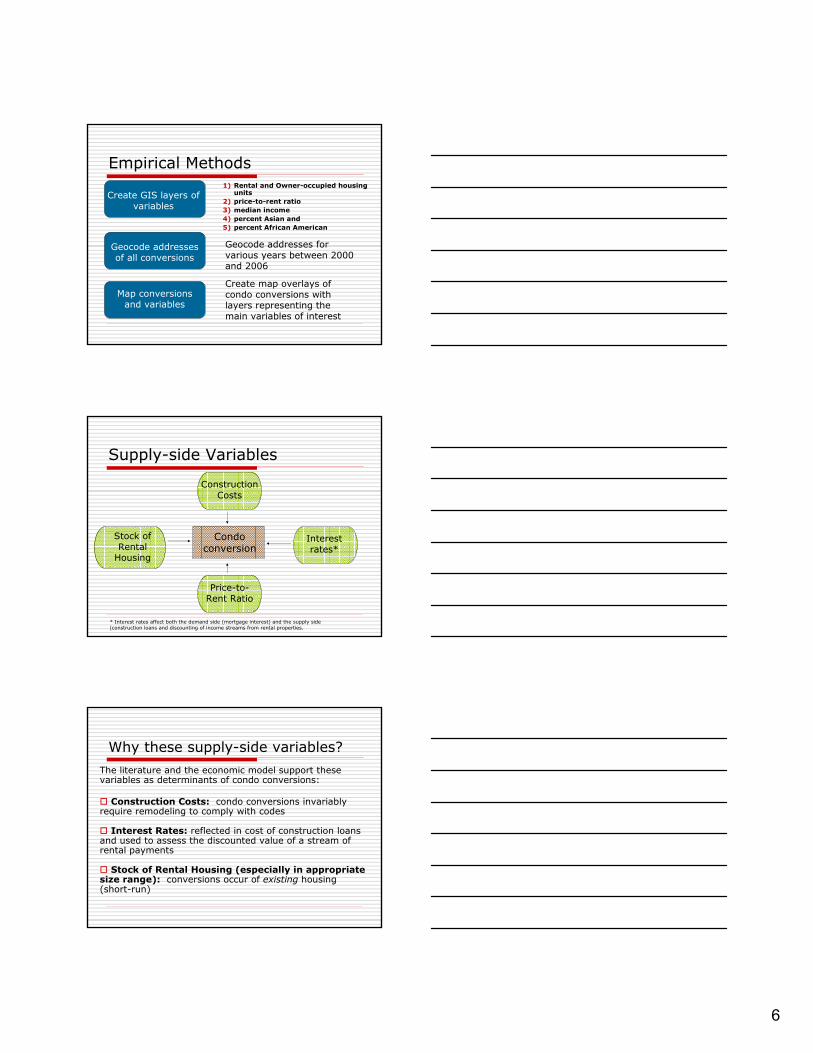
Supply-side Variables
Stock of Rental
Housing
Price-to-Rent Ratio
Construction Costs
Interest rates*
Condo conversion
* Interest rates affect both the demand side (mortgage interest) and the supply side (construction loans and discounting of income streams from rental properties.
Why these supply-side variables?
The literature and the economic model support thesevariables as determinants of condo conversions:
Construction Costs: condo conversions invariably require remodeling to comply with codes
Interest Rates: reflected in cost of construction loans and used to assess the discounted value of a stream of rental payments
Stock of Rental Housing (especially in appropriate size range): conversions occur of existing housing (short-run)
7
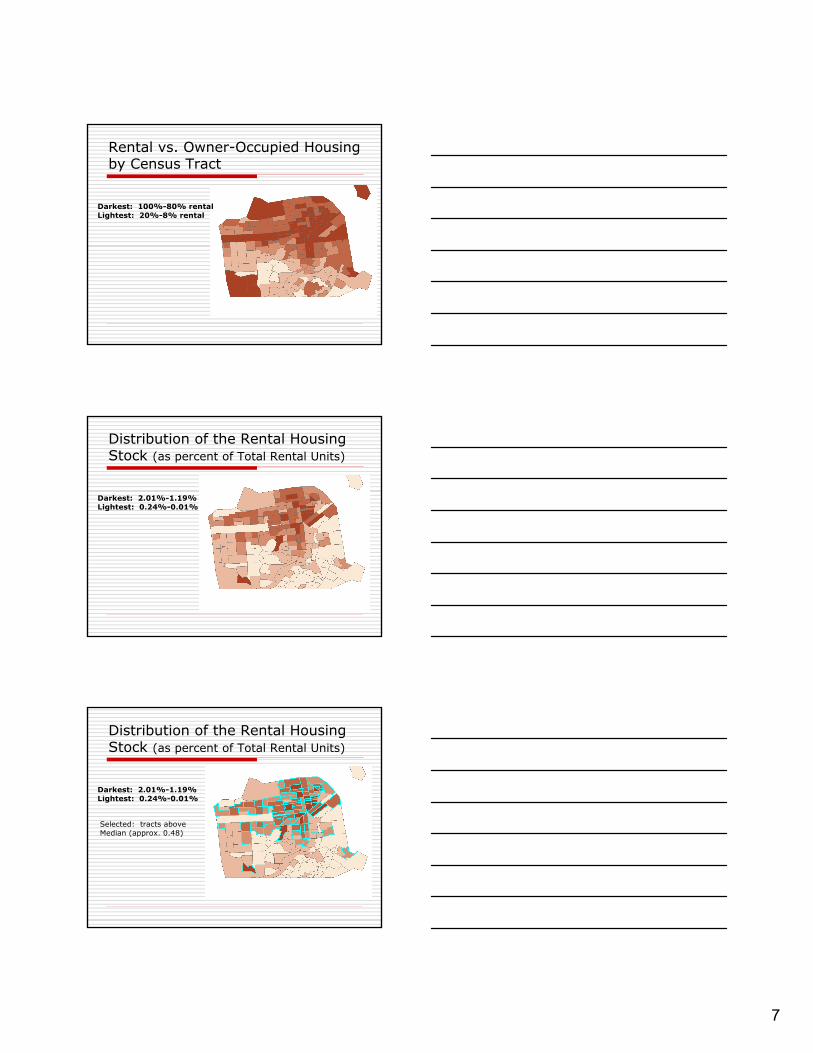
Rental vs. Owner-Occupied Housing by Census Tract
Darkest: 100%-80% rentalLightest: 20%-8% rental
Distribution of the Rental Housing Stock (as percent of Total Rental Units)
Darkest: 2.01%-1.19%Lightest: 0.24%-0.01%
Distribution of the Rental Housing Stock (as percent of Total Rental Units)
Darkest: 2.01%-1.19%Lightest: 0.24%-0.01%
Selected: tracts aboveMedian (approx. 0.48)
8
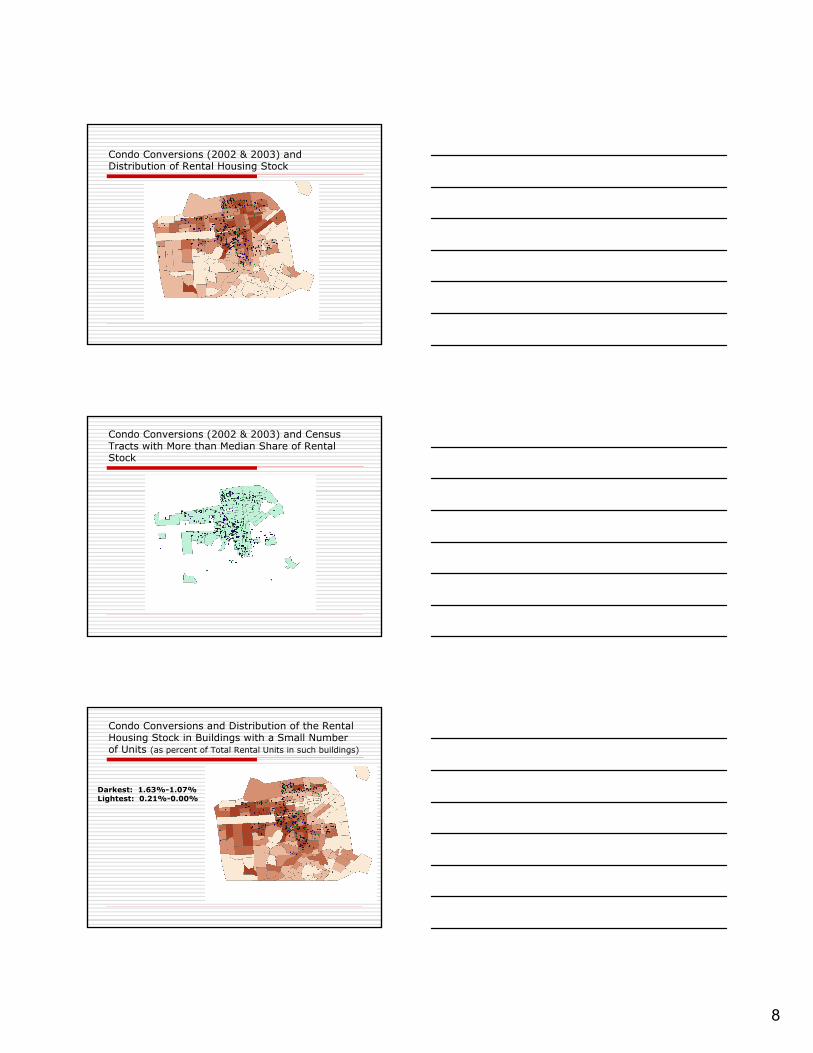
Condo Conversions (2002 & 2003) and Distribution of Rental Housing Stock
Condo Conversions (2002 & 2003) and Census Tracts with More than Median Share of Rental Stock
Condo Conversions and Distribution of the Rental Housing Stock in Buildings with a Small Number of Units (as percent of Total Rental Units in such buildings)
Darkest: 1.63%-1.07%Lightest: 0.21%-0.00%
9
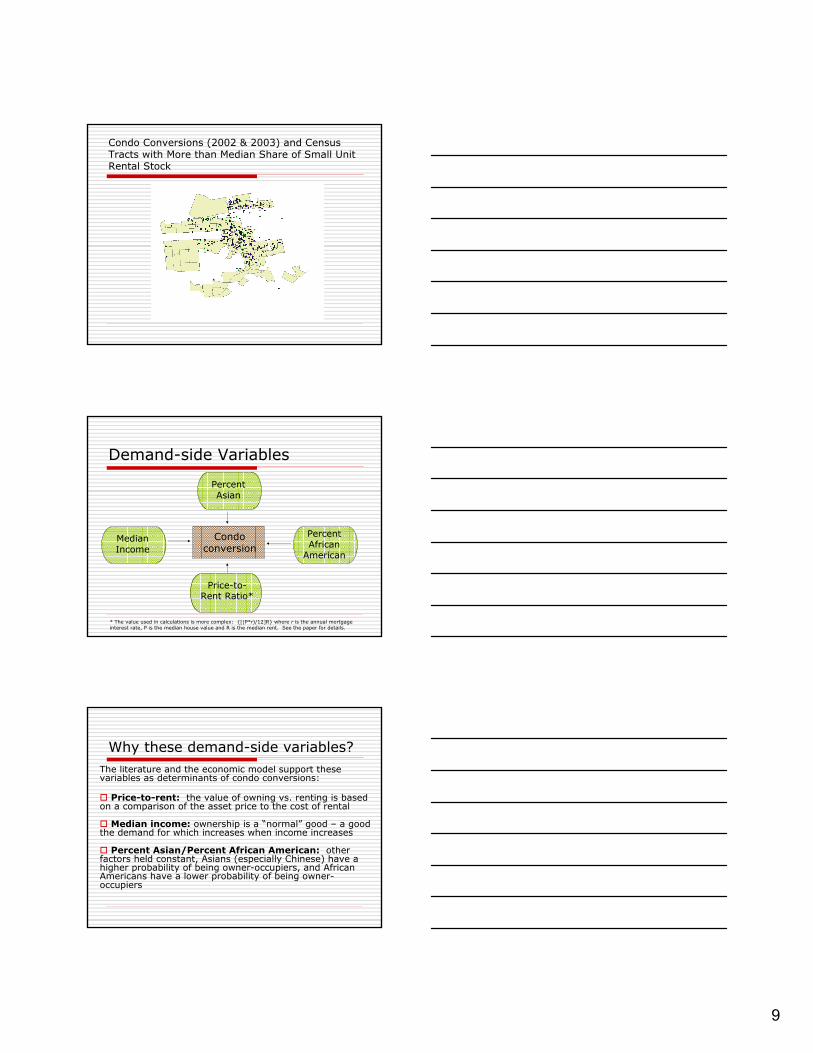
Condo Conversions (2002 & 2003) and Census Tracts with More than Median Share of Small Unit Rental Stock
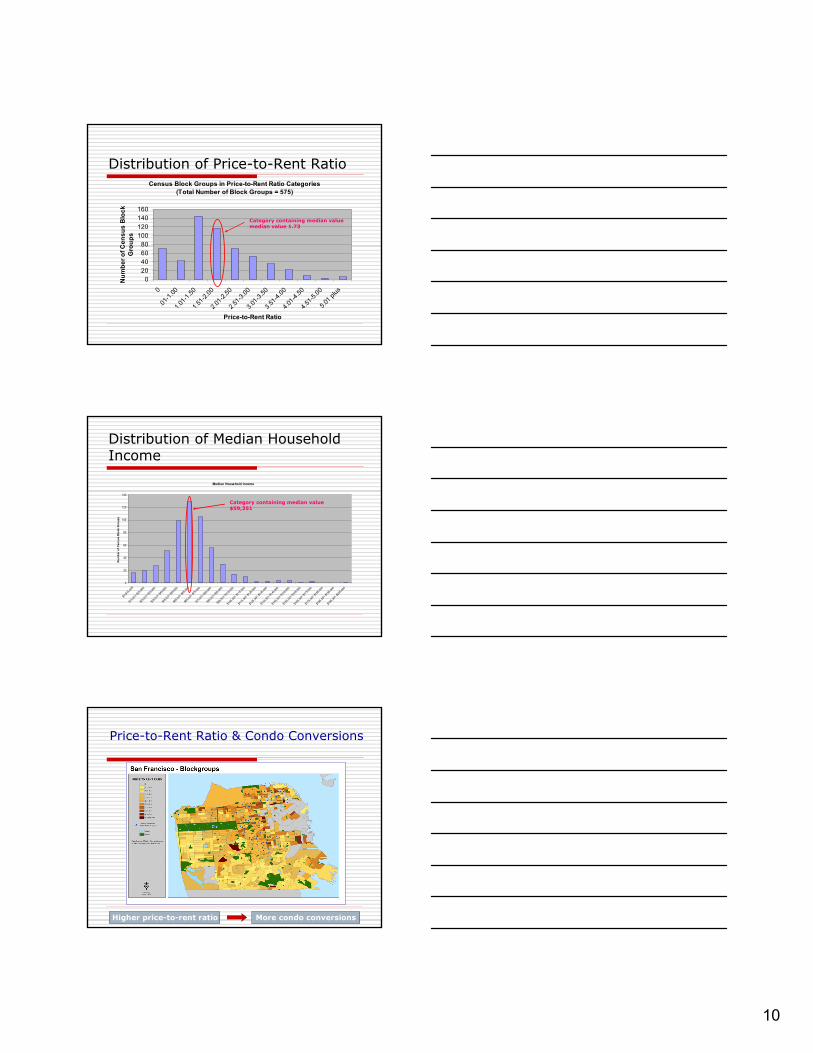
Demand-side Variables
Median Income
Price-to-Rent Ratio*
Percent Asian
Percent African
American
Condo conversion
* The value used in calculations is more complex: {[(P*r)/12]R} where r is the annual mortgage interest rate, P is the median house value and R is the median rent. See the paper for details.
Why these demand-side variables?The literature and the economic model support thesevariables as determinants of condo conversions:
Price-to-rent: the value of owning vs. renting is based on a comparison of the asset price to the cost of rental
Median income: ownership is a “normal” good – a good the demand for which increases when income increases
Percent Asian/Percent African American: other factors held constant, Asians (especially Chinese) have a higher probability of being owner-occupiers, and African Americans have a lower probability of being owner-occupiers
10
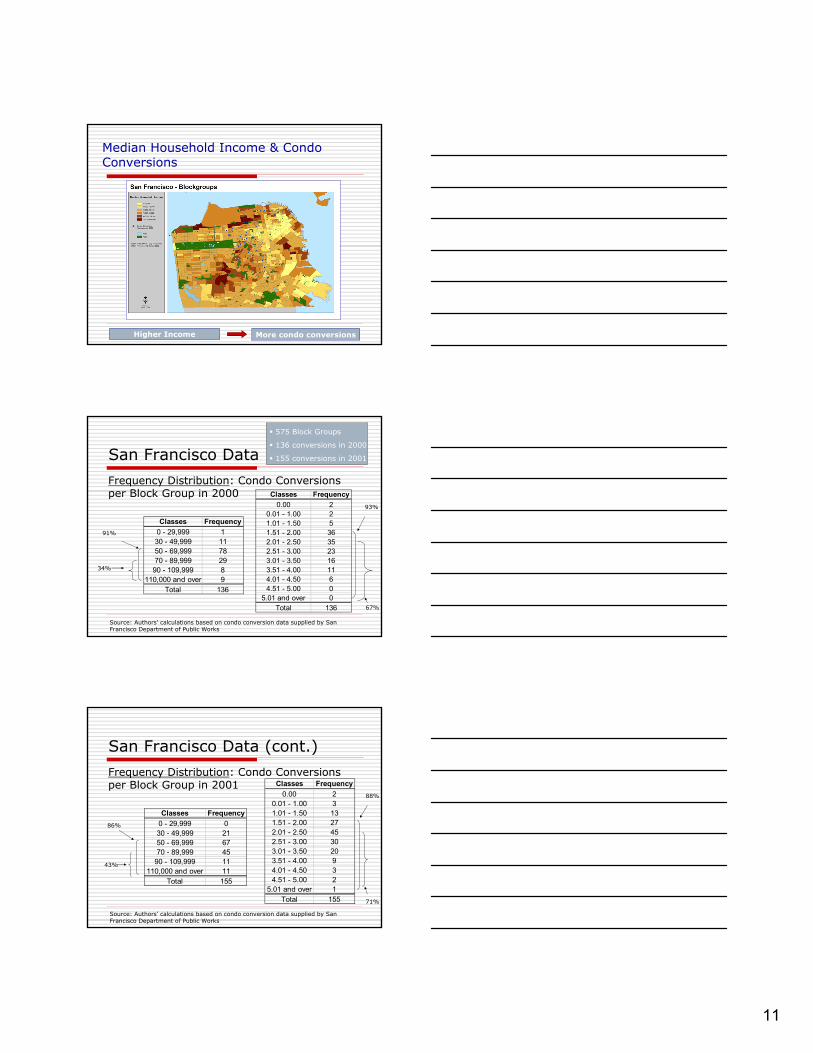
Distribution of Price-to-Rent RatioCensus Block Groups in Price-to-Rent Ratio Categories
(Total Number of Block Groups = 575)
020406080
100120140160
0
.01-1.
00
1.01-1
.50
1.51-2
.00
2.01-2
.50
2.51-3
.00
3.01-3
.50
3.51-4
.00
4.01-4
.50
4.51-5
.00
5.01 p
lus
Price-to-Rent Ratio
Num
ber o
f Cen
sus
Blo
ck
Gro
ups
Category containing median valuemedian value 1.73
Distribution of Median Household Income
Median Household Income
0
20
40
60
80
100
120
140
$0-$1
5,000
$15,0
01-$2
5,000
$25,0
01-$3
5,000
$35,0
01-$4
5,000
$45,0
01-$5
5,000
$55,0
01-$6
5,000
$65,0
01-$7
5,000
$75,0
01-$8
5,000
$85,0
01-$9
5,000
$95,0
01-$1
05,00
0
$105
,001-$
115,0
00
$115
,001-$
125,0
00
$125
,001-$
135,0
00
$135
,001-$
145,0
00
$145
,001-$
155,0
00
$155
,001-$
165,0
00
$165
,001-$
175,0
00
$175
,001-$
185,0
00
$185
,001-$
195,0
00
$195
,001-$
205,0
00
Num
ber o
f Cen
sus
Blo
ck G
roup
s
Category containing median value$59,351
Price-to-Rent Ratio & Condo Conversions
Higher price-to-rent ratio More condo conversions
11
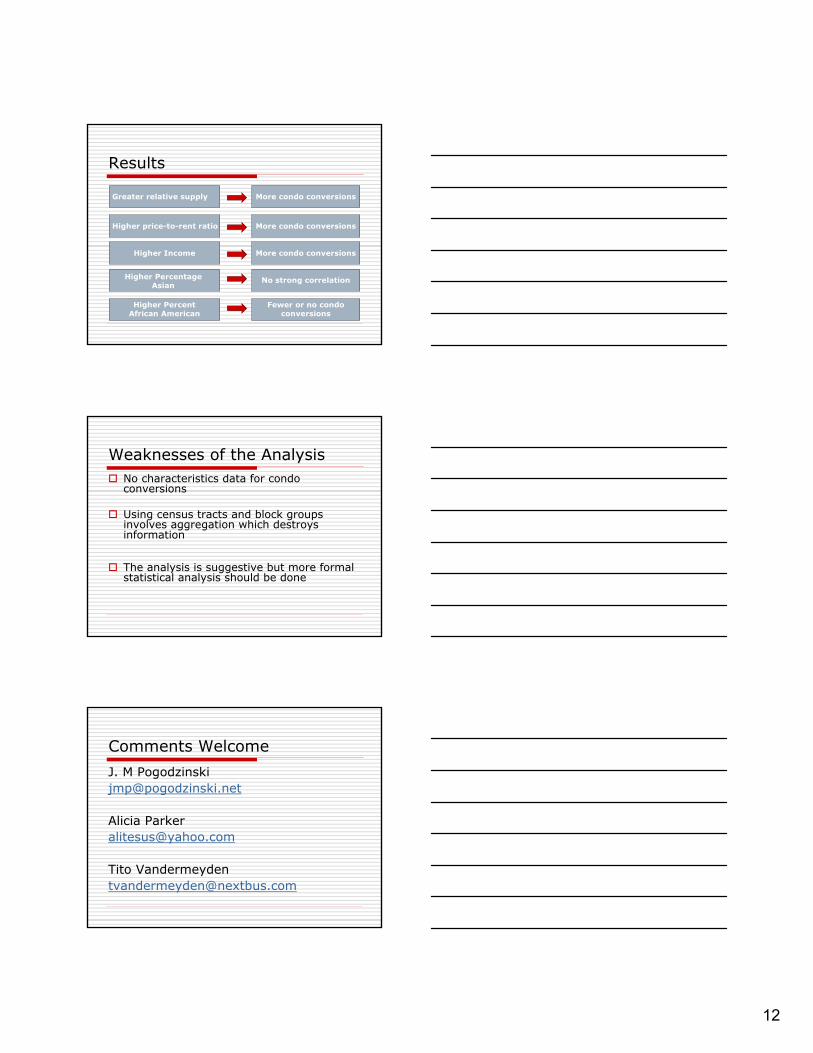
Median Household Income & Condo Conversions
Higher Income More condo conversions
San Francisco Data
Frequency Distribution: Condo Conversions per Block Group in 2000
Classes Frequency0 - 29,999 130 - 49,999 1150 - 69,999 7870 - 89,999 29
90 - 109,999 8110,000 and over 9
Total 136
Classes Frequency0.00 2
0.01 - 1.00 21.01 - 1.50 51.51 - 2.00 362.01 - 2.50 352.51 - 3.00 233.01 - 3.50 163.51 - 4.00 114.01 - 4.50 64.51 - 5.00 0
5.01 and over 0Total 136
Source: Authors’ calculations based on condo conversion data supplied by San Francisco Department of Public Works
575 Block Groups
136 conversions in 2000
155 conversions in 2001
91%
34%
93%
67%
San Francisco Data (cont.)
Frequency Distribution: Condo Conversions per Block Group in 2001
Classes Frequency0 - 29,999 030 - 49,999 2150 - 69,999 6770 - 89,999 45
90 - 109,999 11110,000 and over 11
Total 155
Classes Frequency0.00 2
0.01 - 1.00 31.01 - 1.50 131.51 - 2.00 272.01 - 2.50 452.51 - 3.00 303.01 - 3.50 203.51 - 4.00 94.01 - 4.50 34.51 - 5.00 2
5.01 and over 1Total 155
Source: Authors’ calculations based on condo conversion data supplied by San Francisco Department of Public Works
86%
43%
88%
71%
12
Results
Higher price-to-rent ratio More condo conversions
Higher Income More condo conversions
Higher Percentage Asian
No strong correlation
Higher Percent African American
Fewer or no condo conversions
Greater relative supply More condo conversions
Weaknesses of the AnalysisNo characteristics data for condo conversions
Using census tracts and block groups involves aggregation which destroys information
The analysis is suggestive but more formal statistical analysis should be done
Comments Welcome
J. M [email protected]
Alicia [email protected]
Tito [email protected]


![Winnipeg Condominium Corporation No. 36 - …blakesfiles.com/pub/English/class_actions/sep_2012/WCC.pdf · Winnipeg Condominium Corporation No. 36 v. ... Donoghue v. Stevenson, [1932]](https://img.pdfslide.tips/doc/110x75/5b85698a7f8b9a317e8e0f63/winnipeg-condominium-corporation-no-36-winnipeg-condominium-corporation-no.jpg)