Embed Size (px)
Citation preview

S1
Supporting Information for
Consecutive thiophene-annulation approach to -extended thienoacene-based organic semiconductors with [1]benzothieno[3,2-b][1]benzothiophene (BTBT) substructure
Takamichi Mori, Takeshi Nishimura, Tatsuya Yamamoto, Iori Doi, Eigo Miyazaki, Itaru Osaka, Kazuo Takimiya
Contents
1. Calculated and observed chemical shifts of BTNT and [1]benzothieno[2,3-a]naphtho[2,1-b]thiophene
S2
2. Estimation of HOMO energy levels S3
3. Theoretical MO calculations S3
4. Single Crystal X-ray analysis S4
5. Thermal stability of BBTNDT-based device S4
6. NMR spectra S5
7. References S43

S2
1. Calculated and observed chemical shifts of BTNT and [1]benzothieno[2,3-a]naphtho[2,1-b]thiophene
To confirm the structures of BTNT and [1]benzothieno[2,3-a]naphtho[2,1-b]thiophene, their chemical shifts on 1H
NMR spectra were simulated by using Gaussian 03 program.S1 The calculated and observed chemical shifts are listed
in Table S1, which clearly states that the present characterization of each compound by 1H NMR spectra is decent.
Table S1. Calculated and observed 1H NMR chemical shifts of BTNT and
[1]benzothieno[2,3-a]naphtho[2,1-b]thiophene.
BTNT [1]benzothieno[2,3-a]naphtho[2,1-b]thiophene
1H No. calcd. / ppm observed / ppm 1H No. calcd. / ppm observed. / ppm
1 7.79 7.90–7.97 1 8.52 8.49
2 7.34 7.42–7.49 2 7.82 7.77
3 7.32 7.42–7.49 3 7.66 7.63
4 8.03 8.02 4 7.85 8.01–8.04
6 8.12 8.37 5 7.70 7.84
7 7.79 7.90–7.97 6 7.94 7.97
8 7.43 7.51–7.55 8 8.10 8.01–8.04
9 7.45 7.51–7.55 9 7.33 7.40–7.49
10 7.94 7.90–7.97 10 7.37 7.40–7.49
11 8.41 8.40 11 7.81 8.01–8.04

S3
2. Estimation of HOMO energy levels
HOMO energy levels (EHOMOs) were estimated by cyclic voltammetry (for BTBS) and by photoemission yield
spectroscopy in air (PESA) on a RIKEN KEIKI AC-2 photoelectron spectrometer using evaporated thin films of
BTNT, BTAT, NTAT, and BBTNDT.
(a) (b) (c)
1 1.1 1.2 1.3 1.4 1.5 1.6
BTBTBSBTBSBS
V vs. Ag/AgCl
1.365
1.268
1.238
Cu
rre
nt /
arb
. un
it
0
10
20
30
40
50
4.5 5 5.5 6
BTNTDNTTBTATNTATDATT
Inte
nsi
ty^0
.5 /
cps^
0.5
Energy / eV 0
10
20
30
40
50
4.5 5 5.5 6
BBTBDTBBTNDT
Inte
nsi
ty^0
.5 /
cps^
0.5
Energy / eV
Figure S1. Cyclic voatamograms of BTBT, BTBS, and BSBS (a), photoemission yield spectroscopy in air: (b) a
series of compounds with one thieno[3,2-b]thiophene moiety, and (c) BBTBDT and BDTNDT with two
thieno[3,2-b]thiophene moieties.
3. Theoretical MO calculations
Geometry optimizations and normal mode calculations of isolated molecules were performed at the B3LYP/6-31G(d)
level using the Gaussian03 program package. 1H NMR Chemical shifts of BTNT and its isomer,
[1]benzothieno[2,3-a]naphtho[2,1-b]thiophene, were also simulated by using Gaussian 03 program (see Table S1).S1
Calculations of intermolecular transfer integrals (ts) were performed with the PW91 functional and Slater-type triple-
plus polarization (TZP) basis sets using the ADF (Amsterdam Density Functional) package.S2
Figure S2. Calculated HOMO and LUMO of a series of BTBT-based thienoacenes (B3LYP/6-31g(d) level).

S4
4. Single Crystal X-ray analysis
Single crystals of DATT X-ray structural analysis were obtained by a physical vapor transport method.S3 The X-ray
crystal structure analyses were made on a Rigaku R-AXIS RAPID (Cu K radiation, = 1.54187 Å, graphite
monochromator, T = 93 K). The structure was solved by the direct methods.S4 Non-hydrogen atoms were refined
anisotropically, and hydrogen atoms were included in the calculations but not refined. All calculations were
performed using the crystallographic software package CrystalStructures 4.0.S4
Crystallographic data for BTAT:
C22H12S2 (340.46), yellow plate, 0.19 × 0.15 × 0.05 mm3, triclinic, space group, P1
(#1), a = 6.1853(2), b = 7.5335(3), c = 16.1995(6) Å, = 91.001(7), = 92.437(7), = 90.097(7)°, V = 754.05(5) Å3,
Z = 2, R = 0.0896 for 3912 observed reflections (I > 2σ(I)) and 459 variable parameters, wR2 = 0.1937 for all data
(4293).
Crystallographic data for BBTNDT:
C26H12S4 (440.58), yellow plate, 0.53 × 0.35 × 0.005 mm3, monoclinic
space group, P21/n (#14), a = 40.290(2), b = 7.8081(4), c = 5.9894(3) Å, = 93.483(7)°, V = 1880.73(16) Å3, Z = 4, R
= 0.1529 for 1847 observed reflections (I > 2σ(I)) and 459 variable parameters, wR2 = 0.3298 for all data (3314).
5. Thermal stability of BBTNDT-based device
10-11
10-9
10-7
10-5
10-3
-60 -50 -40 -30 -20 -10 0 10 20
200 C,15 min.flesh device
-Id /
A
Vg
/ V
Vd = -60 V
Figure S3. Thermal stability test of the BBTNDT-based device (250 °C, 15 min.).

S5
6. NMR spectra
Figure S4. 1H and 13C NMR spectra of 2a.
STMS
S
STMS
S
2a
2a

S6
Figure S5. 1H and 13C NMR spectra of 2b.
SI
S
2b
SI
S
2b
S7
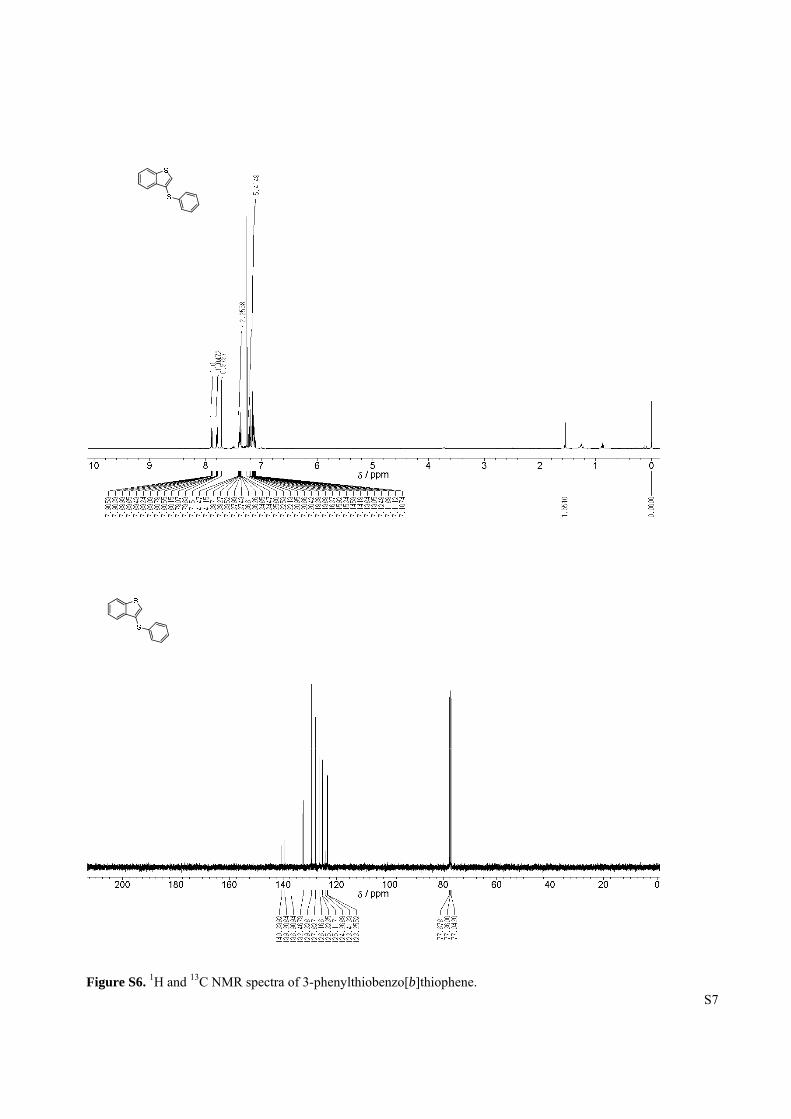
Figure S6. 1H and 13C NMR spectra of 3-phenylthiobenzo[b]thiophene.

S8
Figure S7. 1H and 13C NMR spectra of 2c.
2c
2c

S9
Figure S8. 1H and 13C NMR spectra of BTBT.
S
S
BTBT
S
S
BTBT

S10
Figure S9. 1H and 13C NMR spectra of 3a.
STMS
Se
STMS
Se
3a
3a

S11
Figure S10. 1H and 13C NMR spectra of 3b.
SI
Se
3b
SI
Se
3b

S12
Figure S11. 1H and 13C NMR spectra of 3-phenylselenobenzo[b]thiophene.
S
Se
S
Se

S13
Figure S12. 1H and 13C NMR spectra of 3c.
SBr
Se
SBr
Se
3c
3c

S14
Figure S13. 1H and 13C NMR spectra of BTBS.
S
Se
BTBS
S
Se
BTBS

S15
Figure S14. 1H and 13C NMR spectra of 4.
4
4

S16
Figure S15. 1H and 13C NMR spectra of 5a.
STMS
S
5a
STMS
S
5a

S17
Figure S16. 1H and 13C NMR spectra of 3-phenylthionaphtho[2,3-b]thiophene.
S
S
S
S

S18
Figure S17. 1H and 13C NMR spectra of 5b.
S
S
I
5b
S
S
I
5b

S19
Figure S18. 1H and 13C NMR spectra of 5c.
S
S
Br
5c
S
S
Br
5c

S20
Figure S19. 1H and 13C NMR spectra of BTNT.
S
S
BTNT
S
S
BTNT

S21
Figure S20. 1H and 13C NMR spectra of 6.
SMe
TMS
SMe
TMS
6
6

S22
Figure S21. 1H and 13C NMR spectra of 7a.
7a
S
S
TMS
S
S
TMS
7a

S23
Figure S22. 1H and 13C NMR spectra of 3-phenylthioanthra[2,3-b]thiophene.
S
S
S
S

S24
Figure S23. 1H and 13C NMR spectra of 7b.
S
S
I
S
S
I
7b
7b

S25
Figure S24. 1H and 13C NMR spectra of 7c.
S
S
Br
7c
S
S
Br
7c

S26
Figure S25. 1H and 13C NMR spectra of BTAT.
S
S
BTAT
S
S
BTAT

S27
Figure S26. 1H and 13C NMR spectra of 8a.
8a
8a
S28
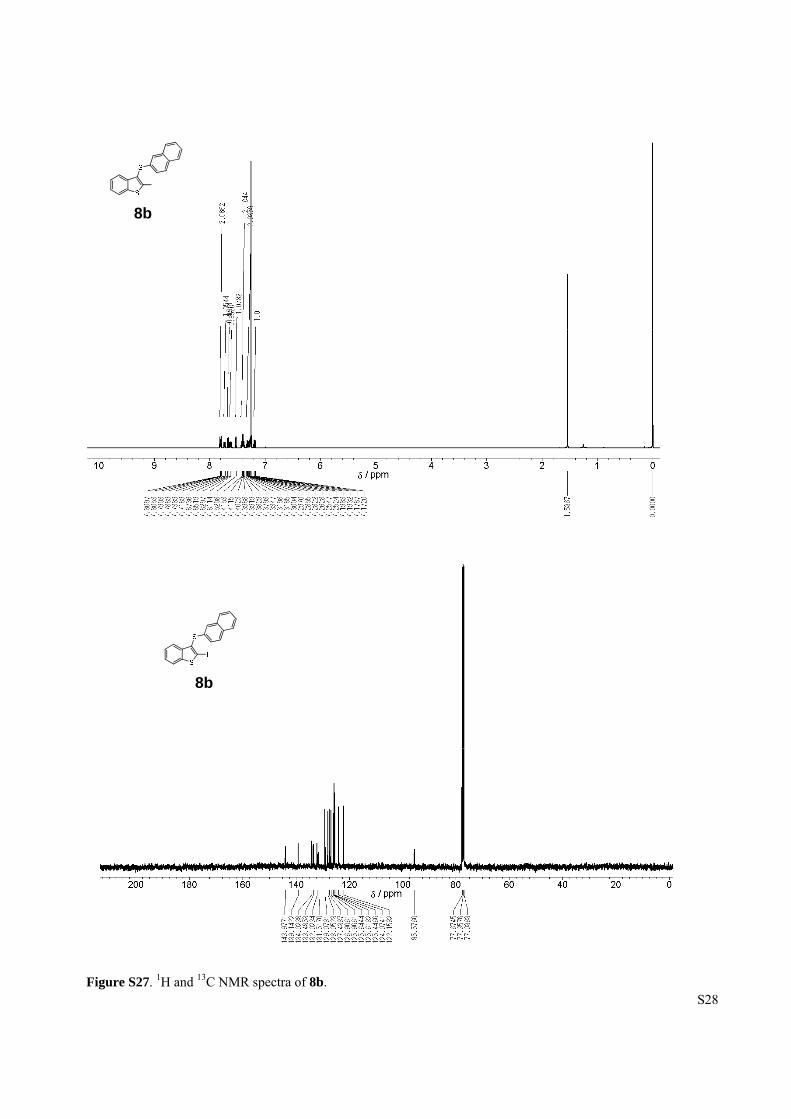
Figure S27. 1H and 13C NMR spectra of 8b.
8b
8b
S29
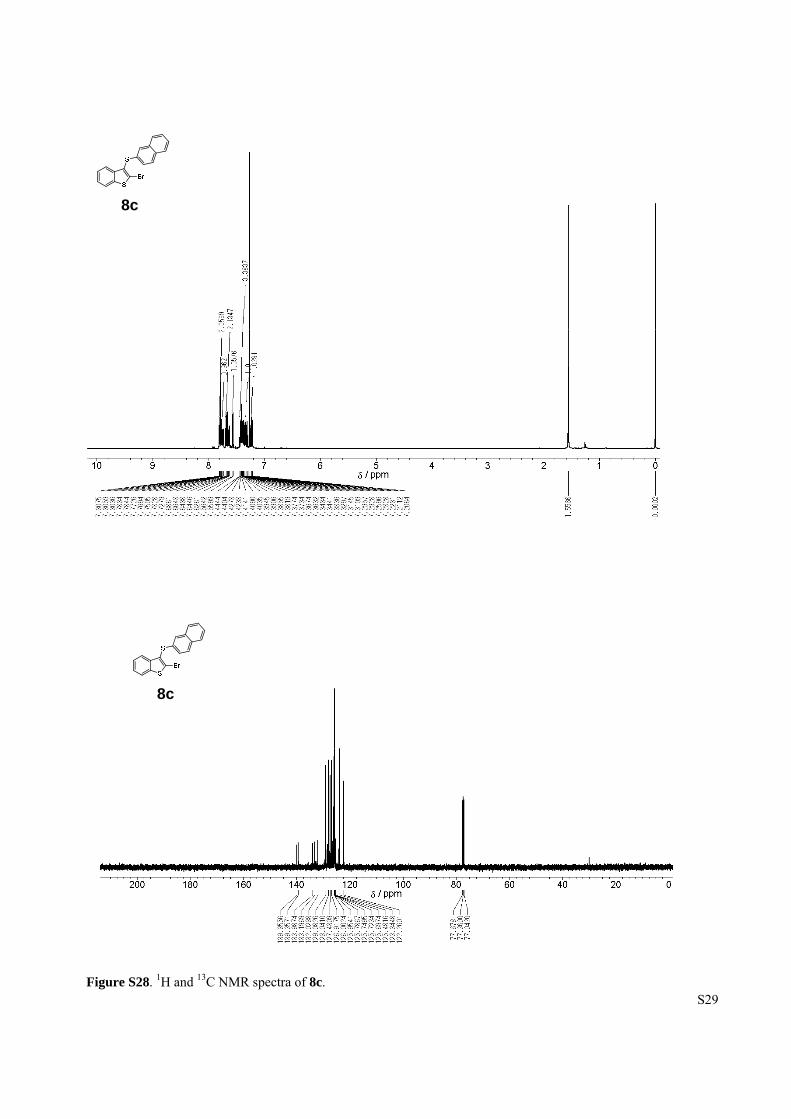
Figure S28. 1H and 13C NMR spectra of 8c.
8c
8c

S30
Figure S29. 1H and 13C NMR spectra of 9a.
9a
9a
S31
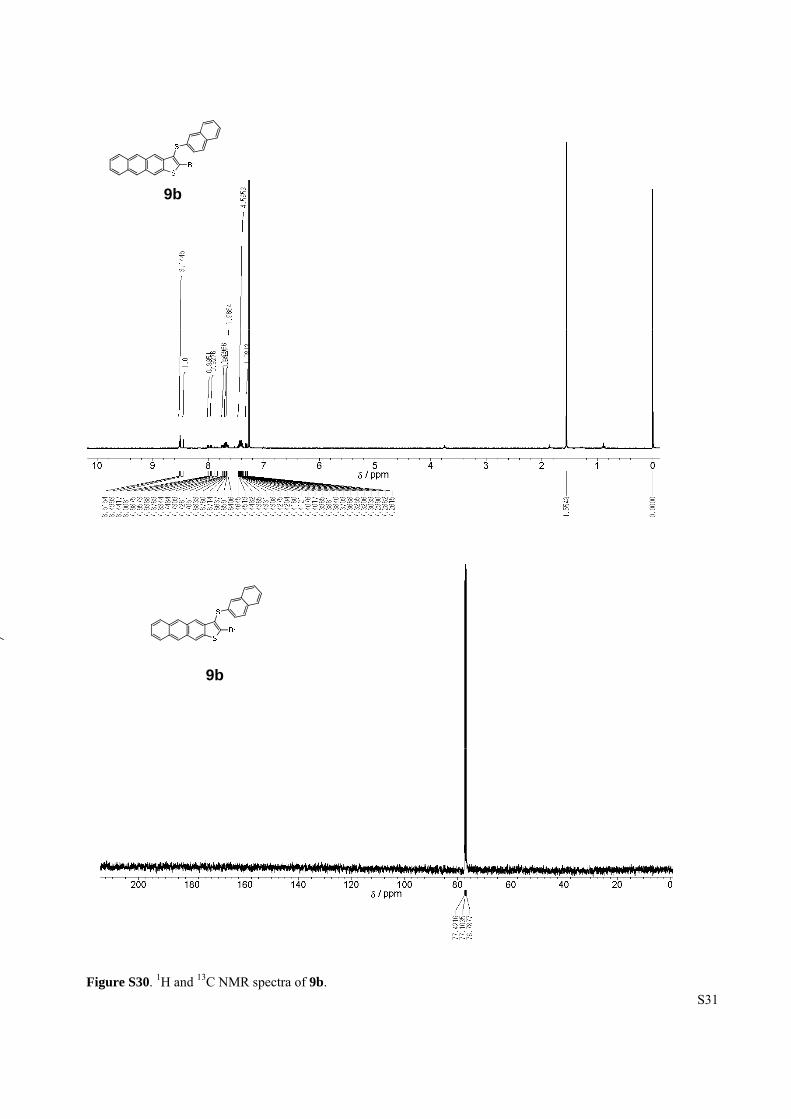
Figure S30. 1H and 13C NMR spectra of 9b.
9b
9b

S32
Figure S31. 1H and 13C NMR spectra of NTAT.
NTAT
NTAT

S33
Figure S32. 1H and 13C NMR spectra of 11a.
11a
11a

S34
Figure S33. 1H and 13C NMR spectra of 11b.
11b
11b

S35
Figure S34. 1H and 13C NMR spectra of BBTBDT.
BBTBDT
BBTBDT

S36
Figure S35. 1H and 13C NMR spectra of 2,6-dihydroxy-3,7- bis(methylthio)naphthalene.
OH
HO
MeS
SMe
OH
HO
MeS
SMe

S37
Figure S36. 1H and 13C NMR spectra of 3,7-bis(methylthio)-2,6-bis(trifluoromethanesulfonyloxy)naphthalene.
OTf
TfO
MeS
SMe
OTf
TfO
MeS
SMe
S38
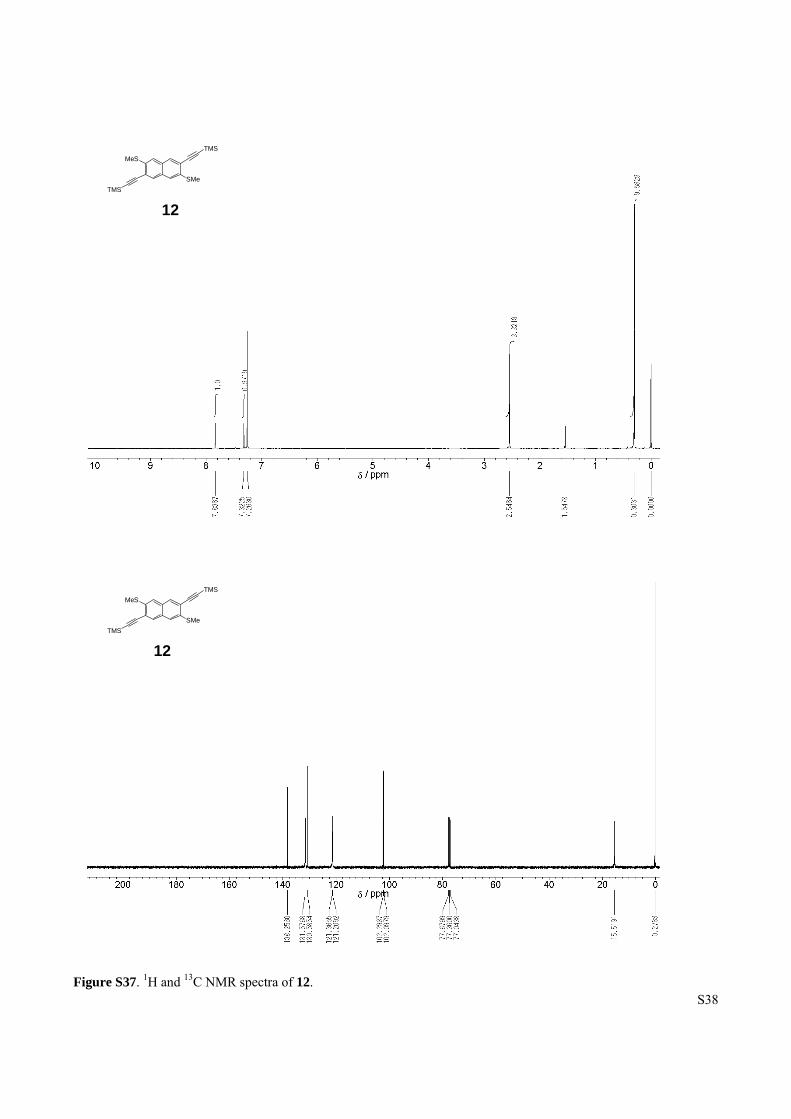
Figure S37. 1H and 13C NMR spectra of 12.
SMe
TMS
MeS
TMS
SMe
TMS
MeS
TMS
12
12

S39
Figure S38. 1H and 13C NMR spectra of 13a.
S
S
S
S
13a
S
S
S
S
13a
S40
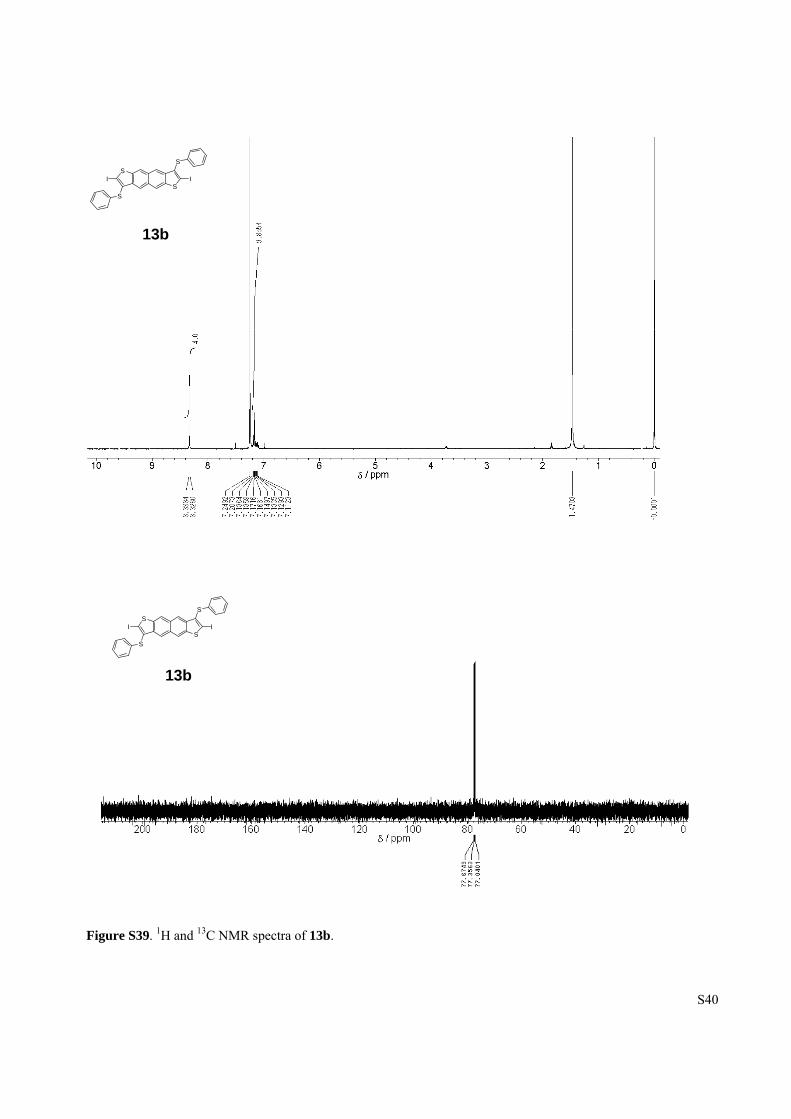
Figure S39. 1H and 13C NMR spectra of 13b.
S
SS
S
II
S
SS
S
II
13b
13b

S41
Figure S40. 1H and 13C NMR spectra of 13c.
S
SS
S
BrBr
13c
S
SS
S
BrBr
13c

S42
Figure S41. 1H and 13C NMR spectra of BBTNDT.
S
SS
S
BBTNDT
S
SS
S
BBTNDT

S43
7. References
S1. Frisch, M. J.; Trucks, G. W.; Schlegel, H. B.; Scuseria, G. E.; Robb, M. A.; Cheeseman, J. R.; Montgomery, Jr. J.
A.; Vreven, T.; Kudin, K. N.; Burant, J. C.; Millam, J. M.; Iyengar, S. S.; Tomasi, J.; Barone, V.; Mennucci, B.;
Cossi, M.; Scalmani, G.; Rega, N.; Petersson, G. A.; Nakatsuji, H.; Hada, M.; Ehara, M.; Toyota, K.; Fukuda, R.;
Hasegawa, J.; Ishida, M.; Nakajima, T.; Honda, Y.; Kitao, O.; Nakai, H.; Klene, M.; Li, X.; Knox, J. E.; Hratchian,
H. P.; Cross, J. B.; Adamo, C.; Jaramillo, J.; Gomperts, R.; Stratmann, R. E.; Yazyev, O.; Austin, A. J.; Cammi, R.;
Pomelli, C.; Ochterski, J. W.; Ayala, P. Y.; Morokuma, K.; Voth, G. A.; Salvador, P.; Dannenberg, J. J.; Zakrzewski,
V. G.; Dapprich, S.; Daniels, A. D.; Strain, M. C.; Farkas, O.; Malick, D. K.; Rabuck, A. D.; Raghavachari, K.;
Foresman, J. B.; Ortiz, J. V.; Cui, Q.; Baboul, A. G.; Clifford, S.; Cioslowski, J.; Stefanov, B. B.; Liu, G.;
Liashenko, A.; Piskorz, P.; Komaromi, I.; Martin, R. L.; Fox, D. J.; Keith, T.; Al-Laham, M. A.; Peng, C. Y.;
Nanayakkara, A.; Challacombe, M.; Gill, P. M. W.; Johnson, B.; Chen, W.; Wong, M. W.; Gonzalez, C.; Pople, J.
A.; “Gaussian 03, Revision C.02”, Gaussian, Inc., Wallingford, CT, 2004.
S2. (a) ADF: powerful DFT code for modeling molecules, http://www.scm.com/ADF/ (accessed Aug. 8, 2013). (b)
Senthilkumar, K.; Grozema, F. C.; Bickelhaupt, F. M.; Siebbeles, L. D. A. J. Chem. Phys. 2003, 119, 9809–9817.
(c) Prins, P.; Senthilkumar, K.; Grozema, F. C.; Jonkheijm, P.; Schenning, A. P. H. J.; Meijer, E. W.; Siebbeles, L.
D. A. J. Chem. Phys. B 2005, 109, 18267–18274.
S3. Laudise, R. A.; Kloc, C.; Simpkins, P. G.; Siegrist, T. J. Cryst. Growth 1998, 187, 449–454.
S4. (a) SHELXL (SHELX97): Sheldrick, G. M. Programs for the refinement of crystal structures. University of
Goettingen, Germany, 1997. (b) CrystalStructure. Version 4.0., Rigaku Corporation, Tokyo, Japan, 2011.