Embed Size (px)
Citation preview
S C H O O LC O N S O L I D A T I O N:K N O X V I L L E, T E N N E S S E E
a report on the state’s consolidated city and county school systems
Part II
July 2001
Marcus D. Pohlmann, Ph.D.Department of Political Science
Rhodes College2000 North Parkway
Memphis, Tennessee 38112(901) 843-384
School Consolidation: Knoxville, Tennessee65

School Consolidation: Knoxville, Tennessee66
C O N T E N T S – P A R T I I
I. Historical Context . . . . . . . . . . . . . . . . . . . . . . . . . . . . . . . . . . . . . . . 67
Governing StructuresEducational HistoryConsolidationThe AnnouncementThe CampaignThe Ballot IssueThe ResultsThe Aftermath
II. Consolidation Impact . . . . . . . . . . . . . . . . . . . . . . . . . . . . . . . . . . . . . . . 80
Educational QualityWas there educational disruption?Did consolidation create “flight”?Were there indications of increased racism?What was the impact on teachers?How was school governance affected?Educational EfficiencyWere educational costs decreased?Did taxes get raised?
III. Commentary . . . . . . . . . . . . . . . . . . . . . . . . . . . . . . . . . . . . . . . 96
IV. Tables . . . . . . . . . . . . . . . . . . . . . . . . . . . . . . . . . . . . . . . 99
Table 1. Educational QualityTable 2. Educational EfficiencyFigure 1. The Knoxville County Metropolitan Statistical AreaFigure 2. Knoxville County School Zones
V. Sources Consulted . . . . . . . . . . . . . . . . . . . . . . . . . . . . . . . . . . . . . . . 107
School Consolidation: Knoxville, Tennessee67
S C H O O L C O N S O L I D A T I O N:K N O X V I L L E, T E N N E S S E E
a report on the state’s consolidated city and county school systems
H I S T O R I C A L C O N T E X T
Prior to the Revolutionary War, the Knoxville area was claimed by North Carolina, but it was populated mostly by the Cherokee, who actually allied with the British in an attempt to maintain control over their homeland. Following the War, North Carolina and other local white settlers considered that the Cherokee had “forfeited” this land as a result of their alliance with the British. North Carolina was prepared to cede the land to the newly formed United States, however, in part to gain federal protection for the region’s politically connected settlers. To that end, North Carolina established a “land grab act” and sold off the area at a price of ten pounds per hundred acres. It then relinquished governance to the United States.
In 1791, local white settlers negotiated the Treaty of Holston with the Cherokee. The City of Knoxville was then founded, named after United States Secretary of War Henry Knox. Lying in the valley between the Cumberland and Great Smokey Mountains where the French Broad and Holston Rivers merge to create the Tennessee River, Knoxville became a frontier outpost and trading station under the protection of federal troops. Over the years, its location has allowed it to maintain a strategic commercial role in the eastern portion of the United States. Today, for example, it is located at the crossroads of interstates 40, 75, and 81.
Knoxville’s political leanings date back to disagreements with legendary Tennessee Democrat Andrew Jackson. Knoxville voters deserted the Democratic Party in the Presidential Election of 1836. At that point, the city became a Whig stronghold and actively supported federal assistance in advancing mass transportation routes. Persuading the national government to route the trans-continental railroad through Knoxville came to be a considerable boost to the city’s commercial ambitions.
The economic history of such mountain areas was very different from much of the rest of the South. With a terrain not conducive to cotton or tobacco plantations, there were more small farms and there was less demand for slaves.
68School Consolidation: Knoxville, Tennessee
The relatively small number of slaves who were used in this overwhelmingly white area tended to be farm hands and domestics. This was a more personal and paternalistic system of slavery than found in the large plantation settings. Not experiencing some of the worst of the brutality prevalent on many of those larger plantations, there was less incidence of slave militancy and violent revolt. Such realities have helped shape both the demographics and race relations in Knoxville.1
The posture of Knoxville and Knox County before and during the Civil War is also instructive in this regard. In many ways, Knoxville had become the capital city of the Mountain South. In the process, it attracted a relatively broad array of politicians, journalists, and industrialists. This combination of small mountain farmers and more cosmopolitan urbanites created a political climate noticeably different than found in the Old South. Not only had they become Whigs with a penchant for federal largesse, but they were far more inclined to support maintenance of the Union, despite a tempered support for the general principles of slavery and states’ rights.2
In the face of war, the more rural Knox County voted heavily against secession in 1861. The City of Knoxville supported it, although apparently more out of commercial expediency than conviction.3 During the war, local jails quickly filled with Unionist “bridge burners” who had attempted to destroy commercial arteries needed for the Confederate war effort. On September 1, 1863, Union troops captured the city and were greeted enthusiastically by local Unionists. The area would remain under Union control for the remainder of the war, although it would suffer as the center of several battles as well as experiencing violent attacks and counter attacks among its divided citizenry.
One upshot of all this was that the area became heavily Republican politically, with the secession-supporting elites comprising a minority Democratic Party. The Republicans could be counted on to “wave the bloody shirt” of war-time atrocities, while the Democrats would rail against the degradations of Reconstruction. Nevertheless, much of this subsided as the city turned its attention to industrialization. Meanwhile, the corresponding urbanization would attract a host of new residents. In the three decades from 1870 to the turn of the century, the city quadrupled its population from 8,000 to 32,000.4
In terms of race, it should be recalled that the area had a Manumission Society as well as a white abolitionist presence well before the Civil War. The Reverend Thomas Humes ran a school for free black children. And, Knoxville’s early fall to the Union troops also made it a logical destination for freedmen. Where the area had a relatively small African American population prior to the war, its black population grew noticeably thereafter.
School Consolidation: Knoxville, Tennessee69
There would continue to be ample evidence of racism, Jim Crow laws and practices, and even some racial attacks in 1919 and 1921; but, overall, blacks in Knoxville faced far less violent animosity than that found in much of the Old South.5 The local branch of the NAACP began its work in 1919. In addition, streetcars and many other public facilities were not segregated as they were in the Old South. Ironically, however, such race relations also had the effect of reducing the number of black entrepreneurs, as there would not be the necessity of black businesses to serve black customers.
The city voluntarily desegregated its libraries in 1950. The University of Tennessee at Knoxville began admitting black students in 1952 and was fully integrated by 1960. The Knoxville public schools desegregated with little incident in 1960, only a year after the first lawsuits were brought. Hotels, motels, theaters, restaurants, and hospitals followed in 1965. Nevertheless, continued economic discrimination, the legacies of Jim Crow, and the departure of many of the most talented young blacks, helped to leave the city’s African-American population disproportionately poor overall.6
The Great Depression ushered in a major new era in the area’s economic history, marked by a significant rise of government-related employment. In particular, the federal government created the Tennessee Valley Authority as well as the atomic energy complex at Oak Ridge. The University of Tennessee also was expanded considerably, in part thanks to the infusion of federal funds. With these additions came thousands of new managers and laborers from many areas of the country. One result was a cultural change bemoaned by some of the area’s long-standing residents. From a city whose bars served only beer, many closed by 9:30 p.m., and no movies or baseball games were allowed on Sunday, Knoxville approved liquor by the drink in 1972 and several similarly liberalizing measures thereafter.7
Knoxville has become the third largest city in Tennessee, with a population of roughly 175,000. It is located entirely within Knox County, sharing its “Metropolitan Statistical Area” with several surrounding rural counties. (See Figure 1.) Knox County has roughly twice the population of the city alone; and the MSA has become nearly twice again as populous as the county. Rapidly growing outlying areas include Oak Ridge in Anderson County, as well as Alcoa and Maryville in Blount County. Demographically, the city is roughly 16 percent black, while that figure is some ten percent for the county as a whole and seven percent for the MSA. The area’s African-American population resides primarily in the downtown Knoxville area, out Magnolia Street to the east, and in both the Mechanicsville and Lonsdale neighborhoods.
The area’s strategic location, diversified local economy, and diversified work force have allowed it to enjoy a relatively low unemployment rate. In 2000, for
School Consolidation: Knoxville, Tennessee70
instance, the Knoxville unemployment rate was only 2.3 percent, well below that of both the state and the nation as a whole. The western portion of the city has become its more affluent end, while the poorest areas are the housing projects located near downtown, north of the University of Tennessee campus.
Governing Structures
Knoxville initially functioned under an elected commission form of government until receiving its first city charter in 1815. At that point, the charter called for an elected governing board comprised of a mayor and board of alderman, all standing for reelection each year. By 1885, the city had both a streets and health department, a city hospital, police and fire protection, as well as contracts with private companies to provide street lighting, water, and streetcar service. Legislative authority remained in the hands of the board, but they added a board of public works to administer city services. The chair of that board was popularly elected, while the boards two associate members were appointed by the city commission.8
The city voted to abolish its charter in 1907, so as to reincorporate under prohibition. Reformers then succeeded in re-adopting a commission form of government in 1911, reuniting the legislative and executive functions under a single elected body and electing all commissioners citywide, thus abolishing the more politicized ward system. Twelve years later, they switched to a council-manager system in an attempt to further professionalize the administration of city services.
Despite reform efforts, local politics have normally been highly factionalized and intensely competitive. Elections have traditionally been nonpartisan, for example, although candidate party has normally been relatively easy to determine. By 1947, the council-manager form gave way to the present mayor-council governing arrangement and a home rule charter was added in 1954.
The present city governmental arrangement was adopted in 1968 and revised in 1982. It includes a mayor as well as nine city councilpersons, three of whom are elected at large. The other six are elected from districts, although they are nominated in a primary election and the top two finishers in each district are then voted on by the entire city electorate. The mayor and four council members are elected in the odd-numbered years before presidential elections, while the rest of the council is elected every four years in the other odd-numbered year. The terms are renewable.
The Knox County government evolved into a mayor-council system as well; and their politics have been much more openly partisan. The county commission is
School Consolidation: Knoxville, Tennessee71
comprised of 19 commissioners, elected from nine districts with District 5 providing three. The county executive and the entire commission stand for reelection every fourth year, the even-numbered years between presidential elections. The county was granted a home rule charter in 1988.
With the exception of certain services like a health care system which had been delivered countywide since first mandated by the state in 1928, Knox County has tended to provide services more for those living outside the boundaries of Knoxville proper. This city-county division of labor has also been reflected in the way the school system has been divided and governed.
By the mid-1980s, there were nine city school board members, three of whom were elected at large. The other six were elected from districts; although, like the city council, they were nominated in a primary election and the top two finishers in each district were then voted on by the entire city electorate. All served staggered four-year renewable terms and were paid $6,000 per year for their services. The city school superintendent was appointed by the board.
The county school board, by contrast, held elections every four years. At those junctures, they elected the superintendent, as well as electing all nine of its board members from districts. See Figure 2. All of these elected officials served renewable terms, and board members were paid $3,600 per year.
By state law, both boards functioned independently of their respective governments in matters of policy and curriculum. Nevertheless, the city and county governments were required to approve the school budgets proposed by their respective school boards.
In terms of racial representation, there were at least one and sometimes two black elected representatives in Knoxville from 1869 until 1890. That representation gradually disappeared during the days of Jim Crow laws, but it has since returned. In recent times, both the city and county commissions, as well as the city and county school boards, each had one predominantly black district which consistently maintained black representation in each body. These are is District 6 in the city and District 1 in the county.
Educational History
Prior to the Civil War, most education was conducted in private schools and academies. Following the war, although many of the wealthy continued to send their children to private schools, the county adopted a public school system in 1867, and the city followed suit in 1870. Several schools for blacks also sprang up during and after the war, many funded and taught either by northerners or the
School Consolidation: Knoxville, Tennessee72
Freedmen’s Bureau. Governmental funding for public schools remained minimal, but it was still higher than what could be found in most of the rest of the state. Overall enrollment was high as well, with 1869 finding 71.5 percent of whites and 76.35 of blacks in school.9
With the annexation of surrounding rural areas in 1897, the proportion of area children in school dropped noticeably. At that time, for instance, the county schools had an 80-day school session that provided ample opportunity for county school children to “pick peas, dig potatoes, sow wheat and pull fodder.” Nevertheless, attendance rebounded with the introduction of a compulsory attendance law in 1913; and today all of the state’s public schools have mandatory 180-day school year calendars.
Like the nation as a whole, Knoxville experienced a surge in students as the post-World War II Baby Boom generation reached school age in the 1950s. Although commencing roughly a decade later, Knox County like many other outlying areas not only had to deal with the Baby Boom, but it also had to accommodate those moving outward as part of the suburbanization trend beginning at the same time.
Many schools were built during this period, beginning with elementary schools and later secondary ones. Not even counting those schools that were renovated or enlarged to meet this demand, the City of Knoxville built eleven elementary schools in the 1950s, two junior highs in the 1960s, and two high schools in the late 1960s and early 1970s. Knox County, on the other hand, added six elementary and intermediate schools between 1960 and 1972. Four middle schools and three high schools were added between the mid-1960s and mid-1970s.
Annual birthrates began to taper off by the mid-1960s, however; and by the mid-1970s, those born at the tail end of the Baby Boom began leaving elementary school. This exodus left a good many elementary schools underutilized. By the early 1980s, some of these elementary schools were nearly empty. When this group began leaving high school, once again there was underutilization of facilities. Yet, just about the time school systems began to close elementary schools in the late 1970s, the children of the Baby Boomers began to reach elementary school age. By the mid-1980s, elementary schools were experiencing net increases once again.
This most recent series of student population ebbs and flows put a strain on the city and county school systems’ ability to adapt. By the mid-1980s, both were facing some hard decisions in terms of closing older and/or underutilized schools as well as adding schools and teachers to meet the latest surge of students and
School Consolidation: Knoxville, Tennessee73
the shifts in population locations. They would also have to decide how all of this was to be financed.
Yet, closing underutilized schools, building new ones, and redrawing district lines to best utilize existing resources was only one of the challenges school administrators and their school boards faced in the 1960s, 1970s and 1980s. There was also the issue of racial desegregation.
The Knoxville-area public schools had been racially segregated until a federal lawsuit was filed in 1959. After a hearing in February of 1960, the city was ordered to develop a desegregation plan. The city agreed to desegregate one grade each of the succeeding years, beginning with the youngest children. When the Sixth Circuit Court of Appeals demanded quicker compliance, the entire system ended up desegregated by 1964. By June of 1967, federal district Judge Robert Taylor dismissed the case, granting that “the board and school authorities are moving skillfully and with expedition toward the full integration of the Knoxville School System.”10 Although ordered by the Court of Appeals to continue monitoring compliance, the case was finally dismissed completely in 1973.
A primary desegregation device was the majority/minority transfer policy. By this formula, a student could transfer to a school where his or her presence would enhance the racial mix. In addition, the school system would provide transportation if necessary. As a hypothetical case-inpoint, if the overall school system was 20 percent black and a black student was in a school that was more than 20 percent black, that student could transfer to a school that had a black population of less than 20 percent. Court-ordered school busing was avoided in part because of this compromise. However, it was also avoided because the city did not possess a fleet of school buses and the racial imbalances in the schools were seen to have resulted from residential patterns and not overt governmental policy.11
Consolidation
Since the early 1950s, there have been several significant attempts to try and consolidate the City of Knoxville with Knox County. Nevertheless, all such consolidation efforts have ultimately been thwarted by local voters.
Following state authorization in 1957, the first of these consolidation referenda
took place in 1959. The switch was supported by the charter commission, most
members of the city and county governments, and both newspapers. It was
School Consolidation: Knoxville, Tennessee74
opposed primarily by city teachers and county workers. In the end, it was
defeated by a resounding 87 percent of the area voters.12
Despite incremental annexations over time, suburbanization occurred faster than the city could annex, particularly after World War II. Soon, the suburban areas contained a sizable majority of the county’s population, even though county services lagged. In response, Knoxville roughly tripled its geographic size by annexing many of those surrounding areas in 1962. In the process, it also increased its population by more than 50 percent, from 112,000 to 175,000.13
During this same period, there also have been separate attempts to formally consolidate the city and county schools. Those efforts have failed as well. In 1963, for instance, voters rejected school consolidation by a 55 percent to 45 percent vote. Three years later, they rejected it again, this time by a 65 percent to 35 percent margin.14
Nevertheless, the city annexations of the 1960s involved the annexation of some 30 county schools, including allegations that the city had “cherry-picked” those schools, drawing the lines to include some of the more desirable ones and exclude those that were less desirable.15 True or not, the impact on the well reputed county school system was significant. It had lost half its student body, and those schools remaining were far more rural overall. Some in the county schools began to fear that their school system was in the process of being “annexed into oblivion.” Consequently, many of these individuals supported the subsequently unsuccessful 1963 and 1966 referenda to merge the city and county schools.16
Mildred Doyle was the elected county school superintendent from 1945 to 1975, and her leadership and political savvy appear to have helped the county system survive the turmoil of the 1960s and even to rebound. Although accounts vary, the 1970s seem to have found the county more inclined to build its newest schools further and further on the outer rim of the county. Whether intentional or not, it served the purpose of making it more difficult for the city to annex such schools. She was ultimately defeated by Earl Hoffmeister, who would hold that position from 1976 through 1991. It would be Hoffmeister at the helm when consolidation would finally come to fruition by default in 1987.
As early as 1983, the City of Knoxville was showing signs of fiscal distress. The city and county library systems had merged in 1967, and the consolidated libraries were jointly funded by the city and county governments thereafter. Yet, in 1983, the city abruptly withdrew its support, leaving the library system entirely to the county.
School Consolidation: Knoxville, Tennessee75
Despite such moves, by the mid-1980s the city was facing a fiscal crisis. Voters had given city teachers attractive private pension boosts in lieu of salary raises. Yet because of an annual pension contribution cap included in its 1963 city charter, the city had fallen over $90 million behind in its pension funding obligations. A second major problem was that Knoxville had been using federal Revenue Sharing money to fund its schools’ general operating budget, and the curtailment of that federal program left the city in a further predicament.
Although those two were the most glaring problems, several other circumstances converged to further challenge the city’s fiscal solvency. The federal government also curtailed the Community Development Block Grant Program. The Tennessee Valley Authority reorganized, involving multiple layoffs. Knoxville faced the loss of revenues that had flowed from its hosting of the World’s Fair in the early 1980s. And, the city also had been deferring maintenance. They had, for example, postponed the removal of asbestos from several city schools for about as long as they could. It was increasingly clear that unless Knoxville could reduce its service obligations, it was facing a sizable property tax increase.17
Adding to the fluidity of the situation was a major upheaval on the city school board. Dubbed the “Gang of Five,” five well entrenched incumbents were defeated by a group of young political newcomers in the city school board elections of 1985. The newly elected board members were Steve Roberts, Gary Gordon, Judy Pratt, Pat Medley, and Ivan Harmon. Recognizing that they then had the potential to control board policy, this new majority began meeting regularly before they were even sworn in. The inaugural board meeting lasted an unprecedented three hours, and in that time the new majority managed to close schools, redraw some school zone lines to equalize enrollments, and make some personnel changes.18
Consolidation of the city and county school systems had been an issue raised at times during the 1985 campaign; but, even the newcomers figured any move in that direction would have to be a gradual process.19 Yet, recognizing that consolidation was becoming a very real possibility, the administrative staffs of the two school systems began to meet informally to discuss the logistics of such a conversion should it occur.20
Before such discussions and planning got much of anywhere, however, the city mayor and city council reached the conclusion that Knoxville needed to turn over its educational function to the county, despite county opposition. To that end, a referendum was ultimately placed on the 1986 city ballot. The 1986 charter reform vote to abolish the city school system was passed by the city of Knoxville voters by a relatively comfortable margin. This created a consolidated school system by default. What follows is a brief description of how that consolidation result finally came about.
School Consolidation: Knoxville, Tennessee76
School Consolidation: Knoxville, Tennessee77
Primary Players
Kyle Testerman, Knoxville MayorFred Bedelle, Superintendent of City SchoolsGene Overholt, Chair of City Board of EducationGary Gordon, sole African-American on City BoardA. L. “Pete” Lotts, Chair of County Board of EducationSam Anderson, sole African-American on County BoardSarah Moore Greene, head of local NAACPDorothy Hyder, representative of the Knoxville Education Association
The Announcement
In January of 1986, faced with a large budget deficit, Knoxville Mayor Kyle Testerman announced his intention to call for a charter amendment referendum. According to the mayor, if calling for such a vote was acceptable to the city council, county commission, and both the city and county school boards, it would appear on that November’s general election ballot. That election already promised a respectable turnout in that it would also include contested races for Governor and United States Congress.
The Campaign
Several of the battle lines were drawn early. Outside the city, for instance, there continued to be concern that city annexations might ultimately doom the county school system. Nevertheless, many suburban residents opposed consolidation because they were not anxious to take on the problems several Knoxville schools were seen as facing. Beyond deferred maintenance costs, these problems appeared in large part to be related to the fact that some of the county’s poorest residents lived in several of these troubled districts, districts that also happened to be disproportionately black. Meanwhile, there was considerable city opposition as well.
Within Knoxville, city teachers led much of the early opposition. They had a significantly more lucrative pension plan than did their county counterparts. For example, “Pension A” allowed city teachers employed before 1977 to be vested after five years and to retire at age 62 earning roughly 90-95 percent of their existing salaries. They feared that they would lose some of those benefits if consolidation occurred.
As the campaign unfolded, prominent opponents also included the Knoxville NAACP, Knoxville Area Labor Council, the Conference of Black Churches, Gary
School Consolidation: Knoxville, Tennessee78
Gordon, the only black city school board member, and the Knoxville Education Association.
Supporters were led by the “Knoxvillians for Better Schools;” and, this list ultimately included the Chamber of Commerce, both the city and county school board chairmen, the Knox County superintendent, both the city and county mayors, and the Knoxville News-Sentinel.
On February 25th of 1986, the city school board considered the Mayor’s consolidation proposal, including a clause that no referendum vote would occur until both school boards agreed. At its May 12th meeting, the city school board “adopted and approved” the idea of consolidation in principle, as set out in very general terms in a Transition Committee Report. This was done by voice vote, with the one recorded “no” being Gary Gordon, the board’s one black member. County superintendent A. L. “Pete” Lotts also noted that the county school board had indicated support for the plan earlier that evening. The referendum vote was now headed for the city’s November ballot.
Yet by October 13th, in light of the referendum’s specifics, or more correctly the lack thereof, and confronted by mounting opposition from city employees, city board chair Overholt asked for reconsideration of the board’s previous decision. County chairman Lotts promised no significant changes the first year; but, the city board reversed itself and called on Knoxville voters to reject the city referendum to surrender its school charter.
On October 31st, just days before the vote, the Knoxville NAACP and the Knoxville Area Labor Council announced their opposition. Meanwhile, County superintendent Lotts continued to reassure voters that he did not anticipate any school closings or boundary changes in the first year.21 City board chair Overholt supported the referendum despite his board’s opposition because “the city schools are chronically underfunded.”22 And county mayor Dwight Kessel conceded that the county will have to increase taxes, but he still saw consolidation as best for the county.23 Meanwhile, the county had promised repeatedly that it would employ all city school employees who wished to keep jobs, and it would recognize city seniority and tenure.24
African-American leaders responded with concerns about how the city’s minority of black children would be treated in a school system within which they would be an even smaller minority. For example, the only black city school board member, Gary Gordon, feared the consolidated system would end up being insensitive to black students and even less capable of providing them with the educations they needed. The Conference of Black Churches also opposed the referendum because there were just “too many question marks.”25
School Consolidation: Knoxville, Tennessee79

The Knoxville Education Association worried most about protecting the preferable pensions of its employees. They threatened a lawsuit, if necessary, to save them.26
Overall, as described by the Knoxville News-Sentinel, the campaign had become “a back alley brawl with no punches pulled . . . It is pitting neighbor against neighbor, political leader against political leader and community group against community group in an increasingly bitter and personal contest.”27 As one reporter noted, “Both sides agree that [the] battle has been ‘vicious.’”28 City school board chairman Overholt described the campaign as “clearly the most bitter fight that I have seen.”29
Examples included an allegation that information handed out to city school students on the Thursday before the election had been “slanted” against the referendum. Meanwhile, the mayor was being accused in one flyer of handing city assets over to his “big money friends;”30 and, a News-Sentinel editorial warned voters not to be “blinded by fear tactics of the city school employees.”31
The Ballot Issue
Abolishment of City School System
Shall the Charter of the City of Knoxville be amended so as to delete in their entirety the provisions of Art. VI and Art. XII and thus effectively abolish the City of Knoxville Public School System as more fully set forth in Ordinance No. 0-123-86 of the City of Knoxville as duly published?
The Results
City voters voted 56.5 percent - 43.5 percent to adopt the charter amendment for the “Abolishment of the City School System.” The highest levels of support were found in the more affluent west end, where the referendum passed by a 3-1 margin. The least supportive precincts were found in several predominantly inner-city districts, where African-American opposition had obviously remained strong.
The Aftermath
Although the city schools had formally gone out of business and thus surrendered their educational function to the county, many questions remained unanswered. Some of these could be addressed by county school officials, but several ended up in litigation. In particular, city teachers challenged certain
School Consolidation: Knoxville, Tennessee80
aspects of the merger that stood to harm them in ways they felt violated state law. The teachers were represented in court by the Tennessee Education Association.
The most pressing legal matter was what came to be referred to as the city schools’ “Plan A” pension system. This was a very generous private pension package that 650 active city teachers had been granted by the city since 1971. Besides local pension contributions, they received an annual state annuity that had originally been intended as a state reimbursement to the city but had been passed along directly to the teachers. At the time, the “Plan A” city teachers were the only teachers in the state receiving two pensions, at an additional local cost of some $5 million per year. County teachers and city teachers hired after 1976 simply received the regular state retirement package. That package included an annuity, but teachers had to pay into it, where Plan A teachers did not.32
In late May of 1987, scarcely more than a month before they were to take over and run the previous city school system, the county school board acted. Despite an opinion by Tennessee Attorney General Mike Cody that state law required the county to rehire all the city employees and keep their benefits intact,33 the county school board voted 5-4 not to rehire any of the 650 city school teachers receiving the “old pension system” unless the county commission voted to fund it. Faced with what already looked to be an 80 cent property tax increase just to fund the consolidated school system’s anticipated operating budget, the commissioners resisted an additional $5 million annual obligation.
In June, State Education Commissioner Charles Smith intervened in the pending challenges before the Chancery Court in Knoxville. He argued that the judge should stop the merger from occurring on July 1 unless pending issues were resolved. In particular, he argued that merging at this time would cause “irreparable harm” to educators, parents, and students. Knoxville Mayor Kyle Testerman was just as adamant in response, threatening to cease providing school services on June 30th, as the voters had legally decided to do, regardless of any state mandate or court order. Nevertheless, the state always had the option of withholding the $50 million it annually contributed to the Knoxville area schools until the matter was acceptably resolved.34
It was not actually until the very eve of the scheduled takeover that a local judge finally cleared the way for this to occur. Judge Frederick McDonald ruled on June 30th that city school administrators had no guarantee of their specific current positions, but their tenure and salaries would be retained. The city was responsible for paying off the millions it owed the city teachers’ pension fund, while all city teachers would be guaranteed their jobs, contracts, tenure, and
School Consolidation: Knoxville, Tennessee81
seniority. Meanwhile, nontenured, temporary and interim personnel had no guarantees and could be rehired at the consolidated schools’ discretion.
Instead of immediate equalization, both the city and county contracts would remain in place until they expired in 1989, even though this created some awkwardness. City teachers, for example, received dental insurance that county teachers did not. County teachers had more life insurance. The work day for city teachers was 45 minutes shorter. There were differences in pay scales, meaning at some ranks city teachers were paid more and at other ranks county teachers were better paid. They also had different holiday schedules, transfer policies, and so on. County school superintendent Earl Hoffmeister responded that the ruling would create a “nightmare.”35
Nonetheless, the newly consolidated Knox County Schools came into being on July 1, 1987. As Table 1 notes, it required merging 53 city and 42 county schools, as well as some 23,600 city and 26,500 county students. There was also the matter of combining roughly 1,300 teachers from each system, besides hundreds of administrators.
The first order of business for the consolidated school board was to plan for the merger of the city and county central office staffs. To that end, transition committees formed between the two boards and between the two staffs, operating under the leadership of a volunteer community leader by the name of Jack Walker. Recommendations were developed; but, in the end, the final decisions would have to be made by the county school board and the county commission.
Meanwhile, abolishing the city school system presented long-time consolidation supporters with an opportunity to accomplish one of the thorniest aspects of a full city-county merger, combining the two school systems. With much of the city and county already combined via annexation and with the schools merged, some felt the way had been paved for a subsequent full consolidation of the city and county. Local voters did not fall into line as expected, however, rejecting full consolidation in a 1996 referendum, as they had in 1983.36
C O N S O L I D A T I O N I M P A C T
The consolidated Knox County school system has been in existence for 14 school years. What follows is an attempt to assess some of the major changes that have occurred in Knoxville-area education since the consolidation event took place. Generally it will not be possible to prove causation, that is to prove that most of what has occurred is a direct result of consolidating the two school
School Consolidation: Knoxville, Tennessee82
systems. Nevertheless, it is still important to isolate trends that have come about in the wake of the merger.
This section has been divided into two main subsections. The first addresses measures of “educational quality” since consolidation. The second does the same for measures of operating efficiency.
Educational Quality
Did the quality of education improve?
Educational circumstances seem to be improving steadily in virtually every category reviewed. Student/teacher ratios have declined; per-pupil expenditures have increased; teacher qualifications have improved; more students have access to more programs, including the introduction of a magnet school arrangement; and city school students have additional supplies, transportation, and building improvements. The overall attendance rate has remained pretty much unchanged, however, while one problematic indicator is suspensions and expulsions, which have increased. Yet, the latter can be explained at least in part by the introduction of the state’s “zero tolerance” rule. What is harder to explain are the serious problems that continued to plague some of the system’s poorest schools long after the consolidation dust had settled.
Student-to-Teacher Ratio. As Table 1 indicates, there has been a steady decline in the student-to-teacher ratio. Part of that decline, however, has been mandated by a combination of the state’s Better Education Program and the Federal Educational Improvement Act. Nonetheless, the ratio had been trending downward prior to the full impact of those laws, and the consolidated school system actually employed nearly 200 new teachers immediately following the school merger as part of the equalization process. One system, for instance, may have been offering music or physical education options that the other had not been offering. These programs were then added to the other system’s offerings.
Per-Pupil Expenditures. There also has been an increase in per-pupil expenditures. Table 1 notes that such spending edged upwards in constant dollars until the 1997-1998 school year. Thereafter, that figure jumped remarkably. To begin, when combining city and county school spending, average expenditures had been increasing more than $200 per year immediately prior to consolidation. They then made their first quantum jump, when equalization involved raising the county schools closer to city-level expenditures per pupil.37 The latest surge, however, raising constant dollar spending to a level 43 percent higher than at the time of the merger, can be explained in part by last-
School Consolidation: Knoxville, Tennessee83
minute compliance with class sizes mandated by the federal government in its Education Improvement Act and the state in its Better Education Program respectively.
Teacher Qualifications. Using college degrees as an indicator of teaching quality, there also have been improvements. In the years prior to consolidation, the proportion of city school teachers with B.A. and M.A. degrees had actually been declining.38 The consolidated school averages are notably higher, however, especially the proportion of teachers with M.A. degrees. By 1996, the majority of the consolidated system’s teachers held a master’s degree or better.
Total Programs. City students gained access to some programs previously available only to county students and vice versa. In the end, however, the city students appeared to gain more on balance, as declining enrollment in their former school system had made it difficult to offer as comprehensive a curriculum as was found in the county schools at the time. Yet, many of these new programs were delayed a year for both budgetary reasons and so as to minimize disruption. The former city schools did immediately get driver’s education, however, as it paid for itself through student fees. In addition, a program to integrate children with handicaps into the regular classrooms was implemented in all the schools.
Magnet Schools. Five magnet schools were added between 1993 and 1997. All five are located in the inner-city, and transportation is provided. These are schools within schools. Each offers a unique set of curricular opportunities, and at very little additional cost to the school system. In-zone students get priority, then the remainder of the seats are filled by lottery, with attention paid to racial balance. Only Beaumont has specific admissions criteria, requiring the student to score a minimum of 85th percentile on the Bracken exam.
Indicated below are the five schools that contain magnet programs, the year they began, the proportion of their students in that program, the program’s incremental cost to the county schools, and the program’s academic emphasis.39
Beaumont Elementary, 1993, 19% (108/571), $37,000, honor’s academy.Green Elementary, 1994, 34% (175/511), $38,000, math/science.Sarah M. Green Elementary, 1996, 26% (178/698), $58,000, technology.Vine Middle, 1996, 57% (339/592), $109,000, science/performing arts.Austin-East High, 22% (169/775), $112,000, science/performing arts.
As the president of the Vine Middle School Parent-Teacher-Student Association put it, “I think Vine is one of the best schools in Knox County, and I think one of
School Consolidation: Knoxville, Tennessee84
the greatest things that has happened to the inner city has been the magnet school program. It has brought resources to our community that we would never have had without it . . . Until recently there were no dance studios in the inner city . . . Being part of the magnet school program has allowed one of my daughters to excel in dancing. She is part of the school’s dance company, and that has helped build her self esteem which has helped her in other areas of school.”40
Bus Transportation. Roughly 3,000 city school students became eligible for bus transportation; and, as noted earlier, bus transportation was provided for those opting for the magnet school alternative. Table 1 notes the increase in the total of daily one-way miles of transportation provided.41
School Improvements. Former city schools saw their budgets for paper, books and supplies triple almost immediately, reducing the need to have fund-raising campaigns in order to buy supplies. Beyond that, during the academic year after consolidation, the county spent more than $10 million on former city school buildings to install air conditioning, remove asbestos, and repair roofing.42
Attendance. Little change has been evident in attendance rates. Prior to consolidation, the city and county attendance rates were nearly identical, at between 94 and 95 percent. Since the merger, districtwide attendance has remained pretty much unchanged, at almost exactly that same 94 to 95 percent rate.43 See Table 1.
Disciplinary Action. On the negative side, however, suspensions and expulsions have increased markedly, indicating an increase in school disturbances. As Table 1 demonstrates, the number of “suspension incidents” nearly doubled from the point of consolidation. The number of expulsions has varied considerably, but the norm is far higher than occurred at the time of the merger. The main complicating factor in this regard, however, is that the state subsequently adopted a “zero tolerance” rule that mandated minimum penalties for a host of violations. Consequently, it is somewhat difficult to know if there are more instances of serious misbehavior now, or if there are simply more suspensions and expulsions being meted out for behavior that has been occurring all along.
Achievement. Although it was the impression of those closest to this process that achievement scores did improve as a result of consolidation;44
unfortunately, there was no dependable way to measure the impact of consolidation on achievement test scores in Knox County. The incremental redrawing of school boundary lines after the merger made it impossible to do a reliable longitudinal study of any particular school. Districtwide, the Stanford Achievement Test was used in both the city and county before the merger, but it
School Consolidation: Knoxville, Tennessee85
was discontinued after the 1988-89 academic year. That was two years after the merger, but it should be recalled that very little changed at the school level in the first year. Looking, then, for the impact on Stanford Achievement Test scores after one year of change did not seem empirically sound.
Inequities. Despite a lack of concrete achievement measures, a handful of the system’s poorest and heavily African-American schools continued to exhibit serious problems years after consolidation. Predominantly black Vine Middle School demonstrated critical on-going problems a full seven years after consolidation. PTSA president Joe Cody described the school as a “total mess.” A 1994 Knoxville News-Sentinel expose noted serious disciplinary problems such as a norm of suspending some 40 students a day in a school of fewer than 500 students. TCAP scores continued to hover at just better than half the county average. Building conditions also suggested a serious lack of maintenance.45
Although Vine would later show definite signs of improvement when converted to a magnet school, former city school board member Gary Gordon recently decried the condition of many of the county’s poor and predominantly black schools. He concluded that little has changed for the students in schools where teachers, administrators, and the general public seem resigned to a status quo that leaves many African American students almost hopelessly behind.46
Was there educational disruption?
To minimize the disruption and also to buy the central administration more time to plan, the decision was made early on to change virtually nothing the first year. Other than some transportation adjustments and a few new programs as part of equalization, everything looked pretty much the same. The children and teachers went back to the same schools they had gone to before the merger. Thereafter, however, many things did change; and that change created some disruption. Jobs changed; school zones got incrementally redrawn; some programs got shifted from one school to another; and old schools closed, while new ones were built.
Employees. In part thanks to position tenure and/or certification, no administrator, with the exception of the city superintendent, lost his or her job. Consequently, the norm was to create relatively comparable positions for the former city administrators, although usually slightly subordinate to his or her county counterpart, at least on paper. For example, there would become a “Lead Math Supervisor” who had previously held the Math Supervisor’s position in the county. The city counterpart would remain the “Math Supervisor” with comparable pay; and, the two would divvy up the responsibilities. Yet, there was also natural attrition, as well as city administrators opting for retirement. This
School Consolidation: Knoxville, Tennessee86
created some helpful flexibility in establishing needed jobs with clearer titles, responsibilities, and pay commensurate with the job.
The new system was required by state law to retain all “certified” employees, and they did so. As a matter of fact, in order to minimize overall disruption, essentially all teachers returned to their same classrooms for the first year.
Although not required by law, the consolidated schools also guaranteed jobs for non-certified employees such as secretaries, clerks, aides, and custodians. Again, an effort was made to minimize movement the first year. The student would return to school settings that appeared almost exactly as they had left them the previous Spring.
“Title I” Eligibility. One program not covered by state equalization requirements was the federal Title I program. Title I eligibility was determined by ranking the schools in the district according to those with the highest percentage of children eligible for free or reduced priced school meals. This meant that of the Title I schools the consolidated school system had the monies to fund, 34 of the 36 were located in the city. Ten county schools immediately lost their Title I eligibility, which had allowed them to hire 26 extra teachers and aides for reading and math. Five city schools then became eligible where they had not been when they were city schools.
Desegregation. The most disruption stemmed from issues of desegregation. Prior to the consolidation vote, Sarah Moore Greene, president of the Knoxville NAACP, warned that the referendum stood to upset the longstanding legal desegregation settlement reached between Knoxville and her organization. Failing to see an “equitable desegregation plan” set out in the consolidation proposal, she predicted that federal civil rights officials would have to reexamine the entire Knoxville area school desegregation arrangement should the referendum pass.
Once the referendum did pass, the newly consolidated county schools faced circumstances such as the following. There was one black high school principal, and he headed Austin-East High School which was 97 percent black. There were numerous schools that were more than 99 percent white. With only one exception, there were no white principals in predominantly black schools. Eleven of the area’s fifteen high schools had African-American enrollments below the county’s 13 percent average. Hundreds of students had been transferring out of their zones, often negatively effecting the zone’s racial balance. And so on.47
After negotiations with Superintendent Earl Hoffmeister broke down, a complaint was filed with the Office of Civil Rights (OCR) on June 15, 1989. It requested a
School Consolidation: Knoxville, Tennessee87
“Total Compliance Review.”48 A review occurred that fall, and it determined that the Knox County school system was discriminatory in its assignment of teachers and principals and also by its practice of too freely allowing transfers without attention to racial balance. Working with the OCR, the ultimate goal was to have an “Enhanced Educational Opportunity Plan” (EEOP) by the start of the 1991-92 school year. Among other things, the desegregation plan would utilize the magnet school concept as its centerpiece.
In April of 1991, after months of fits and starts, the school board adopted a final 23-school desegregation plan over the protests of some two hundred angry parents challenging unwanted school consolidations in their neighborhoods.49
The board, chaired by its lone African-American member Sam Anderson, adopted the plan which the OCR then accepted. In particular, it was to add magnet school optional programs to five of the schools with the highest proportion of African-American students: Austin-East High School, Vine Middle School, Green Elementary, Beaumont Elementary, and Sarah Greene Elementary. The goal was to have a 50-50 racial balance in each of the magnet programs except Beaumont, where the goal was 75 percent white and 25 percent black.50
In addition, some teachers and principals were transferred, and there were several school closings, start-ups and consolidations as boundary lines got drawn and redrawn to facilitate more school integration without having to resort to school busing for that purpose. A new tougher policy on student transfers was also adopted, and a real key was providing bus transportation from “pick-up points” for those students desiring to take advantage of the magnet school opportunities.51 Little of this could go into effect, however, without the necessary budgetary allocations from the county commission. And, in the end, the school board had to take the county commission to court before they finally went along one step ahead of a court order to comply.
The 1990 involuntary transfer of 52 teachers (see section 5 below) disrupted educational expectations for those students who had anticipated a particular teacher the following year. Nevertheless, it was not unusual for as many as 52 teachers not to return to their particular classrooms the following year due to reasons such as retirement, on leave, voluntarily transferring, or not being rehired.
Involuntary Student Transfers. For all intents and purposes, no students were involuntarily transferred from one existing school to another per se. Nevertheless, a combination of school closings, new school construction, and changes in school boundary lines ultimately resulted in some student movement.
School Consolidation: Knoxville, Tennessee88
Did consolidation create “flight”?
Public school student enrollment has grown, but not as fast as the county population as a whole. Filling the void, in part are private schools. Their enrollment doubled during this period, although it still remains relatively small by comparison. There is also evidence that the area population continues to move outward, many leaving Knox County altogether; yet, that outward flight has actually slowed some since the merger. Of those remaining in the county, the proportion that are African American has grown slightly. Meanwhile, the county’s public school student body is getting marginally blacker and marginally poorer.
Public School Enrollment. Student enrollment has grown by approximately 5 percent since consolidation, from about 49,500 students to roughly 52,000. See Table 1. But, at the same time, the Knox County population has grown by some 16 percent.52 That means that the county population is growing more than three times faster than the county school population. So, assuming that the number of school age children also has grown proportionately to the population growth as a whole, where are the extra students going to school?
Private School Enrollment. According to the Knoxville/Knox County Metropolitan Planning Commission, the number of private and parochial school students has more than doubled over this time period. There were 20 such schools in 1987, with a student population of roughly 3,000. Those numbers had grown to 21 and 4,000 by 1990; then 28 and 5,300 by 1998. There are now 52 private and parochial schools enrolling 6,700 area students. Two of the better known are Webb Academy and Knoxville Christian Academy.53
Population Trends. Another type of flight is flight out of the county altogether. Rather than losing people in this manner, however, Knox County has actually grown in population by 16 percent since the merger. Nevertheless, the entire metropolitan statistical area grew by 21 percent over that period. That means more of the area’s growth from 1986 to 2000 occurred outside the county than within it. Yet, looking at population growth between 1970 and 1986, the metropolitan area grew by 41 percent, while Knox County only grew by 19 percent. Consequently, since the merger, there appears to have been some stabilization of the population growth outside the county.54
Of the growth beyond the county line, only a small fraction of it appears to be traditional “white flight.” Since, 1970 for instance, Knox County has gone from 8.4 percent black to 9.6 percent. Meanwhile, the African American population in the metropolitan area has shrunk slightly from 6.8 percent to 6.5 percent.55
School Consolidation: Knoxville, Tennessee89
School Demography. In terms of race, the consolidated schools’ student body has gradually become slightly blacker. The proportion of county’s public school students who are African American grew from less than 12 percent at the time of consolidation to roughly 13.5 percent by 2000. Meanwhile, that population has gotten slightly poorer as well. Using the proportion of students receiving free or reduced-price school meals as an indicator of flight by better off students, Table 1 shows that percentage to have increased from less than 25 percent at the time of consolidation to a peak of 34 percent in 1997, and still more than 27 percent in 2000.
What these numbers fail to capture is “flight” within the school system itself. Part of the reason for tightening the student transfer policy in 1991 was to stem “white flight,” where white students would transfer to predominantly white schools to avoid neighborhood schools that contained more black students.56
Were there indicators of increased racism?
Despite the existence of the majority/minority transfer policy and the introduction of five magnet schools, there has been little change in the level of racial segregation in the county’s schools, a segregation that also appears to be economically related. In addition, apparent racial bias in the application of suspensions and expulsions are problematic as well, although this does not appear to be a phenomenon exclusive to post-consolidation Knox County.
Segregation. Focusing on the schools that were most racially segregated at the time of the school merger, the success of desegregation efforts has been mixed. Considerable racial concentration continues to occur despite the magnet school programs at five of them, the majority/minority transfer policy, and the closing of schools and redrawing of school zone lines. As a matter of fact, two of the magnet schools have become even more racially segregated.
Eastport Elementary was 98 percent black shortly after consolidation, and it no longer exists. Maynard Elementary was 96 percent black, and it remained 90 percent black by 2000. The comparable numbers for Austin East High School are 93 and 86; Vine Middle: 93 and 67; Green Elementary: 92 and 86; Fair Garden Elementary 89 and gone; Sara Moore Greene Elementary: 85 and 85; Chilhowee Elementary 64 and 22; Lonsdale Elementary: 54 and 65; Beardsley Middle 54 and gone; Holston High 51 and gone; Rule High 50 and gone; Spring Hill Middle 49 and gone; and Beaumont Elementary: 34 and 48.57
This phenomenon also seems to correlate with class segregation. The predominantly black schools, for instance, ended up as the schools with some of
School Consolidation: Knoxville, Tennessee90
the highest proportions of students qualifying for governmentally subsidized meals, a standard poverty measure. Maynard Elementary: 94 percent; Austin East: 67 percent; Vine: 69 percent; Green: 83 percent; Sarah Moore Green: 85 percent; Chilhowee Elementary 47 percent; Lonsdale: 90 percent; and Beaumont: 86 percent. Those numbers would probably have been higher yet, had it not been for the magnet programs in five of those six schools.58
The majority/minority transfer policy never seems to have been more than a very modest success. Prior to consolidation, for instance, a little better than 300 city students, slightly more than one percent, took advantage of this option in most years. There also was some concern on the part of black educators that those African-American students who did leave were often some of the brightest and most motivated at the schools they were departing, harming the latter schools in the process.59
Since then, the magnet school program was set up in part to try and attract more white students into five of the city’s six most racially segregated schools. Progress has been relatively slow. The year 1998 saw only 311 white students take advantage of this opportunity. That number jumped to 472 by 2000, although it still only represented slightly more than one percent of the white students in the county schools.
Disciplinary Bias. African American students have been suspended and expelled from the Knox County schools in numbers that far exceed their proportion of the student body. In the 1999-2000 school year, for instance, 20 percent of the county’s black students were suspended at least once, while that number was only 8.4 percent for whites. Over the course of only one school year, in ten of the county schools more than one third of the black students received at least one suspension. And, in one school, that figure was nearly one half.
There was also a difference in the types of offenses for which black students drew their suspensions. Blacks were far more likely to be suspended for violence or intimidation, while white suspensions tended to be more related to tardiness, cutting class, and tobacco.
Sam Anderson, the lone African American on the county school board voiced concern. “It’s not something new . . . This is a major problem for my community and my district and for all African Americans in Knox County and their parents. . . It’s hard to improve test scores if you’re suspending kids at that kind of rate.”60
Anderson went on to note that the county school system was nearly all white at the time of the merger, leaving them with far less experience dealing with racial differences than the city system had developed. Thus, he felt it essential that
School Consolidation: Knoxville, Tennessee91
any consolidated system include some African Americans in decision-making positions.61
It also should be noted, however, that many of the administrators delivering these disciplinary measures were African Americans themselves. In addition, such racial discrepancies are not unique to Knox County. Where the Knox County schools suspended 20 percent of their black students and 8.4 percent of their white students, those figures were 25 percent and 12 percent nationally; 10.7 and 5.3 statewide; 20 and 10 in Nashville; 12.7 and 6.2 in Chattanooga; 8.8 and 3.5 in Shelby County; and 6.6 and 2.9 in Memphis.62
What was the impact on teachers?
City school administrators were rehired if they desired to be, but most of them ended up at least marginally subordinate to their county counterparts. By contrast, for those teachers not subject to involuntary transfer as part of the desegregation plan, consolidation really did not change their lives very much at all. Nevertheless, the merger did produce some teacher morale problems, particularly related to general uncertainties, the involuntary transfers, and compensation issues. In addition, a pension conflict ended up in court. Over time, however, those problems seem to have worked themselves out, student-teacher ratios are down, and average teacher salaries have continued to climb.
Involuntary Transfers. As part of the desegregation plan described above, a sizable number of teachers ended up being involuntarily transferred for the purpose of better integrating the teacher corps at 26 racially identifiable schools. When few volunteered, a lottery was held on May 16, 1990; and 52 teachers were transferred in a process Knox County Education Association President Carolyn Smith watched and termed “horrible.”63 Nevertheless, only 4 of these teachers retired rather than fulfilling their 3-year obligation. Also, these were 52 teachers out of 2,800, which means more than 98 percent of city and county teachers were essentially able to remain in their post-consolidation school of choice.
Pension Controversy. Pensions were another major concern. As described at length in Section I above, the 650 city teachers receiving the more generous “Pension Plan A” benefits went to court after the county commission refused to fund the plan and the county school board then threatened not to rehire any of them. Yet, state law was interpreted as requiring the county to continue those benefits for city teachers who enjoyed them at the point of consolidation. In the end, then, more than 600 city teachers maintained their pension advantages; and city teachers as a whole received slightly higher
School Consolidation: Knoxville, Tennessee92
salaries when they switched over to the county schools’ salary scale. See Table 1.
Teacher Morale. Besides the morale problems surrounding the involuntary transfer and pension controversies, county teachers were upset when fiscal constraints threatened a pay increase they had previously negotiated with the county school board. There also was considerable “fear of the unknown,” with teachers worried about their job security and about being treated equitably. Uncertainties such as these caused a number of teachers to file grievances, retire, or seek employment outside the public schools.64
Teacher Salaries. The city and county salary scales were very similar. At the point of consolidation, the average teacher salary in the county was $23,138; while the corresponding figure was $22,556 in the city system. The pay ranges were also quite similar. In the county it was $15,820 - 28,920, while in the city it was 15,925 - 28,120. Thus, not much changed in this regard. City teachers ended up getting slightly higher salaries on average as a result of equalization. Yet, since the merger, average teacher salaries have risen more than 7 percent in constant dollars. See Table 1.
Student-Teacher Ratio. As Table 1 indicates, the public school student-teacher ratio has declined steadily since the merger. Beginning at roughly 18 students per teacher, that number was less than 16 by 2000. Not only does that suggest a marginally improved work load for the teacher, but it also contributes to the quality of education that teacher is able to provide.
How was school governance affected?
Essentially, the city school board ceased to exist, and the new consolidated system was governed by the county board. City administrators, except for the superintendent, were reassigned to roughly equivalent positions in the new administration.
City School Board. At the time of consolidation, there were nine city school board members. Three were elected at large and six from districts. There was one black-majority district. All served four-year renewable terms and were paid $6,000 per year for their services. The city school superintendent was appointed by the Board. Following the merger, the city school board simply ceased to exist, and the city superintendent became the one city employee to actually lose his job as a result of consolidating the schools. Positions were found for all the other city school employees who desired one.
School Consolidation: Knoxville, Tennessee93
County School Board. The county school system remained in place following the referendum. The superintendent continued to be elected countywide until state law recently required the position to be appointed by the board. The school board continued to be elected from nine districts, one of which had a black majority. See Figure 2. Board members continued to serve four-year renewable terms and were paid $3,600 until the county was subsequently granted a home rule charter and board pay increased to $17,000 per year. There also seem to be fewer entrenched incumbents. Since consolidation, it is no longer so unusual for incumbents to be defeated, as the politics seem more competitive and fluid.65
As the consolidated county school administration took shape, it was normally the official from the former county school system who was given the top job in any given area, while his or her city school counterpart who was given a parallel role or placed second in command. By 1990, the organizational structure for the consolidated county schools looked like this:
Superintendent
Assistant Superintendent Assistant SuperintendentBusiness and Administration Curriculum and Instruction
Facilities Personnel Pupils Supplemental VocationalDirector Director Director Director DirectorCoordinator Coordinator Coordinator Coordinator
CoordinatorSupervisors Supervisors Supervisors Supervisors Supervisors
Educational Efficiency
Was efficiency increased?
Yes. Two of the areas in which consolidation savings could be expected to appear are a reduction in administrative duplication and a better utilization of existing resources. There was indeed some evidence of both in Knox County following the school merger.
Duplication. Most notably, the number of central office administrators eventually did decline. Although all such administrators were guaranteed jobs following the referendum vote, attrition finally allowed the number to diminish. There were 94.5 central office administrators immediately following the merger, and that number had shrunk to 71 by the year 2000. As Table 2 notes, that meant a 37 percent increase in the number of students per central office administrator.
School Consolidation: Knoxville, Tennessee94
The central office’s share of the overall school budget also declined. Table 2 shows that number falling from 2.65 percent to 1.98 percent. That is a decrease of more than 25 percent; yet, the decline is less than would be expected from the number of administrators no longer employed. This suggests an increase in administrative costs per administrator.
Utilization. In the years since consolidation, there has been a net decline of 9 school buildings. See Table 1. Nevertheless, the number of teachers and the number of students have both increased. As would be expected, Table 2 shows how the average school size has increased. From 573 students per school prior to consolidation, that number has risen to approximately 650.66 Yet, this has been accomplished with few schools ending up “overcrowded” by state definition. That fact suggests more efficient utilization. However, this was accomplished in part by closing older, smaller schools and building larger ones in their places, as well as adding wings onto the more expandable of the existing schools. Beaumont Elementary is a good example of the latter phenomenon.67
In addition, as touched on earlier in the desegregation context, there have been individual school consolidations and changes in boundary lines. Beyond desegregation, however, this process also has been used to increase effective utilization. Each year, May and August enrollment numbers are analyzed to determine the degree of facility utilization per school. Each year as a result of this analysis, incremental changes in boundary lines are recommended to the superintendent and ultimately to the board. Some will be adopted each year, although it is generally several years between such changes for any given school. One particular incentive to do this effectively has been the maximum class sizes mandated by the state under its Better Education Program.68
Table 2 notes the particular benefits gained by students from the former county school system, where outward migration had left many of their schools seriously overcrowded. Prior to the merger, the county averaged 742 pupils per school, while the comparable city number was 455. Since consolidation, as indicated above, the consolidated schools’ average is roughly 650.
Were educational costs decreased?
No. In fact, constant dollar school expenditures have actually risen by 49 percent since consolidation occurred. See Table 2. There are several explanations for this increase. Given that most school spending is done in the classroom, there will not be revolutionary amounts of savings from consolidation, as all the existing students will still need to be taught. Also, equalization will likely mean additional
School Consolidation: Knoxville, Tennessee95
programs will be provided. Students will generally retain the programs they had and add ones the other system was enjoying that they were not.
Total Expenditures. As Table 2 indicates, the consolidated county schools budget has increased by 49 percent in constant dollars since the time of their merger. The initial operating budget proposal was for some $16 million more than the previous city and county school budgets combined. This included funding for items such as increases required by equalization, a teacher pay raise, and monies to cover the additional costs of pensions for former city teachers covered under “Pension Plan A.”69
Per-Pupil Expenditures. As would be expected, this growth in total spending is also reflected in per-pupil expenditures. As previously discussed, and observable in Table 1, a recent surge in per-pupil expenditures has raised constant dollar per-pupil spending to a level 43 percent higher than at the time of the consolidation.
Teacher Compensation. Education is a very labor-intensive endeavor. Thus, adding programs means adding personnel. As previously indicated, nearly 200 teachers were added the very first year after consolidation. In addition, equalization ultimately required some adjustments in teacher salaries. And, as a higher proportion of teachers has come to have advanced degrees, it costs the school system that much more in step-salary increases. As a result, teacher salaries increased by more than seven percent in real dollars over the period under review. See Table 1. Beyond that, the county schools were required by the court to raise some $2 million per year just to fund the former city teachers’ “Pension Fund A.”70
Transportation. Given its rural beginnings, the county had a tradition of providing school bus transportation from the student’s front door. The city, on the other hand, provided very little in the way of bus transportation to school. Consolidation would mean equalizing such service, and the compromise solution ended somewhere in between.
Under the new arrangement, county students would no longer get picked up at the door, and some ceased to qualify for bus transportation under the new formula. Meanwhile, a number of city students now qualified and had to be accommodated. Although the number of buses and the number of students being transported actually dropped slightly the first few years after consolidation, they would increase as a result of the various desegregation efforts that would follow, especially the magnet school program.
School Consolidation: Knoxville, Tennessee96
As a result, the daily one-way miles of transportation provided increased by nearly 35 percent from the combined city and county total the year before consolidation to the 1999-2000 academic year. See Table 1.
Renovation. Between 1988 and 1989, as previously indicated, the county spent some $10 million to repair decaying city school buildings. Some of the more costly maintenance involved installing air conditioning, removing asbestos and repairing roofs - expenditures that the city was likely to have had to have made eventually anyway.71
Limits. By 1991, the county asked the city for $1 million to help close a $9.5 million shortfall in the consolidated school budget. The city rejected that request, and the county subsequently cut some employees and several school programs for the 1991-92 academic year.72
Did taxes get raised?
Yes. Both property and sales taxes have increased since consolidation, as well as the schools’ proportion of each. However, not all of all of these increases were merger related. Part was needed to compensate for the fact that the previous budget had been funded by some federal monies that no longer existed and from some city and county savings accounts.
External Revenue Sources. In the course of the 1980s, the federal government ended its Revenue Sharing program, and Community Development Block Grants were scaled back significantly. These developments contributed to an overall decline in the proportion of county school money coming from the federal government. The state proportion has declined somewhat as well, leaving the local area to raise an increasing proportion of its own school revenues. As Table 2 indicates, Knox County’s share has risen from 51 percent to 59 percent since the time of their merger.
Property Taxes. With school expenditures increasing by 49 percent in constant dollars since consolidation, and with the state and federal governments contributing smaller shares, local tax revenues had to go up to cover that cost. And they did. When you combine city and county property tax rates, the overall community-wide rate has changed very little. It was 5.67 at the time of the merger, and it rose to 6.36 by 2000. See Table 2. That is scarcely more than a 12 percent increase over 14 years, or less than one percent per year.
It is important to note, however, that there is a difference in the consolidation burden born by city and non-city residents. The city’s property tax rate actually declined slightly, from 3.40 to 3.04; while the county’s increased from 2.27 to
School Consolidation: Knoxville, Tennessee97
3.32 over the same time period. See Table 2. But, it should be remembered that city residents have paid both from the beginning. So, overall, their tax burden rose slightly as indicated in the combined rate above. Non-city residents saw their property taxes increased by 46 percent, but they were still paying only the county tax.
Focusing on that portion of all property taxes that go to the schools, the school millage rate has risen from $0.84 to $1.43 since consolidation. That is a 70 percent increase. Meanwhile, when the city went out of the public school business, it no longer expended any money for schools, with the exception of having to meet the court’s order to continue contributing to the “old” city teacher pension plan for a set period of time. The county doubled the number of students it was serving; but, the county property tax rate did not double because the county was already providing more than 40 percent of the city school revenues prior to the merger.
Sales Taxes. At the time of the merger, the total sales tax burden in Knox County was seven percent, of which 1.25 percent went to the schools. Within three years, those numbers had risen to 7.75 and 1.625. As of 2001, they were 8.25 and 1.625.73
C O M M E N T A R Y
What follows are some of the more common thoughts and sentiments of individuals interviewed and secondary accounts reviewed.
With only one exception, everyone interviewed and most all secondary accounts indicated satisfaction with the merger once the various transition problems were addressed. The perceived advantages included an improved ability to concentrate resources more efficiently for meeting student needs, more flexibility allowing for less crowding and more facility sharing, and equalization which tended to mean that city students got programs that were provided exclusively for the county students before consolidation and vice versa.
Every account concurred that the way Knox County arrived at consolidation was not the way it should be done. They definitely do not recommend having the city school system simply surrender its charter, creating consolidation by default. Without a plan, there ends up being unnecessary uncertainty, fear, litigation, and so on.
According to a panel of teachers closely involved throughout the merger, to achieve successful consolidation there is a need for strong central leadership,
School Consolidation: Knoxville, Tennessee98
and it is essential to outline legitimate reasons for consolidating; have the two school boards mutually plan for the change at least a year in advance; develop a planning group that includes community members, teachers, and principals; develop a detailed timetable for making needed changes; equitably treat all parties; and avoid duplicate positions. It is also important to do all this openly, utilizing the media; have a consolidation hotline; and employ human resources specialists to help counsel teachers and students.74
Consolidating school systems may upset the existing desegregation arrangement, at least temporarily. If one of the consolidating systems has many exclusively white schools and the other has several that are almost exclusively black, and if the teaching and administrative staffs reflect those racial divisions, there is a chance this arrangement may be challenged as discriminatory unless a new desegregation plan is developed. Having said that, the prospect of court-ordered school busing as an alternative is essentially nonexistent. Instead, any such desegregation plan may involve some redrawing of school zones, the creation of more magnet schools with transportation as necessary, and more attention to placing new schools in locations that facilitate racial integration. At the very least, it is likely to require equalization of curricular offerings.
It is best to do such desegregation planning openly and voluntarily at the front end, rather than waiting for prompting from either the Office of Civil Rights or a federal judge. It is also seen as important to take economic class into consideration as well. In other words, it is important to try to devise a plan which disperses low income children to different schools, not concentrating them in a handful of schools.75
Although there will be some savings eventually in terms of reducing the number of central office administrators; there also will be added costs involved in the process of equalization. In the end, there is not likely to be a net reduction in overall school spending. If anything, there may well be a net increase in expenditures.
It is important to be prepared for some disruption as services get reallocated to where they are most needed. Lower-income county schools, for example, may lose their Title I programs in order to provide such services to even more needy inner-city schools currently unserved because of their respective ranking in the city system.
There also may be culturally based disagreements between city and county teachers and administrators over various curricular and extracurricular priorities. In Knoxville, for example, the city system placed a higher priority on middle school athletics, elementary school band, sex education, and certain technical programs. These disagreements will have to be resolved.76
School Consolidation: Knoxville, Tennessee99
In addition, it should be noted that just prior to the merger, there was a rumor that a deal had been quietly arranged whereby the city system would increase teacher wages and benefits and the county would do likewise for their administrators. Then, following consolidation, equalization would allow county teachers and city administrators to gain these as well. There is no reason to believe that was anything but a rumor. Nevertheless, it is still important to watch for such things should consolidation end up being an announced and phased-in process.
Finally, looking beyond the opinions of education professionals, politicians, interest group leaders, and the media, the limited public opinion polling that has been done actually depicts a less than glowing endorsement of the Knoxville-area public schools. Local schools were considered personally “essential” or at least “very important” by more than 85 percent of those Knox County residents surveyed, while that percentage rose to 97 percent when asked the importance of schools to the community as a whole. Yet, only about one half considered Knox County schools to be “good” or “excellent.” Approximately the same number rated them as “fair” or “poor.” Demographically, the African-American neighborhoods were least supportive of existing schools, while the wealthier city neighborhoods and some of those furthest out in the suburbs tended to be most supportive. Comparatively, schools rated higher than road maintenance but lower than police, libraries, and public health services. Nevertheless, it also should be noted that this polling did not begin until 1995; there are no comparable measures before consolidation; and there is no way to tell the opinion of only those who have had first-hand experience with the system.77
School Consolidation: Knoxville, Tennessee100
Table I: Educational Quality
Category
School Year
86-8
7 (
city
)
86-8
7 (
co.)
‘86-
‘87
(to
t.)
1987
– 8
8
1988
– 8
9
1989
– 9
0
1990
– 9
1
1991
– 9
2
1992
– 9
3
1993
– 9
4
1994
– 9
5
1995
– 9
6
1996
– 9
7
1997
– 9
8
1998
– 9
9
1999
- 2
000
Student Enrollment
23,6
11
26,5
41
50,1
52
50,2
32
52,5
33
49,8
67
50,1
27
50,3
24
****
**
51,5
46
51,9
53
52,2
77
52,3
71
51,9
82
51,3
74
****
**
Number of Schools K-12 plus Spec. Schools 50
+3
=53
35+
7=
42
85+
10=
95
85+
8=
93
87+
7=
94
90+
5=
95
87+
6=
93
81+
5=
86
84+
4=
88
82+
6=
88
80+
7=
87
79+
7=
86
78+
6=
84
78+
7=
85
78+
7=
85
80+
6=
86
Student/Teacher Ratio 20
.6
17.6
19.1
17.9
18.6
17.8
18.1
18.0
****
17.5
17.6
17.2
16.6
16.0
15.8
15.6
Per-Pupil Expenditures (constant dollars) 4,
561
3,83
4
4,17
5
4,88
9
****
5,14
6
5,00
9
4,76
1
5,12
3
5,10
4
5,07
0
5,19
8
5,28
4
5,00
7
5,83
1
5,97
5
Daily One-Way Transportation Miles
752
8,43
5
9,18
7
8,62
0
8,73
7
8,92
7
****
9,13
2
9,24
3
9,06
4
****
9,71
9
10,2
92
10,1
84
10,3
77
12,3
82
Attendance Rate (K-12)
93.8
94.6
94.3
93.2
92.9
93.4
93.4
92.9
92.4
92.4
92.8
93.9
94.0
94.2
94.7
****
Suspension Incidents
****
****
****
****
5,86
5
6,98
4
7,21
3
8,28
7
9,58
2
10,2
42
10,4
70
9,84
7
10,8
42
9,46
4
10,6
11
9,75
2
Students Expelled
***
***
***
***
1 13 29 16 39 ***
24 53 62 111
***
34
Students Receiving Free or Subsidized Meals (%) 36
.8a
4.6a
19.6
a
24.5
26.0
26.0
26.3
27.0
****
*
28.5
29.6
30.8
33.7
29.0
28.7
27.4
Average Teacher Salary (constant dollars) 34,1
44
35,0
25
34,5
93
34,2
62
35,7
53
35,8
46
35,6
44
34,1
42
33,1
40
34.0
32
35,1
74
36,0
42
36,0
28
35,6
67
35,8
70
36,7
15
* a note: 1985-86 data were used here, as the 1986-87 data were unavailable
101School Consolidation: Knoxville, Tennessee
Table 2: Educational Efficiency
Category
School Year
86-8
7 (
city
)
86-8
7 (
co.)
‘86-
‘87
(to
t.)
1987
– 8
8
1988
– 8
9
1989
– 9
0
1990
– 9
1
1991
– 9
2
1992
– 9
3
1993
– 9
4
1994
– 9
5
1995
– 9
6
1996
– 9
7
1997
– 9
8
1998
– 9
9
1999
- 2
000
Central Office Staff per Student
****
*
****
*
****
*
531.
6
644.
6
590.
1
586.
3
649.
3
****
*
624.
8
697.
4
692.
4
717.
4
722.
0
723.
6
728.
3
Central Office Expenditures as a Percentage of the Total School Budget **
**
****
****
2.65
2.61
2.72
2.63
2.44
2.31
2.35
2.14
2.11
2.07
2.07
2.01
1.98
Average School Size (K-12)
455
742
573
577
590
543
564
605
***
618
630
643
653
649
641
***
Total Current Expenditures(constant dollars)
87
,59
4,57
9
93
,63
9,22
9
197,
171
,174
222,
083
,607
229,
045
,671
239,
347
,132
234,
513
,156
222,
376
,672
242,
575
,587
242,
818
,306
244,
015
,752
254,
836
,962
259,
747
,927
260,
277
,887
283,
607
,608
293,
395
,590
Property Tax Rate (city plus county)
N.A
.
N.A
.
5.67
6.16
6.15
6.09
6.58
6.58
6.81
5.78
5.78
6.03
5.74
5.62
5.62
6.36
Property Tax Rate (city)
3.40
N.A
.
N.A
.
3.40
3.24
3.24
3.51
3.51
3.51
2.87
2.87
2.87
2.58
2.85
2.85
3.04
Property Tax Rate (co.)
N.A
.
2.27
N.A
.
2.76
2.91
2.85
3.07
3.07
3.30
2.91
2.91
3.16
3.16
2.77
2.77
3.32
School Revenues from Local Sources (%)
** ** ** 51 51 51 ** 56 49 53 52 52 52 52 54 59
* a note: 1985-86 data were used here, as the 1986-87 data were unavailable
School Consolidation: Knoxville, Tennessee102
Figure 1. The Knoxville Metropolitan Statistical Area
School Consolidation: Knoxville, Tennessee112
Figure 2. Knoxville County School Zones
School Consolidation: Knoxville, Tennessee113
S O U R C E S C O N S U L T E D
Anderson, Lonell, Jr.,“An Analysis of Student Academic Achievement, Self-Concept and Self-Reliance as Related to School Social Structure and School Social Inputs in Knox County and Knoxville City Schools,” E.Ed. dissertation, University of Tennessee at Knoxville, March 1982.
Bean, Betty, Project Change: Knoxville, Tennessee - Opportunities for Racial Unity in the 21st Century (Knoxville, Tennessee: Public Media Center, 1995).
Booker, Robert J., Two Hundred Years of Black Culture in Knoxville, Tennessee (Virginia Beach, VA.: The Donning Co. Publishers, 1993).
Daves, J. H., A Social Study of the Colored Population of Knoxville, Tennessee (Knoxville, Tennessee, 1926).
Deaderick, Lucille, Heart of the Valley: A History of Knoxville, Tennessee (Knoxville: East Tennessee Historical Society, 1976).
Gray, Aelred J.and Mrs. Susan F.Adams, “Government,” in Lucille Deaderick, Heart of the Valley (Knoxville: East Tennessee Historical Society, 1976), Chapter 2.
Gunther, John, Inside U.S.A. (New York and London: Harper and Brothers, 1947).
Howard, George C. and Edith Foster Howard, “City-County Educational Relationships in Tennessee” (Knoxville: University of Tennessee Bureau of Public Administration, February 1950).
Joyce, Debra Denise, “A Per Pupil Expenditure and Competency Test Performance Study of 9th Graders From Shelby, Davidson, Knox, and hamilton County School Systems,” E.Ed. dissertation, Tennessee State University, August 1997.
Kelley, Paul, “Education,” in Lucille Deaderick, Heart of the Valley (Knoxville: East Tennessee Historical Society, 1976), Chapter 5.
School Consolidation: Knoxville, Tennessee114
Kern, J. Harvey, Social and Economic Conditions in Knoxville, Tennessee, As They Affect the Negro (Southern Regional Office, National Urban League, October, November, December, 1967).
Knox County Public Schools, Annual Statistical Report (Knoxville: Government Printing Office, various years).
Knoxville Journal.
Knoxville News-Sentinel.
Knoxville Public Schools, Annual Statistical Report (Knoxville: Government Printing Office, various years).
Knoxville/Knox County Metropolitan Planning Commission, Knoxville Area Facts and Figures (Knoxville: Government Printing Office, various years).
Lyons, William, and John Scheb, “Saying No,” State and Local Government Review (Spring 1998).
MacArthur, William J., Jr., “Knoxville’s History: An Interpretation,” in Lucille Deaderick, Heart of the Valley (Knoxville: East Tennessee Historical Society, 1976), Chapter 1.
McComb, Thomas and Martha Donaldson, “Knoxville-Knox County Consolidation and the County and City School Systems,” Bureau of Public Administration, University of Tennessee at Knoxville, August 1958.
McDonald, Michael J. and William B. Wheeler, Knoxville, Tennessee: Continuity and Change in an Appalachian City (Knoxville, TN.: University of Tennessee Press, 1983.
Peach, Larry Eugene, “Perceptions of Participation in Decision Making and Satisfaction With Decisions Made in the Knox School System,” E.Ed. dissertation, University of Tennessee at Knoxville, August 1978.
Rothrock, Mary U., The French Broad-Holston Country; A History of Knox County, Tennessee (Knoxville: East Tennessee Historical Society, 1946).
Stanfield, John, “White and Black Inequality in Urban Appalachia: The Case of Knoxville, Tennessee,” in Edward Miller and Robert Wolensky, ed., Proceedings of the Fourth Conference on the Small City and Regional Community (University of Wisconsin - Stevens Point, 1981).
School Consolidation: Knoxville, Tennessee115
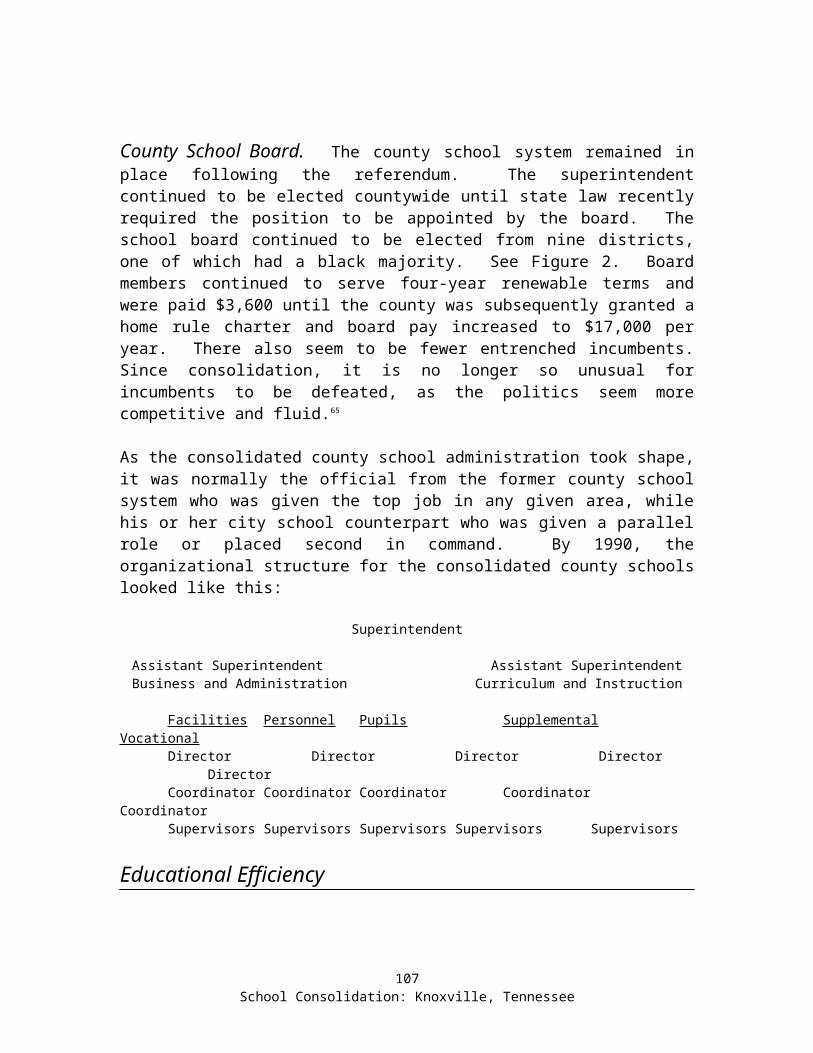
Tennessee Education Association and Appalachia Educational Laboratory, Maintaining Positive Educator Morale During Consolidation (Washington, D.C.: U.S. Department of Education, May 1988).
Tennessee State Board of Education, Annual Report Card of the Knox County Schools (Nashville: Government Printing Office, various years).
United States Department of Commerce, Bureau of the Census, Census of the Population (Washington, D.C.: Government Printing Office, various years).
United States Department of Commerce, Bureau of the Census, City and County Data Book (Washington, D.C.: Government Printing Office, various years).
United States Department of Commerce, Bureau of the Census, Statistical Abstracts of the United States (Washington, D.C.: Government Printing Office, various years).
Williams, Samuel Cole, History of the Lost State of Franklin (Johnson City, TN.: The Watauga Press, 1924)
Reports
“Budget Summary,” Knox County Department of Finance and Administration.
“Budget Survey” polling data, prepared for both Knox County and the City of Knoxville by William Lyons and John Scheb, University of Tennessee at Knoxville.
“Combined School Membership,” Office of Research and Evaluation, Knox County Board of Education.
“Combined State and Local Teacher Salary Schedules, Knox County Schools.
“Development Activity: A Summary of 1997 Development Trends in Knoxville and Knox County, Tennessee,”Knoxville/Knox County Metropolitan Planning Commission, 1998.
“Economic Data: Knoxville Standard Metropolitan Statistical Area,”Knoxville/Knox County Metropolitan Planning Commission, September 1995.
“Education: Summary and Issues,”Knoxville/Knox County Metropolitan Planning Commission, 1990.
School Consolidation: Knoxville, Tennessee116
“Free and Reduced Meals: Membership Comparison Report, Knox County Food Service.
“Goodspeed's History of Tennessee” (Nashville, TN.: Charles and Randy Elders Booksellers, 1972).
“Historical Patterns of Social and Economic Discrimination Against African Americans in Knoxville, unpublished report prepared by George White and Gary Gordon, 1999.
“Knox County Schools Population and Enrollment Trends Study,” Knoxville/Knox County Metropolitan Planning Commission, March 1988.
“Knox County Schools Standardized Test Results,” Office of Research and Evaluation, Knox County Board of Education.
“Knoxville Area Facts and Figures,” Knoxville/Knox County Metropolitan Planning Commission.
“The Metro Economy: Profile of Growth in Knox and Surrounding Counties,” Knoxville/Knox County Metropolitan Planning Commission, October 27, 1997.
Extended Interviews
Anderson, Sam: May 24, 2001. Sam taught and coached in the city schools; became the city’s Director of Parks and Recreation, the first African American to hold such an office in Knoxville; and he was elected to the consolidated county school board in May of 1988, where he remains its only African American member.
Bratton, Sam: May 23, 2001. Sam taught in the county for six years and then worked in the central office of the county schools for nearly 40 years, serving much of that time as its Coordinator for Research and Evaluation.
Gordon, Gary: June 12, 2001. Gary grew up in Knoxville and was the second African American to graduate from Webb Academy there. He worked as a consultant for several governmental agencies including the TVA; and he was one of the five newcomers elected to the city board of education in 1985, serving at the time of consolidation.
Lyons, William: April 29, 2001. Bill is a professor of Political Science at the University of Tennessee at Knoxville, hosts a local political television program, and has done several polls for the city and county governments.
School Consolidation: Knoxville, Tennessee117
Mullins, Roy: June 13, 2001. Roy has spent 40 years in the county school system, beginning as a teacher, principal, and then Superintendent of Human Resources. He was interim county school superintendent for the 1988-1989 academic year. And, he is currently the county school’s Assistant Superintendent for Administrative Services.
Roberts, Steve: May 24, 2001. Steve became the Deputy Director of the Public Service Department after teaching in the city schools and working for a state agency. He was the leader of the five newcomers who formed the city school board majority at the time of consolidation.
Smith, Carolyn: June 13, 2001. Carolyn has taught locally for the past 27 years and was the first president of the newly consolidated Knox County Education Association in 1987.
Winstead, Mike: April 27, 2001. Mike succeeded Sam Bratton as the County School’s Coordinator of Research and Evaluation.
School Consolidation: Knoxville, Tennessee118

S C H O O LC O N S O L I D A T I O N:C H A T T A N O O G A, T E N N E S
S E Ea report on the state’s first merger between city and
county school systems
Part III
July 2001
Ken Goings, Ph.D.History Department
College of Arts and SciencesThe University of Memphis
Mitchell HallMemphis, Tennessee 38152
(901) 678-2515
School Consolidation: Knoxville, Tennessee119
School Consolidation: Knoxville, Tennessee120
C O N T E N T S – P A R T I I I
I. Process . . . . . . . . . . . . . . . . . . . . . . . . . . . . . . . . . . . . . . . . . . . . . . . . . 114
City and County HistoriesCity, County, and School Governing StructuresSchools’ Funding Formula/ProcessHistory of the Consolidation Movement and Final Conversion
II. Consolidation Impact . . . . . . . . . . . . . . . . . . . . . . . . . . . . . . . . . . . . . . . . . . . 130
Student DemographicsTable 1. Racial Makeup of Students by School System for School Years
1994-95 through 1999-2000Graph 1. White Student Population Before MergerGraph 2. Black Student Population Before MergerGraph 3. White vs. Black Student PopulationTable 2. Private & Home School Student Populations vs. Public School
Student PopulationsGraph 4. Public vs. Private School Enrollment, School Years 1994-95
through 1999-2000Table 3. Administrative and Support Personnel in Hamilton County School
SystemTable 4. Funding Sources for Hamilton County & Chattanooga City
Schools for School Years 1994-95 through 2000-01Graph 5. State Funding Before & After ConsolidationGraph 6. Local Funding Before & After ConsolidationGraph 7. Federal Funding Before & After ConsolidationGraph 8. Total Funding From All Sources Before & After ConsolidationTable 5. Operational Expenditures & Per Pupil ExpendituresGraph 9. Per Pupil Expenditures
Table 6. Average Salaries for Hamilton County & Chattanooga City School Teachers for School Years 1994-95 through 1999-2000
Graph 10. Average Teacher SalariesTable 7. Attendance Rate of Hamilton County & Chattanooga City Schools
for School Years 1994-95 through 1999-2000Table 8. Drop Out, Expulsion & Suspension Rates for Hamilton County &
Chattanooga City Schools for School Years 1994-95 through 1999- 2000
Graph 11. Overall Dropout RatesGraph 12. Overall Expulsion RatesGraph 13. Overall Suspension Rates
III. Sources Consulted . . . . . . . . . . . . . . . . . . . . . . . . . . . . . . . . . . . . . . . . . . . 160
School Consolidation: Knoxville, Tennessee121
School Consolidation: Knoxville, Tennessee122
S C H O O L C O N S O L I D A T I O N:C H A T T A N O O G A, T E N N E S S E E
a report on the state’s consolidated city and county school systems
P R O C E S S
City and County Histories
Chattanooga
Chattanooga holds the distinction of being Tennessee’s fourth largest city. Beginning in approximately 6,000 BC and continuing into the early 1800s, the area around present-day Chattanooga was first inhabited by a succession of Native Americans cultures, culminating with the Cherokee. The Cherokee, naming the area “Chado-na-ugsa,” or “rock that comes to a point,” because of its nearness to Lookout Mountain, were virtually non-existent by the early 1830s when the first permanent White settlers had established a trading post at Ross’s Landing.78 Located where the foot of present-day Broad Street meets the Tennessee River, Ross’s Landing began with an original population of fifty-three families, grew steadily to become a center for river traffic and commerce, and incorporated as the town of Chattanooga in 1839.
Although its importance as a river port continued, it was the railroad that brought both great prosperity and destruction to Chattanooga. Eventually becoming known as the site “where cotton meets corn,” the first railroad, the Western and Atlantic, reached Chattanooga in 1850 and by 1860 the town had become a virtual gateway to the Deep South.79 Because of this economic and commercial relationship with their neighbors to the South, many of Chattanooga’s people also “shared that region’s social, political, cultural, and commercial tendencies.”80 Regional ties became even more apparent when, after the majority of East Tennessee voted to remain with the Union in 1861, Chattanoogans decided to go with the Confederacy.
Confederate troops, first entering the city in 1861 to protect it from Unionist forces from East Tennessee, converted it into a vital Confederate supply depot and administrative center by 1863. Unfortunately, its importance also gained Chattanooga the attention of Union forces, which began a series of campaigns against it in the fall of that same year. Fearing Union occupation, the majority of
School Consolidation: Knoxville, Tennessee123
Chattanooga’s population fled the city, leaving it virtually abandoned to the military forces. Culminating in the bloody battles of Chickamauga and Chattanooga, Union forces subdued the city in November 1863 and, within only a few weeks, once again had the transportation infrastructure reestablished an operational. During Sherman’s March into Georgia and South Carolina, the city became the staging area for this vast army, serving as a both the main supply depot and hospital.
After the Civil War, Northern officers who had were stationed in the city and had taken stock of its transportation and natural resources, returned to establish commercial and manufacturing businesses. As well as possessing great amount of economic and financial power, these Northerners also wielded political hegemony as well. During the decades of the 1870s and 1880s, Republicans controlled virtually all facets of the city’s government until they found their base slowly slipping away by the gaining dominance of Southern voters. To offset this, more and more reliance was placed on the African American voter, which soon imbued them with a political voice that was not common in the South. African Americans could be found on the city’s Board of Alderman as well as other segments of the civic government, and their political clout gained them schools and patronage.81
This boom time was not to last, however, and, by the late-1880s, a real estate boom that had seen investors from both sides of the Atlantic and had caused an astronomical rise in property values, collapsed and the prices bottomed out. The Panic of 1893 brought further economic ruin, with the city’s African American population taking the brunt of the hardship. Where they had once held a great amount of political clout, new Jim Crow laws coupled with the downfall of Republican hegemony “robbed local blacks of their votes and denied them their hard-earned voice in local government.”82
Beginning in 1898, Chattanooga began a slow but steady economic and financial comeback with a series of developments that stability to the city once more. First, the Spanish-American War provided the city with an influx of much-needed dollars when troops were moved through the city on their way to Cuba. Second, after the war civic leaders established a balanced economy based upon a combination of banking, insurance, manufacturing, and tourism. Third, and possibly the greatest benefit, the city became the home of the Coca-Cola bottling company when Ben F. Thomas, Joseph B. Whitehead, and John T. Lupton bought the exclusive bottling rights to the product, bringing millions into the city’s economy. Fourth, although Chattanooga suffered as badly as did the remainder of the nation during the Great Depression, the arrival of the Tennessee Valley Authority in 1933, transformed the city into a headquarters for construction projects throughout the area and projects such as Chickamauga Dam brought much-needed jobs and an influx of money. Finally, World War II, in bringing an
School Consolidation: Knoxville, Tennessee124
end to the Depression, further boosted the areas economy when local manufacturing businesses geared up for war production. This success came at a price, however, and by the late 1960s Chattanooga was one of the nation’s most polluted cities. Implementation of strict pollution standards were effective, and the city now enjoys a much healthier environment.
In the late 1950s, African Americans Chattanoogans had “joined the national movement for social and racial equality,” and the city’s greatest challenge would be that of desegregation.83 In March 1962, federal courts ordered the desegregation of the city’s schools. In the years following, Mayor Ralph Kelly first opened up all city facilities to all African Americans and then, under pressure from the mayor and other civic leaders, local businesses followed suit. Being hailed by the African American community, these measures were strongly resisted by the Whites, causing a great amount of tension which culminated in several violent clashes during the 1960s and 1970s. Even with federal orders, the total desegregation of Chattanooga’s schools was not complete until the early 1970s.
The last twenty-five years have, however, once again brought a period of calm and prosperity to Chattanooga and its people. There is now a burgeoning African American middle class that is again prominent throughout all facets of government and local business. The local government, which was once condemned for its machine politics, is now hailed as a model for others to emulate. Center city Chattanooga, which has been virtually rebuilt, now contains a new stadium, the Tennessee Aquarium, and a revitalized retail business area. The estimated 1998 population for Chattanooga is 152,446.
Hamilton County
The history of Hamilton County is execrably bound up with that of Chattanooga. The land that is now Hamilton County, established by an act of the Tennessee General Assembly on 25 October 1819 and named for Alexander Hamilton, was originally appropriated from the Cherokee Indians through the Hiwassee Purchase of 1817. In this purchase, the Indians ceded a large section of land that became parts of both Alabama and Georgia as well as the Sequatchie Valley in which Hamilton County lay. However, the area of Hamilton County that is now south of the Tennessee River did not join the remainder of the county until the Treaty of 1835 led to the removal of the Cherokee and the Trail of Tears.
In the federal census of 1820, Hamilton County had a population of “821 residents, including 16 free blacks and 39 slaves.”84 Also counted, were 100 Cherokees living on six separate family reserves dotted throughout the Sequatchie Valley. White and African American settlers, as well as slaves, were originally clustered around several small settlements which included Sale Creek,
School Consolidation: Knoxville, Tennessee125
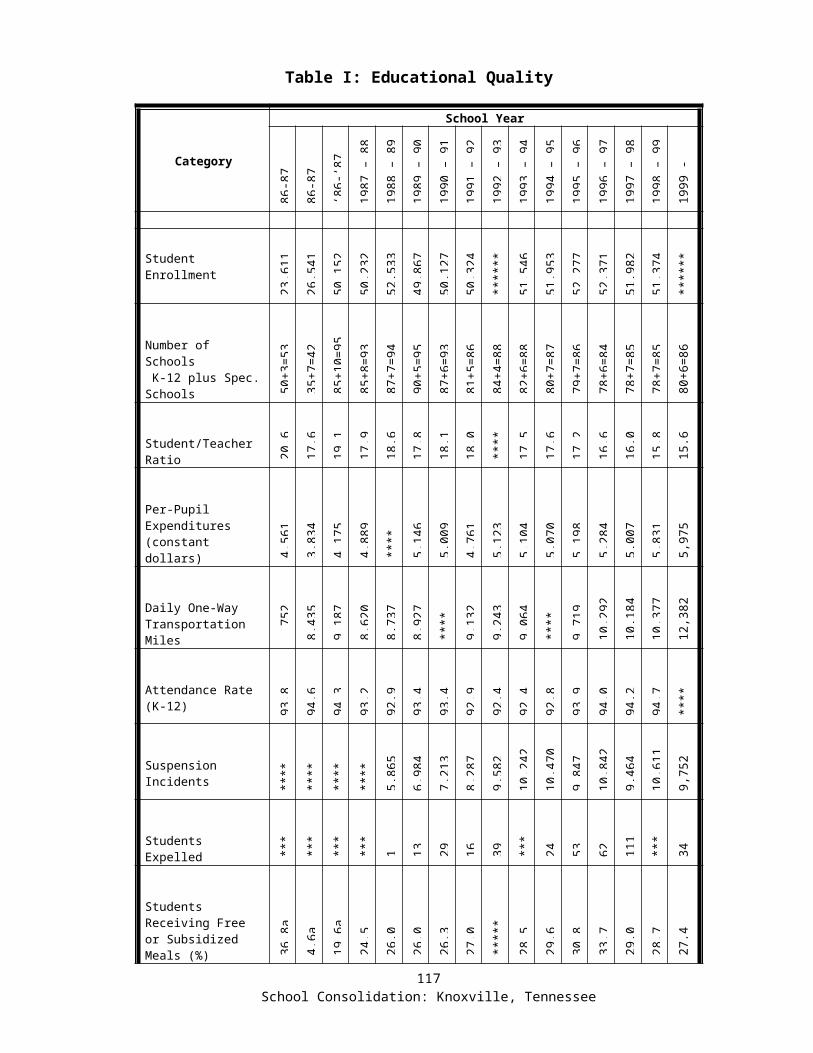
Poe’s Crossroads, and Asahel Rawlings farm. Poe’s, the site of a local tavern, saw the convening of the first county courts. Later, court was moved from Poe’s to the farm of John Mitchell and then to a log cabin built at Dallas, in the vicinity of Rawlings farm. The county seat was then moved to Harrison in 1840 and finally Chattanooga in 1870. In addition to Chattanooga, principal towns found in Hamilton County are Red Bank, Soddy-Daisy, Ooltewah, Collegedale, East Ridge, Lookout Mountain, and Signal Mountain with Dallas and Harrison being consumed by the filling of Chickamauga Lake in 1939. The county now encompasses 542 square miles and the estimated 1998 population was 285,536.
History of School Desegregation and Busing in Chattanooga
In the 1954 landmark Brown v. Board of Education of Topeka, the Supreme Court took a first step toward desegregation when it ruled against segregation. Change came slowly, however, and the Court made several subsequent decisions that called on individual public school districts to desegregate immediately. One of the most common methods of desegregating school districts was busing. White students were bused to all black schools and black students to all white schools.
Integrationists in some metropolitan areas devised temporary plans to bus children to schools outside of their neighborhoods as a way to integrate urban schools. Busing had been used for many years to maintain segregated school systems in the South, but whites opposed this new form of busing vehemently. They challenged the legality of busing in the courts, but these challenges were unsuccessful. The Supreme Court declared busing for educational integration constitutional, and many state and local courts ordered cities to develop busing plans.
These plans had their greatest effect on working class ethnic neighborhoods near inner cities. The newest, best-equipped schools, which were predominately in affluent white suburbs, were less likely to be affected. Busing raised parents’ concerns about having their children attend school far from home. Although they welcomed the opportunities better schools provided, black parents, whose children were most often bused, worried about the students’ adjustment to a strange and often hostile school environment. These concerns and continued opposition from many whites ensured that busing remained controversial through the 1990s.
The controversy over busing in Chattanooga was the product of efforts beginning in the early 1960s and ending with the final acceptance of federally mandated school desegregation in 1973. Busing itself, however, was virtually never mentioned and did not actually become an issue until mid-1971 while a class action law suit, originally filed against the Chattanooga school system by James
School Consolidation: Knoxville, Tennessee126
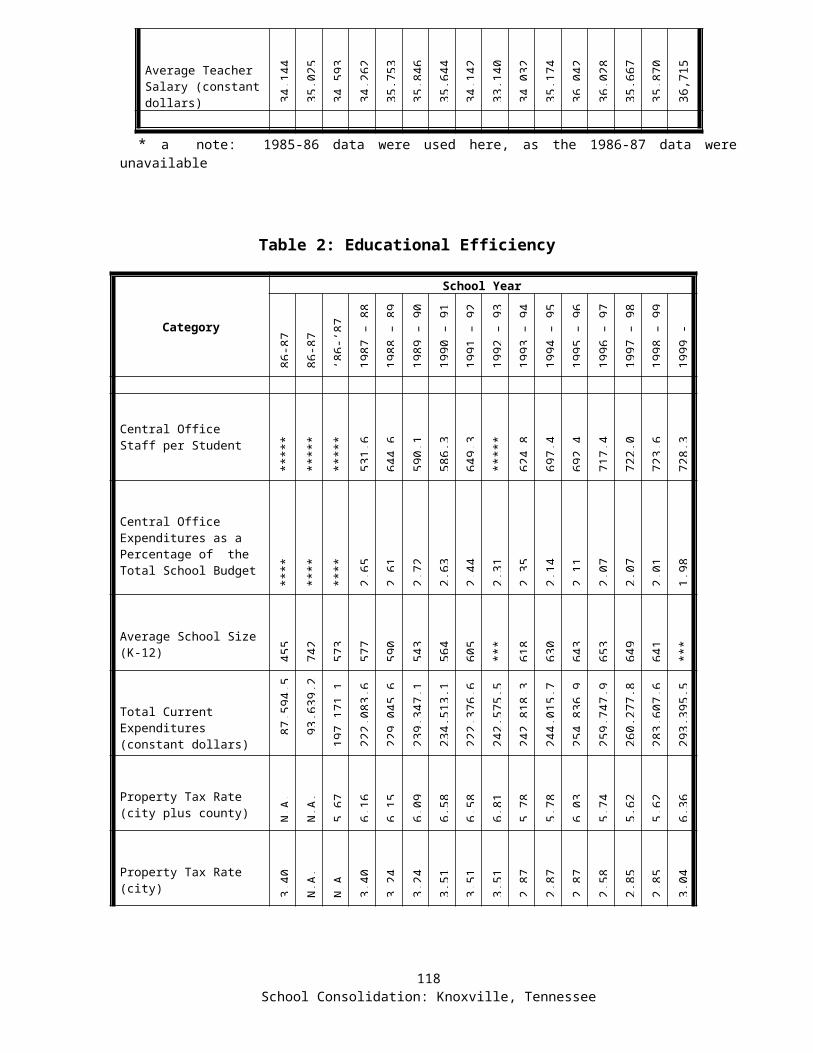
Mapp ten years earlier, was being heard before Judge Frank Wilson in United States District Court.
The word ‘busing’, first heard in May 1971 during several days of testimony in the above mentioned law suit, came about when conflicting statements were forwarded by members of the city’s school board. From newspaper accounts, it can be determined that testimony was being taken at this time which questioned the validity of zoning that had originally been instituted in 1941 to establish a more equitable balance of pupils in the city’s schools. First stating that “race did not have a part in the establishment of school zones,” Assistant Superintendent Robert Taylor went on to admit that “the Chattanooga school system has substantial de facto segregation and the present school zones have not fostered large-scale integration.”85 Second, James Henry, the Chattanooga School Superintendent, testified that “a great deal of school desegregation could be accomplished by rezoning, without the necessity of busing.”86 One administrator testified that zoning did not work while the second, and head administrator, stated that rezoning could lead to desegregation without the need for busing. Still not an issue, busing was left out of Judge Wilson’s decision of 20 May 1971, when he gave the city school board thirty days to prepare a plan which would “eliminate all vestiges of state-imposed school segregation.”87 Specifically, Judge Wilson totally ruled out “freedom of choice” in the high schools, which he said “has not accomplished desegregation.”88
Beginning in early June 1971, several weeks after Judge Wilson handed down his decision, talk was being bandied about over the possibility of consolidation for the city and county school systems. Among several interested groups, none of which was talking for publication, there were two schools of thought. One, that school consolidation should have been accomplished long before this time and two, that school consolidation could be a precursor for the merging of city and county governments. According to the Chattanooga Times, however, “the apparent real reason behind the mushrooming of such support at this time [was] the prospective integration of the city school system.”89
This situation arose because the city was now under orders from Judge Wilson to provide the court with a plan by 18 June which would totally desegregate the schools. To accomplish this, some busing of white and black students would be necessary and the prospect of this alone was cause for these groups to talk of consolidation. Feeling that this as a direct insult from the White community, many African American’s of Chattanooga viewed the merging of school systems “as a determined effort on the part of whites to avoid more than token desegregation.”90 At this time, the city schools with no tuition-paying students was approximately 50-50 white and black while the county schools contained a possible 3% African American student. Thus, through city/county consolidation, a system-wide desegregation would be accomplished and not one that was
School Consolidation: Knoxville, Tennessee127

school-by-school. This would leave the predominantly white schools in predomi-nantly white hands.
Admitting that he could not order a particular racial balance of students in the schools, Judge Wilson did inform the city school board that some form of racial balance would be necessary to determine if a unitary school system had been achieved. By unitary, he meant a school system in “which all vestiges of state-imposed segregation have been eliminated.”91 Over the next several weeks, in discussions held by city and county officials as well as further hearings before Judge Wilson, it was becoming apparent that busing would be necessary. By late June, school superintendent Dr. James Henry, after discussions with the Southern Coach Lines, reported that busing could possibly cost the city $500,000 in equipment and vehicles to bus as many as 5,000 students. Although emphasizing that no hard and fast plan for desegregation had been promulgated, he did admit that any court accepted plan would have to contain some busing, but “for no fewer that 5,000 pupils.”92 To this end, the Chattanooga Board of Education filed a brief with Judge Wilson’s court in which it defended its plan to provide minimal busing for elementary schools and none for high schools. In this brief, the board “argued that “educational values” support the board plan as presented to the court last week.”93
To further complicate the situation, in early July 1971 several white Chattanooga parents requested that Judge Wilson allow them as plaintiffs in the desegregation suit and that he “bring in the Hamilton County board of education as defendants.”94 Brought by an ad hoc group known as the Tennessee Parents and Taxpayers, Inc. or the TPT, the members of this group had dedicated themselves to active support of a constitutional amendment which would outlaw any busing of students for the purpose of either segregation or desegregation. It was the contention of these individuals that any “desegregation order covering only the city schools would deny equal treatment to Hamilton County citizens who live in the city, prevent “maximized integration” of city schools, and maintain a “haven” outside the city to which the white citizens can flee.”95 The plaintiffs also felt that there were not enough whites in Chattanooga proper to allow for the maximized integration of schools by busing, and that the continued ‘white flight’ into the county made the entire proposition impossible.
Matters appeared to worsen from this point. On 26 July 1971, Judge Wilson handed down his opinion for the integration of the Chattanooga school system. His rulings did not, however, set well with either the now-increased plaintiffs or defendants in the case; i.e. Mr. Mapp and his group of original plaintiffs, the NAACP and the TPT on the one side or the Chattanooga city and school administrators on the other. After Judge Wilson provided yet another order on 5 August, all sides were allowed ten days in which to bring appeals in the case, and bring them they did. To further worsen the situation, the Tri-State Citizens Council planned an anti-busing march on city hall and federal funds from the
School Consolidation: Knoxville, Tennessee128

Department of Housing, Education and Welfare, the HEW, would not be provided to purchase buses to transport students. This essentially left the city with a lack of transportation with which to meet Judge Wilson’s requirements handed down in July and August.
Even with the situation as it was, and supposedly operating under the orders of Judge Wilson, students went back to classes in early September, but there were only fourteen buses and approximately 1,200 students involved in busing at this time. In reporting the situation to U.S. District Court and Judge Wilson, this lack of transportation was played off against HEW’s earlier refusal to provide emergency funds for the purchase of buses. This was rendered a moot point when the U.S. Sixth Circuit Court of Appeals in Cincinnati denied the city school boards appeals on both desegregation and busing.96
In a rather bold move by the state, yet another twist was thrown into the situation. On 9 December 1971, a citizens group - the Concerned Citizens of Chattanooga - filed a class action suit with the Tennessee Circuit Court to stop the Chattanooga City Commission from spending any money for the busing of students. The judge of this court, Judge David Tom Walker, ordered the commission to show cause why it should not be required to stop providing funds and a hearing was set for 14 January 1972 before Judge Joe N. Hunter. In its defense, the city attorney filed a brief in which was stated that the Circuit Court had not jurisdiction in the busing matter because the law was vested in the board of education and the city commissioners had no control over providing funds for busing. Still, Judge Hunter ordered the city to cease providing funds for busing, an order with ultimately effected 1,036 students. The school board, in a form of reply to Tennessee Judge Hunter, asked for instructions from Federal Judge Wilson. As would be expected, Judge Wilson’s court ordered the Chattanooga school board to ignore Hunter’s order and continue with the federal court mandated busing. Now nearing the end of the 1971-1972 school year, however, the city was now finding itself in rough waters. “Caught in a time squeeze between court decisions on desegregation appeals and delivery dates for vehicles, the Chattanooga Board of Education [was forced to order] 26 school buses at a cost of $249,956.72.”97
With the end of the 1971-1972 school year, all plaintiffs and defendants in the desegregation case continued to pursue appeals through the federal courts. Limited busing continued as it had the year before, even though the city had canceled its order for 26 new buses. Finally, the Sixth U.S. Circuit Court of Appeals ruled that the Chattanooga school board must “implement a plan of desegregation that would require a ratio of not less than 30 percent nor more than 70 percent of any one race in any city school.”98
Possibly in a last ditched effort to forestall the inevitable, the city school board filed yet more appeals and even contemplated bringing their case before the
School Consolidation: Knoxville, Tennessee129
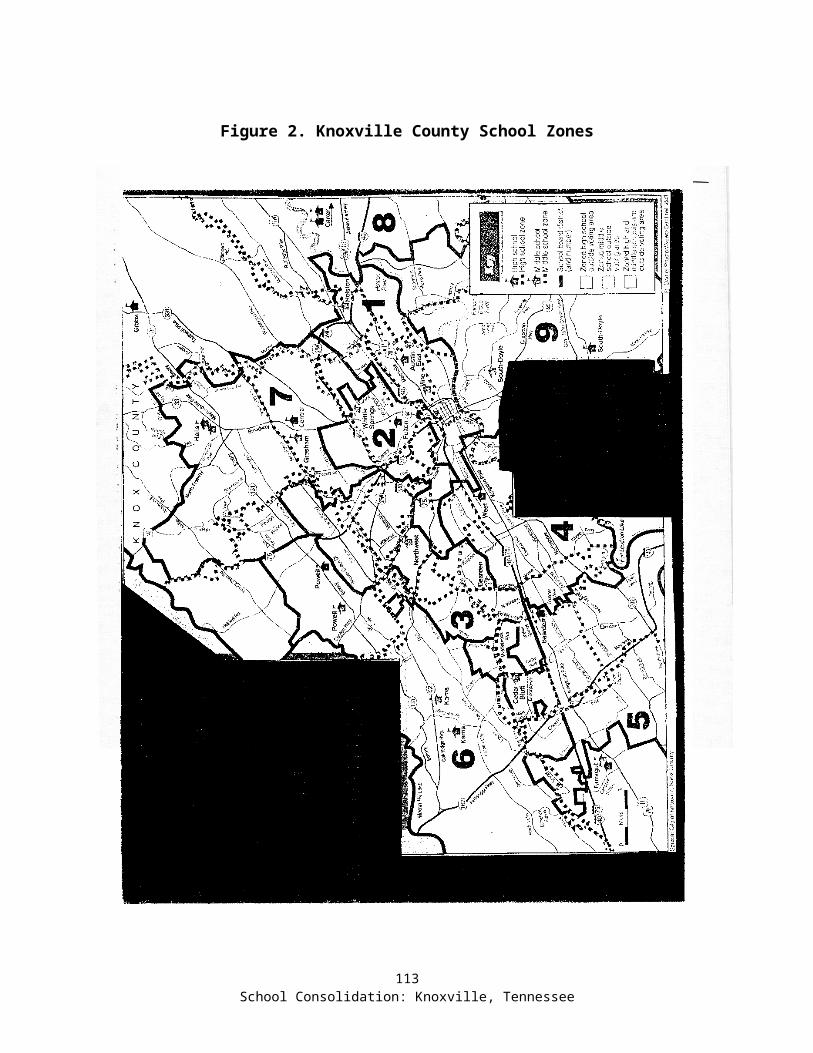
United States Supreme Court. The school board even devised and voted on an adjusted desegregation plan based upon Judge Wilson’s original 1971 ruling. The city’s “arguments that lose of [a] large number of white students from the system justified his accepting the adjustments,” were evidently no defense, and the school board was ordered to implement the original plan by the beginning of the second semester for the 1973-1974 school year. 99 Even though the order meant the forced busing of some 3,500 students and the closing of three schools, the Chattanooga Board of Education accepted the finality of the
situation, and declared that it would obey the court on desegregation.
The entire situation was not, however, to be laid to rest. In a meeting on 4 December 1973 with the City Commission, the Concerned Citizens for Neighborhood Schools, led by Fred Curd of Chattanooga, asked city administrators what they intended to do about the court mandated busing. They were informed by the City Attorney, Eugene Collins, that “the federal district court has specifically enjoined the city, the members of the City Commission, and other city officials from hindering in any manner the orders of the court in connection with the desegregation case.”100 As stated by a Commissioner Roberts,
“That is a final order. . . It must be obeyed.”101 To counter the forced busing of their children, the group first planned to open as many as sixteen ‘private’ schools, and then petitioned the courts once again in an attempt to halt busing. Not only were the ‘private’ schools a failure, but attempts to stop busing were also stopped and by the 11th of November 1974, busing was a part of Chattanooga city schools.
City, County, and School Governing Structures
Chattanooga City
The city of Chattanooga has a Mayor/Council form of government. The mayor, currently Bob Corker, is elected for a four-year term. Mayor Corker, elected to
School Consolidation: Knoxville, Tennessee130
his present term in March 2001, received 54% of the popular vote in a field of eleven candidates. Mayor Corker holds a Bachelor of Science in Industrial Management from the University of Tennessee, Knoxville. In the private sector, he has been involved in the areas of construction and real estate, while he has served in both local as well as state government positions, serving as Tennessee’s Commissioner of Finance and Administration from 1995 until his election as Mayor of Chattanooga. There, he was widely acclaimed for his ability to bring together Democrats and Republican lawmakers to solve problems. Among his responsibilities were the preparation and implementation of Tennessee’s $13 billion state budget and overseeing the general operations of the state.
The Chattanooga City Council consists of nine representatives who are elected from their respective districts for a period of four years. Elections for Chair and Vice Chair are made each year, generally the 3rd week of April. With current terms running from April, 2001 until April, 2005, each councilperson will be up for re-election in 2005. The following are the current members of the council and the districts that they represent. District 1 - John M. Lively representing Valley View, Wauhatchie City, Mountain Creek, and Northwoods North; District 2 - Sally Robinson representing North Chattanooga, Riverview, Stuart Heights, Lupton City, Northgate, and Northwoods South; District 3 - Dan Page representing Hixson, Hixson 2, Dupont, Murray Hills, Kings Point, and Lake Hills; District 4 - Jack Benson representing Tyner, Benson, and East Brainerd; District 5 - John P. Franklin, Jr. representing Bonny Oaks, Airport, Dalewood, Eastdale, and Woodmore; District 6 - Ron Littlefield representing Brainerd Hills, Eastgate, Brainerd, Sunnyside, Missionary Ridge North & South, Ridgedale, and Cedar Hills; District 7 - John R. Taylor, Sr. representing Moccasin Bend, Howard, St. Elmo, Alton, Eastlake, and Piney Woods; District 8 - Leamon Pierce representing Courthouse, City Hall, Clifton Hills, Bushtown, and Avondale; and District 9 - Yusuf Hakeem, Chairman, representing Amicola, East Chattanooga, Glenwood, Orchard Knob, Highland Park, and East Side. Of the nine council members, Messrs. Franklin, Taylor, Pierce, and Hakeem are African-American while the remainder are White, with Mrs. Robinson being the only woman.
Hamilton County
Hamilton County is governed by a County Executive and County Commissioners elected from one of nine districts. The County Executive's duties include administering the day-to-day activities of county government and serving as the county's chief financial officer. The County Commission is the legislative and policy-making body of the County. It is composed of nine residents who are elected from and represent nine districts within the County. Commission members are elected for four-year terms, and both the Chairman and the Chairman Pro Tempore are selected as the presiding officers by the members of
School Consolidation: Knoxville, Tennessee131
the Commission and serve for one year. Currently, Claude Ramsey is the County Executive and the County Commissioners are District 1, Fred R. Skillern; District 2, Richard Casavant; District 3, Charlotte E. Vandergriff; District 4, William R. Cotton, Jr.; District 5, JoAnne H. Favors; District 6, Ben F. Miller;
District 7, Harold Coker; District 8, Curtis D. Adams; and District 9 - Bill Hullander, Chairman Pro Tempore. Mr. Cotton and Mrs. Favors are African-Americans while the remaining members are White.
Hamilton County School System
The Hamilton County schools are governed by an elected School Board that is comprised of nine members, one each elected for four years from the same districts as the County Commissioners, and a Board of Education that consists of persons appointed to or hired into their
respective positions. Currently, the Hamilton County School Board members are District 1 - William G. Eldridge; District 2 - Chip Baker; District 3 - Everett R. Fairchild; District 4 - Debra Matthews; District 5 - Charles E. Love, Chairman; District 6 - Janice Boydston; District 7 - Joe A. Connor, Vice-Chairman; District 8 - Debbie L. Colburn; District 9 - Marty Puryear. Of the nine members, the Chairman, Mr. Love, and Mrs. Matthews are African-American while the remaining members are White.
Before school consolidation became a reality in 1997, the Hamilton County School Board was a great source of contention and turmoil. The primary reason for this situation was the public’s concern over the process in which the school board members received their appointments. In the Chattanooga school system, board members were popularly elected officials while those from the county were appointed by the powers-that-be. Since consolidation, however, this situation has been rectified with all board members now being elected by popular vote from their respective school districts
Schools’ Funding Formula/Process
The Hamilton County school system operates on a July 1 to June 30 fiscal year. For fiscal year 1997, the first year of consolidation, the funding formula for
School Consolidation: Knoxville, Tennessee132
Hamilton County schools was 48% from local sources of which 31% is from local property taxes and 17% from an optional local sales tax; 45% from the state; 4% from the city of Chattanooga; and 3% from other sources. ‘Other’ sources include funds received from such agencies as the Federal govt. or monies gained from local hotel/motel taxes, marriage licenses, bank excise taxes, tuition for summer school, community service fees received for child day-care, and payments received in lieu of taxes from such sources as TVA and local utilities. Table #4, entitled “Sources of School Funding for Hamilton County and Chattanooga City Schools, 1994-1995 thru 2000-2001 School Years,” provides, other than 1999-2000 and 2000-2001, a year-to-year breakdown of local, state, federal, and total funding.
A main point of controversy between those for and against school consolidation was funding. While there were those who thought school funding in both Chattanooga and Hamilton County was either equitable or non-equitable, a look at the available figures illustrates that the funding was quite equal between the two. Using school year 1994-1995 as a base, the funding for Hamilton County rose 9.2% from $102,338,782 to $111,365,177 in 1996-1997, the first year of consolidation. Using the same base year, Chattanooga city school funding rose 9.1% from $100,092,133 to $109,877,669. Also, both school systems served virtually the same number of students from the 1994-1995 through 1996-1997 school years, with Hamilton County having an average population of 23,551 and Chattanooga 20,024.
History of the Consolidation Movement and Final Conversion
Consolidation of the Hamilton County and Chattanooga city school systems was not a situation which occurred overnight. School consolidation was recommended as early as 1929, when a report entitled the “Strayer Report” was issued by a Dr. George B. Strayer of Columbia University. There was no action taken on this report and nothing more was done until a further study was completed by the League of Women’s Voters in November of 1947. This report would provide the fundamental framework for the eventual school consolidation of 1997.
Again left to linger in limbo, consolidation did not come into the public mind until early in 1953. However, merger of the two school systems was not recommended until several items of concern had been alleviated. First, and a situation which would come back to ‘haunt’ future mergers, it was recommended that “measures [should] be adopted to elect the county school board by the people and the law . . . changed to give the county board the power to employ its own superintendent.”102 Second, it was recommended that both school systems
School Consolidation: Knoxville, Tennessee133
adopt the same textbooks and teachers salary schedules as well as “plan school construction together, establish zones for high school attendance and effect other co-ordinations to give common benefits in city and county students.”103 Advantages to school consolidation were seen as equalization of the tax base and consistency of educational opportunity.
The issue was again shelved until mid-1956 when discussion was again taken up. With this occurrence, however, the primary motivation appears to have been the possibility of the Hamilton County delegates to the Tennessee state legislature pushing through a bill which would force the merging of the two school systems. Even if the legislature had passed such a bill, the issue of consolidation would still have to go before the public for a vote. By late 1956, Ray W. Evans, the county’s prominent and outspoken Republican delegate to the state legislature was arguing that the present laws of the state would be sufficient to bring about consolidation. In early 1957, the Education Committee of the Chamber of Commerce had voted 25 - 0 that no legislative action be taken and discussion on the issue again died out until late 1960.
During the 1960 discussions, the Chamber of Commerce again answered the call for consolidation by declaring that merger of the two school systems would not produce the economic and financial balance that most people envisioned. The Chamber would, however, recommend consolidation under certain circumstances which had already been made patently clear. Primarily, teachers salaries had to be maintained high enough to bring in only the best teachers; the school board had to be popularly elected with its members being non-partisan and the elections held only in off-election years; and only the school board had the authority to appoint or hire the superintendent.104
Again the subject was allowed to lapse once more, with short-lived discussions cropping up in 1962, 1964, 1967, 1971. During this time, petition drives were instituted, county and city council votes were taken, and referendums were placed before the people. As discussed previously in this study, consolidation was also seen as a possible ‘cure’ for school desegregation during the back-and-forth law suits of the early 1970s. Consolidation still remained as illusive and contentious an issue as it had been, but, in the 1980s, money and minority concerns were beginning to take center stage in the call for merger of the two systems. In early 1980, a dispute over capital funding for school occurred between county and city officials. Impetus for the discussion during this period was the city’s annexation of 7 schools and the county’s request to pay $13 million for those schools.
In the early 1990s, issues of race and politics, the larger cost of transportation in a merged school system, and subsidies and equal salaries for teachers were becoming the main issues for merger. In August 1994, it was believed that a
School Consolidation: Knoxville, Tennessee134
vote on the issue could be placed before the people on November’s ballot, but City Commission members remained the main stumbling block, with pros and cons hotly divided along racial lines. Pros for the merger - five of the nine Commission members - saw the consolidation of the two systems as an avenue to equity in school funding and appropriations, smaller administrative staffs, a deterring factor to halt White Flight from the city to the county. As would be expected, however, the cons for the school system merger saw a completely different set of circumstances. The four members opposing consolidation envisioned a higher tax rate; saw the possibility of teacher displacement as a determent to quality education because of lessened effectiveness; it was believed that county officials had no desire to take on the responsibility of educating the city’s children; and, finally, crime would become a factor because of a “generation of young people who are without hope because of frustration and confusion that will develop over the next few years . . . and will express themselves in manners that . . . would [not be deemed] appropriate.”105
During September 1994, the issue remained hotly discussed by both the city and county authorities. In early October is was determined that merger could possibly cost $24 million and there were eleven specific points of contention. These points, several of which had come to the forefront in past years, surrounded the issues of special education, the pupil-teacher ration, teacher salaries, support staff and business administration, trustee fees, principals offices, school operation and maintenance, a centralized computer system, plans for future elementary and middle schools, and - as always - transportation. However, the vote went ahead and, in November 1994, consolidation of the Chattanooga City and Hamilton County school systems was approved by a margin of approximately 3,500 votes, with merger set to be completed by 30 June 1997.106 It may have been approved, but there was still much work to be accomplished and points of contention and conflict were still abundant.
Even with city and county administrators and school officials promising a smooth transition from two to one school system, no sooner had the vote been taken and merger approved by the people than there were several groups who were considering law suits to stop the action.107 James Mapp, now president of the Chattanooga brand of the NAACP and the gentleman filing the original law suit which forced the city school system to desegregate in the 1970s, filed a suit to stop the consolidation. The primary complaints in this suit were that the placement of the ordinance on the ballot did not meet state requirements and it was not phrased in such a manner that it could be answered by a yeah-or-nay vote; the full ordinance had not been printed on the ballot; the ballot contained a misleading and inappropriate statement to the effect that there would be a tax savings of $3 million; and the wording of the ballot could be misleading to many voters. However, the organizations’ attorney, Myron McClary, failed to file the appropriate and timely motions and the group left court on 13 December empty
School Consolidation: Knoxville, Tennessee135
handed. Two other groups playing a minor role in the conflict were also becoming vociferous over the planned consolidation; the Minister’s and Layperson’s Fellowship, a local religious group, and People Wanting A Change, a group of ‘concerned’ citizens.
It was recommended in mid-December that the “responsibility of unifying the city and county schools” be handed over to a local, non-profit organization, the Public Education Foundation, or PEF for short.108 The primary reasoning behind the decision was the fact that this non-profit organization received the majority of its funding from both the city and the county. Founded in 1988, the foundation was formed “by a group of civic and educational leaders, [and] was designed to funnel private dollars into city and county classrooms.”109 The action was seen by many education officials concerned with the consolidation as an action that would force them to act, “because we really aren’t sure what we’re doing.”110
During 1995, consolidation of the two systems continued, and several excellent decisions had been made which would impact the consolidation process. First, it was determined that all steering committee meetings held by those involved in the consolidation would be open to the public with everyone allowed to voice their opinions, concerns, or recommendations.111 Second, by mid-year the PEF and school board had produced a working outline for consolidation which then became the agenda of a 37-member planning committee who had $5 million at their disposal.112 It was the responsibility of this group to develop “the framework, philosophy, mission statement and standards for all students.”113 This group would also divide itself into subgroups which would be tasked with studying transportation, maintenance, curriculum, food service, and school system support. However, all was not without problems.
A major point of concern in consolidating the two systems was the situation of combining two support staffs. While “the city school system [had] more than 300 administrators, clerks and maintenance workers . . . [the] county [had] about 100, officials said.”114 It was envisioned that there would be a centralized school system office which employed from 125 to 175 personnel. This, unfortunately, left approximately 275 to 250 people without a position. To alleviate this situation, and to ensure that everyone had a position, the opinion was voiced that some people - possibly as many as 125 to 175 - would have to return to the classroom. With this, however, also came the legal question of whether there was an obligation to keep all of the current county system employees while providing jobs for those from the city system as well.
In a form of counter-argument, the city superintendent, Dr. Harry Reynolds, believed that the system would need more staff than the anticipated 125 to 175 because a larger system required more personnel to ensure its operation.115 Also, it was Reynold’s contention that, from past experience, the county could not
School Consolidation: Knoxville, Tennessee136

be relied upon to give equitable employment to minorities.116 Dr. Reynolds found this of such great concern that he was quoted in the Free Press as saying that “When the city has been very successful in recruiting and promoting both blacks and white, then why has the county remained so white?”117 Considering that in late 1995 there were only two African-American administrators and one principal in the entire county school system, it is possible that Reynold’s had reason for concern.
Yet another point of conflict now came into play. Dr. Don Loftis, the county school superintendent and a major point of contention with many from the city, was placed at the head of the combined city and county school systems by the member of the non-popularly elected Hamilton School Board. In an attempt to explain their actions, Mr. Bill Nevins, the chairman of the superintendent search committee, stated that he had been “told by the experts that you could be putting a new superintendent in harm’s way, as well as your educational system, by trying to push the envelope and getting someone in here who is unequipped (for) what he or she might be asked to do as well as be put in the middle of a system that’s not yet been formed.”118 However, even though Loftis’ was unpopular with many, the appointment was seen by many city and county school officials and concerned citizens as a ploy for the county school board to keep their ‘own people’ in control by filling important and sensitive positions “through the back door.”119 Fortunately, the school board not only backed off from its appointment of Loftis, but he also rejected the position, stating that he “is not interested in being superintendent of the consolidated school system. And that’s final.”120
Through 1996 and into 1997, the various steering committees and the PEF continued on with the consolidation of the two systems. Points of concern - virtually all of which had come up in during discussions in the past - again came to the forefront. Transportation was seen as problem, because where the county operated its own buses and drivers the city contracted this out to a private company. Also seen as a problem, the county transportation system required greater funding than did the city’s. While teachers salaries and administrative staffing continued to be a stumbling block, yet another group of ‘concerned’ citizens raised their proverbial ‘ugly head.’ Mr. Dean Arnold, formerly the communications director of the Chattanooga Resource Foundation, had resigned his position to place his efforts into his organization, Urban PREP, short for Parent-Run Education Petition. The main purpose of this organization was to champion the efforts of parents, community leaders and pastors by “empowering [them] through vouchers, charter schools or creating schools of their own.”121 Although not operating in conjunction with another group, Amos Baker’s the People Wanting a Change (PWAC), the Urban PREP’s objective was to be there in the event a petition drive being conducted by the PWAC failed. Local NAACP officials were concerned by Arnold’s efforts because they saw this as yet another attempt to re-segregate the schools through the mandate of God. NAACP Vice-
School Consolidation: Knoxville, Tennessee137
President Eddie Holmes was quoted as saying that “We want public education. Dean Arnold is saying that parents are commissioned by God to train their children. Training the child and educating the child are not the same thing. The community has responsibility through tax dollars.”122
Not only would Arnold’s efforts eventually come to a inglorious end, but the petition drive also being run by Baker’s PWAC could not have been thoroughly thought out as well. City and state law could, if the petition were successful, become a sort of two-edged sword that would require two votes to overturn the people’s 1994 decision to consolidate their school systems. According to Randy Nelson, the then-city attorney, one vote would be necessary for the issue to be placed on the ballot and a second would then be taken to either keep consolidation or reverse the 1994 decision. Nelson was quoted as saying, “It takes two steps. You need an ordinance to change the city charter and then a second vote by the people on the ordinance.”123 Also, according to Tennessee state law, the only way in which the city charter could be changed was by a vote of the electorate. “The 1994 election included such a vote after the City Council approved a referendum for the ballot, and the result was city residents giving up their school system. By state law, Hamilton County becomes responsible for providing an education to city and county children.”124 As would be expected, those running the petition drive saw the entire two-vote scenario as a ploy to stop their efforts. Baker’s PWAC would also go the way of Arnold’s organization and eventually realize that the people had voted in school consolidation and it could not be stopped.
Although consolidation of the Chattanooga City and Hamilton County school systems occurred as planned on 30 June 1997, it was still not an easy, open-and-shut matter. Even with entities such as the NAACP and Christian and citizens groups removed from the fight, there were still concerns. School children themselves voiced dissenting opinions on the situation with valedictorians from both county and city high schools speaking out against the consolidation.125 It was believed, however, that there
. . . stakes behind the merger [that were] bigger than public education itself. This battle will determine the future and direction of the community. One prominent school of thought believes that bigger is better in government. Proponents feel that the more central control, the better. Many of these folks agree with an expanded role for the federal government. Others favor the centralized vision of the United Nations and socialistic government.
School principals became involved when they began questioning the qualities that should be sought in a new superintendent, with some believing that he or
School Consolidation: Knoxville, Tennessee138
she should come from out of state while others felt that person should be either from Tennessee or the local area.
Today, the Hamilton County Department of Education, overseen by the nine members of the popularly elected school board and Superintendent Dr. Jesse Register, is quite an entity to be observed. School crime is down, test scores are up and, while drop outs, expulsions, and suspensions are still a problem, there are steps being taken to alleviate this situation. Although the problem of unifying the transportation systems of both school systems continues to be a problem, solutions are being implemented during the 2001-2001 school years which finally bring the entire operation under the control of the education department. The magnet schools operated by Hamilton County are some of the finest in the nation and do not cater to the privileged few, but are open to all regardless of race, social standing, or even handicap. There are still problems, but every person involved with this county’s school system is striving to ensure that all children receive a quality education.
P A R T I I - C O N S O L I D A T I O N I M P A C T
Student Demographics
As with all areas of the United States, the overall population is represented by many races and cultures, and Chattanooga and Hamilton County are no exception. However, as shown in Table 1 & Graphs 1, 2 & 3 below, the majority student populations of this area are made up primarily of White and African-American students, with others such as Hispanics, Asians, and Amer-Indians making up the small minority. A major concern with any school system, especially one in which there is the aspect of a poorer inner city surrounded by an affluent suburban/county entity, is that of what has become popularly known as White Flight.
In an attempt to determine if White Flight is prevalent in this area, three graphs have bee prepared; one for White students, another for African-American, and a final for White vs. African-American. At first glance, it can be seen that there has been a slight drop in the White student population while there has been a small increase the African-American population. Also, in the first and second graphs, the figures clearly illustrate that there are more White students in Hamilton County than African-Americans while the reverse was true in Chattanooga City proper, with the ration being 2.1 to 1, White over African-American. However, the drop in White and rise in African-American student populations does not mean that there is White Flight prevalent in Chattanooga/Hamilton County. As can bee seen by the figures for school years 1998-1999, there was a significant drop in both student populations, with a rise the next year. Also, the overall drop
School Consolidation: Knoxville, Tennessee139
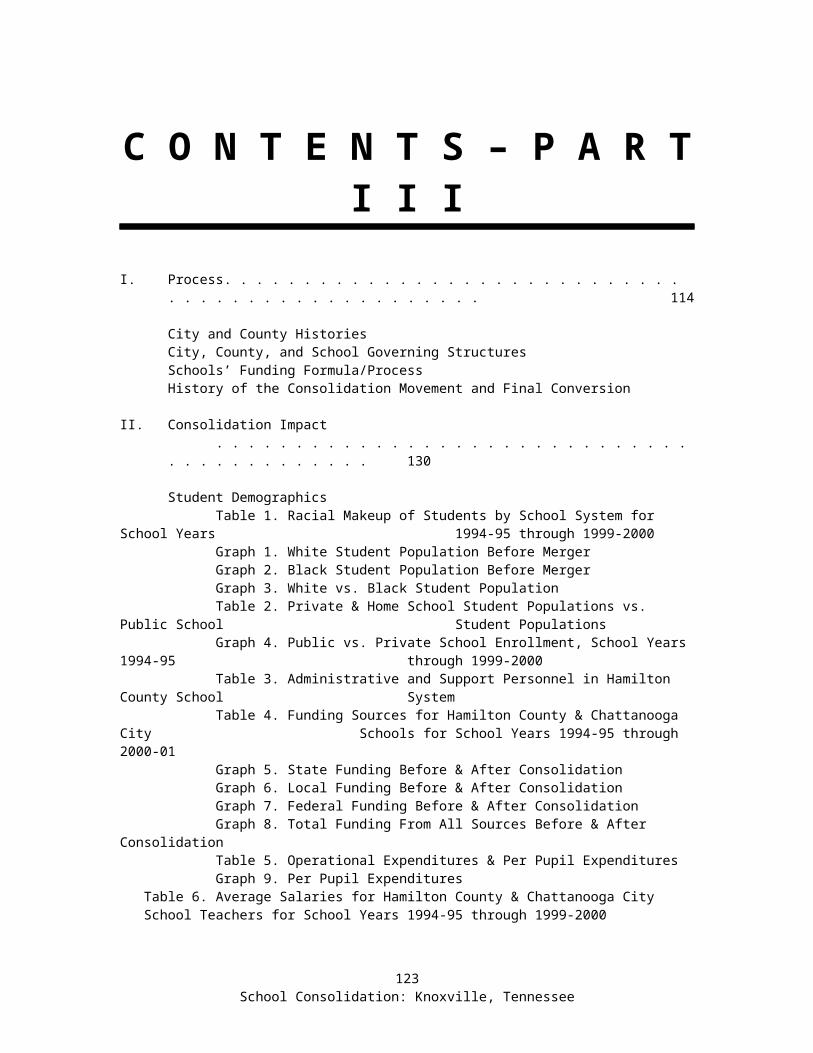
of 9.4% in White students with a 3.3% rise in African-Americans means little when taking into account the total number of students involved.
Private and Home School
Table 2 and Graph 4 below make the attempt to determine if the these sectors of educational opportunity are rising or declining. In this case, it would appear that the latter is the more prevalent. Although home schooling figures were difficult to impossible to obtain, private schooling figures were readily available from the Hamilton County Department of Education. Graph 4 clearly illustrates that more parents are opting to send their children to private - quite possibly Christian based - schools. However, when looking at the numbers of students involved, it would appear that this avenue of education has a long way to go before it is a threat to public school enrollment. Even with this, it is significant that the number of children leaving public school is approximately 2 for every 1 that enters private school.
Table 1. Racial Makeup of Students by School System for
School Years 1994 – 95 through 1999 – 2000
Race
Before Consolidation1994 – 95 1995 – 96 1996 – 97
Ham
ilton
C
ount
y
Cha
ttan
ooga
C
ity
Com
bine
d T
otal
Ham
ilton
C
ount
y
Cha
ttan
ooga
C
ity
Com
bine
d T
otal
Ham
ilton
C
ount
y
Cha
ttan
ooga
C
ity
Com
bine
d T
otal
White 22,583 7,442 30,025 22,148 7,314 29,462 22,037 6,875 28,912Black 858 12,302 13,160 842 12,352 13,194 961 12,426 13,387Hispanic 143 81 224 140 101 241 141 99 240Asian 238 323 561 257 363 620 258 356 614Amer-Indian 24 20 44 23 20 43 23 20 43
Total 23,846 20,168 44,014 23,410 20,150 43,560 23,420 19,776 43,196
After Consolidation1997 – 98 1998 – 99 1999 – 2000
Hamilton County Hamilton County Hamilton CountyWhite 28,397 26,509 27,170Black 13,596 12,416 13,590Hispanic 301 359 429Asian 645 559 592Amer-Indian 86 80 79
Total 43,025 39,923 41,860
School Consolidation: Knoxville, Tennessee140
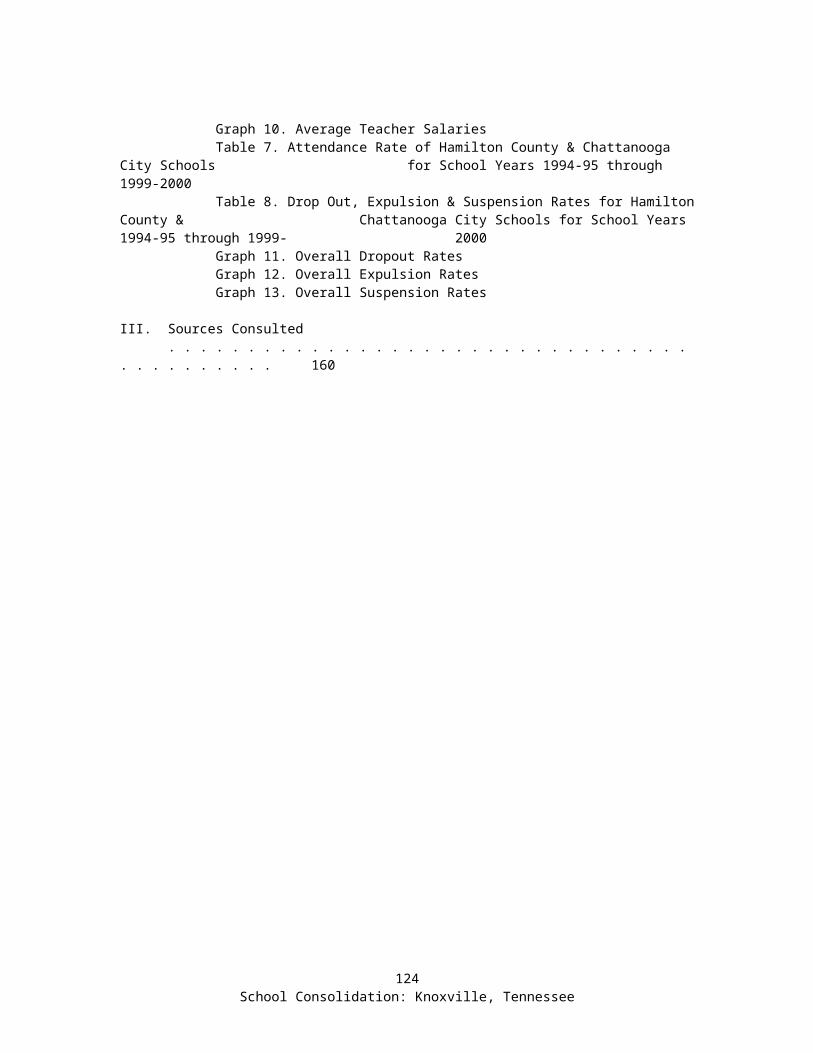
School Consolidation: Knoxville, Tennessee141
Graph 1. White Student Population Before Merger
School Consolidation: Knoxville, Tennessee142
Graph 2. Black Student Population Before Merger
School Consolidation: Knoxville, Tennessee143
Graph 3. White vs. Black Student Population
School Consolidation: Knoxville, Tennessee144
Table 2. Private & Home School Student Populations vs. Public School
Student Populations
Before Consolidation After Consolidation1994 - 95 1995 – 96 1996 – 97 1997 – 98 1998 – 99 1999 – 2000
Private 10,215 10,548 10,319 11,221 11,218 11,243Home School -- -- -- -- -- 225
Total of Above 10,215 10,548 10,319 11,221 11,218 11,468Public 44,014 43,560 43,196 43,025 39,923 41,860
Administrative Personnel
Administrative personnel employed by the Hamilton County Department of Education are divided into two categories; Classified and Non-Classified personnel. Classified personnel are those who are deemed to be professional, i.e. those who either require a college/university education or some other form of training/ experience which would qualify them for a higher paying, more-technical position. Classified positions are taken up by Administrators, Teachers, and Student Support Staff. Non-Classified positions are those which require little, if any, training are predominantly those of a labor-intensive type. Non-Classified positions are taken up by Teaching Assistants, Staff Support - those who support the student staff personnel - and other support staff which includes custodial and some maintenance personnel.
Table 3 below is, unfortunately, grossly lacking in figures. The only year for which ‘solid’ numbers could be obtained was 1997-1998, the first year after consolidation. Taking into consideration the difference between Administrators and Teachers for 1997-1998 and 1999-2000, one can see that there is a somewhat-steady rise in personnel. Also, with the growing student population in the Hamilton County School system, it would stand to reason that the number of support personnel would rise accordingly.
Individual School Boundaries
As discussed previously, individual school boundaries are determined through the use of the high-end software program, EduLog. This is an excellent program for use when a student population, like that in Chattanooga and Hamilton County, is very fluid and is constantly shifting. Well before the beginning of each new school year, this program is given its new numbers and new boundaries for each individual school are re-drawn as necessary.
School Consolidation: Knoxville, Tennessee145
Graph 4. Public vs. Private School Enrollment, School Years 1994 – 95 through 1999 -2000
School Consolidation: Knoxville, Tennessee146
Table 3. Administrative and Support Personnel in Hamilton County School System
School Year
Classified Personnel
Non-Classified Personnel
Adm
inis
trat
ors
Tea
che
rs
Stu
den
t S
uppo
rt S
taff
Tea
chin
g A
ssis
tant
s
Sta
ff S
upp
ort
Oth
er S
uppo
rt
Sta
ff
To
tal
Per
son
nel
Per
son
nel
p
er P
up
il
1997 – 98 187 2,193 237 366 252 1,388 4,623 1 : 9.31998 – 99 * -- -- -- -- -- -- -- --1999 – 2000 ** 208 2,597 -- -- -- -- 2,805 1 : 14.8
* Total personnel for 1998 – 99 are only for professional, or classified, personnel and there are no numbers for the non-classified personnel. Because of this, any numbers given – as well as assumptions – would be grossly inaccurate ant the school year is thus left blank.** The only figures available for 1999 – 2000 are for Administrators and Teachers. No numbers are available for the other categories of personnel.
Allocation of Staff After Consolidation
As could well be expected, this was a major source of concern both before and after consolidation. However, a committee specifically tasked with finding a solution to this problem came up with an excellent solution. Each and every individual school’s need was first taken into account as well as the student body that would be served. First, all positions in every school were posted where teachers and other personnel could readily have access to them. Those wishing to transfer to another school were given the opportunity to submit a request, receive an interview from the appropriate principal, and then - as was the case in most situations - that persons was transferred to the new location. It was found that this was an excellent way in which to match up the appropriate personnel with the jobs that needed filling. In the few cases that occurred where the positions which went unfilled, those people who possessed the necessary skills were first asked if they would voluntarily transfer. If that person refused for any reason, someone else with the same qualifications would be asked. According to Mrs. Janet Qualls, the Executive Secretary to the Superintendent, Dr. Register, there were only several involuntary transfers, and these people were only required to stay in that position until another person could be found to take their place. No one was let go or terminated because they refused to transfer and very few people left the school system because of need to transfer.
School Consolidation: Knoxville, Tennessee147
Transportation
Both before and after consolidation, Hamilton County provided its own bus service, using buses purchased and drives hired by the school system. Chattanooga, however, contracted out its bus service. This is an ongoing situation that will finally be rectified this school year, 2001-2002, with transportation being provided by the school systems own buses with its own, hired drivers.
The Hamilton County magnet schools are provided with bus transportation. However, there are no front door-to-school services such as those provided for the regular, non-magnet schools. Instead, students attending magnet schools, and who require and/or are entitled to bus transportation, gather at central points located throughout the county and board buses for their respective magnet schools. After school hours, the students board their buses and are then dropped off at these same central points where parents or guardians then pick them up.
Funding Sources
Table 4 and Graphs 5, 6, 7 and 8 illustrate the three major sources of income for the school system; Local, State, and Federal funding. Local funding comes primarily from property and sales taxes and fees levied against other services. While coming from basically the same types of sources, State and Federal funding are a different level altogether.
Before consolidation, it can be seen that Hamilton County and Chattanooga both expended, with little difference, approximately the same amounts of monies, with the county experiencing an overall rise of 13.6% with the city rising 16.2%. However, when consolidation was finally implemented, funding actually dropped a slight 1.53% between school years 1997-1998 and 1998-1999. Although a solid figure could not be obtained for 1999-2000, it is still apparent that local funding is again on the rise.
In State funding, Hamilton County received an overall rise of 2.8% while Chattanooga saw a rise of 3.8%. However, Hamilton County received an average of $6 to $6.5 million more than Chattanooga to service a student population which was only 2 to 3 thousand greater. Federal funding for Hamilton County was significantly lower than that for Chattanooga, with slight rises being seen by both before consolidation. After consolidation, however, Federal funding took a 52.9% rise, going from $15.5 million in 1997-1998 to $23.7 million in 1998-1999. Total, overall funding both before and after consolidation remained on a
School Consolidation: Knoxville, Tennessee148
steady climb, rising from $202.4 million in 1994-1995 to $252.9 million in 2000-2001, an overall gain of 25% in seven years.
Table 4. Funding Sources for Hamilton County & Chattanooga City Schools for School Years 1994 –95
through 2000 - 01
Funding Sources
Amount Funded in Millions of DollarsBefore Consolidation
1994 – 95 1995 – 96 1996 – 97
Ham
ilton
C
ount
y
Cha
ttan
ooga
C
ity
Com
bine
d T
otal
Ham
ilton
C
ount
y
Cha
ttan
ooga
C
ity
Com
bine
d T
otal
Ham
ilton
C
ount
y
Cha
ttan
ooga
C
ity
Com
bine
d T
otal
Local 50.7 47.8 98.5 52.8 52.5 105.3 57.6 55.5 113.1
State 46.1 40.1 86.2 47.3 41 88.3 47.4 41.7 89.2
Federal 5.5 12.2 17.8 6.1 11.3 17 6.3 12.6 18.9
Total $102.34 $100.1 $202.43 $106.27 $104.8 $211.07 $111.37 $109.88 $221.24
After Consolidation1997 – 98 1998 – 99 1999 – 2000 * 2000 – 01 *
Hamilton County Hamilton County Hamilton County Hamilton CountyLocal 117.6 116.3 -- --
State 89.4 92.2 -- --
Federal 15.5 23.7 -- --
Total $222.54 $232.19 $249.85 $252.88
* Only total funding for these school years could be determined.
School Consolidation: Knoxville, Tennessee149
Graph 5. State Funding Before & After Consolidation
School Consolidation: Knoxville, Tennessee150
Graph 6. Local Funding Before & After Consolidation
School Consolidation: Knoxville, Tennessee151
Graph 7. Federal Funding Before & After Consolidation
School Consolidation: Knoxville, Tennessee152
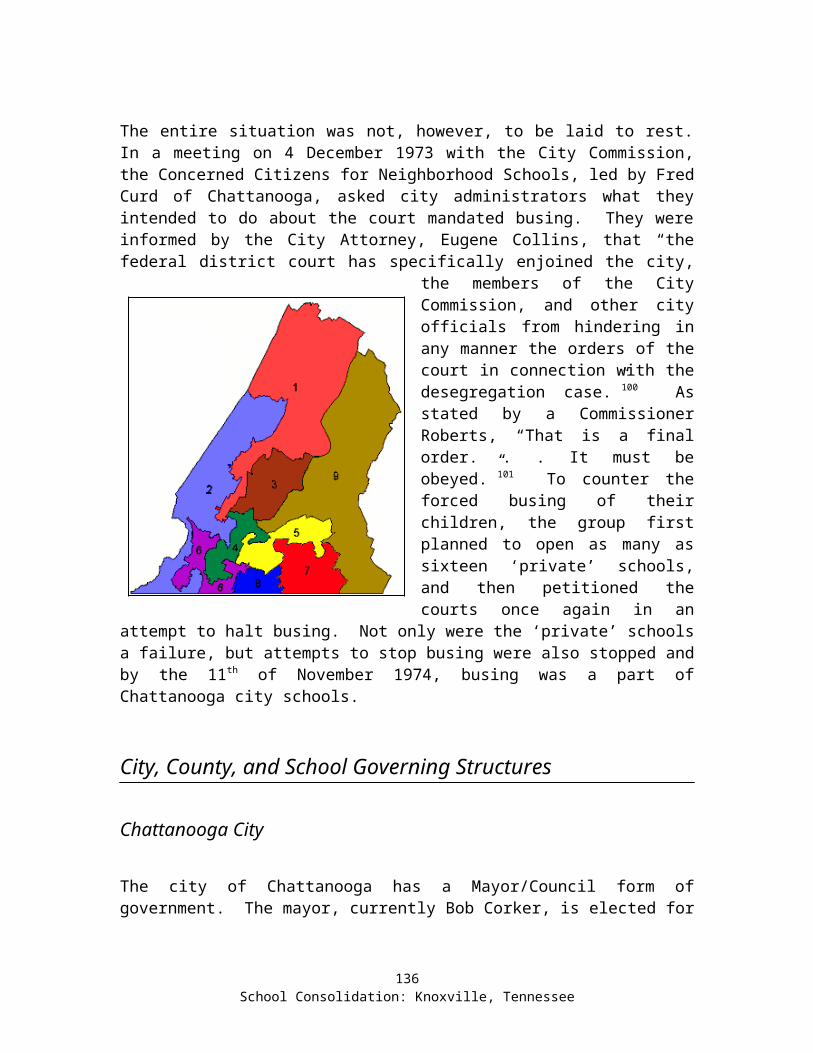
Graph 8. Total Funding From All Sources Before & After Consolidation
School Consolidation: Knoxville, Tennessee153
Operational and Per-Pupil Expenditures
To graph each type of operational expenditure would, unfortunately, take quite a bit of space and explanation. For the purposes of this study, however, it should suffice to say that expenditures for the Hamilton County and Chattanooga school systems, both before and after consolidation, continued to rise at a steady rate. An excellent bell-weather indicator of the emphasis placed upon education in Hamilton County can be seen in the Graph 9. Before consolidation, both systems maintained nearly the same rise in expenditures, with Hamilton County growing ate 12.7% from 1994-1995 through 1996-1997 and Chattanooga seeing a rise of 13.5% during the same period. After consolidation, however, the funds expended per pupil rose significantly each year, going from $4,487 in 1997-1998 to $6,440 in 1999-2000, an overall rise of 43.5% in three years.
School Consolidation: Knoxville, Tennessee154
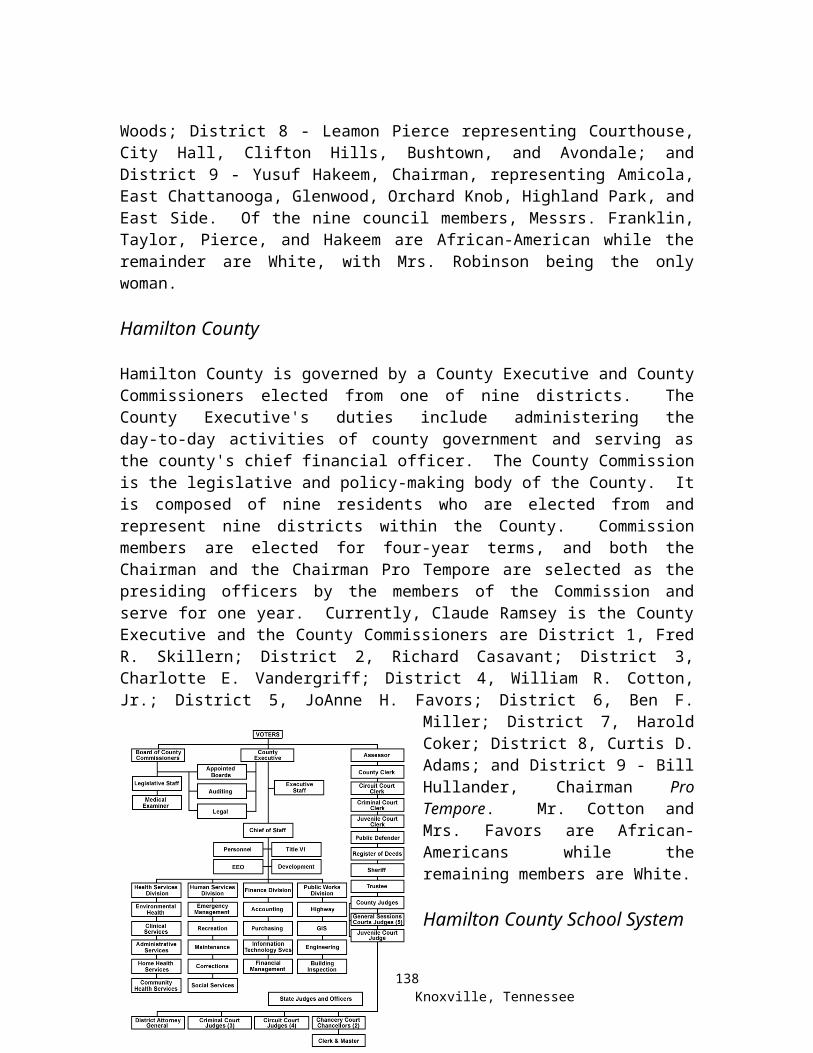
Table 5. Operational Expenditures & Per Pupil Expenditures
Expenditures in Millions of DollarsBefore Consolidation
1994 – 95 1995 – 96 1996 – 97
Ham
ilton
C
ount
y
Cha
ttan
ooga
C
ity
Com
bine
d T
otal
Ham
ilton
C
ount
y
Cha
ttan
ooga
C
ity
Com
bine
d T
otal
Ham
ilton
C
ount
y
Cha
ttan
ooga
C
ity
Com
bine
d T
otal
Operations 98.7 96.4 195.1 101.5 99.4 200.9 109.9 106.9 216.8Administration 9.5 9.3 18.8 9.5 9.9 19.4 10.5 11.5 22Regular Instruction 55.7 51.5 107.2 57.9 53 110.9 62.4 56.8 119.2Special Ed. 10.8 10.3 21.1 10.7 10.6 21.4 11.6 11.5 23.1Vocational Ed. 4.1 3.4 7.5 9.8 3.3 7.1 4.1 3.6 7.7Transportation 4.3 3.5 7.8 4.3 3.5 7.8 4.8 3.7 8.5Per Pupil Expenditures *
$4,456 $5,358 $4,907 $4,664 $5,494 $5,079 $5,023 $6,084 $5,554
After Consolidation1997 – 98 1998 – 99 ** 1999 – 2000 ***
Hamilton County Hamilton County Hamilton CountyOperations 210.6 -- --Administration -- -- --Regular Instruction 112.5 -- 122.3Special Ed. 23.3 -- 23.2Vocational Ed. 7.2 -- 6.8Transportation 8.6 -- 10.5Per Pupil Expenditures
$4,487 -- $6,440
* Per Pupil Expenditures for the Combined Total column are the average of the Hamilton County and Chattanooga City per pupil amounts.** Figures for the 1998 – 99 school year are only given as amounts spent per pupil and do not give a total dollar expended.*** Figures for Operations and Administration during school year 1999 – 2000 are not given in available data.
School Consolidation: Knoxville, Tennessee155
Graph 9. Per Pupil Expenditures
School Consolidation: Knoxville, Tennessee156
Average Teacher Salaries
Unfortunately, a pay scale illustrating solid monies for each level of teaching could not be obtained. Average salaries, however, were readily available. Teachers salaries were a major point of contention during the negotiations for consolidating the two school systems. As can be seen on the Graph 10 before consolidation Chattanooga City school teachers received considerably less than their Hamilton County contemporaries. It was determined, however, that this disparity could be overcome, and although the first years after consolidation saw the Hamilton County school teachers taking a slight reduction in pay at first, this was finally made up in the 1998-1999 and 1999-2000 school years with a raise that was well above even the highest pay before consolidation.
Table 6. Average Salaries for Hamilton County & Chattanooga City School Teachers for School Years
1994 – 95 through 1999 – 2000
School Year
Average Salary by Category
Hamilton County Chattanooga City Combined Average
Bef
ore
C
onso
lidat
ion 1994 – 95 $36,381 $33,539 $34,960
1995 – 96 $36,785 $34,494 $35,640
1996 – 97 $38,150 $39,792 $37,471
Afte
r C
onso
lidat
ion 1997 – 98 $37,625 -- --
1998 – 99 $38,196 -- --
1999 – 2000 $39,008 -- --
School Consolidation: Knoxville, Tennessee157
Graph 10. Average Teacher Salaries
School Consolidation: Knoxville, Tennessee158
Attendance
Attendance both before and after consolidation appears to be fairly excellent, with the averages being well above the 90% mark for all grades. Although Hamilton County saw better attendance rates before consolidation than did Chattanooga, an aggressive truancy policy appears to have stemmed the tide. Unfortunately, a copy of the truancy policy could not be obtained as it is in the process of being revamped for the next school year.
Table 7. Attendance Rate of Hamilton County & Chattanooga City Schools for School Years 1994 –
1995 through 1999 –2000
Grade Level
Before Consolidation1994 – 95 1995 – 96 1996 – 97
Ham
ilton
C
ount
y
Cha
ttan
ooga
C
ity
Com
bine
d A
vera
ge
Per
cent
ile
Ham
ilton
C
ount
y
Cha
ttan
ooga
C
ity
Com
bine
d A
vera
ge
Per
cent
ile
Ham
ilton
C
ount
y
Cha
ttan
ooga
C
ity
Com
bine
d A
vera
ge
Per
cent
ile
K – 5 -- -- -- -- -- -- -- -- --K – 6 95.2 93.1 94.15 95.5 93.8 94.65 95.59 92.3 93.956 – 8 -- -- -- -- -- -- -- -- --7 – 12 93.2 86.9 90.05 93.2 88 90.6 93.99 86.44 90.229 – 12 -- -- -- -- -- -- -- -- --C. A. P. * 93.2 90 94.35 90.9 94.79 89.37
After Consolidation1997 – 98 1998 – 99 1999 – 2000
Hamilton County Hamilton County Hamilton CountyK – 5 -- -- 94.5K – 6 94 94.4 --6 – 8 -- -- 92.67 – 12 91 93 --9 – 12 -- -- 91.1C. A. P. * 92.5 93.7 92.73
* Combined Average Percentile
Drop Out, Expulsion, and Suspension Rate
Drop outs, expulsions, and suspensions continue to be a problem in Hamilton County schools. As seen by the Table 8 and Graphs 11, 12 & 13 below, the numbers, although growing smaller for drop outs and expulsions, are still indicate
School Consolidation: Knoxville, Tennessee159
a overall rise. Solutions are being implemented in the Hamilton County schools which should, if given the proper support from parents, teachers, and administrators, bring these numbers down further. First, parents are being made responsible for their children’s behavior. Second, teachers and administrators are being trained to observe, report, and deal with those who may or have become a classroom ‘problem.’ Out-of-school suspensions are becoming rarer and are only utilized when the infraction is of a serious nature such as drugs, fighting, etc. More in-school suspensions are being used so, even though the student does not gain any ‘credit’ for their work, he or she does no lag behind their peers. Also, more stringent and structured alternative programs are being introduced to ensure that those who have become a ‘problem’ are given the opportunity receive the education they deserve.
Table 8. Drop Out, Expulsion & Suspension Rates for Hamilton County & Chattanooga City Schools for
School Years 1994 – 95 through 1999 – 2000
Before Consolidation1994 – 95 1995 – 96 1996 – 97
Ham
ilton
C
ount
y
Cha
ttan
ooga
C
ity
Com
bine
d T
otal
Ham
ilton
C
ount
y
Cha
ttan
ooga
C
ity
Com
bine
d T
otal
Ham
ilton
C
ount
y
Cha
ttan
ooga
C
ity
Com
bine
d T
otal
Drop Outs 572 1,472 2,044 1,076 1,209 2,285 1,008 1,403 2,411Expulsions 9 57 66 8 24 32 21 42 63Suspensions 2,101 2,343 4,444 2,243 2,030 4,273 1,813 2,637 4,450
After Consolidation1997 – 98 1998 – 99 1999 – 2000 *
Hamilton County Hamilton County Hamilton CountyDrop Outs 2,065 2,156 682Expulsions 113 143 113Suspensions 4,480 6,337 7,024
* The figures for 1999 – 2000 only contain those students who are either under or over age 18 and refer only to drop outs for disciplinary reasons. All other years contain drop outs for all reasons.
School Consolidation: Knoxville, Tennessee160
Graph 11. Overall Dropout Rates
School Consolidation: Knoxville, Tennessee161
Graph 12. Overall Expulsion Rates
School Consolidation: Knoxville, Tennessee162
Graph 13. Overall Suspension Rates
School Consolidation: Knoxville, Tennessee163
District Wide Standardized Testing
As can be seen in the following Tables 9A and 9B, standardized test scores in Hamilton County were higher than those found in Chattanooga City. After consolidation, the combination of both test scores did bring the average down somewhat.
School Consolidation: Knoxville, Tennessee164
Table 9A. Tennessee Comprehensive Assessment Program (TCAP)
School Consolidation: Knoxville, Tennessee165
Table 9B. ACT, SAT, Writing Assessment and Competency Test
School Consolidation: Knoxville, Tennessee166
Schools’ Public Relations Operations
The Hamilton County school system employs several persons in its Public Relations department, with the head of this section answering directly to the school Superintendent, Dr. Jesse Register. It is the responsibility of this section to communicate with all media - newspapers, radio, and television - and to implement newer, better, and faster means of disseminating information to the public. To date, this department has implemented several noteworthy avenues and methods of getting that information to all concerned citizens as well as the media. First, Dr. Register holds a weekly, one-hour-on-Monday-evening call-in talk show on local radio in which any citizens with concerns, suggestions, comments, or even praise can call in. Second, each of the nine members of the Hamilton County School Board holds a separate town-hall style evening meeting at least once a month at one of their district schools. Third, Dr. Register has a public e-mail address which is published and accessible to all citizens of Hamilton County.
Finally, the Hamilton County Department of Education maintains not only one of the most comprehensive Internet websites to be found in Tennessee, but possibly in the United States as well. Contained in this site are links to every department in the county’s school system; the school system’s complete, comprehensive, and unclassified 400-page-plus budget; general information on every regular and magnet school in the system, complete with all addresses, telephone numbers, and principals with their e-mail addresses as well as enrollment information for the magnet schools; and, information on the county school board, its members, their e-mail addresses, and their corresponding county districts and county council members.
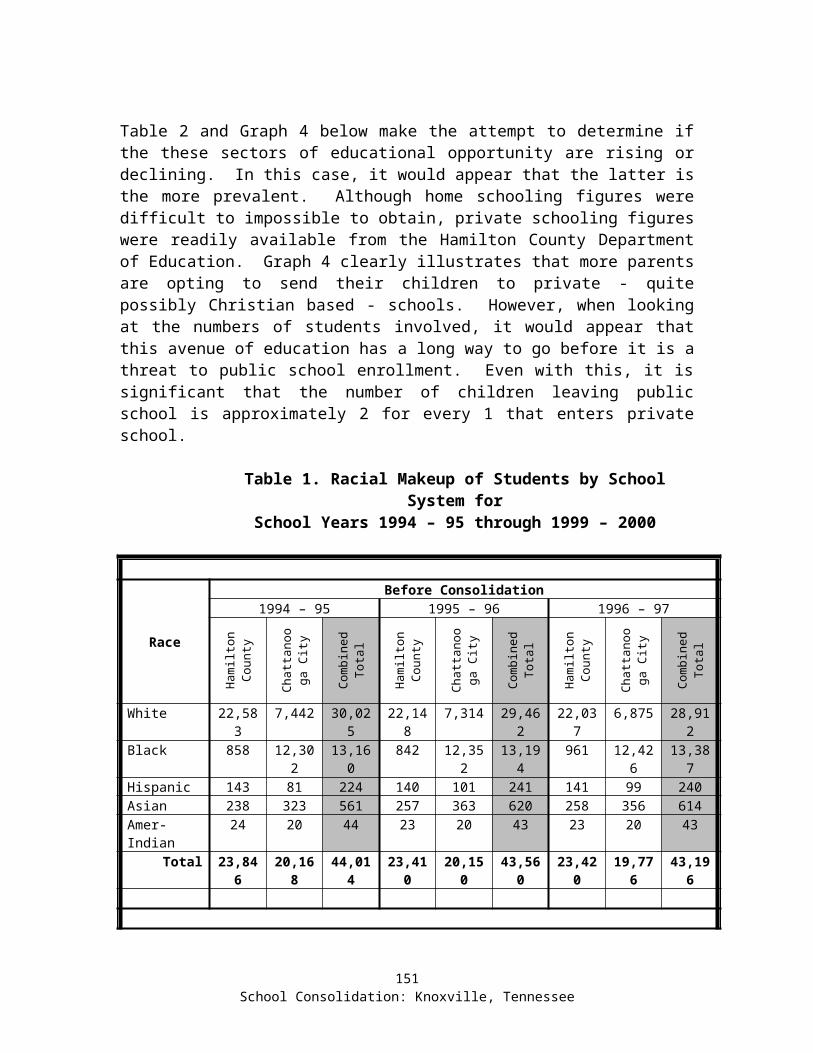
S O U R C E S C O N S U L T E D
Chattanooga New-Free Press. 28 September 1972 – 28 May 1998.
Chattanooga Times. 11 May 1971 – 14 June 1996.
Gaquin, Deirdre A. and Mark S. Littman, ed. 1999 County and City Extra: Annual Metro, City, and County Data Book. 8 ed. Washington D. C.: Bernan Press, 1999.
21st Century School Report Card: County/City Supplements, Hamlen-Hardeman. Nashville, TN: Tennessee Department of Education, 1999.
School Consolidation: Knoxville, Tennessee168
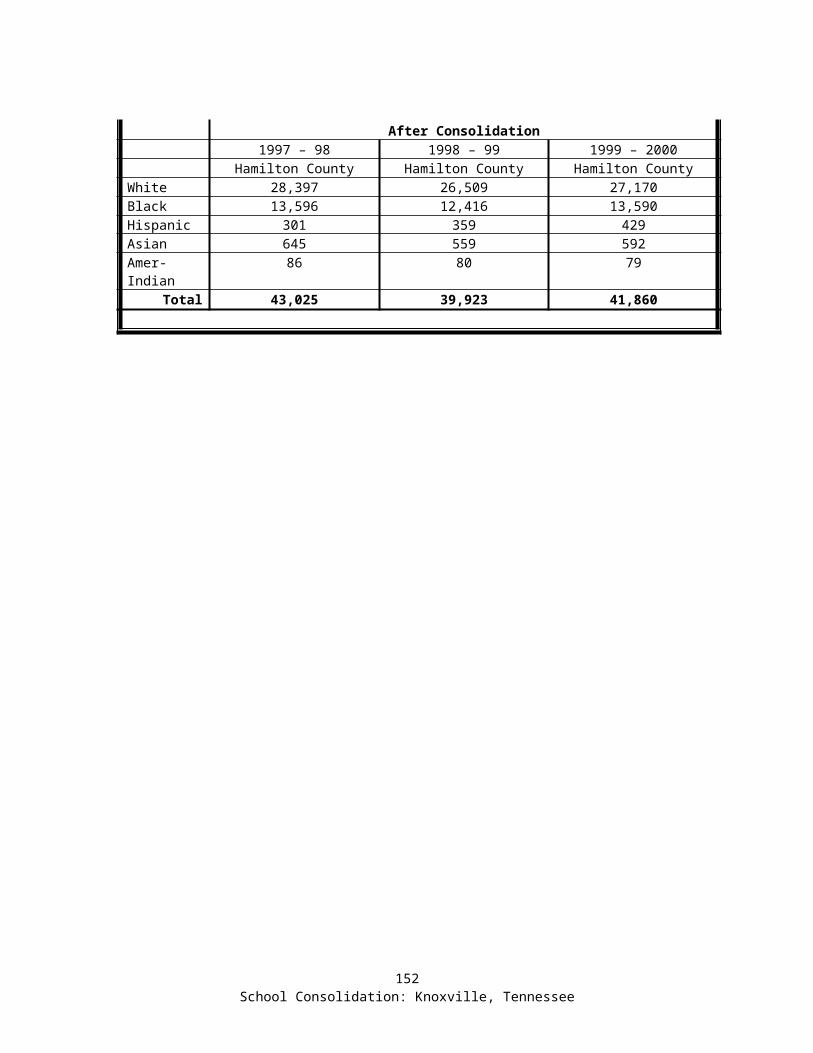
N O T E S
School Consolidation: Knoxville, Tennessee169

1. Significant portions of this information was derived from an interview with Gary Gordon, June 12, 2001. Gary grew up in Knoxville and was the second African American to graduate from Webb Academy there. He worked as a consultant for several governmental agencies including the TVA; and he was one of the five newcomers elected to the city board of education in 1985, serving at the time of consolidation. Also see “Historical Patterns of Social and Economic Discrimination Against African Americans in Knoxville, an unpublished report prepared by George White and Gary Gordon.2. See William J. MacArthur, Jr., “Knoxville’s History: An Interpretation,” in Lucille Deaderick, Heart of the Valley (Knoxville: East Tennessee Historical Society, 1976).3. Ibid., p. 23.4. MacArthur, “Knoxville’s History,” op. cit., pp. 45-54.5. MacArthur, “Knoxville’s History,” op. cit., pp. 28, 42, and 59.6. “Historical Patterns of Social and Economic Discrimination Against African Americans in Knoxville, unpublished report prepared by George White and Gary Gordon, 1999. 7. See John Gunther, Inside U. S. A. (New York and London: Harper & Brothers, 1947), p. 761; MacArthur, “Knoxville’s History,” op. cit., p. 66.8. See Aelred J. Gray and Mrs. Susan F. Adams, “Government,” in Lucille Deaderick, Heart of the Valley (Knoxville: East Tennessee Historical Society, 1976), Chapter 2.9. MacArthur, “Knoxville’s History,” op. cit., p. 40; Paul Kelley, “Education,” in Lucille Deaderick, Heart of the Valley (Knoxville: East Tennessee Historical Society, 1976), pp. 237-240.10. Quoted in Kelley, “Education,” p. 258.11. For example, see Roger Harris, “Desegregation 1989,” Knoxville News-Sentinel, September 17, 1989, p. A1.12. See the Knoxville Journal, January 6, 1959; February 26, 1959; and April 9, 1959.13. From 25.4 square miles in the 1960 census, Knoxville was listed as 77.0 square miles by 1970. By the 2000 census, it was 97.7 square miles, but the city’s population actually declined slightly, from 174,587 in 1970 to 173,890 by 2000.14. For example, see William Lyons and John Scheb, “Saying No,” State and Local Government Review (Spring 1998).15. From interviews with Sam Bratton, May 23, 2001 and Carolyn Smith, June 13, 2001. Sam worked in the central office of the county schools for nearly 40 years, serving much of that time as its Coordinator for Research and Evaluation. Carolyn has taught locally for the past 27 years and was the first president of the newly consolidated Knox County Education Association in 1987.16. Significant portions of this information was derived from an interview with Sam Bratton, May 23, 2001, op. cit.17. Significant portions of this information was derived from an interview with Sam Anderson, May 24, 2001. Sam taught and coached in the city schools; became the city’s Director of Parks and Recreation, the first African American to hold such an office in Knoxville; and he was elected to the consolidated county school board in May of 1988, where he remains its only African American member.18. Significant portions of this information was derived from interviews with Gary Gordon, June 12, 2001, op. cit; and with Steve Roberts, May 24, 2001. Steve became the Deputy Director of the Public Service Department after teaching in the city schools and working for a state agency. He was the leader of the five newcomers who formed the city school board majority at the time of consolidation.19. Ibid.20. Interview with Sam Bratton, May 23, 2001, op cit. 21. Knoxville News-Sentinel, November 5, 1986.22. Lair, op. cit.23. Knoxville News-Sentinel, November 5, 1986.24. Knoxville News-Sentinel, November 2, 1986.25. Roger Harris, “Inner-City Vote plays role in school issue,” Knoxville News-Sentinel, November 3, 1986.26. Knoxville News-Sentinel, November 5, 1986. 27. Jack Lair, “Campaign hits homestretch,” Knoxville News-Sentinel, November 2, 1986, p. 1.28. Marty Levany, “School Merger,” Knoxville News-Sentinel, November 4, 1986.29. Ibid.30. Lair, op. cit.31. Editorial, Knoxville News-Sentinel, November 11, 1986. 32. See Roger Harris, “Pension turmoil has 1960s roots,” Knoxville News-Sentinel, June 7, 1987.33. Knoxville News-Sentinel, May 21, 1987.34. Knoxville Journal, May 28, 1987; June 4, 1987.35. Knoxville Journal, July 1, 1987.36. Portions of this information were derived from an interview with Steve Roberts, May 24, 2001. Also see Lyons Scheb, “Saying No, op. cit. 37

. Using current dollars, the city schools outspent the county $2,460 to $2,217 in 1984-85; $2,721 to $2,472 in 1985-86; and $3,014 to $2,758 in 1986-87.38. The proportion of city teachers holding at least a B.A. degree declined from nearly 98% in 1976 to just over 95% by 1986, the last figures available before consolidation. The proportion with at least a master’s degree increased to a peak of 41% in 1982, only to slip back to just over 38% by 1986.39. Costs are the “actual” 1998-99 expenditures.40. Linda Clark, president of the Vine Middle School parent-teacher-student association, as quoted in the Knoxville News-Sentinel, December 8, 2000, p. EA2.41. Average Daily Attendance “Pupils Served” data was available, but it was not considered to be a reliable measure over time, in that the method of counting student riders changed significantly between 1996 and 1997.42. Knoxville Journal, September 14, 1991.43. This state-reported number seems to be derived by dividing Average Daily Attendance by Average Daily Membership (the best indicator of current enrollment). Average Daily Attendance is calculated by dividing the total Days Present by the Total Days of Instruction. Average Daily Membership is the Days Present plus the Days Absent divided by the total Days of Instruction.44. In particular, interviews with Sam Bratton and Sam Anderson supported this conclusion. Bratton was in charge of Research and Evaluation throughout the transition, while Anderson chaired the school board from 1991-1994 and remains its lone African-American member.45. See Jacquelyn Dean, “Ills of past, uncertainties of future shape Vine present,” Knoxville News-Sentinel, May 22, 1994, p. A1.46. Interview with Gary Gordon, June 12, 2001.47. Roger Harris, “Desegregation 1989,” Knoxville News Sentinel, September 17, 1989.48. From interview with Sam Anderson, May 24, 2001.49. Eric Vreeland, “Board wraps up school package over protests,” Knoxville News-Sentinel, April 23, 1991, p. A1.50. See Ed Marcum, “Magnet schools changing student body mix,” Knoxville News-Sentinel, December 8, 2000, p. EA2.51. A portion of this information was derived from an interview with Roy Mullins on June 13, 2001. Roy spent 40 years in the county school system, beginning as a teacher, principal, and then Superintendent of Human Resources. He was interim county school superintendent for the 1988-1989 academic year. He is currently the consolidated school’s Assistant Superintendent for Administrative Services.52. According to the United States Bureau of the Census, Knoxville had 173,210 people in 1986 and 173,890 in 2000. The comparable figures for Knox County were 329,500 and 382,032.53. Knoxville/Knox County Metropolitan Planning Commission, Knoxville Area Facts and Figures (Knoxville: Government Printing Office, various years).54. According to the United States Bureau of the Census, the Knoxville Metropolitan Statistical Area consists of the following counties: Anderson, Blount, Knox, Loudon, Sevier, and Union. See Figure 1. It had 400, 337 people in 1970, 565,970 in 1986 and 687,249 in 2000. The comparable figures for Knox County were 276, 293 in 1970, 329,500 in 1986, and 382,032 in 2000. Knoxville had 174, 587 in 1970, 173,210 in 1986 and 173,890 in 2000.55. According to the United States Bureau of the Census, the Knoxville Metropolitan Statistical Area had a population that was 6.8% black in 1970, 6.6% in 1990 and 6.5% in 2000. The comparable figures for Knox County were 8.4%, 8.8%, and 9.6%. Knoxville’s numbers were 12.8%, 15.8%, and 16.2%.56. Harris, “Board wraps up package over protests,” op. cit.57. Figures are used from the 1990-91 academic year as a baseline because earlier numbers were not available. At least these numbers pre-date the conversion of any of these schools to magnet program.58. It should be noted that 2000-2001 free or reduced price meal numbers were used in this comparison. Other “poor” schools by this measure included Christenberry Elementary: 84%; South Knoxville Elementary: 80%; Pond Gap Elementary: 78%; Inskip Elementary: 74%; Dogwood Elementary: 72%; West View Elementary: 71%.59. Interview with Sam Anderson, May 24, 2001. 60. Knoxville News-Sentinel, April 29, 2001, p. A1.61. Interview with Sam Anderson, May 24, 2001.62. Knoxville News-Sentinel, April 29, 2001, p. A1; Tennessee State Board of Education, Annual Report Card of the Knox County Schools (Nashville: Government Printing Office, various years).63. Interview with Carolyn Smith, June 13, 2001.64. Ibid.65. Interview with Sam Anderson, May 24, 2001 66. These numbers were derived by taking the “average daily membership” for all schools K-12, excluding “special” schools which tend to be smaller by definition, and dividing that number by the total number of schools.

67. Portions of this information came from an interview with Roy Mullins, June 13, 2001; and Carolyn Smith, June 13, 2001.68. Ibid.69. For example, see Marti Levary, “$16 million hike sought for schools,” Knoxville News-Sentinel, April 30, 1987.70. Knoxville News-Sentinel, July 1, 1987; Knoxville Journal, September 14, 1991. The figure ultimately became $2 million rather than $5 million in that the county was allowed by the courts to continue the city’s practice of using state annuity funds to offset the cost of these teachers’ higher pension benefits.71. Knoxville Journal, September 14, 1991.72. Knoxville Journal, September 14, 1991.73. Although property and sales taxes produced more than 99% of the “local” portion of school revenue, the remainder was derived from such sources licenses and permits, delinquent taxes, in lieu of tax contributions from businesses such as TVA, and a mixed drink tax.74
. Tennessee Education Association and Appalachia Educational Laboratory, Maintaining Positive Educator Morale During Consolidation (Washington, D.C.: U.S. Department of Education, May 1988).75. Interview with Sam Anderson, May 24, 2001. 76. Interview with Sam Anderson, May 24, 2001.77. Knox County “Budget Surveys,” prepared by William Lyons and John Scheb in the years 1995, 1996, 1998, 1999, and 2000.
78 1Carroll Van West, ed., Tennessee Encyclopedia of History and Culture (Nashville, TN: Rutledge Hill
Press, 1998), 139.
792Ibid.
803Ibid.
814Ibid., 140.
825Ibid.
836Ibid.
84Ibid., 398.
85Chattanooga Times, 11 May 1971.
86Ibid., 14 May 1971. Underlining added by author for emphasis.
87Ibid., 20 May 1971.
88Ibid.
89 Ibid., 3 June 1971.
90Ibid.
91Ibid., 13 June 1971.
92Ibid, 22 June 1971.
93Ibid., 24 June 1971.
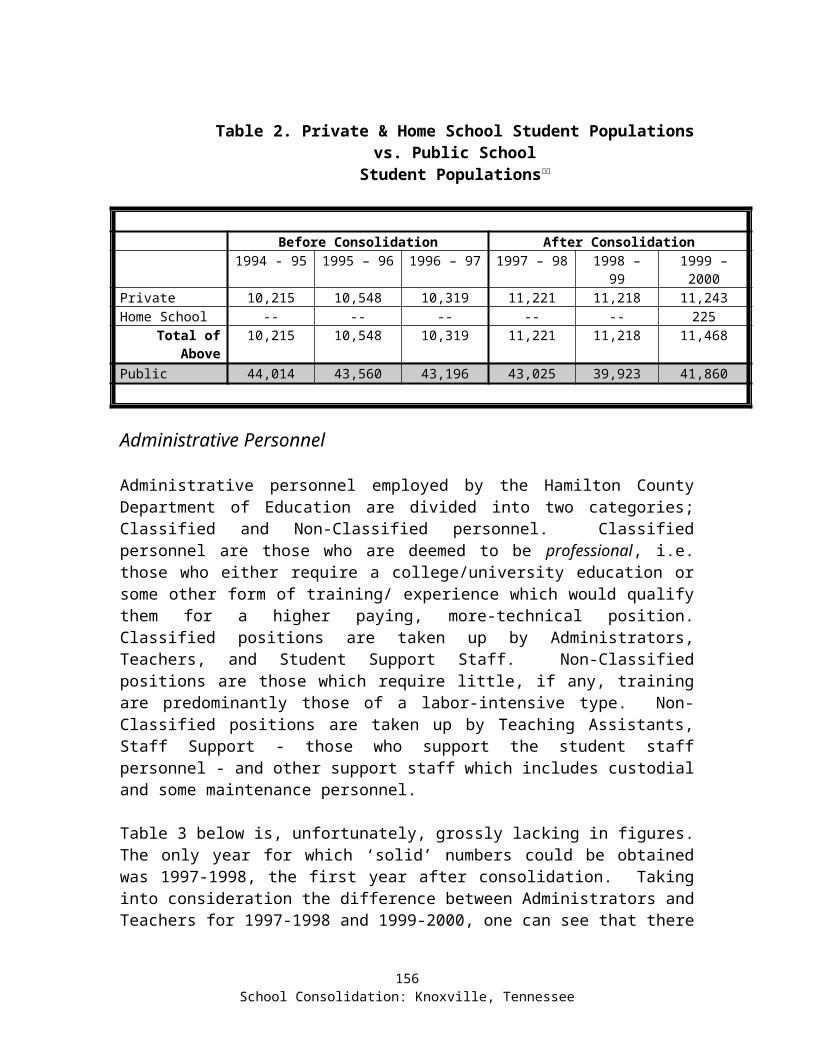
94Ibid., 2 July 1971.
95Ibid.
96Ibid., 28 September 1971; Chattanooga News-Free Press, 28 September 1971.
97Chattanooga Times, 25 May 1972.
98Chattanooga New-Free Press, 30 April 1973.
99Chattanooga Times, 17 November 1973.
100Ibid., 5 December 1973.
101Ibid.
102Chattanooga Times, 17 Jan. 1953.
103Ibid.
104Ibid., 12 Dec. 1960.
105Chattanooga Free Press, 24 Aug. 1994.
106Chattanooga Times, 9 Nov. 1994. The vote came to 22,694 ‘for’ merger and 19,044 ‘against.’
107Ibid., 22 Nov. 1994.
108Ibid., 16 Dec. 1994.
109Ibid.
110Ibid.
111Chattanooga Free Press, 2 Feb. 1995.
112Chattanooga Times, 7 June 1995.
113Ibid.
114Chattanooga Free Press, 15 Nov. 1995.
115Ibid., 16 Nov. 1995.
116Ibid., 17 Nov. 1995.
117Ibid.
118Chattanooga Times, 15 Dec. 1995.
119Ibid., 16 Dec. 1995.
120Ibid., 22 Dec. 1995.
121Chattanooga Free Press, 11 Apr. 1996.
122Ibid.
123Ibid.
124Ibid.
125Chattanooga Times, 24 May 1996.