Embed Size (px)
Citation preview
Construction of a Practical System Using the Sieve Method andImage Analysis for Evaluation of Masticatory Performance-Development of a New Device for Scanning Masticatory Samples-
Fumiko OKUTSU1§, Toshinari AKIMOTO2, Mie KURIHARA1,Ayumi MATSUI1, Kazuhiko OKAMOTO1, Nobuyuki TERADA3
and Shuji OHKAWA1
1Division of Removable Prosthodontics, Department of Restorative and Biomaterials Sciences, Meikai University, School of Dentistry2Department of Innovative Systems Engineering, Nippon Institute of Technology
3Department of Biomedical Engineering, Faculty of Science and Engineering, Toyo University
Abstract : A practical system for evaluating masticatory efficiency was established using a newly developed masticatory imag-
ing analyzer to analyze digital images of masticatory samples. As test food, six peanut halves each weighing 0.50±0.05 g (totaling
3.00±0.10 g) were prepared. In experiment 1, volunteers spat the comminuted test food onto two sieves (6-mesh, 10-mesh). A re-
gression equation was established to determine the estimated weight of the food according to the size of the comminuted particles
remaining on the sieve. These remaining particles were measured by size using two-dimensional image analysis and by weight af-
ter being dried in an oven and desiccator (measured weight). In experiment 2, the estimated weight was calculated using the re-
gression equation obtained in experiment 1 (estimated weight). Regression analysis between the measured weight and estimated
weight of the remaining particles was conducted. In experiment 3, masticatory efficiency was calculated for 20 volunteers free of
temporomandibular disorders. The remaining particles on the 10-mesh sieve were used exclusively for the calculation. The results
obtained were as follows. (1) A cubic regression equation was obtained according to the size of the remaining particles and the
measured weight of the remaining particles. (2) There was a significant relationship between the weight estimated with the cubic
regression equation and the measured weight of the remaining particles. (3) Using the developed method, the average masticatory
efficiency of 20 individuals without temporomandibular disorders was calculated to be 81.8%±7.0%
Key words : masticatory efficiency, mastication, digital image analysis, binary process, regression equations
篩分法に画像解析を応用した新しい咀嚼機能検査システムの構築-新たな咀嚼試料撮影装置の開発-
奥津 史子1§ 秋元 俊成2 栗原 美詠1 松井藍有美1
岡本 和彦1 寺田 信幸3 大川 周治1
1明海大学歯学部機能保存回復学講座歯科補綴学分野2日本工業大学創造システム工学科
3東洋大学理工学部生体医工学科
要旨:本研究の目的は,新しい咀嚼試料撮影装置と画像解析プログラムの開発を行い,新たな咀嚼機能検査システムを構築することである.実験 1では咀嚼試料(ピーナッツ)を咀嚼粉砕した後,2種類の篩で分けた咀嚼試料(残留試料)の二次元画像より得られた粒子面積と,Manly らの方法に従って乾燥した後の残留試料の重量(実測重量)から,その粒子の重量を予測する回帰式を求めた.実験 2では,実験 1で得た回帰式を応用し,残留試料の二次元画像から残留試料の予測される重量(予測重量)を算出,および残留試料の実測重量を計測し,予測重量と実測重量との回帰分析を行った.実験 3では実験 1,実験 2の分析結果を基に,健常有歯顎者 20名における咀嚼値を算出した.その結果,実験 1で得ら
明海歯学(J Meikai Dent Med)43(1), 11−17, 2014 11
Introduction
Mastication is an important function in the stoma-tognathic system. Masticatory disturbance may causesnot only nutritional problems but also may have a det-rimental effect on lifestyle and quality of life. Amongthe major aims of prosthesis are recovery of mastica-tory function and masticatory efficiency. A means ofevaluating masticatory efficiency is therefore impor-tant in judging objectively the success of prosthodon-tic treatment. A reliable assessment of masticatoryperformance is a valuable contribution to the practiceof evidence-based dentistry, and the establishment of asimpler accurate method of measuring masticatory per-formance is helpful in diagnosis and dental treatment.
Evaluation methods for masticatory function areclassified into direct and indirect methods. Directmethods include methods for assessing masticatoryfunction based on the particle size distribution of achewing sample (e.g., peanuts, raw rice, or impressionmaterials)1−8), the glucose concentration dissolved froma chewing sample (e.g., gummy-jelly)9−13), the mixingability of a chewing sample (e.g., gum or wax)14−20),and a masticatory performance questionnaire21) Indirectmethods include analyzing mandibular movement andmuscular activities22−30), the occlusal contact area31, 32),and biting force33).
Among these masticatory tests, the sieve method1),which is based on the distribution and size of peanutparticles, is the most standardized test in terms of re-producibility and accuracy. The sieve method is re-ferred to in much of the literature and is still under-taken in controlled experiments in many works on
evaluation methods for mastication4, 16, 17, 33). The sievemethod has been widely applied to evaluate mastica-tion34−36). Schimmel et al. 19) described the sieve methodas the “gold standard” test of chewing efficiency. Al-though considered the “gold standard” of tests formasticatory performance, the sieve method is compli-cated and time consuming in terms of drying andweighing masticated particles, which makes it difficultto apply in routine dental practice. The purpose of thisstudy is to construct a practical system for evaluatingmasticatory efficiency using a newly developed de-vice, the masticatory imaging analyzer (MIA), for theanalysis of digital images of chewed particles.
Materials and methods
As the test food, six peanut halves weighing 0.50±0.05 g each were used in a uniform combination sothat their total weight was within the range of 3.00±0.10 g. All peanut halves were weighed with an elec-tronic balance (HR-60, A & D, Tokyo, Japan) havingprecision of 0.05 g.
Three experiments were carried out on subjects whohad a full complement of teeth (except for the thirdmolars). They were free of symptoms of temporoman-dibular disorder and clinical signs of disorder in theirstomatognathic systems. They also understood the im-portance of recovering all chewed particles afterchewing the test food. This study was approved by theethics committee of the Meikai University School ofDentistry (A−0830). Written informed consent was ob-tained from each subject after a full explanation of theresearch project.
Experiment 1 : Analysis of the two-dimensionalarea and weight of individual comminuted particlesof the test food
Ten subjects (six males and four females, mean age
れた三次回帰式を用いて残留試料の二次元画像から算出した予測重量と実測重量との間には,相関が認められた.本方法を応用して健常有歯顎者 20名の平均咀嚼値 81.8±7.0%が得られた.以上より,残留試料を乾燥させることなく,同試料の乾燥処理後の重量を予測することが可能となった.
索引用語:咀嚼機能検査法,篩分法,画像解析,咀嚼
─────────────────────────────§Correspondence : Fumiko Okutsu, Division of Removable Prostho-
dontics, Department of Restorative and Biomaterials Sciences, Mei-kai University, School of Dentistry, 1-1 Keyakidai, Sakado, Saitama,350-0283 Japan.
12 OKUTSU F, AKIMOTO T, KURIHARA M, et al J Meikai Dent Med 43, 2014
of 26.6±2.5 years) volunteered to participate in ex-periment 1. The subjects were instructed to masticatethe test food on their preferred chewing side for both5 and 20 continuous and sequential strokes. This proc-ess was repeated three times. All subjects chewed thetest food, spat the sample into a beaker without swal-lowing, rinsed their mouth several times, and spat therinse into a beaker along with the rinsed particles andwater to provide a volume of 300 ml . The volumewas stirred gently with a magnetic stirrer (IkemotoScientific Technology, Tokyo, Japan) for a minute tobreak up clumps, and poured onto a sieve.
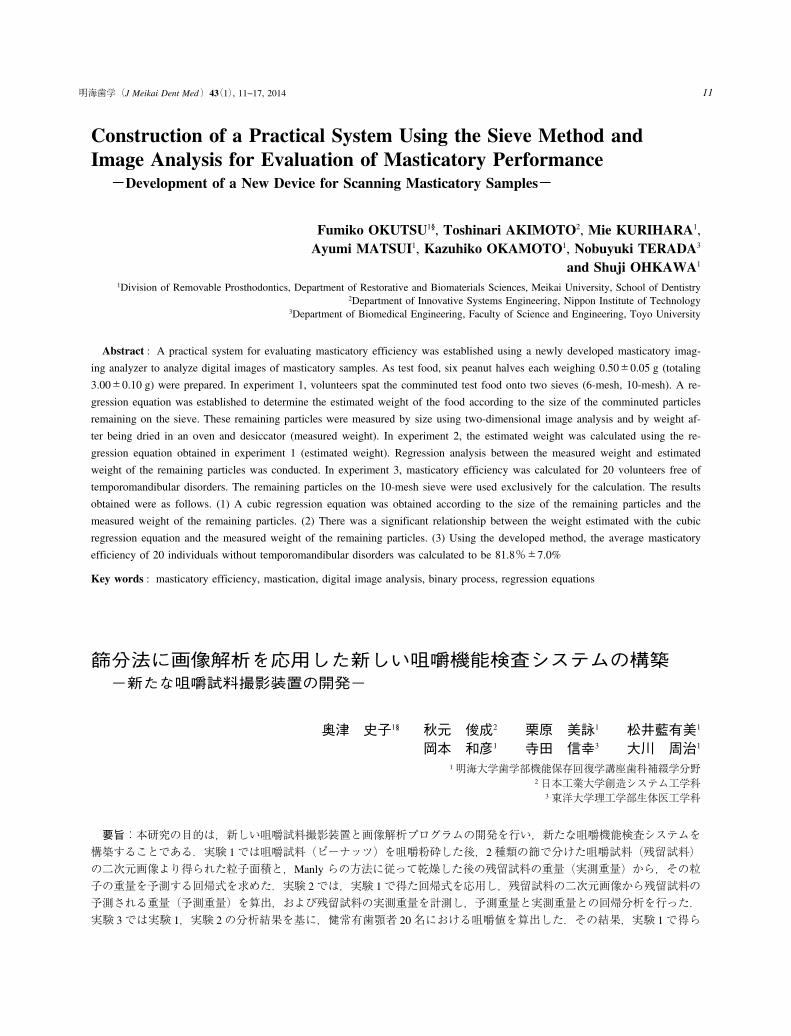
The sieves used conformed to the ISO 3310-1 stan-dard. The particles chewed for five strokes weresieved using a 6-mesh sieve, and the particles chewedfor 20 strokes were sieved using a 10-mesh sieve. Theremaining particles on the sieve (RPs) were dried in adry oven (Ikemoto Scientific Technology, Tokyo, Ja-pan) at 100°C for 3 hours and then transferred to adesiccator for 2 hours. All chewing samples weremade anonymous by allocation of a number. The two-dimensional area of the dried RPs was measured (X(pixels)) using the newly developed MIA (Fig 1). Af-ter the area was measured, each dried RP wasweighed with precision of 0.001 g (Y (gram)). A re-gression equation was established to determine the es-timated weight of the food according to the area ofthe RPs.
We used a digital camera (ARTCAM-130 SN, Ar-tray, Tokyo, Japan) with high resolution (1.3×10⁶
pixels).The images of the RPs were imported onto a personal
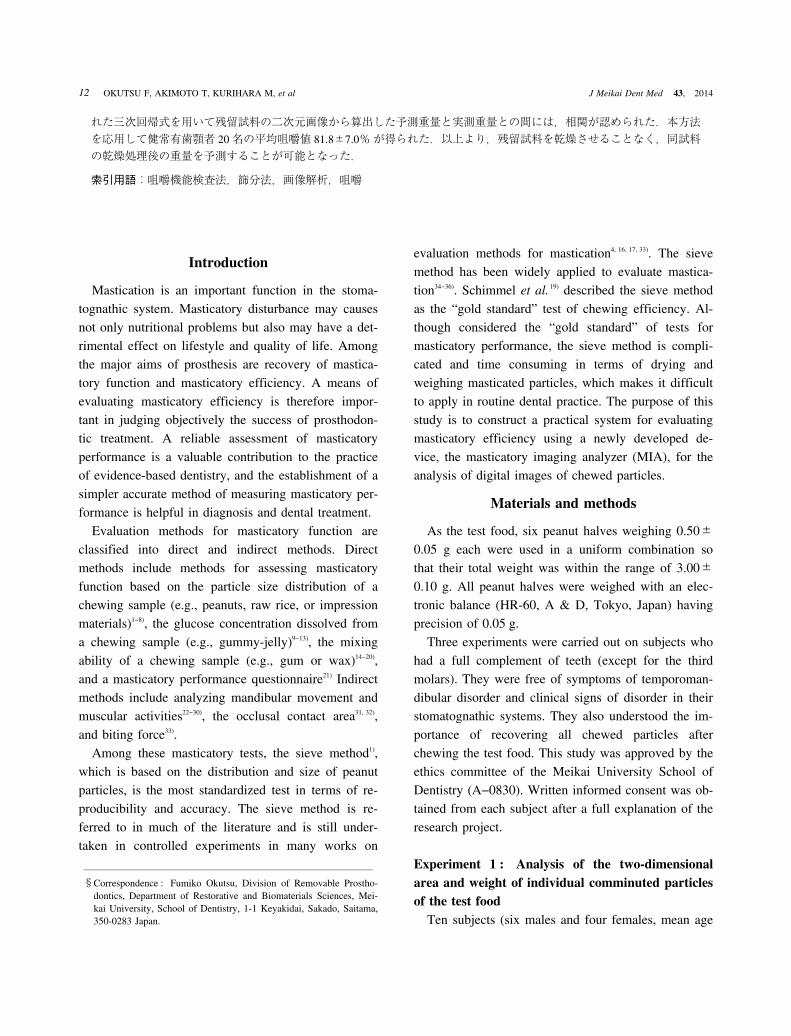
computer (ThinkPad, LenovoJapan, Tokyo, Japan)automatically and then processed and analyzed withimage analysis software (Art-Viewer v. 1201, Artray,Tokyo, Japan). Brightness and contrast were automati-cally adjusted and set to red/black (red : RPs, black :background) using a color depth threshold of 200 (Fig2). In this way, the area of each RP was measured.The values of all areas were saved as txt files and im-ported into Excel (Microsoft Office Excel 2007, WA,USA).
Experiment 2 : Regression analysis of estimatedweight and measured weight
Three subjects (two males and a female, mean ageof 25.0±1.4 years) volunteered to participate in ex-periment 2. Each subject was instructed to chew thetest food on his/her preferred chewing side for 3, 5, 7,and 20 strokes in separate procedures. The masticationof test food was repeated twice for each number ofstrokes (3, 5, 7, and 20). The sieving procedure wasthe same as that in experiment 1. The particleschewed for 20 strokes were sieved using a 10-meshsieve, the particles chewed for 7 strokes were sievedusing a 6-mesh sieve, the particles chewed for 5strokes were sieved using a 5-mesh sieve, and the par-ticles chewed for three strokes were sieved using a 3-mesh sieve. The RPs were dried in the same manneras in experiment 1, and the two-dimensional area ofthe dried RPs was measured (X (pixels)) using theMIA. The estimated weight was calculated using thecubic regression equation obtained in experiment 1(estimated weight). Regression analysis was employed
Fig 1 Prototype and personal computer. Fig 2 Screen shot during image analysis.
Practical System Using the Sieve Method 13
to calculate the correlation between the measuredweight and estimated weight.
Experiment 3 : Calculation of masticatory per-formance of dentulous subjects
Twenty subjects (9 males and 11 females, mean ageof 26.9±3.7 years) volunteered to participate in ex-periment 3. The subjects were instructed to masticatethe test food on their preferred chewing side for 20continuous, sequential strokes. This process was re-peated three times, and the total area of the RPs wasthen measured. The estimated weight was calculatedby applying the resulting two-dimensional area to theresults of experiment 1 and 2. Masticatory perform-ance was then determined according to the followingin accordance with sieve method1.
Masticatory Performance=[weight of test food×0.8]-[analyzed weight of remaining particles]
[weight of test food×0.8] ×100
Results
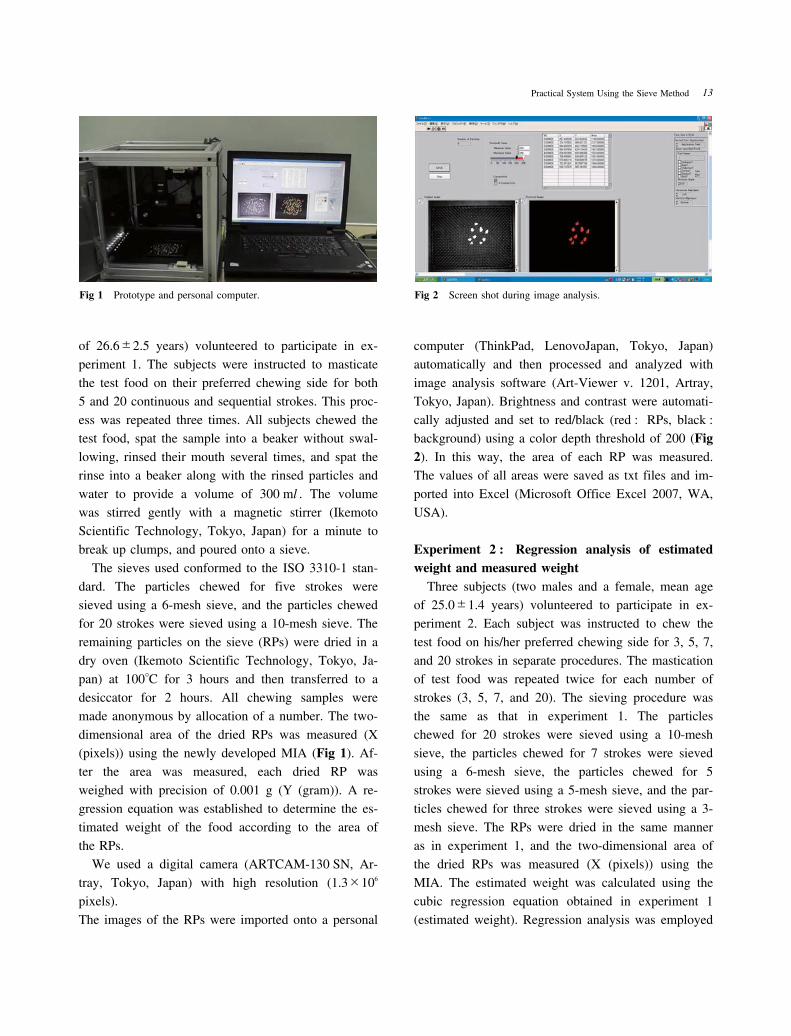
Experiment 1A total of 2251 comminuted particles were obtainedfrom the 10 subjects (Table 1). Assigning the area ofsieve fractions (pixels) and the weight of sieve frac-tions (grams), a cubic regression equation was ob-tained as follows ;y=-3×10−13x3+6×10−9x2+10−5x
(R=0.99, p<0.0001) (Fig 3).
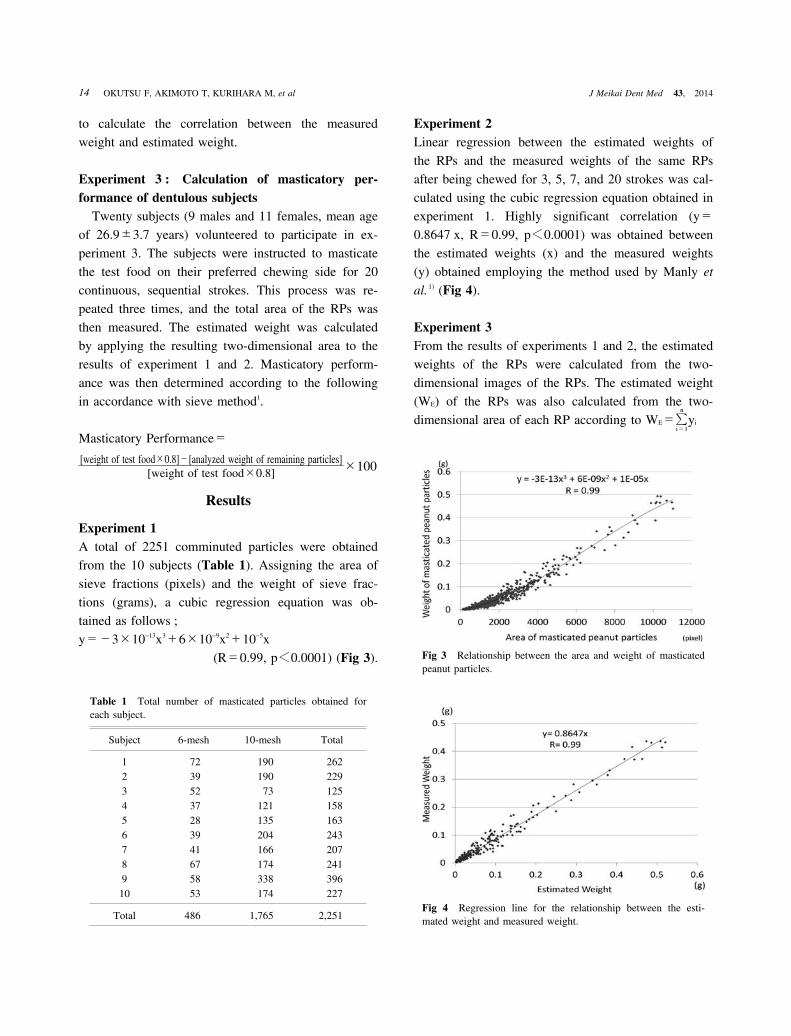
Experiment 2Linear regression between the estimated weights ofthe RPs and the measured weights of the same RPsafter being chewed for 3, 5, 7, and 20 strokes was cal-culated using the cubic regression equation obtained inexperiment 1. Highly significant correlation (y=0.8647 x, R=0.99, p<0.0001) was obtained betweenthe estimated weights (x) and the measured weights(y) obtained employing the method used by Manly et
al. 1) (Fig 4).
Experiment 3From the results of experiments 1 and 2, the estimatedweights of the RPs were calculated from the two-dimensional images of the RPs. The estimated weight(WE) of the RPs was also calculated from the two-dimensional area of each RP according to WE=
n�i=1
yi
Fig 3 Relationship between the area and weight of masticatedpeanut particles.
Fig 4 Regression line for the relationship between the esti-mated weight and measured weight.
Table 1 Total number of masticated particles obtained foreach subject.
Subject 6-mesh 10-mesh Total
123456789
10
72395237283941675853
190190
73121135204166174338174
262229125158163243207241396227
Total 486 1,765 2,251
14 OKUTSU F, AKIMOTO T, KURIHARA M, et al J Meikai Dent Med 43, 2014
(y=-3×10−13x3+6×10−9x2+10−5x, the cubic regres-sion equation obtained from experiment 1). Further-more, the modified WE analyzed weight (WA) was cal-culated from a linear regression equation (y=0.8647x, the linear regression obtained from experiment 2) ofthe estimated weight and measured weight of the RPs.The average masticatory performance of the 20 sub-jects was calculated from the modified WE (Table 2).The average masticatory performance of the 20 sub-jects was 81.8%±7.0%, calculated from the modifiedWE
Discussion
1. Test foodVarious kinds of test foods have been used in mastica-tory investigations. Representative examples are artifi-cial materials, such as impression materials, and natu-ral foods, such as peanuts, almonds, carrots, meat, andfishcakes (called kamaboko). Peanuts are tasty, inex-pensive, and a natural food that is eaten often. There-fore, it is easy to obtain a natural chewing motionwhen subjects chew peanuts. However, since peanutsare a natural food, it is difficult to standardize them asa test food. Only peanuts strictly within the massrange of 0.50±0.05 g were used as chewing samplesin this study.
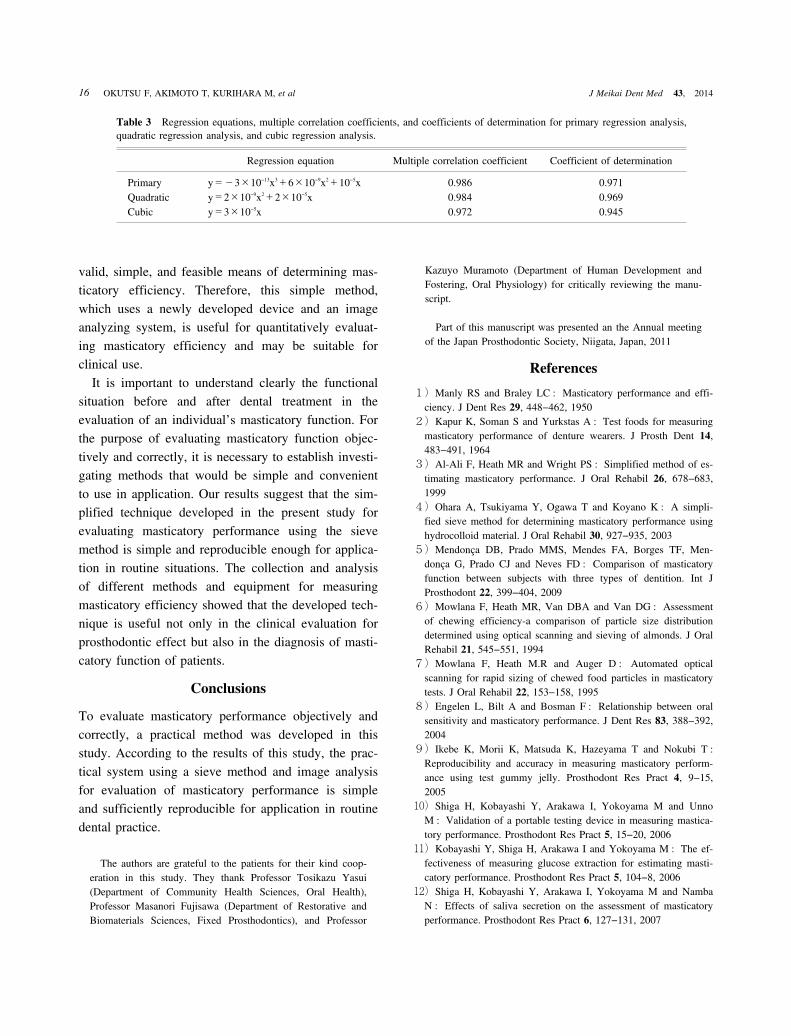
2. Image processing algorithmImage analysis in the present study involved measure-ment of the two-dimensional area of each particle by
setting a single manual threshold and employing a bi-nary process that separated the comminuted particlesinto red and black (Figs 2 and 5). A chromaticityvalue of 200 was used to prevent light reflected fromthe sieve from being recognized as remaining particleswhile still allowing accurate recognition of all actualparticles. The same sample was measured three timesconsecutively, and the measurement results for the im-ages―the number of particles and area of particles(pixels)―during binary processing are shown in Fig5. The coefficient of variation was used to assess howprecisely the new device measured the areas of fourirregularly shaped pieces of white paper (51 mm×75mm, 34 mm×26 mm, 17 mm×26 mm, and 8.5 mm×26 mm in size) three times each. The coefficient ofvariation was±0.004. Employing this method con-firmed that binary processing is useful in measuring atwo-dimensional area.
3. Regression equations and masticatory perform-ance
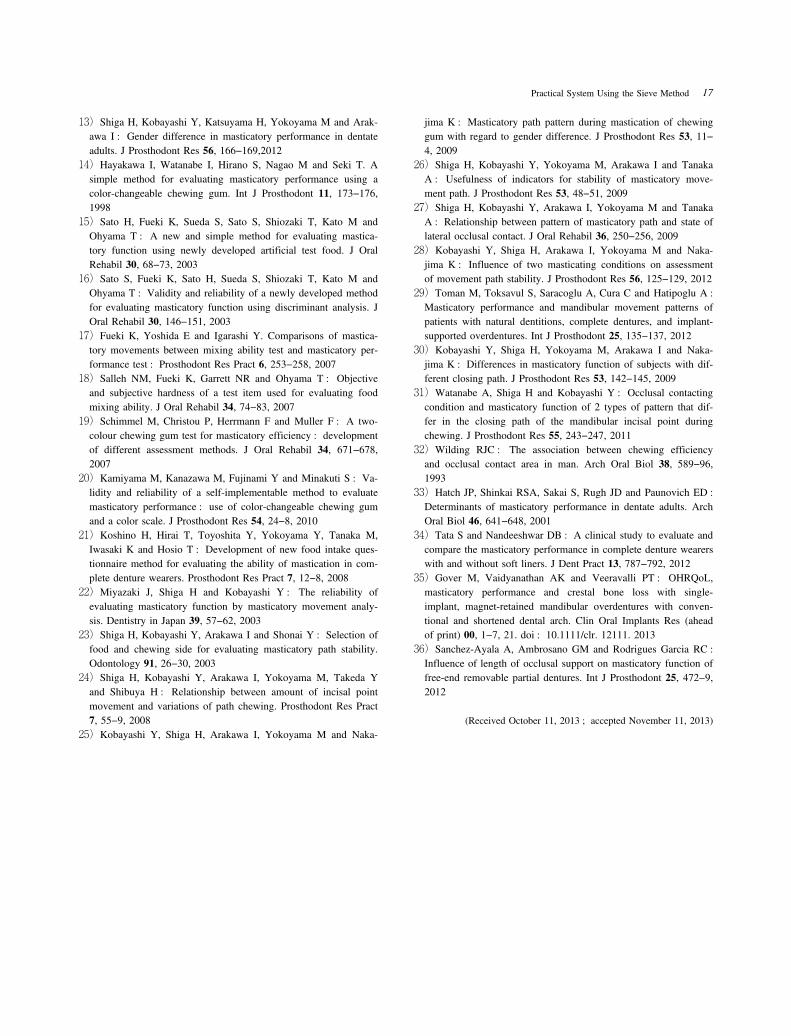
A regression equation having a high multiple correla-tion coefficient was obtained in experiment 1 (Fig 3).The distribution of the area (X) and weight (Y) wasfitted with a cubic equation ; the highest coefficientof determination was obtained for a cubic equation(Table 3). In experiment 2, a linear regression equa-tion was obtained from a scatter diagram, and highlysignificant correlation was observed between the esti-mated weight and measured weight (Fig 4). Thisstudy concludes that the image analysis method is a
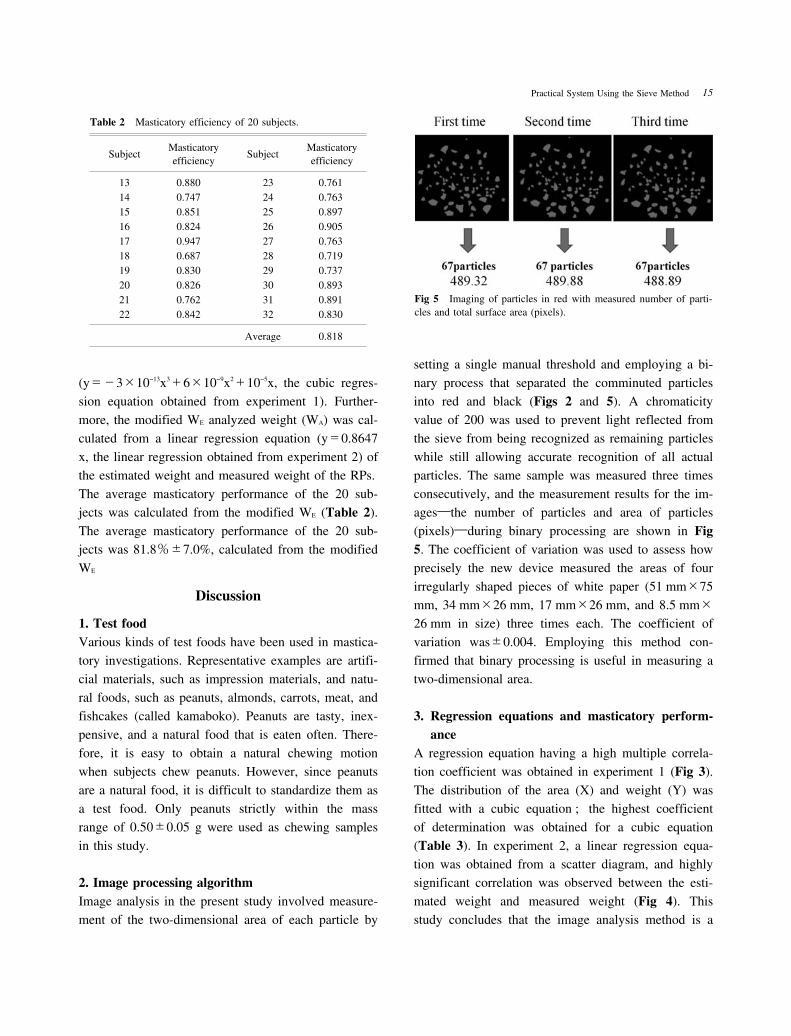
Table 2 Masticatory efficiency of 20 subjects.
SubjectMasticatoryefficiency
SubjectMasticatoryefficiency
13141516171819202122
0.8800.7470.8510.8240.9470.6870.8300.8260.7620.842
23242526272829303132
0.7610.7630.8970.9050.7630.7190.7370.8930.8910.830
Average 0.818
Fig 5 Imaging of particles in red with measured number of parti-cles and total surface area (pixels).
Practical System Using the Sieve Method 15
valid, simple, and feasible means of determining mas-ticatory efficiency. Therefore, this simple method,which uses a newly developed device and an imageanalyzing system, is useful for quantitatively evaluat-ing masticatory efficiency and may be suitable forclinical use.
It is important to understand clearly the functionalsituation before and after dental treatment in theevaluation of an individual’s masticatory function. Forthe purpose of evaluating masticatory function objec-tively and correctly, it is necessary to establish investi-gating methods that would be simple and convenientto use in application. Our results suggest that the sim-plified technique developed in the present study forevaluating masticatory performance using the sievemethod is simple and reproducible enough for applica-tion in routine situations. The collection and analysisof different methods and equipment for measuringmasticatory efficiency showed that the developed tech-nique is useful not only in the clinical evaluation forprosthodontic effect but also in the diagnosis of masti-catory function of patients.
Conclusions
To evaluate masticatory performance objectively andcorrectly, a practical method was developed in thisstudy. According to the results of this study, the prac-tical system using a sieve method and image analysisfor evaluation of masticatory performance is simpleand sufficiently reproducible for application in routinedental practice.
The authors are grateful to the patients for their kind coop-eration in this study. They thank Professor Tosikazu Yasui(Department of Community Health Sciences, Oral Health),Professor Masanori Fujisawa (Department of Restorative andBiomaterials Sciences, Fixed Prosthodontics), and Professor
Kazuyo Muramoto (Department of Human Development andFostering, Oral Physiology) for critically reviewing the manu-script.
Part of this manuscript was presented an the Annual meetingof the Japan Prosthodontic Society, Niigata, Japan, 2011
References
1)Manly RS and Braley LC : Masticatory performance and effi-ciency. J Dent Res 29, 448−462, 1950
2)Kapur K, Soman S and Yurkstas A : Test foods for measuringmasticatory performance of denture wearers. J Prosth Dent 14,483−491, 1964
3)Al-Ali F, Heath MR and Wright PS : Simplified method of es-timating masticatory performance. J Oral Rehabil 26, 678−683,1999
4)Ohara A, Tsukiyama Y, Ogawa T and Koyano K : A simpli-fied sieve method for determining masticatory performance usinghydrocolloid material. J Oral Rehabil 30, 927−935, 2003
5)Mendonça DB, Prado MMS, Mendes FA, Borges TF, Men-donça G, Prado CJ and Neves FD : Comparison of masticatoryfunction between subjects with three types of dentition. Int JProsthodont 22, 399−404, 2009
6)Mowlana F, Heath MR, Van DBA and Van DG : Assessmentof chewing efficiency-a comparison of particle size distributiondetermined using optical scanning and sieving of almonds. J OralRehabil 21, 545−551, 1994
7)Mowlana F, Heath M.R and Auger D : Automated opticalscanning for rapid sizing of chewed food particles in masticatorytests. J Oral Rehabil 22, 153−158, 1995
8)Engelen L, Bilt A and Bosman F : Relationship between oralsensitivity and masticatory performance. J Dent Res 83, 388−392,2004
9)Ikebe K, Morii K, Matsuda K, Hazeyama T and Nokubi T :Reproducibility and accuracy in measuring masticatory perform-ance using test gummy jelly. Prosthodont Res Pract 4, 9−15,2005
10)Shiga H, Kobayashi Y, Arakawa I, Yokoyama M and UnnoM : Validation of a portable testing device in measuring mastica-tory performance. Prosthodont Res Pract 5, 15−20, 2006
11)Kobayashi Y, Shiga H, Arakawa I and Yokoyama M : The ef-fectiveness of measuring glucose extraction for estimating masti-catory performance. Prosthodont Res Pract 5, 104−8, 2006
12)Shiga H, Kobayashi Y, Arakawa I, Yokoyama M and NambaN : Effects of saliva secretion on the assessment of masticatoryperformance. Prosthodont Res Pract 6, 127−131, 2007
Table 3 Regression equations, multiple correlation coefficients, and coefficients of determination for primary regression analysis,quadratic regression analysis, and cubic regression analysis.
Regression equation Multiple correlation coefficient Coefficient of determination
PrimaryQuadraticCubic
y=-3×10−13x3+6×10−9x2+10−5xy=2×10−9x2+2×10⁻⁵xy=3×10−5x
0.9860.9840.972
0.9710.9690.945
16 OKUTSU F, AKIMOTO T, KURIHARA M, et al J Meikai Dent Med 43, 2014
13)Shiga H, Kobayashi Y, Katsuyama H, Yokoyama M and Arak-awa I : Gender difference in masticatory performance in dentateadults. J Prosthodont Res 56, 166−169,2012
14)Hayakawa I, Watanabe I, Hirano S, Nagao M and Seki T. Asimple method for evaluating masticatory performance using acolor-changeable chewing gum. Int J Prosthodont 11, 173−176,1998
15)Sato H, Fueki K, Sueda S, Sato S, Shiozaki T, Kato M andOhyama T : A new and simple method for evaluating mastica-tory function using newly developed artificial test food. J OralRehabil 30, 68−73, 2003
16)Sato S, Fueki K, Sato H, Sueda S, Shiozaki T, Kato M andOhyama T : Validity and reliability of a newly developed methodfor evaluating masticatory function using discriminant analysis. JOral Rehabil 30, 146−151, 2003
17)Fueki K, Yoshida E and Igarashi Y. Comparisons of mastica-tory movements between mixing ability test and masticatory per-formance test : Prosthodont Res Pract 6, 253−258, 2007
18)Salleh NM, Fueki K, Garrett NR and Ohyama T : Objectiveand subjective hardness of a test item used for evaluating foodmixing ability. J Oral Rehabil 34, 74−83, 2007
19)Schimmel M, Christou P, Herrmann F and Muller F : A two-colour chewing gum test for masticatory efficiency : developmentof different assessment methods. J Oral Rehabil 34, 671−678,2007
20)Kamiyama M, Kanazawa M, Fujinami Y and Minakuti S : Va-lidity and reliability of a self-implementable method to evaluatemasticatory performance : use of color-changeable chewing gumand a color scale. J Prosthodont Res 54, 24−8, 2010
21)Koshino H, Hirai T, Toyoshita Y, Yokoyama Y, Tanaka M,Iwasaki K and Hosio T : Development of new food intake ques-tionnaire method for evaluating the ability of mastication in com-plete denture wearers. Prosthodont Res Pract 7, 12−8, 2008
22)Miyazaki J, Shiga H and Kobayashi Y : The reliability ofevaluating masticatory function by masticatory movement analy-sis. Dentistry in Japan 39, 57−62, 2003
23)Shiga H, Kobayashi Y, Arakawa I and Shonai Y : Selection offood and chewing side for evaluating masticatory path stability.Odontology 91, 26−30, 2003
24)Shiga H, Kobayashi Y, Arakawa I, Yokoyama M, Takeda Yand Shibuya H : Relationship between amount of incisal pointmovement and variations of path chewing. Prosthodont Res Pract7, 55−9, 2008
25)Kobayashi Y, Shiga H, Arakawa I, Yokoyama M and Naka-
jima K : Masticatory path pattern during mastication of chewinggum with regard to gender difference. J Prosthodont Res 53, 11−4, 2009
26)Shiga H, Kobayashi Y, Yokoyama M, Arakawa I and TanakaA : Usefulness of indicators for stability of masticatory move-ment path. J Prosthodont Res 53, 48−51, 2009
27)Shiga H, Kobayashi Y, Arakawa I, Yokoyama M and TanakaA : Relationship between pattern of masticatory path and state oflateral occlusal contact. J Oral Rehabil 36, 250−256, 2009
28)Kobayashi Y, Shiga H, Arakawa I, Yokoyama M and Naka-jima K : Influence of two masticating conditions on assessmentof movement path stability. J Prosthodont Res 56, 125−129, 2012
29)Toman M, Toksavul S, Saracoglu A, Cura C and Hatipoglu A :Masticatory performance and mandibular movement patterns ofpatients with natural dentitions, complete dentures, and implant-supported overdentures. Int J Prosthodont 25, 135−137, 2012
30)Kobayashi Y, Shiga H, Yokoyama M, Arakawa I and Naka-jima K : Differences in masticatory function of subjects with dif-ferent closing path. J Prosthodont Res 53, 142−145, 2009
31)Watanabe A, Shiga H and Kobayashi Y : Occlusal contactingcondition and masticatory function of 2 types of pattern that dif-fer in the closing path of the mandibular incisal point duringchewing. J Prosthodont Res 55, 243−247, 2011
32)Wilding RJC : The association between chewing efficiencyand occlusal contact area in man. Arch Oral Biol 38, 589−96,1993
33)Hatch JP, Shinkai RSA, Sakai S, Rugh JD and Paunovich ED :Determinants of masticatory performance in dentate adults. ArchOral Biol 46, 641−648, 2001
34)Tata S and Nandeeshwar DB : A clinical study to evaluate andcompare the masticatory performance in complete denture wearerswith and without soft liners. J Dent Pract 13, 787−792, 2012
35)Gover M, Vaidyanathan AK and Veeravalli PT : OHRQoL,masticatory performance and crestal bone loss with single-implant, magnet-retained mandibular overdentures with conven-tional and shortened dental arch. Clin Oral Implants Res (aheadof print) 00, 1−7, 21. doi : 10.1111/clr. 12111. 2013
36)Sanchez-Ayala A, Ambrosano GM and Rodrigues Garcia RC :Influence of length of occlusal support on masticatory function offree-end removable partial dentures. Int J Prosthodont 25, 472−9,2012
(Received October 11, 2013 ; accepted November 11, 2013)
Practical System Using the Sieve Method 17