Embed Size (px)
Citation preview
ACPD12, 13667–13689, 2012
Contribution ofgarbage burning tochloride and PM2.5
G. Li et al.
Title Page
Abstract Introduction
Conclusions References
Tables Figures
J I
J I
Back Close
Full Screen / Esc
Printer-friendly Version
Interactive Discussion
Discussion
Paper
|D
iscussionP
aper|
Discussion
Paper
|D
iscussionP
aper|
Atmos. Chem. Phys. Discuss., 12, 13667–13689, 2012www.atmos-chem-phys-discuss.net/12/13667/2012/doi:10.5194/acpd-12-13667-2012© Author(s) 2012. CC Attribution 3.0 License.
AtmosphericChemistry
and PhysicsDiscussions
This discussion paper is/has been under review for the journal Atmospheric Chemistryand Physics (ACP). Please refer to the corresponding final paper in ACP if available.
Contribution of garbage burning tochloride and PM2.5 in Mexico CityG. Li1,2, W. Lei1, N. Bei1, and L. T. Molina1,2
1Molina Center for the Energy and the Environment, La Jolla, CA, USA2Massachusetts Institute of Technology, Cambridge, MA, USA
Received: 12 May 2012 – Accepted: 24 May 2012 – Published: 1 June 2012
Correspondence to: G. Li ([email protected]), L. T. Molina ([email protected])
Published by Copernicus Publications on behalf of the European Geosciences Union.
13667
ACPD12, 13667–13689, 2012
Contribution ofgarbage burning tochloride and PM2.5
G. Li et al.
Title Page
Abstract Introduction
Conclusions References
Tables Figures
J I
J I
Back Close
Full Screen / Esc
Printer-friendly Version
Interactive Discussion
Discussion
Paper
|D
iscussionP
aper|
Discussion
Paper
|D
iscussionP
aper|
Abstract
The contribution of garbage burning (GB) emissions to chloride and PM2.5 in the Mex-ico City Metropolitan Area (MCMA) is investigated for the period of 24 to 29 Marchduring the MILAGRO-2006 campaign using the WRF-CHEM model. When the MCMA-2006 official emission inventory without biomass burning is used in the simulations,5
the WRF-CHEM model significantly underestimates the observed particulate chloridein the urban and the suburban areas. The inclusion of GB emissions substantially im-proves the simulations of particulate chloride; GB contributes more than 60 % of theobservation, indicating it is a major source of particulate chloride in Mexico City. GByields up to 3 pbb HCl at the ground level in the city, which is mainly caused by the10
burning of polyvinyl chloride (PVC) in the garbage. GB is also an important source ofPM2.5, contributing about 3–30 % simulated PM2.5 mass on average. More modelingwork is needed to evaluate the GB contribution to hazardous air toxics, such as dioxin,which is found to be released at high level from PVC burning in laboratory experiments.
1 Introduction15
Biomass burning (BB) is an important source of ambient PM2.5 (particulate matter withaerodynamic diameter less than 2.5 µm) and emits approximately more than 80 % oftotal carbonaceous aerosol mass in the atmosphere (Andreae and Merlet, 2001; Bondet al., 2004). BB aerosols not only adversely affect human health and air quality from re-gional to global scales (Lighty et al., 2000; Lelieveld et al., 2001), but also contribute to20
the large uncertainty in the current understanding of radiative forcing (IPCC, 2007). De-pending on the nature of the burned biomass and the burning conditions, BB aerosolshave varying capacities for absorbing and reflecting incident solar radiation, with a di-rect radiative forcing of +0.03±0.12 W m−2 globally (IPCC, 2007). Considering micro-physical interactions between aged BB aerosols and clouds (aerosol indirect effect), an25
13668
ACPD12, 13667–13689, 2012
Contribution ofgarbage burning tochloride and PM2.5
G. Li et al.
Title Page
Abstract Introduction
Conclusions References
Tables Figures
J I
J I
Back Close
Full Screen / Esc
Printer-friendly Version
Interactive Discussion
Discussion
Paper
|D
iscussionP
aper|
Discussion
Paper
|D
iscussionP
aper|
even greater uncertainty is involved when trying to determine the BB aerosol climateforcing (Brioude et al., 2009; Randles and Ramaswamy, 2010; Grell et al., 2011).
Wild fires and combustion of biofuel are the two largest types of global BB. Re-cent field measurements in central Mexico by Christian et al. (2010) have shown thatgarbage burning (GB) may be a commonly overlooked important global source of5
emissions, considering the global garbage generation of about 2000 Tg yr−1 with halfburned.
Open garbage burning is a common practice to dispose of solid waste that takesplace in both developing and developed countries. In developed countries, this practicemainly takes place in rural areas where collection of municipal waste is not as efficient10
as in urban areas and is usually done in the backyard of houses. For example, inrural areas of the US, about 12–40 % of households burn garbage in their backyards(US EPA, 2006). In developing countries, open garbage burning occurs in locationswhere collection and management of solid waste are not implemented or inadequate,even in urban areas, and includes backyard burning and open dump burning. Open15
garbage burning produces smoke and emits a wide variety of compounds includingblack carbon, air toxics and Greenhouse gases (Costner, 2005, 2006). In addition tothe release of toxic chemicals that are harmful to human health, the smoke from thefire can deposit chemicals on garden vegetables, crops and soil and eventually enteringinto the food chain.20
Christian et al. (2010) estimated a fine particle emission factor for GB in CentralMexico of about 10.5 g kg−1 and observed large HCl emission factor in the range of 2–10 g kg−1. They also suggested that GB is a major source of HCl and may generate asmuch as 6–9 Tg yr−1 globally. Numerous studies have attempted to evaluate the impactof BB from wild fires on local and regional air quality using chemical transport models25
(e.g., Wang and Christopher, 2006; Zeng et al., 2008; Tian et al., 2009). Previousstudies have shown that the air quality in Mexico City is frequently influenced by openbiomass burning from nearby mountains and savannas surrounding the city (Molinaet al., 2010). However, few studies have been conducted to investigate the impact of
13669
ACPD12, 13667–13689, 2012
Contribution ofgarbage burning tochloride and PM2.5
G. Li et al.
Title Page
Abstract Introduction
Conclusions References
Tables Figures
J I
J I
Back Close
Full Screen / Esc
Printer-friendly Version
Interactive Discussion
Discussion
Paper
|D
iscussionP
aper|
Discussion
Paper
|D
iscussionP
aper|
GB on air quality due to lack of the observed emission factor and emission estimatesof trace gases and particles for GB. During the MCMA-2006 field campaign as part ofthe MILAGRO (Megacity Initiative: Local and Global Research Observations) projectconducted in March 2006, an extensive data set relevant to emissions, transport andtransformations of pollutants was obtained, including highly time-resolved ambient gas5
phase species and aerosols (Molina et al., 2010). In addition, during the spring of2007, Christian et al. (2010) and Yokelson et al. (2011) measured the initial emissionsof trace gases and aerosol speciation for elemental and organic carbon (EC and OC),anhydrosugars, Cl−1, NO−1
3 , and 20 metals from several garbage fires in Central Mexicoand obtained the emission factors of trace gases and particles for GB. All of these10
observations have provided an opportunity to assess the contribution of GB to the airquality in a polluted urban area.
The purpose of this study is to evaluate the impacts of GB on the air quality, partic-ularly the contribution of GB on chloride and PM2.5, for Mexico City using the WRF-CHEM model based on the measurements taken during MCMA-2006. The WRF-15
CHEM model and the model configuration are described in Sect. 2. Results of themodeling experiments and comparisons are presented in Sect. 3, and the Conclusionsare given in Sect. 4.
2 Model and method
2.1 WRF-CHEM model20
The WRF-CHEM model used in the present study is developed by Li et al. (2010,2011b, c) at Molina Center for Energy and the Environment, with a new flexible gasphase chemical module which can be utilized in different chemical mechanisms, in-cluding CBIV, RADM2, and SAPRC. The gas-phase chemistry is solved by an Eulerianbackward Gauss-Seidel iterative technique with a number of iterations. The short-lived25
species, such as OH and O(1D), are assumed to be in the steady state. The solution
13670
ACPD12, 13667–13689, 2012
Contribution ofgarbage burning tochloride and PM2.5
G. Li et al.
Title Page
Abstract Introduction
Conclusions References
Tables Figures
J I
J I
Back Close
Full Screen / Esc
Printer-friendly Version
Interactive Discussion
Discussion
Paper
|D
iscussionP
aper|
Discussion
Paper
|D
iscussionP
aper|
is iterated until all species are within 0.1 % of their previous iterative values. For theaerosol simulations, the CMAQ (version 4.6) aerosol module developed by EPA, whichis designed to be an efficient and economical depiction of aerosol dynamics in the at-mosphere, is incorporated in the WRF-CHEM model (Binkowski and Roselle, 2003). Inthis aerosol component, the particle size distribution is represented as the superposi-5
tion of three lognormal sub-distributions, called modes. The processes of coagulation,particle growth by the addition of mass, and new particle formation are included. Thewet deposition also follows the method used in the CMAQ/Models3. Surface depositionof chemical species is parameterized following Wesely (1989). The photolysis rates arecalculated using the FTUV (Tie et al., 2003; Li et al., 2005).10
The inorganic aerosols are predicted in the WRF-CHEM model using ISORROPIAVersion 1.7 (http://nenes.eas.gatech.edu/ISORROPIA/), which calculates the com-position and phase state of an ammonium-sulfate-nitrate-chloride-sodium-calcium-potassium-magnesium-water inorganic aerosol in thermodynamic equilibrium with gasphase precursors. The kind of thermodynamic equilibrium is delicately dependent on15
the environmental humidity and temperature. In this study, ISORROPIA is mainly uti-lized to predict the thermodynamic equilibrium between the ammonia-sulfate-nitrate-chloride-water aerosols and their gas phase precursors of H2SO4-HNO3-NH3-HCl-water vapor.
The secondary organic aerosol (SOA) formation is simulated using a non-traditional20
SOA model including the volatility basis-set modeling method in which primary organiccomponents are assumed to be semi-volatile and photochemically reactive and aredistributed in logarithmically spaced volatility bins (Li et al., 2011a). The partitioningof semi-volatile organic species is calculated using the algorithm suggested by Koo etal. (2003), in which the bulk gas and particle phases are in equilibrium and all con-25
densable organics form a pseudo-ideal solution (Odum et al., 1996). Nine surrogatespecies with saturation concentrations from 10−2 to 106 µg m−3 at room temperatureare used for the primary organic aerosol (POA) components following the approach of
13671
ACPD12, 13667–13689, 2012
Contribution ofgarbage burning tochloride and PM2.5
G. Li et al.
Title Page
Abstract Introduction
Conclusions References
Tables Figures
J I
J I
Back Close
Full Screen / Esc
Printer-friendly Version
Interactive Discussion
Discussion
Paper
|D
iscussionP
aper|
Discussion
Paper
|D
iscussionP
aper|
Shrivastava et al. (2008). Detailed description about the volatility basis-set approachcan be found in Li et al. (2011a).
2.2 Model configuration
Two three-day episodes are selected in the present study: (1) 24–26 March 2006, and(2) 27–29 March 2006, representing typical “O3-Convection South” and “O3-Convection5
North” meteorological conditions in Mexico City, respectively (de Foy et al., 2008), withminor impacts of wildfire BB. O3-Convection South takes place when there is a weaknortherly wind component aloft with rain in the southern part of the Mexico City basin.O3-Convection North occurs when there is a weak southerly wind component aloftwith a gap flow and rain in the northern part of the basin. The WRF-CHEM model is10
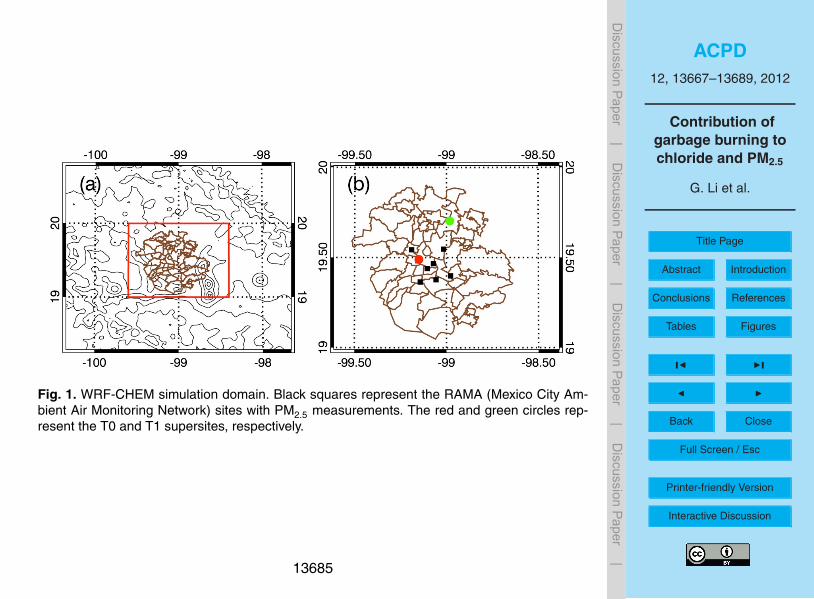
configured with one grid with spacing of 3 km (99×99 grid points) centered at 19.538◦ Nand 99◦ E (Fig. 1). Thirty-five vertical levels are used in a stretched vertical grid withspacing ranging from 50 m near the surface, to 500 m at 2.5 km and 1 km above 14 kmaltitude. The model employs the Lin microphysics scheme (Lin et al., 1983), the YonseiUniversity (YSU) PBL scheme (Noh et al., 2001), the Noah land-surface model (Chen15
and Dudhia, 2000), the longwave radiation parameterization (Mlawer et al., 1997), andthe shortwave radiation parameterization (Dudhia, 1989). The meteorological initial andboundary conditions are from NCEP 1×1◦ reanalysis data. The chemical initial andboundary conditions are interpolated from MOZART 3-hour output (Horowitz et al.,2003).20
The non-BB emission inventory (EI) used in the present study is the 2006 EI devel-oped at Molina Center with the primary PM emissions (Song et al., 2010). The POAemissions are redistributed following the study of Tsimpidi et al. (2010). The GB EI wasdeveloped based on the garbage fire emissions factors measured during MILAGRO(Christian et al., 2010) and the literature (Lemieux et al., 2004; Akagi et al., 2011), in25
conjunction with a 1×1 km spatial distribution of population and socioeconomic clas-sifications in Mexico City (Hodzic et al., 2012). The uncertainty of the estimated GBemissions is a factor of 2 or more. This GB emission inventory has recently been ap-
13672
ACPD12, 13667–13689, 2012
Contribution ofgarbage burning tochloride and PM2.5
G. Li et al.
Title Page
Abstract Introduction
Conclusions References
Tables Figures
J I
J I
Back Close
Full Screen / Esc
Printer-friendly Version
Interactive Discussion
Discussion
Paper
|D
iscussionP
aper|
Discussion
Paper
|D
iscussionP
aper|
plied in two model-based studies to investigate the GB impacts on air quality in MexicoCity (Hodzic et al., 2012; Lei et al., 2012). In order to evaluate the GB contributions tochloride, the measured emission factors of particulate chloride and HCl by Christian etal. (2010) are used in this study: 0.467 g particulate chloride and 4.82 g HCl per kg fuelburned, respectively.5
Two case simulations are performed in this study. In the first case, only the non-BB emissions are considered in simulations (hereafter referred to as B-case). In thesecond case (hereafter referred to as G-case), the GB emissions are included togetherwith the non-BB emissions. We compare the model results from the B-case and G-casewith measurements obtained at the T0 urban supersite and T1 suburban supersite, and10
evaluate the GB contributions to chloride and PM2.5.
3 Results
The WRF-CHEM model performance during the simulation period from 24 to 29 March2006 in Mexico City can be found in Li et al. (2011a, b). In general, the WRF-CHEMmodel performs well in modeling the temporal variations and spatial distributions of O315
and CO compared with the measurements at RAMA (ambient air monitoring network)sites during daytime, but the simulated nighttime O3 and CO deviate frequently from theobservation due to the difficulties in modeling the meteorological fields at nighttime andthe complexity of the nighttime chemistry (Li et al., 2011a). In addition, the simulatedorganic, black carbon, nitrate, and ammonium aerosols are in good agreement with the20
surface observations at T0 and aircraft measurements. The WRF-CHEM has difficultiesin simulating sulfate aerosols, which are influenced by multiple sources with substantialemission uncertainties in Mexico City (Li et al., 2011b).
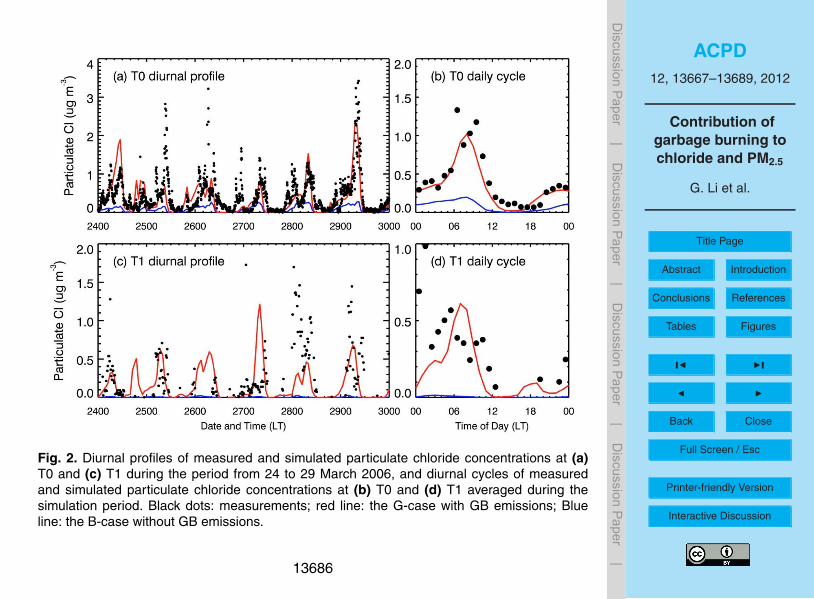
Figure 2a shows the diurnal profiles of simulated and observed particulate chlorideat T0 from 24 to 29 March, 2006. The particulate chloride at T0 was measured using a25
High-Resolution Time-of-Flight Aerosol Mass Spectrometer (HR-ToF-AMS) and com-plementary instrumentation during MILAGRO field campaign (Aiken et al., 2009). The
13673
ACPD12, 13667–13689, 2012
Contribution ofgarbage burning tochloride and PM2.5
G. Li et al.
Title Page
Abstract Introduction
Conclusions References
Tables Figures
J I
J I
Back Close
Full Screen / Esc
Printer-friendly Version
Interactive Discussion
Discussion
Paper
|D
iscussionP
aper|
Discussion
Paper
|D
iscussionP
aper|
observed particulate chloride shows large late night/early morning spikes, especiallyin the early morning on 25, 26 and 29 March, with mass concentrations exceeding3 µg m−3. In the B-case with only non-BB emissions, the particulate chloride concen-trations are underestimated substantially compared to the observations, particularlyduring early morning. When the GB emissions are considered in the G-case, the WRF-5
CHEM model tracks reasonably well the particulate chloride diurnal variability com-pared with the measurement at T0. For example, the occurrence of peak particulatechloride concentrations is well replicated, and the accumulation of nighttime particu-late chloride concentrations and the rapid falloff of late morning particulate chlorideconcentrations are also reproduced. However, the G-case frequently underestimates10
the observed particulate chloride spikes, especially in the early morning on 25 and26 March, indicating either unawareness of unknown sources or uncertainties frommeteorological field simulations. Figure 2b shows the diurnal cycle of observed andsimulated particulate chloride concentrations at T0 over the simulation period. Both theB-case and G-case show good performance in simulating the particulate chloride diur-15
nal cycles, but the B-case underestimates the observed particulate chloride during theentire daily cycle, producing about less than 40 % of the observations. The modeledparticulate chloride concentrations in the G-case are more consistent with the obser-vations than those from the B-case, with a mean concentration of 0.41 µg m−3, veryclose to the observed 0.42 µg m−3. Compared the simulated chloride in the B-case and20
G-case, GB contributes about 0.24 µg m−3 chloride mass on average, or 60 % of theobservation at T0, demonstrating that GB is a dominant source of particulate chloridein the urban area.
T1 is a supersite located in the northwestern part of the Mexico City basin andused as a suburban background site during MILAGRO field campaign (Molina et25
al., 2010). The simulated particulate chloride is compared to the particle-into-liquid-sampler (PILS) measurement at T1 (Fig. 2c and d). The measured particulate chlorideexhibits distinct peaks during midnight and early morning. The B-case very severelyunderestimates the observed particulate chloride concentrations during the entire sim-
13674
ACPD12, 13667–13689, 2012
Contribution ofgarbage burning tochloride and PM2.5
G. Li et al.
Title Page
Abstract Introduction
Conclusions References
Tables Figures
J I
J I
Back Close
Full Screen / Esc
Printer-friendly Version
Interactive Discussion
Discussion
Paper
|D
iscussionP
aper|
Discussion
Paper
|D
iscussionP
aper|
ulation period, suggesting that the contribution of the non-BB emissions to the partic-ulate chloride is negligible in the suburban area. GB emissions considerably improvethe particulate chloride simulations in the G-case, and the WRF-CHEM model gen-erally captures the peaks during early morning, but overestimates on 27 March andunderestimates on 28 and 29 March. Although the G-case includes the GB emissions,5
it still fails to produce the high peak between 00:00 and 02:00 LT (Fig. 2d), which ispossibly caused by other particulate chloride sources, such as agricultural fires, brickmaking kilns and volcanoes, that are not yet considered in the present study. Due tofrequent absence of observed particulate chloride at T1 in the afternoon, only the com-parison of mean particulate chloride mass in the morning is made between model and10
measurement. The simulated mean chloride mass from GB in the morning is about0.26 µg m−3, which is 62 % of the observed value (0.42 µg m−3), showing that GB is amajor source of particulate chloride in the suburban area.
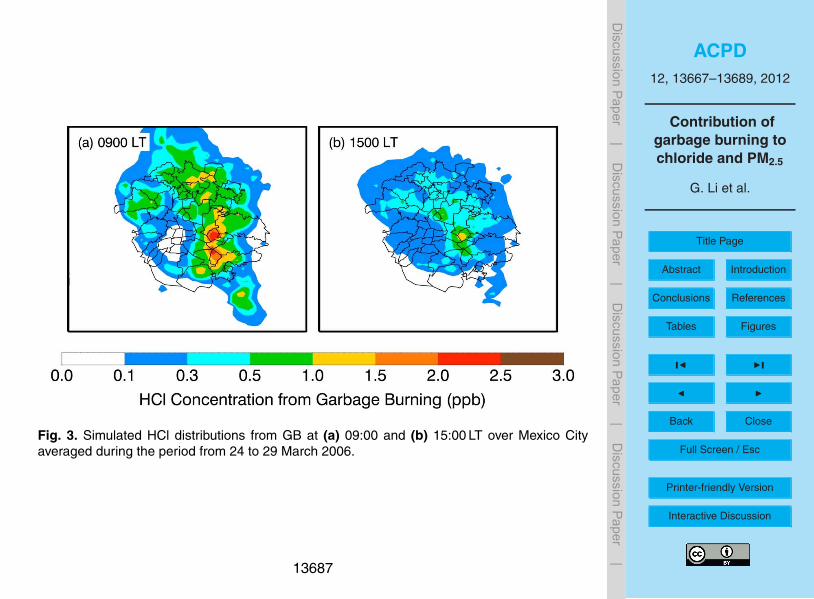
Christian et al. (2010) measured high HCl emission factor from GB in Mexico, sug-gesting that GB is an important source of HCl. Figure 3 illustrates the modeled six-15
day averaged ground level distributions of HCl from GB at 09:00 LT (local time) and15:00 LT. At 09:00 LT, due to the weak winds and low planetary boundary layer (PBL)height, which are favorable for the accumulation of HCl, high levels of HCl, up to1 ∼ 3 ppb, are predicted near the GB emission source, and the HCl concentrationsin most of Mexico City exceed 0.5 ppb. At 15:00 LT, with the transport and mixing of20
smoke plumes and increase of PBL height, the simulated surface HCl concentrationsdecrease to 0.1 ∼ 1.0 ppb in Mexico City. Based on the measurement of an open-pathFourier Transform Infrared (FTIR), Moya et al. (2003) estimated that the HCl concen-tration did not exceed 2–3 ppb level in Mexico City. In addition, San Martini et al. (2006)suggested that the most likely concentrations of HCl are in the sub-ppb range in Mex-25
ico City when the particles are aqueous from the simulations of a Markov Chain MonteCarlo model with a thermodynamic equilibrium model during the MCMA-2003 cam-paign (Molina et al., 2007). The WRF-CHEM simulations of HCl from GB are compa-
13675
ACPD12, 13667–13689, 2012
Contribution ofgarbage burning tochloride and PM2.5
G. Li et al.
Title Page
Abstract Introduction
Conclusions References
Tables Figures
J I
J I
Back Close
Full Screen / Esc
Printer-friendly Version
Interactive Discussion
Discussion
Paper
|D
iscussionP
aper|
Discussion
Paper
|D
iscussionP
aper|
rable to the above two studies, showing that GB is a major source of HCl in MexicoCity.
Li et al. (2011a) have simulated organic aerosol concentrations using the WRF-CHEM model in Mexico City during the same period as this study, and found that,with the contribution of glyoxal and methylglyoxal, the non-traditional SOA model can5
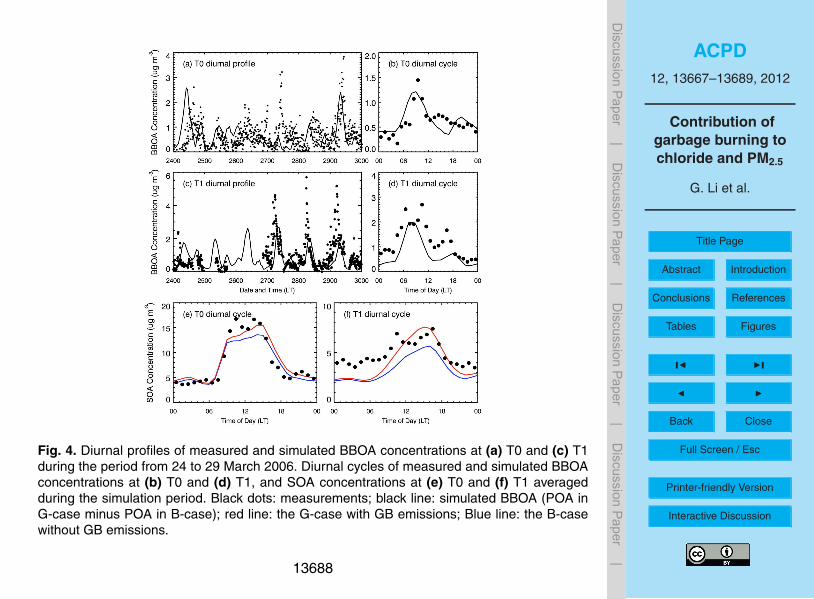
explain over 80 % observed SOA in the urban area, but the contributions of BB to or-ganic aerosols are not considered in Li et al. (2011a). In the present study, the six-dayepisode we have chosen has been reported to have minor impacts from wild fire burn-ing (Aiken et al., 2009; Lei et al., 2012), and the GB emissions could constitute an im-portant source of biomass burning organic aerosols (BBOA). Figure 4a presents the di-10
urnal profiles of simulated (POA in the G-case minus POA in the B-case) and observedBBOA at T0. Although the WRF-CHEM model fails to capture the large fluctuations ofthe observed BBOA concentrations, in general it reproduces the observed diurnal cy-cle (Fig. 4b). The simulated six-day averaged BBOA mass is close to the measurementat T0, demonstrating that GB is a major source of BBOA in the urban area when wild15
fires around Mexico City are sparse. The WRF-CHEM model generally underestimatesthe observed BBOA at T1 (Fig. 4c and d) and produces more than 50 % of the obser-vations, indicating that other biofuel emissions, such as domestic (food cooking) andindustrial biofuel use, could also play an important role in BBOA concentrations in thesuburban area. SOA formation due to the GB emissions also improves the SOA sim-20
ulations at T0 and T1 during daytime (Fig. 4e and f). GB can explain 10 % and 18 %observed SOA concentrations on average at T0 and T1, respectively. The SOA contri-bution due to GB emissions enhances the domain-wide organic aerosol by about 4.4 %on average, which is close to the results by Lei et al. (2012). Lei et al. (2012) estimatedthat the SOA from GB contributes about 5 % to organic aerosols in both the urban and25
suburban areas of the MCMA. Detailed evaluation of GB emissions to organic aerosols(OA) can be found in Lei et al. (2012).
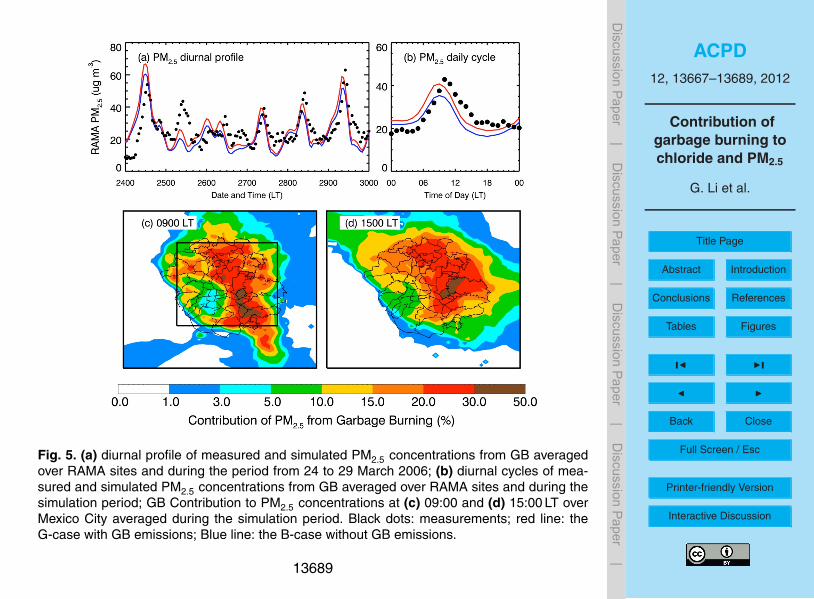
Figure 5a shows the diurnal profiles of simulated and observed near-surface PM2.5concentrations averaged over Mexico City RAMA stations and T1. The WRF-CHEM
13676
ACPD12, 13667–13689, 2012
Contribution ofgarbage burning tochloride and PM2.5
G. Li et al.
Title Page
Abstract Introduction
Conclusions References
Tables Figures
J I
J I
Back Close
Full Screen / Esc
Printer-friendly Version
Interactive Discussion
Discussion
Paper
|D
iscussionP
aper|
Discussion
Paper
|D
iscussionP
aper|
model generally tracks the temporal variations of PM2.5 concentrations reasonably well,but frequently underestimates during daytime, particularly between 09:00 and 11:00 LTin the morning when the observed PM2.5 concentrations reach peaks due to the ac-cumulation of primary aerosols and efficient formation of secondary aerosols undercondition of relatively low PBL height. The nighttime simulated PM2.5 concentrations5
are higher than the observations (Fig. 4b), irregardless of whether the GB emissionsare included or not, indicating either the failure of PBL simulations or inefficiency of thepollutant dispersion process or problems with the emissions during nighttime (Li et al.,2011a). However, during daytime, GB emissions considerably improve the PM2.5 sim-ulations. On average, the B-case yields 23.1 µg m−3 PM2.5 averaged over the RAMA10
sites and T1, lower than the observed 25.8 µg m−3. GB emissions in the G-case en-hance the PM2.5 mass by about 13 % or 3.0 µg m−3 compared to the B-case. In addi-tion, GB emissions contribute about 3–30 % of simulated PM2.5 in Mexico City at 09:00and 15:00 LT (Fig. 4c and d), which is consistent with the conclusion reported by Chris-tian et al. (2010) from the measurement of fine particle antimony (Sb) from GB. They15
compared the measured mean mass ratios of Sb/PM2.5 for pure garbage burning andambient air and concluded that GB could account for up to one third of the PM2.5 massin MCMA. On average, GB emissions contribute 1.9 µg m−3 or 12 % to the PM2.5 massin Mexico City (see the black box in Fig. 5c) in the G-case. About 65 % of the enhancedPM2.5 mass from GB is contributed by OA, in which the contributions from POA and20
SOA are 30 % and 35 %, respectively. The particulate chloride constitutes 10 % of theenhancement of PM2.5 mass from GB, greater than the contributions from black carbon(4 %), sulfate (0 %), nitrate (0.8 %), and ammonium (5 %) aerosols. Other unidentifiedparticulate species contributes about 14 % of the GB PM2.5 mass. Using the same GBemission inventory as the present study, Hodzic et al. (2012) reported that GB repre-25
sents 1–15 % of the PM2.5 mass over the metropolitan area of Mexico City with strongspatial variability; their estimate is lower than the results from the present study. Thereare two main reasons for the difference between the two studies. Firstly, in Hodzic etal. (2012), POA is considered physically and chemically inert, resulting in negligible
13677
ACPD12, 13667–13689, 2012
Contribution ofgarbage burning tochloride and PM2.5
G. Li et al.
Title Page
Abstract Introduction
Conclusions References
Tables Figures
J I
J I
Back Close
Full Screen / Esc
Printer-friendly Version
Interactive Discussion
Discussion
Paper
|D
iscussionP
aper|
Discussion
Paper
|D
iscussionP
aper|
SOA contribution from GB. In our study, POA is assumed to be semi-volatile and pho-tochemically reactive; GB considerably enhances the SOA formation in Mexico City.Secondly, Hodzic et al. (2012) did not considered the contribution of chloride to thePM2.5 mass, which is not negligible according to the our estimation. If the contribu-tion of SOA and chloride from GB are excluded, the results in this present study are5
comparable to those in Hodzic et al. (2012).
4 Summary and implication
In the present study, the WRF-CHEM model has been used to evaluate the contri-butions of GB to chloride and PM2.5 in Mexico City during the period from 24 to 29March 2006. Based on the recently developed GB emission inventory (Hodzic et al.,10
2012; Lei et al., 2012), the simulated particulate chloride from GB can explain over60 % of the observation in the urban and suburban area, indicating that GB is a ma-jor source of particulate chloride in Mexico City. In addition, GB also contributes up to3 ppb HCl, which is consistent with the measurement in Mexico City. GB is also an im-portant source of PM2.5, constituting about 3–30 % simulated PM2.5 mass on average.15
It should be emphasized that the GB emission inventory used in the present study stillhas large uncertainties, which potentially influence the evaluation of the contributionof GB to chloride and PM2.5 in Mexico City. Although the simulated PM2.5 from GB isconsistent with the measurement by Christian et al. (2010), showing the present GBemission inventory is generally reasonable, the uncertainties of BG emissions need to20
be further investigated to provide a bolster for the model simulations. Furthermore, itis worthy to note that meteorological conditions play a key role in determining the ac-cumulation or dispersion of pollutant and might significantly influence the evaluation ofthe GB contribution to chloride and PM2.5 (Bei et al., 2008, 2010).
Christian et al. (2010) suggested that large HCl emission factor in central Mex-25
ico results from the burning of polyvinyl chloride (PVC). A recent study by Hedmanet al. (2006) showed that chloride-containing plastic waste gave rise to high emis-
13678
ACPD12, 13667–13689, 2012
Contribution ofgarbage burning tochloride and PM2.5
G. Li et al.
Title Page
Abstract Introduction
Conclusions References
Tables Figures
J I
J I
Back Close
Full Screen / Esc
Printer-friendly Version
Interactive Discussion
Discussion
Paper
|D
iscussionP
aper|
Discussion
Paper
|D
iscussionP
aper|
sions of polychlorinated dibenzo-p-dioxins (PCDDs) and polychlorinated dibenzofurans(PCDFs) and found PVC plastic to be a major source of dioxin. Considering that dioxinshave been characterized by US EPA as likely human carcinogens and are anticipatedto increase the risk of cancer at background levels of exposure, further evaluation ofthe contribution of GB to dioxins level in Mexico City is imperative.5
Acknowledgements. We are indebted to the large number of people involved in the MILAGROfield campaign as well as those involved in long-term air quality monitoring and the emissionsinventory in the Mexico City metropolitan area, which made this study possible. We are gratefulto C. Wiedinmyer for providing the emission inventories of the open fires and trash burning.This work was supported by the US National Science Foundation’s Atmospheric Chemistry10
Program (Award # 1135141) and the Molina Center for Energy and the Environment. Guohui Liis a Molina Fellow at MIT. Acknowledgment is also made to the National Center for AtmosphericResearch, which is sponsored by the National Science Foundation, for the computing time usedin this research.
References15
Akagi, S. K., Yokelson, R. J., Wiedinmyer, C., Alvarado, M. J., Reid, J. S., Karl, T., Crounse, J.D., and Wennberg, P. O.: Emission factors for open and domestic biomass burning for use inatmospheric models, Atmos. Chem. Phys., 11, 4039–4072, doi:10.5194/acp-11-4039-2011,2011.
Aiken, A. C., Salcedo, D., Cubison, M. J., Huffman, J. A., DeCarlo, P. F., Ulbrich, I. M., Docherty,20
K. S., Sueper, D., Kimmel, J. R., Worsnop, D. R., Trimborn, A., Northway, M., Stone, E. A.,Schauer, J. J., Volkamer, R. M., Fortner, E., de Foy, B., Wang, J., Laskin, A., Shutthanan-dan, V., Zheng, J., Zhang, R., Gaffney, J., Marley, N. A., Paredes-Miranda, G., Arnott, W. P.,Molina, L. T., Sosa, G., and Jimenez, J. L.: Mexico City aerosol analysis during MILAGROusing high resolution aerosol mass spectrometry at the urban supersite (T0) – Part 1: Fine25
particle composition and organic source apportionment, Atmos. Chem. Phys., 9, 6633–6653,doi:10.5194/acp-9-6633-2009, 2009.
Andreae, M. O. and Merlet, P.: Emission of trace gases and aerosols from biomass burning,Global Biochem. Cy., 15, 955–966, 2001.
13679
ACPD12, 13667–13689, 2012
Contribution ofgarbage burning tochloride and PM2.5
G. Li et al.
Title Page
Abstract Introduction
Conclusions References
Tables Figures
J I
J I
Back Close
Full Screen / Esc
Printer-friendly Version
Interactive Discussion
Discussion
Paper
|D
iscussionP
aper|
Discussion
Paper
|D
iscussionP
aper|
Bei, N., de Foy, B., Lei, W., Zavala, M., and Molina, L. T.: Using 3DVAR data assimilation systemto improve ozone simulations in the Mexico City basin, Atmos. Chem. Phys., 8, 7353–7366,doi:10.5194/acp-8-7353-2008, 2008.
Bei, N., Lei, W., Zavala, M., and Molina, L. T.: Ozone predictabilities due to meteorologicaluncertainties in the Mexico City basin using ensemble forecasts, Atmos. Chem. Phys., 10,5
6295–6309, doi:10.5194/acp-10-6295-2010, 2010.Binkowski, F. S. and Roselle S. J.: Models-3 Community Multiscale Air Quality (CMAQ)
model aerosol component: 1. Model description, J. Geophys. Res., 108, 4183,doi:10.1029/2001JD001409, 2003.
Brioude, J., Cooper, O. R., Feingold, G., Trainer, M., Freitas, S. R., Kowal, D., Ayers, J.K., Prins,10
E., Minnis, P., McKeen, S. A., Frost, G. J., and Hsie, E.-Y.: Effect of biomass burning onmarine stratocumulus clouds off the California coast, Atmos. Chem. Phys., 9, 8841–8856,doi:10.5194/acp-9-8841-2009, 2009.
Bond, T. C., Streets, D. G., Yarber, K. F., Nelson, S. M., Woo, J.-H., and Klimont, Z.: Atechnology-based global inventory of black and organic carbon emissions from combustion,15
J. Geophys. Res., 109, D14203, doi:10.1029/2003JD003697, 2004.Chen, F. and Dudhia, J.: Coupling an advanced land-surface/hydrology model with the
Penn State/NCARMM5modelingsystem. Part I: Model description and implementation, Mon.Weather Rev., 129, 569–585, 2001.
Christian, T. J., Yokelson, R. J., Cardenas, B., Molina, L. T., Engling, G., and Hsu, S.-C.: Trace20
gas and particle emissions from domestic and industrial biofuel use and garbage burning incentral Mexico, Atmos. Chem. Phys., 10, 565–584, doi:10.5194/acp-10-565-2010, 2010.
Costner, P.: Estimating releases and prioritizing sources in the context of the Stockholm Con-vention: Dioxin emission factors for forest fires, grassland and moor fires, open burning ofagricultural residues, open burning of domestic waste, landfill and dump fires, The Interna-25
tional POPs Elimination Project, Mexico, 40 pp., 2005.Costner, P.: Update of dioxin emission factors for forest fires, grassland and moor fires, open
burning of agricultural residues, open burning of domestic waste, landfills and dump fires,International POPs Elimination Network, Mexico, 13 pp., 2006.
de Foy, B., Fast, J. D., Paech, S. J., Phillips, D., Walters, J. T., Coulter, R. L., Martin, T. J., Pekour,30
M. S., Shaw, W. J., Kastendeuch, P. P., Marley, N. A., Retama, A., and Molina, L. T.: Basin-scale wind transport during the MILAGRO field campaign and comparison to climatology
13680
ACPD12, 13667–13689, 2012
Contribution ofgarbage burning tochloride and PM2.5
G. Li et al.
Title Page
Abstract Introduction
Conclusions References
Tables Figures
J I
J I
Back Close
Full Screen / Esc
Printer-friendly Version
Interactive Discussion
Discussion
Paper
|D
iscussionP
aper|
Discussion
Paper
|D
iscussionP
aper|
using cluster analysis, Atmos. Chem. Phys., 8, 1209–1224, doi:10.5194/acp-8-1209-2008,2008.
Dudhia, J.: Numerical study of convection observed during the winter monsoon experimentusing a mesoscale two-dimensional model, J. Atmos. Sci., 46, 3077–3107, 1989.
Grell, G., Freitas, S. R., Stuefer, M., and Fast, J.: Inclusion of biomass burning in WRF-5
Chem: impact of wildfires on weather forecasts, Atmos. Chem. Phys., 11, 5289–5303,doi:10.5194/acp-11-5289-2011, 2011.
Hedman, B., Naslund, M., and Marklund, S.: Emissions of PCDD/F, PCB, and HCB from com-bustion of firewood and pellets in residential stoves and boilers, Environ. Sci. Technol., 40,4968–4975, 2006.10
Hodzic, A., Wiedinmyer, C., Salcedo, D., and Jimenez, J. L.: Impact of trash burning on airquality in Mexico City, Environ. Sci. Technol., 46, 4950–4957, doi:10.1021/es203954r, 2012.
Horowitz, L. W., Waters, S., Mauzerall, D. L., Emmons, L. K., Rasch, P. J., Tie, X., Lamarque,J.-F. Schultz, M. G., Tyndall, G. S., Orlando, J. J., and Brasseur, G. P.: A global simulation oftropospheric ozone and related tracers: Description and evaluation of MOZART, version 2, J.15
Geophys. Res., 108, 4784, doi:10.1029/2002JD002853, 2003.Intergovernmental Panel on Climate Change: Climate Change 2007: The Scientific Basis, Con-
tribution of Working Group 1 to the Fourth Assessment Report of the IntergovernmentalPanel on Climate Change, edited by: Solomon, S., Qin, D., Manning, M., Chen, Z., Marquis,M., Averyt, K. B., Tignor, M., and Miller, H. L., Cambridge Univ. Press, New York, 996 pp.,20
2007.Koo, B. Y., Ansari, A. S., and Pandis, S. N.: Integrated approaches to modeling the organic and
inorganic atmospheric aerosol components, Atmos. Environ., 37, 4757–4768, 2003.Lei, W., Li, G., and Molina, L. T.: Modeling the impact of biomass burning on air quality in Mexico
City, Atmos. Chem. Phys. Discuss., submitted, 2012.25
Lelieveld, J., Crutzen, P. J., Ramanathan, V., Andreae, M. O., Brenninkmeijer, C. A. M., Campos,T., Cass, G. R., Fischer, H., de Gouw, J. A., Hansel, A., Jefferson, A., Kley, D., de Laat, A.T. J., Lal, S., Lawrence, M. G., Lobert, J. M., Mayol-Bracero, O. L., Mitra, A. P., Novakov, T.,Oltman, S. J., Prather, K. A., Reiner, T., Rodhe, H., Scheeren, H. A., Sikka, D., and Williams,J.: The Indian Ocean Experiment: Widespread Air Pollution from South and Southeast Asia,30
Science, 291, 1031–1036, 2001.Lemieux, P. M., Lutes, C. C., and Santoianni, D. A.: Emissions of organic air toxics from open
burning: a comprehensive review, Prog. Energ. Combust., 20, 1–32, 2004.
13681
ACPD12, 13667–13689, 2012
Contribution ofgarbage burning tochloride and PM2.5
G. Li et al.
Title Page
Abstract Introduction
Conclusions References
Tables Figures
J I
J I
Back Close
Full Screen / Esc
Printer-friendly Version
Interactive Discussion
Discussion
Paper
|D
iscussionP
aper|
Discussion
Paper
|D
iscussionP
aper|
Li, G., Zhang, R., Fan, J., and Tie, X.: Impacts of black carbon aerosol on photolysis and ozone,J. Geophys. Res., 110, D23206, doi:10.1029/2005JD005898, 2005.
Li, G., Lei, W., Zavala, M., Volkamer, R., Dusanter, S., Stevens, P., and Molina, L. T.: Impactsof HONO sources on the photochemistry in Mexico City during the MCMA-2006/MILAGOCampaign, Atmos. Chem. Phys., 10, 6551–6567, doi:10.5194/acp-10-6551-2010, 2010.5
Li, G., Zavala, M., Lei, W., Tsimpidi, A. P., Karydis, V. A., Pandis, S. N., Canagaratna, M. R.,and Molina, L. T.: Simulations of organic aerosol concentrations in Mexico City using theWRF-CHEM model during the MCMA-2006/MILAGRO campaign, Atmos. Chem. Phys., 11,3789–3809, doi:10.5194/acp-11-3789-2011, 2011a.
Li, G., Bei, N., Tie, X., and Molina, L. T.: Aerosol effects on the photochemistry in Mex-10
ico City during MCMA-2006/MILAGRO campaign, Atmos. Chem. Phys., 11, 5169–5182,doi:10.5194/acp-11-5169-2011, 2011b.
Lighty, J. S., Veranth, J. M., and Sarofim, A. F.: Combustion aerosols: Factors governing theirsize and composition and implications to human health, J. Air Waste Manage., 50, 1565–1618, 2000.15
Lin Y.-L., Farley, R. D., and Orville, H. D.:, Bulk parameterization of the snow field in a cloudmodel, J. Appl. Meteorol., 22, 1065–1092, 1983.
Mlawer, E. J., Taubman, S. J., Brown, P. D., Iacono, M. J., and Clough, S. A.: Radiative transferfor inhomogeneous atmosphere: RRTM, a validated correlated-k model for the long-wave J.Geophys. Res., 102, 16663–16682, 1997.20
Molina, L. T., Kolb, C. E., de Foy, B., Lamb, B. K., Brune, W. H., Jimenez, J. L., Ramos-Villegas,R., Sarmiento, J., Paramo-Figueroa, V. H., Cardenas, B., Gutierrez-Avedoy, V., and Molina,M. J.: Air quality in North America’s most populous city – overview of the MCMA-2003 cam-paign, Atmos. Chem. Phys., 7, 2447–2473, doi:10.5194/acp-7-2447-2007, 2007.
Molina, L. T., Madronich, S., Gaffney, J. S., Apel, E., de Foy, B., Fast, J., Ferrare, R., Herndon,25
S., Jimenez, J. L., Lamb, B., Osornio-Vargas, A. R., Russell, P., Schauer, J. J., Stevens, P.S., Volkamer, R., and Zavala, M.: An overview of the MILAGRO 2006 Campaign: MexicoCity emissions and their transport and transformation, Atmos. Chem. Phys., 10, 8697–8760,doi:10.5194/acp-10-8697-2010, 2010.
Moya, M., Castro, T., Zepeda, M., and Baez, A.: Characterization of size-differentiated inorganic30
composition of aerosols in Mexico City, Atmos. Environ., 37, 3581–3591, 2003.
13682
ACPD12, 13667–13689, 2012
Contribution ofgarbage burning tochloride and PM2.5
G. Li et al.
Title Page
Abstract Introduction
Conclusions References
Tables Figures
J I
J I
Back Close
Full Screen / Esc
Printer-friendly Version
Interactive Discussion
Discussion
Paper
|D
iscussionP
aper|
Discussion
Paper
|D
iscussionP
aper|
Noh, Y., Cheon, W. G., and Raasch, S.: The improvement of the K-profile model for the PBLusing LES. Preprints, Int. Workshop of Next Generation NWP Models, Seoul, South Korea,Laboratory for Atmospheric Modeling Research, 65–66, 2001.
Odum, J. R., Hoffman, T., Bowman, F., Collins, D., Flagan, R. C., and Seinfeld, J. H.:Gas/particle partitioning and secondary organic aerosol yields, Environ. Sci. Technol., 30,5
2580–2585, 1996.Randles, C. A. and Ramaswamy, V.: Direct and semi-direct impacts of absorbing biomass burn-
ing aerosol on the climate of southern Africa: a Geophysical Fluid Dynamics LaboratoryGCM sensitivity study, Atmos. Chem. Phys., 10, 9819–9831, doi:10.5194/acp-10-9819-2010,2010.10
San Martini, F. M., Dunlea, E. J., Volkamer, R., Onasch, T. B., Jayne, J. T., Canagaratna, M.R., Worsnop, D. R., Kolb, C. E., Shorter, J. H., Herndon, S. C., Zahniser, M. S., Salcedo,D., Dzepina, K., Jimenez, J. L., Ortega, J. M., Johnson, K. S., McRae, G. J., Molina, L.T., and Molina, M. J.: Implementation of a Markov Chain Monte Carlo method to inorganicaerosol modeling of observations from the MCMA-2003 campaign – Part II: Model appli-15
cation to the CENICA, Pedregal and Santa Ana sites, Atmos. Chem. Phys., 6, 4889–4904,doi:10.5194/acp-6-4889-2006, 2006.
Shrivastava, M. K., Lane, T. E., Donahue, N. M., Pandis, S. N., and Robinson, A. L.: Effectsof gas-particle partitioning and aging of primary emissions on urban and regional organicaerosol concentrations, J. Geophys. Res., 113, D18301, doi:10.1029/2007JD009735, 2008.20
Song, J., Lei, W., Bei, N., Zavala, M., de Foy, B., Volkamer, R., Cardenas, B., Zheng, J., Zhang,R., and Molina, L. T.: Ozone response to emission changes: a modeling study during theMCMA-2006/MILAGRO Campaign, Atmos. Chem. Phys., 10, 3827–3846, doi:10.5194/acp-10-3827-2010, 2010.
Tian, D., Hu, Y. T., Wang, Y. H., Boylan, J. W., Zheng, M., and Russell, A. G.: Assessment of25
biomass burning emissions and their impacts on urban and regional PM2.5: A Georgia casestudy, Environ. Sci. Technol., 43, 299–305, 2009.
Tie, X., Madronich, S., Walters, S., Zhang, R., Rasch, P., and Collins, W.: Effect ofclouds on photolysis and oxidants in the troposphere, J. Geophys. Res., 108, 4642,doi:10.1029/2003JD003659, 2003.30
Tsimpidi, A. P., Karydis, V. A., Zavala, M., Lei, W., Molina, L., Ulbrich, I. M., Jimenez, J. L.,and Pandis, S. N.: Evaluation of the volatility basis-set approach for the simulation of organic
13683
ACPD12, 13667–13689, 2012
Contribution ofgarbage burning tochloride and PM2.5
G. Li et al.
Title Page
Abstract Introduction
Conclusions References
Tables Figures
J I
J I
Back Close
Full Screen / Esc
Printer-friendly Version
Interactive Discussion
Discussion
Paper
|D
iscussionP
aper|
Discussion
Paper
|D
iscussionP
aper|
aerosol formation in the Mexico City metropolitan area, Atmos. Chem. Phys., 10, 525–546,doi:10.5194/acp-10-525-2010, 2010.
USEPA: An inventory of sources and environmental releases of dioxin-like compounds in theUnited States for the years 1987, 1995, and 2000, EPA/600/P-03/002F, National Center forEnvironmental Assessment, Office of Research and Development, Washington, DC, 677 pp.,5
2006.Wang, J. and Christopher, S. A.: Mesoscale modeling of central American smoke transport to
the United States, 2: Smoke regional radiative impacts on surface energy budget and bound-ary layer evolution, J. Geophys. Res., 111, D14S92, doi:10.1029/2005JD006720, 2006.
Wesely, M. L.: Parameterization of surface resistance to gaseous dry deposition in regional-10
scale numerical models, Atmos. Environ., 23, 1293–1304, 1989.Yokelson, R. J., Burling, I. R., Urbanski, S. P., Atlas, E. L., Adachi, K., Buseck, P. R., Wiedinmyer,
C., Akagi, S. K., Toohey, D. W., and Wold, C. E.: Trace gas and particle emissions from openbiomass burning in Mexico, Atmos. Chem. Phys., 11, 6787–6808, doi:10.5194/acp-11-6787-2011, 2011.15
Zeng, T., Wang, Y. H., Yoshida, Y., Tian, D., Russell, A. G., and Barnard, W. R.: Impacts of pre-scribed fires on air quality over the southeastern United States in spring based on modelingand ground/satellite measurements, Environ. Sci. Technol., 42, 8401–8406, 2008.
13684
ACPD12, 13667–13689, 2012
Contribution ofgarbage burning tochloride and PM2.5
G. Li et al.
Title Page
Abstract Introduction
Conclusions References
Tables Figures
J I
J I
Back Close
Full Screen / Esc
Printer-friendly Version
Interactive Discussion
Discussion
Paper
|D
iscussionP
aper|
Discussion
Paper
|D
iscussionP
aper|
20
Figure 1Fig. 1. WRF-CHEM simulation domain. Black squares represent the RAMA (Mexico City Am-bient Air Monitoring Network) sites with PM2.5 measurements. The red and green circles rep-resent the T0 and T1 supersites, respectively.
13685
ACPD12, 13667–13689, 2012
Contribution ofgarbage burning tochloride and PM2.5
G. Li et al.
Title Page
Abstract Introduction
Conclusions References
Tables Figures
J I
J I
Back Close
Full Screen / Esc
Printer-friendly Version
Interactive Discussion
Discussion
Paper
|D
iscussionP
aper|
Discussion
Paper
|D
iscussionP
aper|
21
Figure 2 Fig. 2. Diurnal profiles of measured and simulated particulate chloride concentrations at (a)T0 and (c) T1 during the period from 24 to 29 March 2006, and diurnal cycles of measuredand simulated particulate chloride concentrations at (b) T0 and (d) T1 averaged during thesimulation period. Black dots: measurements; red line: the G-case with GB emissions; Blueline: the B-case without GB emissions.
13686
ACPD12, 13667–13689, 2012
Contribution ofgarbage burning tochloride and PM2.5
G. Li et al.
Title Page
Abstract Introduction
Conclusions References
Tables Figures
J I
J I
Back Close
Full Screen / Esc
Printer-friendly Version
Interactive Discussion
Discussion
Paper
|D
iscussionP
aper|
Discussion
Paper
|D
iscussionP
aper|
22
Figure 3Fig. 3. Simulated HCl distributions from GB at (a) 09:00 and (b) 15:00 LT over Mexico Cityaveraged during the period from 24 to 29 March 2006.
13687
ACPD12, 13667–13689, 2012
Contribution ofgarbage burning tochloride and PM2.5
G. Li et al.
Title Page
Abstract Introduction
Conclusions References
Tables Figures
J I
J I
Back Close
Full Screen / Esc
Printer-friendly Version
Interactive Discussion
Discussion
Paper
|D
iscussionP
aper|
Discussion
Paper
|D
iscussionP
aper|
23
Figure 4
Fig. 4. Diurnal profiles of measured and simulated BBOA concentrations at (a) T0 and (c) T1during the period from 24 to 29 March 2006. Diurnal cycles of measured and simulated BBOAconcentrations at (b) T0 and (d) T1, and SOA concentrations at (e) T0 and (f) T1 averagedduring the simulation period. Black dots: measurements; black line: simulated BBOA (POA inG-case minus POA in B-case); red line: the G-case with GB emissions; Blue line: the B-casewithout GB emissions.
13688
ACPD12, 13667–13689, 2012
Contribution ofgarbage burning tochloride and PM2.5
G. Li et al.
Title Page
Abstract Introduction
Conclusions References
Tables Figures
J I
J I
Back Close
Full Screen / Esc
Printer-friendly Version
Interactive Discussion
Discussion
Paper
|D
iscussionP
aper|
Discussion
Paper
|D
iscussionP
aper|
24
Figure 5 Fig. 5. (a) diurnal profile of measured and simulated PM2.5 concentrations from GB averagedover RAMA sites and during the period from 24 to 29 March 2006; (b) diurnal cycles of mea-sured and simulated PM2.5 concentrations from GB averaged over RAMA sites and during thesimulation period; GB Contribution to PM2.5 concentrations at (c) 09:00 and (d) 15:00 LT overMexico City averaged during the simulation period. Black dots: measurements; red line: theG-case with GB emissions; Blue line: the B-case without GB emissions.
13689