Embed Size (px)
Citation preview

11th International Conference on Nuclear Engineering Tokyo, JAPAN, April 20-23, 2003
ICONE11-36325
COOLANT MIXING STUDIES FOR THE ANALYSIS OF HYPOTHETICAL BORON DILUTION TRANSIENTS IN A PWR
G. Grunwald
Phone:(+49) 351 260 2425 e-mail [email protected]
T. Höhne Phone: (+49) 351 260 2425
e-mail: [email protected] S. Kliem
Phone: (+49) 351 260 2318 e-mail: [email protected]
H.-M. Prasser Phone: (+49) 351 260 3460
e-mail: [email protected] U. Rohde
Phone: (+49) 351 260 3460 e-mail:[email protected]
F.-P. Weiß* Phone: (+49) 351 260 3480
e-mail: [email protected] Forschungszentrum Rossendorf - Institute of Safety Research
POB 510119 D-01314 Dresden Germany Fax:(+49) 351 260 3440
KEYWORDS: BORON DILUTION, COOLANT MIXING, ROCOM TEST FACILITY, COMPUTATIONAL
FLUID DYNAMICS, NEUTRON KINETICS
ABSTRACT
PWR transients caused by a perturbation of boron concentration or coolant temperature at the inlet nozzles depend on the mixing inside the reactor pressure vessel (RPV). Initial steep gradients are partially reduced by turbulent mixing with the ambient coolant in the RPV. However, the assumption of an ideal mixing in the downcomer and the lower plenum of the reactor leads to unrealistically small reactivity inserts. Moreover, the reactivity differences between ideal mixing and total absence of mixing are too large to be acceptable for safety analyses. In reali-ty, a partial mixing takes place. For realistic predic-tions it is necessary to study the mixing within the three-dimensional flow field in the complicated geo-metry of a PWR. For this purpose, a 1:5 scaled model (ROCOM) of the German PWR KONVOI was built. The emphasis was put on extensive measuring instru-mentation and on maximum flexibility of the facility to cover different test scenarios. The use of special electrode-mesh sensors together with a salt tracer technique allows to measure concentration fields within the downcomer and at the core entrance with a high resolution in space and time. Especially the in-strumentation in the downcomer provides detailed in-formation about the mixing phenomena. The obtained
data was used to support code development for mix-ing modeling and validation.
Scenarios investigated are: (1) Steady-state flow in several coolant loops with a temperature or boron concentration perturbation in one of them. (2) Tran-sient flow situations with flow rates changing in time in one or more loops, such as pump start-up scenarios with deborated slugs in one of the loops or onset of natural circulation after boiling-condenser-mode. (3) Gravity driven flow caused by large density gra-dients, e.g. mixing of cold ECC water with the war-mer inventory in the RPV. In all cases, the experi-mental results show an incomplete mixing with typical concentration and temperature distributions at the core inlet which strongly depend on the conditions of the considered scenario. CFD calculations were found to be in good agreement with the experiments but take long calculation times.
Therefore, an efficient semi-analytical model (Semi-Analytical Perturbation Reconstruction) has been developed allowing the description of the coo-lant mixing inside the RPV by the superposition of response functions at the core entrance on Dirac-sha-ped perturbations in the cold leg. The validation of the model against experimental data from the ROCOM-facility is presented.
1 Copyright © 2003 by JSME

2 Copyright © 2003 by JSME
SAPR provides realistic time-dependent boron concentration fields at the core inlet that can be used for the analysis of a hypothetical boron dilution tran-sient after start-up of the first main coolant pump in a generic four-loop PWR. Core calculations were per-formed with the 3D reactor dynamics code DYN3D. By varying the initial slug volume it was found, that for the given core loading pattern slugs of less than 20 m3 do not lead to re-criticality of the shut-off rea-ctor. Calculations with the bounding slug volume of 36 m3 show, that the corresponding reactivity inser-tion does not result in core damage.
1. INTRODUCTION A perturbation of boron concentration or coolant
temperature at the inlet of a Pressurized Water Reactor (PWR) may lead to a reactivity excursion. The indu-ced power peak and the released fission energy depend on the inserted reactivity. As a matter of rule the perturbation has to be expected not in all loops of the primary circuit in the same time – the probability of an appearance in one of the loops only is much higher. On the way from the reactor inlet to the core entrance this water comes into contact with coolant arriving from the unaffected loops and with the water inventory of the reactor pressure vessel (RPV). The boron concentration and temperature distributions at the core inlet are therefore the result of a turbulent mixing process in the flow path of the reactor down-comer and the lower plenum.
3D neutron kinetic computer simulations have shown quite early, that a uniform distribution of the perturbation at the core inlet, i.e. the assumption of an ideal mixing, does not deliver conservative results. In fact, the predicted power peak was about five times lower compared to analyses where a total absence of mixing was assumed (Grundmann 1994). In this work, attempts were initially made to implement stationary mixing matrixes in a 3D neutron kinetics code (DYN3D). The remaining uncertainties were too large to be acceptable for safety analyses. There are nume-rous postulated accident scenarios, where in case of uniform mixing the core survives without consequen-ces or even without reaching criticality, while neglect of the mixing leads to the prediction of severe fuel rod failures.
In reality, a partial mixing takes place. In the result, the real distribution of fluid condition at the core entrance lies in-between the two extreme cases both concerning shape and amplitude of the pertur-bation. To make realistic predictions about the conse-quences it is necessary to study the coolant mixing, which is a complicated three-dimensional fluid dyna-mic problem. Modern CFD codes running on power-ful computers became available to model the coolant flow in the complex geometry of a PWR a couple of years ago. Nevertheless the use of CFD for this com-
plicated task is a challenge still today. Due to the high safety relevance of the coolant mixing phenomenon it is necessary to validate computer codes and to verify computational results using experimental data. This explains the vivid scientific interest in coolant mixing experiments. In our own experiments presented in this paper, we put emphasis on flexibility of the test faci-lity to cover as much as possible different test scena-rios, and, above all, on measuring instrumentation in order to meet the requirements of code development and validation as much as possible by providing para-meter distributions with a high resolution in space and time.
Since the characteristic Reynolds numbers for the large dimensions of the RPV are very high, turbulent mixing dominates over molecular diffusion. For this reason in a given velocity field a temperature perturbation and a boron concentration perturbation behave in the same way, however in case of high temperature differences density gradients may cause a feedback to the velocity field by gravity effects. From the point of view of fluid dynamic boundary conditions, the mixing scenarios relevant for the safety of PWRs can be subdivided into three large groups:
Steady flow in multiple coolant loops with a tem-perature or boron concentration perturbation in a part of the running loops. The flow may be driven either by running main coolant pumps or by steady natural circulation. A typical case is the mixing of overcooled water arriving from one of the steam generators in case of a main steam-line break.
Transient flow situations with flow rates chan-ging with time in one or more loops. Also here the flow may be driven either by coolant pumps or by na-tural circulation. Prominent examples are: (a) inadver-tent start-up of the main coolant pump in a situation where boron-free coolant was unintentionally accu-mulated in the corresponding loop, e.g. by a malfunc-tion of the auxiliary feed water system during a shut-down of the reactor or due to heat exchanger tube leakage in a steam generator, (b) onset of natural circulation in a late phase of a small-break loss-of-coolant accident after an accumulation of boron free condensate by boiling-condenser mode operation.
Gravity driven flow caused by large density gra-dients. This phenomenon is observed only if the main coolant pumps are not working, otherwise the momentum driven flow induced by the pumps is always dominating and density effects can be neglected. Gravity effects are characteristic, for example, for the mixing of cold emergency core cooling (ECC) water entering the RPV through the ECC injection into the cold leg. Due to the higher density of the ECC water, the formation of a streak of cold water flowing down in the downcomer is obser-

3 Copyright © 2003 by JSME
ved. This causes thermal loads on the hot reactor pres-sure vessel. Beside the prediction of the parameters at the core inlet, the exact knowledge of the spatial dis-tribution of the ECC water is essential for the assess-ment of the pressure vessel behavior (Pre-stressed Thermal Shock = PTS).
The literature reports about a number of test faci-lities to study coolant mixing, each considering the geometrical specifics of various reactor types. In case of (Alvarez, 1992; Alavyoon, 1995; Melikhov, 2001) the facilities were solely designed to study the inad-vertent pump start-up, i.e. they dispose of a circu-lation pump only in one of the loops; the other loops were just passive ones. Other test facilities were dedi-cated to mixing of cold ECC water injected into the cold leg of a PWR (Häfner, 1990; Umminger, 1999; Gavrilas, 2002). In order to study coolant mixing in-side the reactor pressure vessel of a German type PWR the test facility ROCOM (Rossendorf Coolant Mixing Model) was built and operated during the last four years. The facility represents a KONVOI type PWR (1300 MWel) developed by Siemens KWU in a linear scale of 1:5.
2. ROCOM TEST FACILITY
Fig. 1 Reactor model of the test facility ROCOM,
German KONVOI type PWR, 1300 Mwel, scale: 1:5
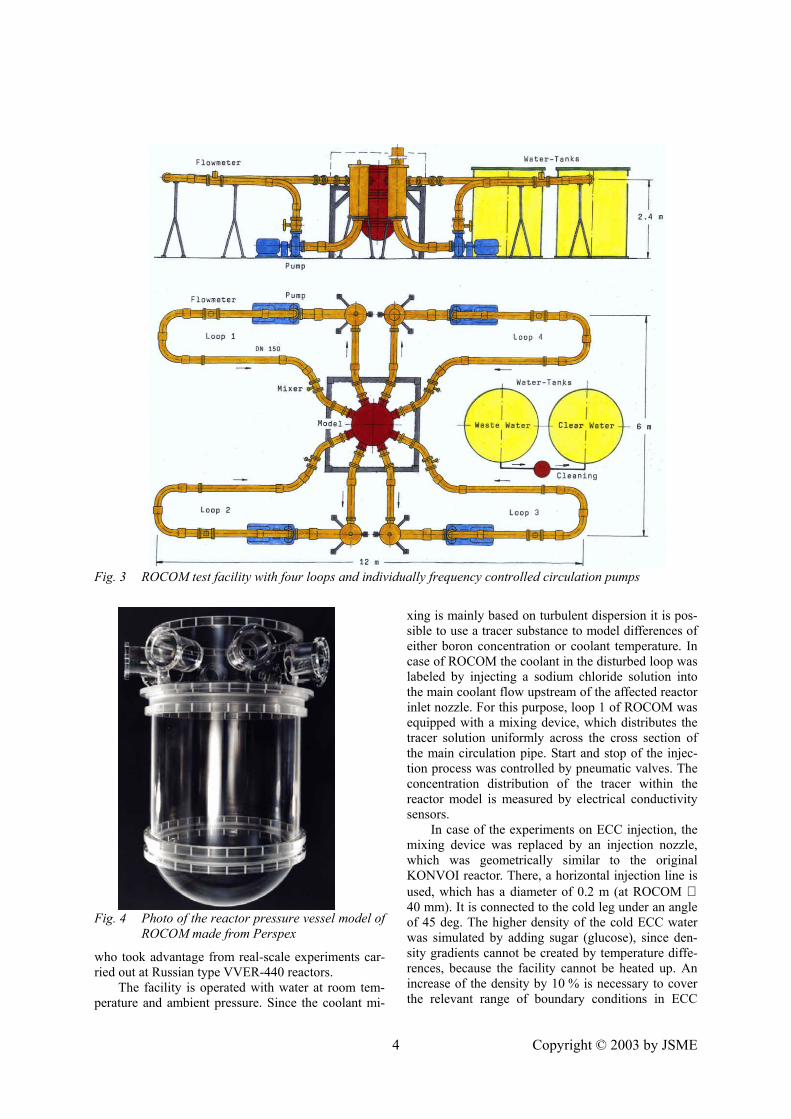
ROCOM consists of a reactor pressure vessel model (Fig. 1) with four inlet and four outlet nozzles. A total view of the test facility is given in Fig. 2. Since it was planned to use the facility for a wide range of assumed mixing scenarios, ROCOM was equipped with four fully functioning loops (Fig. 3), i.e. it has four circulation pumps, which are driven by mo-tors with computer controlled frequency transformers.
That allow to run the pumps according to predefined time dependencies of the flow rate, given as data maps for each loop individually. In this way, a wide variety of flow rate regimes, such as four-loop operation, operation with pumps off, simulated natural circulation modes and flow rate ramps can be realized. For natural circulation conditions the corresponding pumps are operated at low rotation speed by means of the frequency transformer system. Beginning from the bends in the cold legs which are closest to the reactor inlet, the geometrical similarity between model and original reactor is respected until the core inlet. The core itself is excluded from the similarity, i.e. cross mixing within the core is not investigated. The reactor model is manufactured of acrylic glass (Perspex, see Fig. 4). The reactor model exactly follows the geometry of the original PWR with respect to the design of the nozzles (diameter, surface curvature, diffuser parts), the characteristic extension of the downcomer cross section below the nozzle zone, the so-called perforated drum in the lower plenum and the design of the core support plate with the orifices for the coolant. The flow rate in the loops is scaled according to the transit time of the coolant through the model. Since the geometrical scale is 1:5, the transition time of the coolant is identical to that of the original reactor, when the coolant velocity is scaled down by 1:5, too. The nominal flow rate in ROCOM is therefore 185 m³/h per loop.
Fig. 2 General view of the ROCOM test facility
As a result of the scaling and the increased visco-sity of cold water compared to that of the hot coolant, the Reynolds numbers (Re) in the model are lower than those in the original reactor by factor of 190. At the maximum flow rate (300 m³/h) delivered by the pumps, a Re ratio of 100 can be achieved. However, the Re numbers (of the order of 105 in the ROCOM facility) correspond to highly turbulent flow condi-tions, thus both velocity fields and mixing condition are supposed to be independent of the mass flow rate (if density gradients are absent). This assumption is supported by own measuring results obtained for flow rates varied in the feasible range, by scale-up investi-gations using a CFD code (Höhne, 1998), as well as by findings of Dräger (1985, 1987),
4 Copyright © 2003 by JSME
Fig. 3 ROCOM test facility with four loops and individually frequency controlled circulation pumps
Fig. 4 Photo of the reactor pressure vessel model of
ROCOM made from Perspex
who took advantage from real-scale experiments car-ried out at Russian type VVER-440 reactors.
The facility is operated with water at room tem-perature and ambient pressure. Since the coolant mi-
xing is mainly based on turbulent dispersion it is pos-sible to use a tracer substance to model differences of either boron concentration or coolant temperature. In case of ROCOM the coolant in the disturbed loop was labeled by injecting a sodium chloride solution into the main coolant flow upstream of the affected reactor inlet nozzle. For this purpose, loop 1 of ROCOM was equipped with a mixing device, which distributes the tracer solution uniformly across the cross section of the main circulation pipe. Start and stop of the injec-tion process was controlled by pneumatic valves. The concentration distribution of the tracer within the reactor model is measured by electrical conductivity sensors.
In case of the experiments on ECC injection, the mixing device was replaced by an injection nozzle, which was geometrically similar to the original KONVOI reactor. There, a horizontal injection line is used, which has a diameter of 0.2 m (at ROCOM ∅ 40 mm). It is connected to the cold leg under an angle of 45 deg. The higher density of the cold ECC water was simulated by adding sugar (glucose), since den-sity gradients cannot be created by temperature diffe-rences, because the facility cannot be heated up. An increase of the density by 10 % is necessary to cover the relevant range of boundary conditions in ECC
5 Copyright © 2003 by JSME
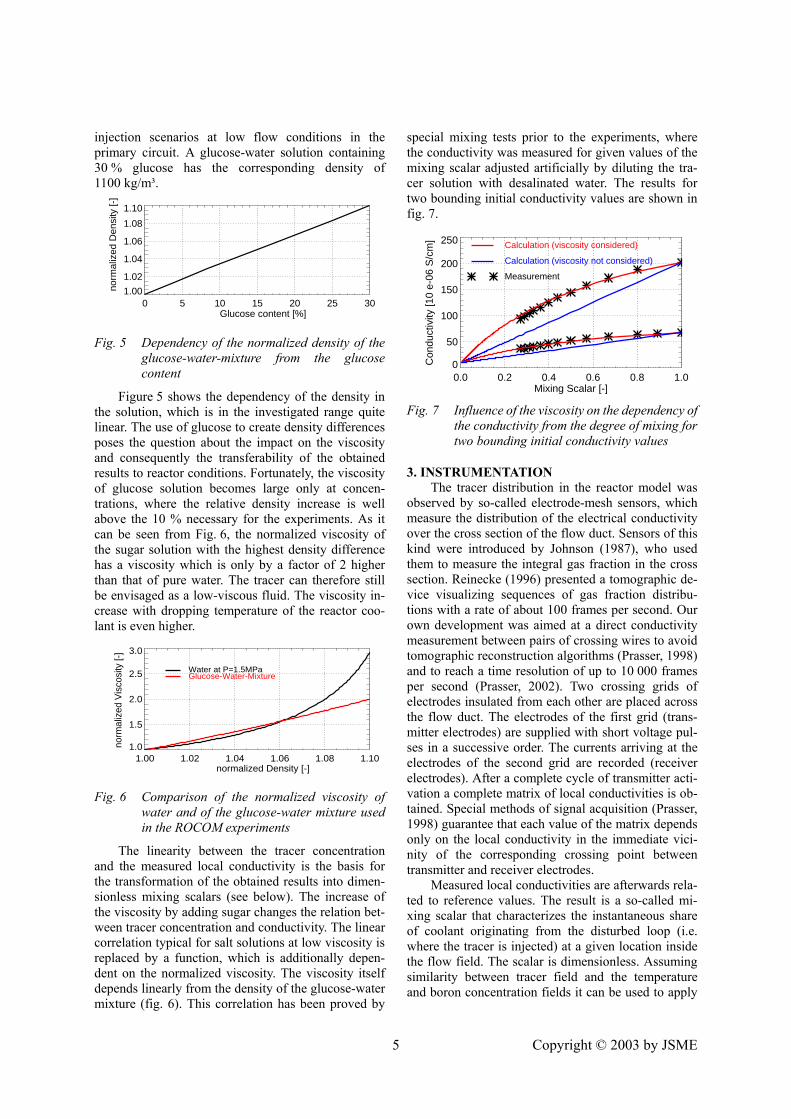
injection scenarios at low flow conditions in the primary circuit. A glucose-water solution containing 30 % glucose has the corresponding density of 1100 kg/m³.
0 5 10 15 20 25 30Glucose content [%]
1.00
1.02
1.04
1.06
1.08
1.10
norm
aliz
ed D
ensi
ty [-
]
Fig. 5 Dependency of the normalized density of the
glucose-water-mixture from the glucose content
Figure 5 shows the dependency of the density in the solution, which is in the investigated range quite linear. The use of glucose to create density differences poses the question about the impact on the viscosity and consequently the transferability of the obtained results to reactor conditions. Fortunately, the viscosity of glucose solution becomes large only at concen-trations, where the relative density increase is well above the 10 % necessary for the experiments. As it can be seen from Fig. 6, the normalized viscosity of the sugar solution with the highest density difference has a viscosity which is only by a factor of 2 higher than that of pure water. The tracer can therefore still be envisaged as a low-viscous fluid. The viscosity in-crease with dropping temperature of the reactor coo-lant is even higher.
1.00 1.02 1.04 1.06 1.08 1.10normalized Density [-]
1.0
1.5
2.0
2.5
3.0
norm
aliz
ed V
isco
sity
[-]
Water at P=1.5MPa
Glucose-Water-Mixture
Calculation (viscosity considered)
Fig. 6 Comparison of the normalized viscosity of water and of the glucose-water mixture used in the ROCOM experiments
The linearity between the tracer concentration and the measured local conductivity is the basis for the transformation of the obtained results into dimen-sionless mixing scalars (see below). The increase of the viscosity by adding sugar changes the relation bet-ween tracer concentration and conductivity. The linear correlation typical for salt solutions at low viscosity is replaced by a function, which is additionally depen-dent on the normalized viscosity. The viscosity itself depends linearly from the density of the glucose-water mixture (fig. 6). This correlation has been proved by
special mixing tests prior to the experiments, where the conductivity was measured for given values of the mixing scalar adjusted artificially by diluting the tra-cer solution with desalinated water. The results for two bounding initial conductivity values are shown in fig. 7.
0.0 0.2 0.4 0.6 0.8 1.0Mixing Scalar [-]
0
50
100
150
200
250
Con
duct
ivity
[10
e-06
S/c
m]
Calculation (viscosity not considered)
Measurement
Fig. 7 Influence of the viscosity on the dependency of
the conductivity from the degree of mixing for two bounding initial conductivity values
3. INSTRUMENTATION The tracer distribution in the reactor model was
observed by so-called electrode-mesh sensors, which measure the distribution of the electrical conductivity over the cross section of the flow duct. Sensors of this kind were introduced by Johnson (1987), who used them to measure the integral gas fraction in the cross section. Reinecke (1996) presented a tomographic de-vice visualizing sequences of gas fraction distribu-tions with a rate of about 100 frames per second. Our own development was aimed at a direct conductivity measurement between pairs of crossing wires to avoid tomographic reconstruction algorithms (Prasser, 1998) and to reach a time resolution of up to 10 000 frames per second (Prasser, 2002). Two crossing grids of electrodes insulated from each other are placed across the flow duct. The electrodes of the first grid (trans-mitter electrodes) are supplied with short voltage pul-ses in a successive order. The currents arriving at the electrodes of the second grid are recorded (receiver electrodes). After a complete cycle of transmitter acti-vation a complete matrix of local conductivities is ob-tained. Special methods of signal acquisition (Prasser, 1998) guarantee that each value of the matrix depends only on the local conductivity in the immediate vici-nity of the corresponding crossing point between transmitter and receiver electrodes.
Measured local conductivities are afterwards rela-ted to reference values. The result is a so-called mi-xing scalar that characterizes the instantaneous share of coolant originating from the disturbed loop (i.e. where the tracer is injected) at a given location inside the flow field. The scalar is dimensionless. Assuming similarity between tracer field and the temperature and boron concentration fields it can be used to apply

6 Copyright © 2003 by JSME
the experimental results to the original reactor. The re-ference values correspond to the unaffected coolant (index 0) and the coolant at the disturbed reactor inlet nozzle (index 1). The difference between the two reference values is the magnitude of the perturbation. The mixing scalar Θ is defined as follows:
0,B1,B
0,Bt,z,y,x,B
01
0t,z,y,x
01
0t,z,y,xt,z,y,x CC
CCTT
TT−
−≅
−−
≅σ−σ
σ−σ=θ (1)
Here, σ is the electrical conductivity, T is the temperature and CB the boron concentration. Which of the two parameters temperature or boron concen-tration is represented by the measured mixing scalar depends only on the right choice of the reference values and the set-up of the boundary conditions in the experiment. If the tracer is for example injected corresponding to temperature changes in a given sce-nario, the mixing scalar represents the temperature. Additional measures have to be taken, if the velocity field would be influenced by a feed-back from the temperature-dependent fluid density. This is the case in the tests modeling the cold ECC water injection described later on.
Fig. 8 Mesh sensor for measuring tracer distri-
butions in front of the reactor inlet nozzle
Mesh sensors are placed at four positions of the flow path. The first sensor (Fig. 8) is flanged to the reactor inlet nozzle (Fig. 1) in loop 1. It is aimed at the observation of the distribution at the reactor inlet, which is used as reference distribution for calculating mixing scalars. It has 2 x 16 electrode wires, which are crossing under an angle of 90 deg, i.e. the mea-suring matrix has the dimension of 16 x 16. The pitch of the wires is 8.9 mm, the total amount of measuring points is 216, since some of the crossing points are outside the circular cross section of the pipe.
The second and the third sensors are located in the downcomer (Fig. 1 and Fig. 9). They represent 4 x 64 measuring positions, i.e. the azimuthal distribution of the tracer concentration is measured at 64 angular positions with a pitch of 5.625 deg. Over the radius there are 4 measuring positions with a radial pitch of 13 mm. The downcomer sensors consist of radial fixing rods with orifices for four circular electrode wi-res. Rods and wires are separated electrically by small ceramic insulation beads. The rods are acting as radial
electrodes, i.e. each rod corresponds to an azimuthal measuring position.
a) total view
b) closer view to the electrodes
Fig. 9 Mesh sensor for the downcomer (4x64 measuring points)
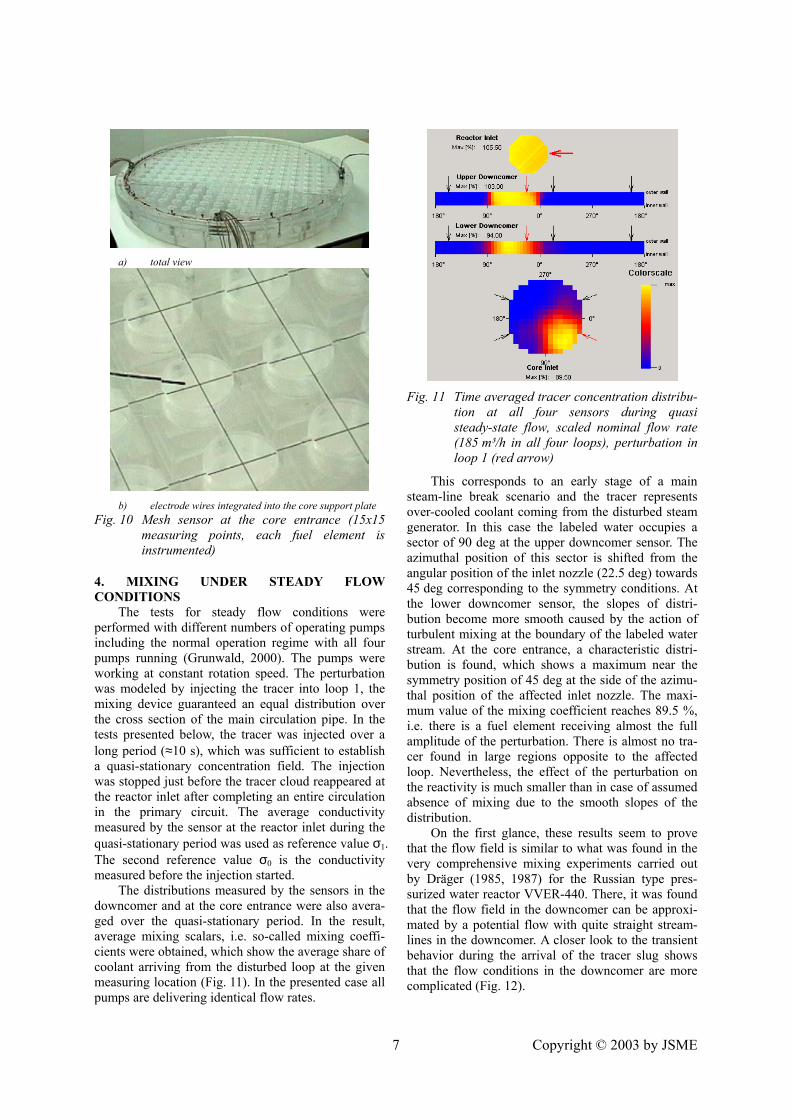
The fourth sensor is integrated into the core sup-port plate (Fig. 10). 2 x 15 electrode wires are arran-ged in a way that the wires of the two planes cross in the centers of the coolant inlet orifices of each fuel element. In this way, the tracer concentration is mea-sured at each fuel element inlet.
All four sensors are connected to a signal acquisi-tion unit disposing of measuring matrix comprising of a 32 x 32 points. The sensors occupy different qua-drants of this matrix. In total, about 1000 measuring points are recorded, the measuring frequency is 200 Hz. In most of the cases 10 successive measurements were averaged and the result was stored with a fre-quency of 20 Hz, because the characteristic frequency of the observed phenomena were not requiring a hi-gher sampling frequency.
7 Copyright © 2003 by JSME
a) total view
b) electrode wires integrated into the core support plate
Fig. 10 Mesh sensor at the core entrance (15x15 measuring points, each fuel element is instrumented)
4. MIXING UNDER STEADY FLOW CONDITIONS
The tests for steady flow conditions were performed with different numbers of operating pumps including the normal operation regime with all four pumps running (Grunwald, 2000). The pumps were working at constant rotation speed. The perturbation was modeled by injecting the tracer into loop 1, the mixing device guaranteed an equal distribution over the cross section of the main circulation pipe. In the tests presented below, the tracer was injected over a long period (≈10 s), which was sufficient to establish a quasi-stationary concentration field. The injection was stopped just before the tracer cloud reappeared at the reactor inlet after completing an entire circulation in the primary circuit. The average conductivity measured by the sensor at the reactor inlet during the quasi-stationary period was used as reference value σ1. The second reference value σ0 is the conductivity measured before the injection started.
The distributions measured by the sensors in the downcomer and at the core entrance were also avera-ged over the quasi-stationary period. In the result, average mixing scalars, i.e. so-called mixing coeffi-cients were obtained, which show the average share of coolant arriving from the disturbed loop at the given measuring location (Fig. 11). In the presented case all pumps are delivering identical flow rates.
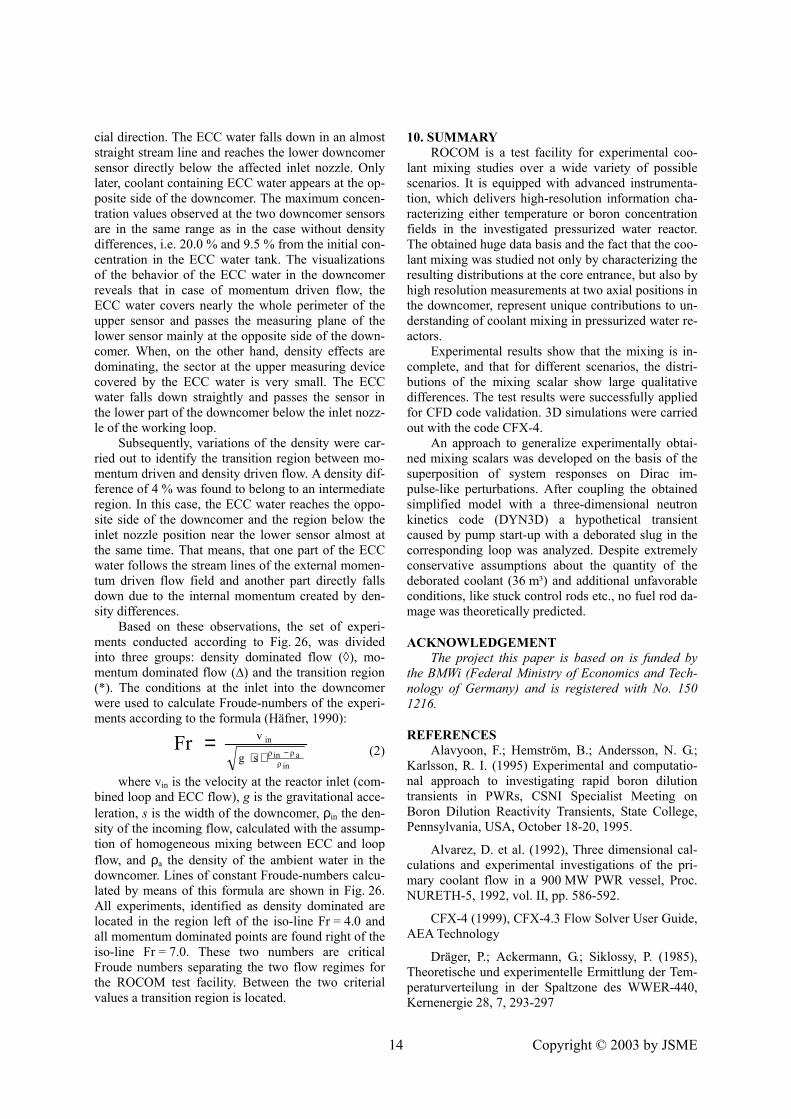
Fig. 11 Time averaged tracer concentration distribu-
tion at all four sensors during quasi steady-state flow, scaled nominal flow rate (185 m³/h in all four loops), perturbation in loop 1 (red arrow)
This corresponds to an early stage of a main steam-line break scenario and the tracer represents over-cooled coolant coming from the disturbed steam generator. In this case the labeled water occupies a sector of 90 deg at the upper downcomer sensor. The azimuthal position of this sector is shifted from the angular position of the inlet nozzle (22.5 deg) towards 45 deg corresponding to the symmetry conditions. At the lower downcomer sensor, the slopes of distri-bution become more smooth caused by the action of turbulent mixing at the boundary of the labeled water stream. At the core entrance, a characteristic distri-bution is found, which shows a maximum near the symmetry position of 45 deg at the side of the azimu-thal position of the affected inlet nozzle. The maxi-mum value of the mixing coefficient reaches 89.5 %, i.e. there is a fuel element receiving almost the full amplitude of the perturbation. There is almost no tra-cer found in large regions opposite to the affected loop. Nevertheless, the effect of the perturbation on the reactivity is much smaller than in case of assumed absence of mixing due to the smooth slopes of the distribution.
On the first glance, these results seem to prove that the flow field is similar to what was found in the very comprehensive mixing experiments carried out by Dräger (1985, 1987) for the Russian type pres-surized water reactor VVER-440. There, it was found that the flow field in the downcomer can be approxi-mated by a potential flow with quite straight stream-lines in the downcomer. A closer look to the transient behavior during the arrival of the tracer slug shows that the flow conditions in the downcomer are more complicated (Fig. 12).

Fig. 12 Time sequence of instantaneous mixing scalars showing the arrival of the tracer slug, scaled nominal
flow rate (185 m³/h in all four loops), maximum indicated by bold number [%]
Tracer arrives at first at two separate azimuthal
positions. Only later the two streams fuse together. This is caused by secondary vortices in the downco-mer, which are induced by the widening of the down-comer in the region below the inlet nozzles. There, the width of the downcomer is increased by the reduction of the wall thickness of the reactor pressure vessel (see Fig. 1). The resulting diffuser angle of 18 deg is too big to avoid flow separation.
0
0.5
1
1.5
2
2.5
3
0 45 90 135 180 225 270 315 360
azimuthal position / °
c / m
/s
LDA
CFX
outlet nozzleshatched
Fig. 13 Azimuthal distribution of the vertical velocity
component at the lower end of the down-comer, LDA measurements compared to CFX calculations (Grunwald, 2001)
Fig. 14 Fluctuations of the mixing scalar due to tur-
bulence in the maximum and in the slope of the distribution at the core entrance
Secondary vortex flow is the result, causing a non-uniform velocity field at the lower end of the downcomer, which was found also by laser Doppler anemometry (LDA) measurements (Fig. 13). The vor-
tices are rotating in the plane of the unwrapped down-comer, they are intermittently changing their strength, which results in strong fluctuations of the tracer con-centration at the periphery of the affected sector of the core entrance (Fig. 14). The assumption of a potential flow can therefore not be applied for this type of reactor.
5. CIRCULATION START-UP WITH A SLUG OF DEBORATED COOLANT IN THE LOOP
Most relevant boron dilution transients are initia-ted by an initiation of the flow in a loop, where an ac-cumulation of boron-free coolant took place. Initially the coolant is at rest. Only in this state can large slugs of boron-diluted coolant be accumulated. This coolant can come into motion either by a pump start-up or an onset of natural circulation. Both kinds of tests were performed at ROCOM. For example, a pump start-up scenario is presented. The flow rate in the affected loop was increased according to Fig. 15. It was assu-med that a quantity of 36 m² of boron-free coolant is present in the loop. This is a worst-case condition co-vering all possible scenarios of this kind. The debora-ted coolant passes around the core barrel instead of flowing directly downstream.
0 5 10 15 20Time [s]
0.0
0.2
0.4
0.6
0.8
1.0
Nor
mal
ized
Val
ues
[-]
Velocity
VelocityLoop 2-4Slug Concentration
Loop 1
Fig. 15 Flow rate in loop 1 and counter flow in loops
2-4 during pump start-up, averaged tracer concentration at the reactor inlet nozzle
This effect can be seen in Fig. 16, where sequen-ces of azimuthal distributions in the downcomer are plotted in an unwrapped way against time. At the up-per sensor in the downcomer the tracer arrives still below the affected inlet nozzle. With growing time the

9 Copyright © 2003 by JSME
tracer spreads in the azimuthal direction. Subsequently, at the lower sensor two maxima at azimuthal positions on the back side of the downcomer are observed. In the result the tracer appears at the core entrance at the side nearly opposite to the affected inlet nozzle. A se-quence of instantaneous mixing scalars at the core en-trance is shown in Fig. 23a together with theoretical results. The maximum value reached 59 % in this test. It strongly depends on the volume of the initial slug of deborated coolant, i.e. the amplitude of the deboration of the core decreases, if the slug is smaller. Similar re-sults were obtained in tests where the flow rate was close to natural circulation conditions.
Fig. 16 Time history of azimuthal mixing scalar dis-
tributions in the downcomer during pump start-up, unwrapped downcomer plots, affec-ted loop: red arrow
6. SIMPLIFIED MATHEMATICAL MODEL A simplified mathematical model (SAPR - Semi--
Analytical Perturbation Reconstruction) was develo-ped to generalize experimental results using some linear properties of the transport equation for the temperature respectively the boron concentration (Hertlein, 2003). By means of a superposition of data measured at the core entrance for short tracer pulses (quasi Dirac impulses) generated at the reactor inlet, the length and the amplitude of the disturbance can be varied off-line, i.e. without repeating the experiments.
Since the flow rate in the loop is changing, the system response is depending from the moment of injection. Therefore, the Dirac impulses have to be put in diffe-rent points on the flow rate ramp.
Fig. 17 Dirac impulse-like perturbation at the reactor inlet (left) and mixing scalar at a certain as-sembly as function of time taken from the sys-tem response (right) for the pump start-up test
The method was validated using the experimental data of the test described in the previous chapter. The applied input pulses and the experimentally obtained responses are shown in Fig. 17. Additional interme-diate Dirac-responses were derived by interpolation.
0 5 10 15 20 25Time [s]
0.0
0.2
0.4
0.6
0.8
1.0
mix
ing
scal
ar [-
] Experiment
DeviationImpulse functions
Reconstruction
Fig. 18 Reconstruction of a long tracer slug by su-perposition of Dirac pulses at the reactor inlet
The time history of the tracer concentration du-ring the long injection (Fig. 15) was reconstructed by superposing these Dirac perturbations (Fig. 18). The superposition of the corresponding time responses is in good agreement to the directly measured one (Fig. 23b). Among others, the method can be used to correct the decrease of the tracer concentration in the experimental slug. Due to the fact that tracer solution was injected with a constant flow rate into the main flow which was increasing in time, the concentration in the experimental slug was decreasing (correspon-ding to increasing boron concentration) during the in-jection period (Fig. 15). In practice the slug is more or less homogeneous. Another application of the method is the coupling of 3D neutron kinetic codes with ther-mal hydraulic system codes.
7. APPLICATION OF THE SAPR MODEL TO A HYPOTHETICAL BORON DILUTION EVENT
The SAPR model has been coupled with the 3D reactor dynamics code DYN3D (Grundmann, 1996) to provide realistic boron concentration or temperatu-
0 5 10 15 20Time [s]
0.00
0.10
0.20
0.30
0.40
Mix
ing
Sca
lar
[-]
10 15 20 25 30Time [s]
0.000
0.010
0.020
0.030
0.040
Mix
ing
Sca
lar
[-]
A5 1
A6 2
A7 3
A8 4
A9 5
A106
A117
B3 8
B4 9
B5 10
B6 11
B7 12
B8 13
B9 14
B1015
B1116
B1217
B1318
C2 19
C3 20
C4 21
C5 22
C6 23
C7 24
C8 25
C9 26
C1027
C1128
C1229
C1330
C1431
D2 32
D3 33
D4 34
D5 35
D6 36
D7 37
D8 38
D9 39
D1040
D1141
D1242
D1343
D1444
E1 45
E2 46
E3 47
E4 48
E5 49
E6 50
E7 51
E8 52
E9 53
E1054
E1155
E1256
E1357
E1458
E1559
F1 60
F2 61
F3 62
F4 63
F5 64
F6 65
F7 66
F8 67
F9 68
F1069
F1170
F1271
F1372
F1473
F1574
G1 75
G2 76
G3 77
G4 78
G5 79
G6 80
G7 81
G8 82
G9 83
G1084
G1185
G1286
G1387
G1488
G1589
H1 90
H2 91
H3 92
H4 93
H5 94
H6 95
H7 96
H8 97
H9 98
H1099
H11100
H12101
H13102
H14103
H15104
J1 105
J2 106
J3 107
J4 108
J5 109
J6 110
J7 111
J8 112
J9 113
J10114
J11115
J12116
J13117
J14118
J15119
K1 120
K2 121
K3 122
K4 123
K5 124
K6 125
K7 126
K8 127
K9 128
K10129
K11130
K12131
K13132
K14133
K15134
L1 135
L2 136
L3 137
L4 138
L5 139
L6 140
L7 141
L8 142
L9 143
L10144
L11145
L12146
L13147
L14148
L15149
M2 150
M3 151
M4 152
M5 153
M6 154
M7 155
M8 156
M9 157
M10158
M11159
M12160
M13161
M14162
N2 163
N3 164
N4 165
N5 166
N6 167
N7 168
N8 169
N9 170
N10171
N11172
N12173
N13174
N14175
O3 176
O4 177
O5 178
O6 179
O7 180
O8 181
O9 182
O10183
O11184
O12185
O13186
P5 187
P6 188
P7 189
P8 190
P9 191
P10192
P11193

10 Copyright © 2003 by JSME
been carried out for t
re distributions as boundary conditions for transient analyses. The DYN3D code has been developed in the Institute of Safety Research of the Forschungszentrum Rossendorf. DYN3D has an extensive verification and validation basis (Grundmann, 1997; Kyrki-Rajamäki, 1996) and is widely used for the analysis of reactivity initiated accidents in light water reactors with Car-tesian and hexagonal fuel assembly cross section geo-metry (Ivanov, 1999; Tietsch, 1999).
The analysis presented here has he beginning of an equilibrium fuel cycle of a ge-
neric four-loop pressurized water reactor. The macro-scopic cross section library needed for the core calcu-lations has been generated by the 2D neutron transport code CASMO (Mittag, 2002). The library contains cross section sets dependent from burn-up and the thermo-hydraulic feedback parameters in a range of variation being relevant for the transient under consi-deration. The reactor is assumed at hot zero power in a subcritical state. The Xenon- and Samarium-distri-bution corresponds to the full power state. All control rods are inserted, except the most effective, which sticks at fully withdrawn position. The considered bo-ron dilution scenario is based on the analysis of the re-start of the first main coolant (MCP) pump in a PWR after a steam generator tube rupture accident (Rein-ders, 1998). It was assumed in this analysis, that a slug of boron-free coolant has been created in the main circulation loop and is driven into the core by start-up of the first MCP. The coolant in the lower plenum has a temperature of 192 °C and a boron content of 2200 ppm. The temperature of the debora-ted slug is 210 °C.
Fig. 19 Dependency of the static core reactivity from
The this state (before the rest
over the whole height of the core.
hat an initial slug volu
or a transient analysis. The first
the initial slug volume
initial subcriticality ofart of the circulation) is determined with
-7787 pcm. The initial slug volume used as input to SAPR has been varied during the analyses between 0 m3 and the bounding volume of 36 m3 in steps of 4 m3. For each case, the boron and temperature dis-tribution at the core inlet at the time point of maxi-mum deboration has been extracted and a stationary core calculation for the hot zero power state described above has been carried out by means of DYN3D. In these calculations, the inlet distribution is extended
From the stationary calculations, which results are plotted in Fig. 19, follows, t
me of less than 16 m3 does not lead to a re-criticality of the core.
Therefore, only the cases with higher initial slug volumes are of interest f
transient calculations have been carried out for the initial slug volumes of 16 and 20 m3.
2000
16 m3
12 14 16 18 20 22 24Time [s]
-6000
-4000
-2000
0
Rea
ctiv
ity [p
cm]
20 m3
Fig. 20 Dynamic reactivity in the case of injection of
a 16 m3 and a 20 m3 unborated slug
always b e fact
The dynamic reactivity in the 16 m3 -case remains elow the zero-line. This is connected with th
, that the slug has a finite length, what was not ta-ken into account in the stationary calculations exten-ding the minimum inlet distribution of the boron con-centration in axial direction. The slug of 20 m3 leads to a significant reactivity insertion into the core, a va-lue of nearly 2 $ is reached. That results in a power peak of more than 6500 MW (Fig. 21). Then the power excursion is stopped by the Doppler feedback.
800020 m**3
12 14 16 18 20 22 24Time [s]
0
2000
4000
6000
Nuc
l. Po
wer
[MW
]
36 m**3
Fig. 21 Core power in the case of injection of a 20 m3
and a 36 m3 unborated slug
small ha id not lead to a sign
The limited integral energy release due to the lf width of the power peak d
ificant enhancement of the coolant temperature, boiling did not occur. With more than 8500 MW, the magnitude of the power peak is higher in the calcu-lation with the bounding slug volume of 36 m3 (Fig. 21) than in the previous calculation. The Dop-pler feedback stops the further power increase, too. Contrary to the 20 m3 case, the power peak occurs even before the boron concentration has reached its minimum. Because the positive reactivity insertion is continued after the power peak, typical secondary power peaks are observed.

11 Copyright © 2003 by JSME
actor core is very hete
eep below 260 °C and no s
As can be seen from Fig. 22, the radial power distribution over the re
rogeneous. At the location of the power maximum (near to the position of the sticking out control rod), coolant boiling with a maximum void fraction of up to 70 % occurs for a short time.
However, no heat transfer crisis was obtained, so that the cladding temperatures k
afety relevant limitations are violated. 00.2
0.40.6
0.81.0
0
0.2
0.4
0.6
0.8
0
100
200
300
400
500
Lin
ear R
od P
ower
[kW
/m]
x [-]
y [-]
Fig. 22 Radial distribution of the linear rod power density in the moment of maximum power (36 m3 case)
a) Experimental results
b) Semi-analytical model SAPR
c) Calculation with CFX
Fig. 23 Time sequences of selected instantaneous mixing scalar distributions at the core entrance during pump start-up, 36 m³ deborated slug in loop 1, maximum indicated with bold number at corresponding fuel element position
8. CFD CALCULATIONS The code CFX-4 (1999) is used for complemen-
tary calculations in test facility and original reactor geometry. The coolant flow is assumed to be incom-pressible. The standard k, ε turbulence model is used. The inlet boundary conditions (velocity, temperature, boron concentration etc.) are set at the inlet nozzles. The boundary conditions at the core outlet are pressu-
re controlled. For the description of temperature, bo-ron respectively salt tracer concentrations, passive scalar fields are used. Special attention was paid to the exact representation of the nozzle region with the curvature radii at the four inlet nozzles, the passes of the hot legs through the downcomer and the diffuser-type extension of the downcomer below the nozzles. Due to the great im-portance of this region for the coolant mixing, the grid

12 Copyright © 2003 by JSME
is very dense in these regions. The generated grid con-sists of about 450000 nodes. The core support plate, the core and the perforated drum are modeled as a po-rous region. The porosity is determined by relating the area of orifices to the total area of the sieve. The body forces taking into account distributed friction losses in the sieve plate are determined to obtain equal pressure drop over the structures as they are derived from the detailed construction. Steady state calculations with at least 1000 iterations last a few hours, transient calcu-lations a few weeks.
0 5 10 15 20 25 30Time [s]
0.00
0.10
0.20
0.30
0.40
0.50
0.60
Mix
ing
Sca
lar
[-]
Experiment
2 Sigma
SAPR
CFX
Maximum
Fig. 24 Time history of the maximum mixing scalar at
the core entrance during the pump start-up test (including confidence-inerval)
The result of a post-test calculation of the pump start-up experiment described above is given in Fig. 23c. There are quantitative deviations of few per-cent concerning the time history of the instantaneous maximum mixing scalar (Fig. 24). Larger deviations are found at a number of fuel element positions main-ly in the central region of the core. Furthermore, the calculated distributions show a certain delay (≈1 s) compared to the experiment. The calculation results are in good correspondence to the experiment concer-ning the main mixing phenomena, such as azimuthal position of tracer appearance and the shape of the found distributions. In general it was found that CFX is reproducing most of the measured results with a satisfactory reliability in case of the single-phase flow characteristic for the investigated mixing scenarios, as long as density effects are absent. The latter case re-quires additional code development and validation activities.
CFD calculations are powerful tools to explain fluid dynamic effects by plotting stream lines. This was done in Fig. 25 for the pump start-up scenario. It is clearly visible that the coolant has the tendency to flow around the core barrel. The flow is divided into two parts, which meet again at the side opposite to the affected inlet nozzle. This explains the shape of the tracer distributions presented in Fig. 23.
Fig 25 Stream lines in the pressure vessel calculated
by CFX-4 for the case of pump start-up in one of the loops
9. ECC WATER INJECTION WITH DENSITY EFFECTS
During emergency core cooling the higher den-sity of the ECC water leads to a streak of cold water that is flowing downwards in the downcomer. This causes thermal loads on the RPV. Furthermore, in the case of inadvertent injection of low borated ECC wa-ter, a boron dilution transient would be initiated. The transient is then determined by the resulting boron concentration distribution at the core inlet.
The goal of the experiments presented was the generic investigation of the influence of density diffe-rences between the primary loop inventory and the ECC water on the mixing in the downcomer. To sepa-rate the density effects from the influence of other pa-rameters, a constant flow in the loop with the ECC in-jection nozzle was assumed in this study. The mass flow rate was varied between 0 and 15 % of the nomi-nal flow rate, i.e. it was kept in the magnitude of natu-ral circulation. The other pumps were switched off. The density difference between ECC and loop water was varied between 0 and 10 %. Fig. 26 summarizes the boundary conditions of the experiments. Alto-gether 18 experiments have been carried out (dots in Fig. 26). In all experiments, the volume flow rate of the ECC injection system was kept constant at 1.0 l/s. The normalized density is defined as the ratio between

13 Copyright © 2003 by JSME
ECC water density and density of fluid in the circuit. All other boundary conditions are identical.
0.00 0.05 0.10 0.15Loop mass flow rate [-]
1.00
1.02
1.04
1.06
1.08
1.10
1.12
norm
aliz
ed E
CC
den
sity
[-]
Fr = 1.00
Fr = 7.00
Fr = 10.0
Fr = 4.00
Fig. 26 Test matrix of ECC injection experiments, in-dication of observed flow regime (Kliem, 2002)
The experiments without density effects serve as reference experiments for the comparison. Fig. 27a shows the time evolution of the tracer concentration measured at the two downcomer sensors in an un-
wrapped view. The red arrow indicates the position of the loop with the running pump, in that case deli-vering 10 % of the nominal flow rate. At the upper downcomer sensor, the ECC water (injected in each experiment from t = 5 to t = 15 s) appears directly below the inlet nozzle. Due to the momentum created by the pump, the flow entering the downcomer is divided into two streams flowing right and left in a downwards directed helix around the core barrel. At the opposite side of the downcomer, the two streaks of the flow fuse together and move down through the measuring plane of the lower downcomer sensor into the lower plenum. Almost the whole quantity of ECC water passes the measuring plane of the lower downcomer sensor at the side nearly opposite to the azimuthal position of the affected loop.
The maximum tracer concentration of the ECC water in the downcomer is 20 % of the injected water concentration at the upper sensor and 8 % at the lower sensor. Such a velocity field is typical for single-loop operation. It has its maximum at the opposite side of the downcomer and a minimum at the azimuthal posi-tion of the running loop, which has been found in ve-locity measurements by means of LDA at the RO-COM test facility (Grunwald, 2001), too.
a) no density difference - 10 % loop flow rate b) 10 % density difference - 10 % loop flow rate
Fig. 27 Time evolution of the mixing scalar at the two downcomer sensors in the ECC injection experiments
Fig. 27b shows the experiment, carried out at the same flow conditions, but the density difference bet-ween the injected ECC water and the primary loop coolant is now 10 %. In that case a streak formation of
the water with higher density is observed. At the up-per sensor, the ECC water covers a much smaller azi-muthal sector. The density difference partly suppres-ses the propagation of the ECC water in circumferen-
14 Copyright © 2003 by JSME
cial direction. The ECC water falls down in an almost straight stream line and reaches the lower downcomer sensor directly below the affected inlet nozzle. Only later, coolant containing ECC water appears at the op-posite side of the downcomer. The maximum concen-tration values observed at the two downcomer sensors are in the same range as in the case without density differences, i.e. 20.0 % and 9.5 % from the initial con-centration in the ECC water tank. The visualizations of the behavior of the ECC water in the downcomer reveals that in case of momentum driven flow, the ECC water covers nearly the whole perimeter of the upper sensor and passes the measuring plane of the lower sensor mainly at the opposite side of the down-comer. When, on the other hand, density effects are dominating, the sector at the upper measuring device covered by the ECC water is very small. The ECC water falls down straightly and passes the sensor in the lower part of the downcomer below the inlet nozz-le of the working loop.
Subsequently, variations of the density were car-ried out to identify the transition region between mo-mentum driven and density driven flow. A density dif-ference of 4 % was found to belong to an intermediate region. In this case, the ECC water reaches the oppo-site side of the downcomer and the region below the inlet nozzle position near the lower sensor almost at the same time. That means, that one part of the ECC water follows the stream lines of the external momen-tum driven flow field and another part directly falls down due to the internal momentum created by den-sity differences.
Based on these observations, the set of experi-ments conducted according to Fig. 26, was divided into three groups: density dominated flow (◊), mo-mentum dominated flow (∆) and the transition region (*). The conditions at the inlet into the downcomer were used to calculate Froude-numbers of the experi-ments according to the formula (Häfner, 1990):
inρaρinρ
in
sg
vFr−⋅⋅
= (2)
where vin is the velocity at the reactor inlet (com-bined loop and ECC flow), g is the gravitational acce-leration, s is the width of the downcomer, ρin the den-sity of the incoming flow, calculated with the assump-tion of homogeneous mixing between ECC and loop flow, and ρa the density of the ambient water in the downcomer. Lines of constant Froude-numbers calcu-lated by means of this formula are shown in Fig. 26. All experiments, identified as density dominated are located in the region left of the iso-line Fr = 4.0 and all momentum dominated points are found right of the iso-line Fr = 7.0. These two numbers are critical Froude numbers separating the two flow regimes for the ROCOM test facility. Between the two criterial values a transition region is located.
10. SUMMARY ROCOM is a test facility for experimental coo-
lant mixing studies over a wide variety of possible scenarios. It is equipped with advanced instrumenta-tion, which delivers high-resolution information cha-racterizing either temperature or boron concentration fields in the investigated pressurized water reactor. The obtained huge data basis and the fact that the coo-lant mixing was studied not only by characterizing the resulting distributions at the core entrance, but also by high resolution measurements at two axial positions in the downcomer, represent unique contributions to un-derstanding of coolant mixing in pressurized water re-actors.
Experimental results show that the mixing is in-complete, and that for different scenarios, the distri-butions of the mixing scalar show large qualitative differences. The test results were successfully applied for CFD code validation. 3D simulations were carried out with the code CFX-4.
An approach to generalize experimentally obtai-ned mixing scalars was developed on the basis of the superposition of system responses on Dirac im-pulse-like perturbations. After coupling the obtained simplified model with a three-dimensional neutron kinetics code (DYN3D) a hypothetical transient caused by pump start-up with a deborated slug in the corresponding loop was analyzed. Despite extremely conservative assumptions about the quantity of the deborated coolant (36 m³) and additional unfavorable conditions, like stuck control rods etc., no fuel rod da-mage was theoretically predicted.
ACKNOWLEDGEMENT The project this paper is based on is funded by
the BMWi (Federal Ministry of Economics and Tech-nology of Germany) and is registered with No. 150 1216.
REFERENCES Alavyoon, F.; Hemström, B.; Andersson, N. G.;
Karlsson, R. I. (1995) Experimental and computatio-nal approach to investigating rapid boron dilution transients in PWRs, CSNI Specialist Meeting on Boron Dilution Reactivity Transients, State College, Pennsylvania, USA, October 18-20, 1995.
Alvarez, D. et al. (1992), Three dimensional cal-culations and experimental investigations of the pri-mary coolant flow in a 900 MW PWR vessel, Proc. NURETH-5, 1992, vol. II, pp. 586-592.
CFX-4 (1999), CFX-4.3 Flow Solver User Guide, AEA Technology
Dräger, P.; Ackermann, G.; Siklossy, P. (1985), Theoretische und experimentelle Ermittlung der Tem-peraturverteilung in der Spaltzone des WWER-440, Kernenergie 28, 7, 293-297

15 Copyright © 2003 by JSME
Dräger, P. (1987) Makroskopische Kühlmittelver-mischung in DWR, PhD Thesis, TH Zittau
Gavrilas, M.; Woods, B. (2002), Fr number effect on downcomer flow pattern development in cold leg injection scenarios, Proc. Int. Conf. On Nucl. Engine-ering ICONE-10, Arlington, VA, USA, April, 14-18, 2002, paper 22728
Grundmann, U.; Rohde, U. (1994), Investigations on a boron dilution accident for a VVER-440 type reactor by the help of the code DYN3D, ANS Topical Meeting on Advances in Reactor Physics, Knoxville, TN, April 11-15, 1994, proc. vol. 3, pp. 464-471.
Grundmann, U.; Rohde, U. (1996), DYN3D – A 3-dimensional core model for steady-state and tran-sient analysis in thermal reactors , Proc. Int. Conf. on the Physics of Reactors PHYSOR’96 (pp. J70 – J79)
Grundmann, U.; Rohde, U.(1997), Verification of the Code DYN3D/R with the Help of International Benchmarks, Forschungszentrum Rossendorf, Report FZR-195
Grunwald, G.; Höhne, T.; Prasser, H.-M.; Weiß, F.-P. (2000), Coolant mixing in PWR at constant coo-lant flow in the primary circuit, Proc. Annual Meeting on Nuclear Technology ‘00, pp. 109 – 114, IN-FORUM GmbH, Bonn.
Grunwald, G.; Höhne T.; Prasser, H.-M. (2001), Laser-Doppler-velocity measurements in the down-comer of the ROCOM test facility in comparison with numerical results, Report FZR-334, ISSN 1437-322X, Rossendorf (in German)
Häfner, W. et al. (1990), HDR safety program – thermal mixing in the cold leg and downcomer of the HDR test rig, Report PHDR 91-89, FZ Karlsruhe, Germany
Hertlein, R.; Umminger, K.; Kliem, S.; Prasser, H.-M. et al., (2003), Experimental and numerical investigation of boron dilution transients in pressurized water reactors, Nucl. Techn., to appear
Höhne, T. (1998) Vergleich von Kühlmittelströ-mung und -vermischung in einem skalierten Modell des DWR Konvoi mit den Vorgängen im Original-reaktor, Report FZR-210
Ivanov, K. N.; Grundmann, U.; Mittag, S. et al. (1999), Comparative Study of a Boron Dilution Sce-nario in VVER Reactors. Ann. Nucl. Eng. 26, p. 1331
Johnson, D. (1987), Method and Apparatus for Measuring Water in Crude Oil, United States Patent, No 4,644,263, Date of Patent: Feb. 17, 1987.
Kliem, S.; Prasser, H.-M.; Grunwald, G.; Rohde, U. et al. (2002), ROCOM Experiments on the influ-ence of density differences on the coolant mixing insi-
de the reactor pressure vessel of a PWR, Proc. Annual Meeting on Nuclear Technology ’02. 65 – 69, INFO-RUM GmbH, Bonn, Germany
Kyrki-Rajamäki, R.; Grundmann, U.; Kereszturi, A. (1996), Results of Three-Dimensional Hexagonal Dynamic Benchmark Problems for VVER Type Reac-tors, Proc. Int. Conf. on the Physics of Reactors PHYSOR96, pp. J229 - J238
Melikhov, O. I.; Melikhov, V. I.; Yakush, S. E.; Bezrukov, Yu. A.; Logvinov, S. A. (2001), Analysis of boron dilution in VVER-1000 reactor, Proc. Ann. Meeting on Nucl. Technology 2001, pp. 117–120, IN-FORUM GmbH, Bonn, Germany.
Mittag, S., Grundmann, U., Koch R., Semmrich, J. (2002), Creation and use of 2-group diffusion para-meters libraries for the calculation of a KWU-KON-VOI reactor by means of the reactor dynamics code DYN3D, Report FZR-346, ISSN 1437-322X, Rossen-dorf (in German)
Prasser, H.-M.; Böttger, A.; Zschau, J. (1998), A new electrode-mesh tomograph for gas-liquid flows, Flow Measurement and Instrumentation 9, 111-119.
Prasser, H.-M.; Zschau, J.; Peters, D. et al. (2002), Fast wire-mesh sensors for gas-liquid flows – visuali-sation with up to 10 000 frames per second, Proc. International Congress on Advanced Nuclear Power Plants (ICAPP), June 9-13, 2002 - Hollywood Florida, USA, paper 1055.
Reinders, R. (1998), 3-Dimensional Calculation of the Boron Concentration in the Reactor Pressure Vessel after a SG Tube Rupture Accident, (in German), Proc. Annual Meeting on Nuclear Technology ’98. 107 – 110, INFORUM GmbH, Bonn, Germany
Reinecke, N.; Boddem, M.; Petritsch, G.; Mewes D. (1996), Tomographisches Messen der relativen Phasenanteile in zweiphasigen Strömungen fluider Phasen, Chem. Ing. Tech. 68, S. 1404-1412.
Tietsch, W.; Tischer, J. (1999), Analysis of Boron Dilution during SB-LOCAs in a 2x4 Loop B&W Type PWR, Proc. Ann. Meeting on Nuclear Technology, Inforum GmbH, Bonn, Germany, pp. 143-147
Umminger, K. et al. (1999), Thermal Hydraulics of PWR’s with Respect to Boron Dilution Phenome-na: Experimental Results from the Test Facilities PKL and UPTF, Int. Top. Mtg. on Nucl. Reactor Thermal Hydraulics (NURETH–9), San Francisco, CA, USA