Embed Size (px)
Citation preview
econstor www.econstor.eu
Der Open-Access-Publikationsserver der ZBW – Leibniz-Informationszentrum WirtschaftThe Open Access Publication Server of the ZBW – Leibniz Information Centre for Economics
Standard-Nutzungsbedingungen:
Die Dokumente auf EconStor dürfen zu eigenen wissenschaftlichenZwecken und zum Privatgebrauch gespeichert und kopiert werden.
Sie dürfen die Dokumente nicht für öffentliche oder kommerzielleZwecke vervielfältigen, öffentlich ausstellen, öffentlich zugänglichmachen, vertreiben oder anderweitig nutzen.
Sofern die Verfasser die Dokumente unter Open-Content-Lizenzen(insbesondere CC-Lizenzen) zur Verfügung gestellt haben sollten,gelten abweichend von diesen Nutzungsbedingungen die in der dortgenannten Lizenz gewährten Nutzungsrechte.
Terms of use:
Documents in EconStor may be saved and copied for yourpersonal and scholarly purposes.
You are not to copy documents for public or commercialpurposes, to exhibit the documents publicly, to make thempublicly available on the internet, or to distribute or otherwiseuse the documents in public.
If the documents have been made available under an OpenContent Licence (especially Creative Commons Licences), youmay exercise further usage rights as specified in the indicatedlicence.
zbw Leibniz-Informationszentrum WirtschaftLeibniz Information Centre for Economics
Gobien, Simone; Vollan, Björn
Conference Paper
Playing with the Social Network: Social Cohesionin Resettled and Non-Resettled Communities inCambodia
Beiträge zur Jahrestagung des Vereins für Socialpolitik 2013: Wettbewerbspolitik undRegulierung in einer globalen Wirtschaftsordnung - Session: Risk Sharing in DevelopingCountries, No. G20-V1Provided in Cooperation with:Verein für Socialpolitik / German Economic Association
Suggested Citation: Gobien, Simone; Vollan, Björn (2013) : Playing with the Social Network:Social Cohesion in Resettled and Non-Resettled Communities in Cambodia, Beiträge zurJahrestagung des Vereins für Socialpolitik 2013: Wettbewerbspolitik und Regulierung in einerglobalen Wirtschaftsordnung - Session: Risk Sharing in Developing Countries, No. G20-V1
This Version is available at:http://hdl.handle.net/10419/79985
GOBIEN AND VOLLAN (2013), PLAYING WITH THE SOCIAL NETWORK
PLAYING WITH THE SOCIAL NETWORK: SOCIAL COHESION IN RESETTLED
AND NON-RESETTLED COMMUNITIES IN CAMBODIA
Simone Gobien*a, Björn Vollanb
ABSTRACT
Mutual aid among villagers in developing countries is often the only means of insuring against
economic shocks. We use “lab-in-the-field experiments” in Cambodian villages to study social
cohesion in established and newly resettled communities. Both communities are part of a land
reform project. The project participants all signed up voluntarily, and their socio-demographic
attributes and pre-existing network ties are similar. We use a version of the “solidarity game” to
identify the effect of voluntary resettlement on willingness to help fellow villagers after an
income shock. We find a sizeable reduction in willingness to help others. Resettled players
transfer on average between 49% and 75% less money than non-resettled players. The effect
remains large and significant after controlling for personal network and when controlling for
differences in transfer expectations. The costs of voluntary resettlement, not only monetary but
also social, seem significantly higher than is commonly assumed by development planners.
Keywords: Voluntary resettlement, Social cohesion, Risk-sharing networks, “Lab-in-the-field experiment”, Cambodia
* corresponding author a) Institute for Co-operation in Developing Countries, Department of Business Administration and Economics, Philipps-Universität Marburg, Am Plan 2, 35037 Marburg, Germany, +49 6421 2823732; [email protected] b) Universität Innsbruck, Institut für Finanzwissenschaft, Universitätsstraße 15, A-6020 Innsbruck, +43 512 507 7174; [email protected]
We gratefully acknowledge the opportunity to do research in the LASED project. We thank the German Agency for International Co-operation (GIZ) and the LASED project team of IP/Gopa in Kratie, especially Michael Kirk, Franz-Volker Müller, Karl Gerner, Pen Chhun Hak, Phat Phalit, Siv Kong, Sok Lina, and Uch Sopheap, for financial, organizational, and logistical support; Hort Sreynit, Soun Phara, and the team of research assistants, for excellent support in the field; and Boban Aleksandrovic, Esther Blanco, Thomas Falk, Tom Gobien, Andreas Landmann, Fabian Pätzold, Sebastian Prediger, Susanne Väth, the participants of the 2011 IASC European Meeting, the participants of the World Bank Conference on Land and Poverty 2012 and the participants of the Brown Bag Seminar in Marburg and at Duke University for valuable comments.
GOBIEN AND VOLLAN (2013), PLAYING WITH THE SOCIAL NETWORK
1. INTRODUCTION
Land reforms in developing countries have tremendous economic and social effects on
the people. Most studies focus on monetary issues even if resettlement of people dramatically
changes their social environment. Those studies which do examine the social aspects of
resettlement deal mostly with interventions where resettlement is involuntary. Lam and Paul
(2013) identify a vicious cycle of poverty for resettled household consisting of poor harvest
coupled with damaged informal risk-coping networks in Nepal, Berg (1999) concentrates on the
loss of traditional religious systems in Nigeria, or Abutte (2000) describes the difficult process of
readjustment to the new resettlement context in Ethiopia after the erosion of long-established
social structures. The few available studies of social consequences of voluntary resettlement,
concentrate mainly on redistributive land reform in Zimbabwe, suggesting that negative effects
may arise even 20 years after voluntary resettlement (Barr, 2003; Barr, Dekker, & Fafchamps,
2010; Dekker, 2004). However, these studies lack data before resettlement and thus cannot rule
out that their effect is driven by selection instead of resettlement. It is possible that in Zimbabwe
especially those favoring a certain political party or those willing to use violence were resettled.
In this study we further analyze and quantify the social and economic loss caused by voluntary
resettlement within a land reform program controlling for endogenous project participation.
Similar to the previous studies we measure “social cohesion” by implementing a “lab-in-the-
field” experiment. Our participants are recruited from a land distribution project in rural
Cambodia. We compare voluntarily resettled farmers with beneficiaries who stay in their
established villages (non-resettled farmers).1 We complement our results with survey evidence
on income and social capital before and after resettlement.
The negative consequences of leaving one’s birthplace may be underestimated both by
the people who are resettled and by the project staff. Geographic proximity is one of the main
determinants of social networks (Fafchamps & Gubert, 2007; Fafchamps & Lund, 2003). Dekker
(2004) finds evidence that while non-resettled households in Zimbabwe rely on their network
and solidarity in the village, voluntarily resettled households are more likely to rely on individual
risk-coping strategies.2 Even when well intended and well planned, resettlement often requires
people to leave a well-functioning, cohesive community that has served them in many ways.
Among the many direct benefits of a functioning community or neighborhood are risk-coping
strategies such as easier access to credit and mutual aid (Attanasio, Barr, Cardenas, Genicot, &
GOBIEN AND VOLLAN (2013), PLAYING WITH THE SOCIAL NETWORK
Meghir, 2012; Dinh, Dufhues, & Buchenrieder, 2012; Okten & Osili, 2004), and there are
indirect benefits such as good institutions (Easterly, Ritzen, & Woolcock, 2006), low levels of
violence (Sampson, Raudenbush, & Earls, 1997), provision of local public goods through
collective action (Narayan & Pritchett, 1999), more accountable politicians (Tsai, 2007), and
greater capacity to enforce norms (Miguel & Gugerty, 2005).3
While some other authors rely on self-reported information on trust and solidarity to
measure social cohesion (Sampson et al., 1997), we believe that incentive based measures give a
more reliable picture. The seminal study by Barr (2003) explores the implications of resettlement
on trust in Zimbabwe using a standard trust experiment. Her findings show that resettled players
trust each other significantly less than non-resettled players even 20 years after resettlement, and
that the players’ responsiveness to expected trustworthiness is lower in resettled communities.
Barr (2003) argues that this lower level of trust is mainly the result of missing altruism.4 We
broaden the view by implementing a version of a solidarity experiment (Selten & Ockenfels,
1998) which captures transfers motivated by a set of pro-social concerns including altruism and
inequity aversion. The experimental game consists of two stages in which participants interact
only with randomly chosen players from the same village. In the first stage all participants play a
risk game. Then winners of the risk game make a one-shot decision on whether to transfer
payments to anonymous losers in their group or not. This experimental set-up makes it possible
to reduce disparities by equalizing game outcomes through the transfer of money. Thus, the set-
up of the solidarity experiment resembles risk-sharing situations where pro-social preferences are
relevant, which may be more pronounced in non-resettled villages where people have a stronger
feeling of belongingness and commitment. The solidarity experiment further includes elements
of trust, since transfers depend on expectations about the solidarity of others (Selten &
Ockenfels, 1998), but it does not have the strategic investment considerations included in the
trust game which provoke selfish motives. Interactions are between anonymous villagers, there
are no future interactions, and monetary transfers are not revealed. Thus, our experiment
eliminates the possibility of reciprocal risk-sharing and captures a village norm of social
cohesion expressed in the willingness to transfer payments to anonymous villagers.5
In our study, farmers in the control group (non-resettled players) received only
agricultural land and still live in their village of origin, whereas farmers in the treatment group
(resettled players) received agricultural and residential land. The resettled players moved to a
GOBIEN AND VOLLAN (2013), PLAYING WITH THE SOCIAL NETWORK
newly founded village about one year prior to our behavioral experiment, whereas non-resettled
farmers stay in their village of origin and have to commute to their new plots. The new village is
composed only of project farmers who come from different villages in the region. The
agricultural land is of a similar size for both groups.
Our study provides new evidence on the social cost of voluntary resettlement. It differs
from Barr (2003) in several ways. Firstly, we measure rather short-term effects of resettlement.
This is relevant since agricultural risk is highest immediately after obtaining agricultural land,
when farmers are still inexperienced (Lam and Paul, 2013). Secondly, we use an experimental
design that mimics real-world risk-sharing situations and measures willingness to transfer
resources that is motivated by pro-social preferences as a proxy for social cohesion on the village
level. Thirdly, we measure and control for risk aversion which might influence the settlement
decision. Fourthly, and most importantly, our treatment and control groups are closely
homogeneous samples due to the enforcement of eligibility criteria. We also exploit ex ante data
showing that the groups did not differ in social embeddedness in their village of origin. Lastly,
we enrich our experimental results with survey data on income before and after resettlement to
provide evidence of the welfare effects of the land distribution program.
We find a sizeable reduction in the willingness to help others. Resettled players transfer
on average between 49% and 75% less money than non-resettled players. This effect remains
large and significant after controlling for personal network and when controlling for differences
in transfer expectations. At the same time, there is a greater need for support in the new village.
Resettled farmers in the new village made 36% less income, (but since they received subsidies
their overall income was 20% lower). Since both groups obtained land of a similar size in the
same area, the income differences are not due to weather effects or different soil productivity.
The costs of voluntary resettlement, not only monetary but especially social, seem significantly
higher than is commonly assumed by development planners. People who have been resettled will
therefore need not only longer and more intensive external support but inevitably also adequate
micro-insurance and better access to credit.
2. BACKGROUND INFORMATION
Land scarcity, environmental degradation and unequal distribution of productive land
prevent the economic development of the many people living in rural areas who rely on
GOBIEN AND VOLLAN (2013), PLAYING WITH THE SOCIAL NETWORK
agriculture as their main source of income. In Cambodia (our study region) more than 50% of the
rural population are land-poor, with less than half a hectare of land, and about 20% are landless
(MoP & UNDP, 2007).6 These land-poor and landless rural people constitute the poorest and
most vulnerable part of the population.
(a) Resettlement context: The LASED project
The experiment was carried out in the context of the Land Allocation for Social and
Economic Development (LASED) project. This pilot project of the Royal Government of
Cambodia, supported by the German Agency for International Co-operation (GIZ) and the World
Bank, allocates one to three hectares of agricultural land to land-poor and landless people and
supports them in starting to farm on the land.7 The project is most advanced in Kratie Province,
where we carried out our research. Applicants could apply for residential or agricultural land
parcels. It was also possible to apply for both types of land. All those who received residential
land migrated permanently to a newly founded village. All the agricultural plots are around this
new village. Non-resettled farmers have to commute to their agricultural plots. The project
beneficiaries are the neediest people in the communities: to qualify they had to be landless or
land-poor (i.e. having less than half a hectare of agricultural land). As there was more demand
for both agricultural and residential land than could be supplied, applicants were selected
according to the degree of neediness.8
Agricultural and residential land plots were allocated by lottery to the selected applicants.
In Kratie Province, land had been distributed to 525 households by the end of 2008 as a pilot
project. Land recipients obtained either only agricultural land (44%), agricultural and residential
land (52%) or only residential land (four %). We excluded households who received only
residential land from our sample as conclusions about this group of 20 households are not
reliable. At the time of writing, around 10,000 hectares had been allocated to approximately
5,000 households.
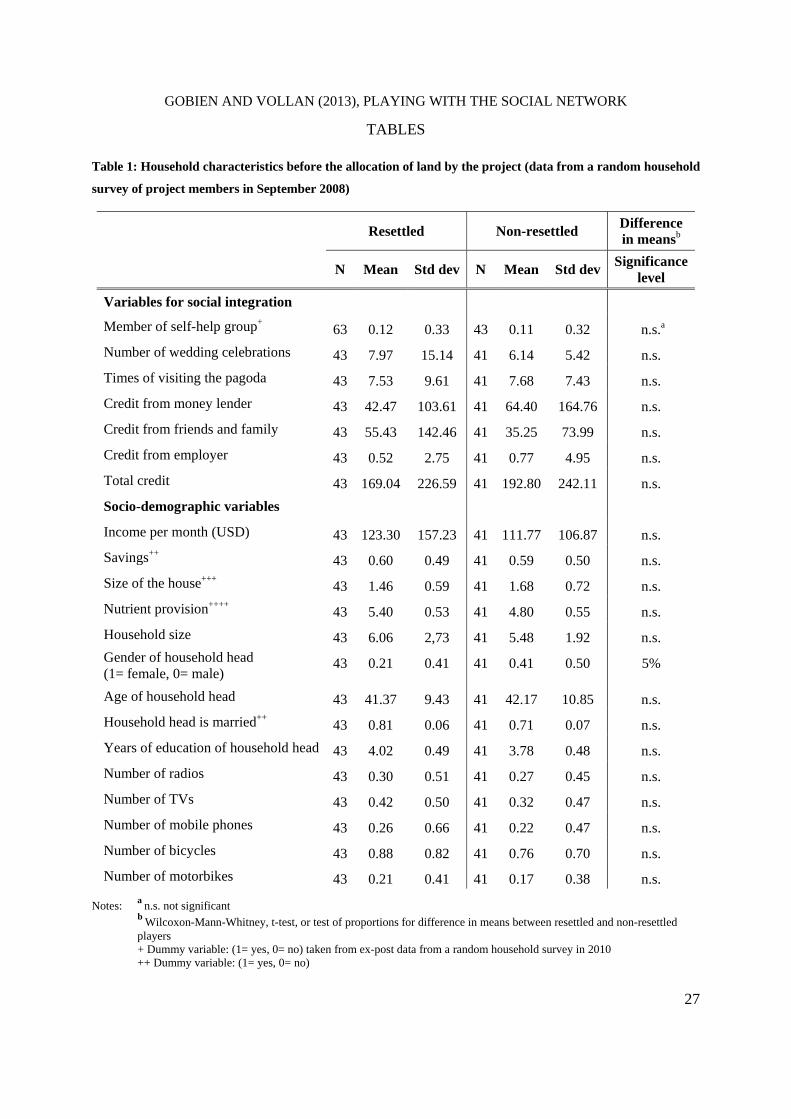
Before the allocation of land by the project, there was no significant difference in average
annual household income between the two groups in our study. We refer to these two groups as
the “non-resettled” group: those who were already resident in the established villages and were
given agricultural land by the project, and the “resettled” group: those who were given both
GOBIEN AND VOLLAN (2013), PLAYING WITH THE SOCIAL NETWORK
residential and agricultural land by the project and were resettled in the new village near the
established villages. (See Table 1.)
(b) Some evidence on ex ante differences of project members
The advantage of this set-up for our experiment is that our two groups have many
similarities: they come from adjacent villages, have obtained agricultural land of a similar size
and thus similar potential income, have a similar ex ante status of poverty, and are similarly
motivated to farm as they all signed up voluntarily for a development project to obtain
agricultural land.9 A possible difference between our samples could be their risk preferences.
Applying for residential land and ultimately moving to the LASED village is a voluntary
migration decision. The individual migration decision is based on a personal evaluation of the
characteristics of the area of origin, the area of destination, and intervening obstacles such as
travel costs, physical barriers, or immigration laws (Lee, 1966). One major migration
determinant is personal attitude towards risk (Barsky, Juster, Kimball, & Shapiro, 1997;
Heitmueller, 2005; Jaeger et al., 2007; Massey et al., 1993). Uncertainty about the area of
destination, especially uncertainty about potential profits, hinders the migration of risk-averse
individuals.10 We therefore measure risk-taking in our experiment and control for differences in
all subsequent multivariate analyses of willingness to transfer money.
Most importantly, social capital at the place of origin may influence the decision to
resettle. Haug (2008) discusses the possible effects of social ties on the decision to migrate and
finds that these ties can both reduce the likelihood of migration (“affinity hypothesis”) and
increase it (“conflict hypothesis” and “encouraging hypothesis”). We do not have completely
reliable information on the social capital of our study group before resettlement. The available
data originate from a random survey conducted with 84 project households in 2008 before the
allocation of land by the project and retrospective data from 2010 which provide information on
the situation of 106 project households before resettlement (Table 1). In both samples around
55% of the households received both residential and agricultural land and 45% received only
agricultural land. We use membership in formal groups, participation in prominent social events
(number of wedding celebrations and frequency of visiting the pagoda), and availability of
informal credit, which is based on trust and a reputation for being trustworthy, as proxy variables
for social capital. High values point in the direction of the “affinity hypothesis” and low values
GOBIEN AND VOLLAN (2013), PLAYING WITH THE SOCIAL NETWORK
in the direction of the “conflict hypothesis”. Tests for differences in means between the resettled
and non-resettled groups remain insignificant for all social variables. There is also no significant
difference in terms of income and savings, size of the house, nutrient provision of the household
members, household size, education, material status and age of the household head, as well as
different relevant household assets in 2008.11 There only seems to be more female headed
households in the group of non-resettled households.
[INSERT TABLE 1 HERE]
In our data we find no differences between our two groups in social ties or social
cohesion. Of course, unobserved factors correlated with both resettlement and willingness to
transfer money, such as a lack of prospects in the original village, variations in self-confidence,
and different ways of dealing with unknown situations and people, could influence our results.
Most likely there are many reasons why people migrate and these reasons may differ for each
individual. Hence, we do not expect a consistent bias that influences our results. A further
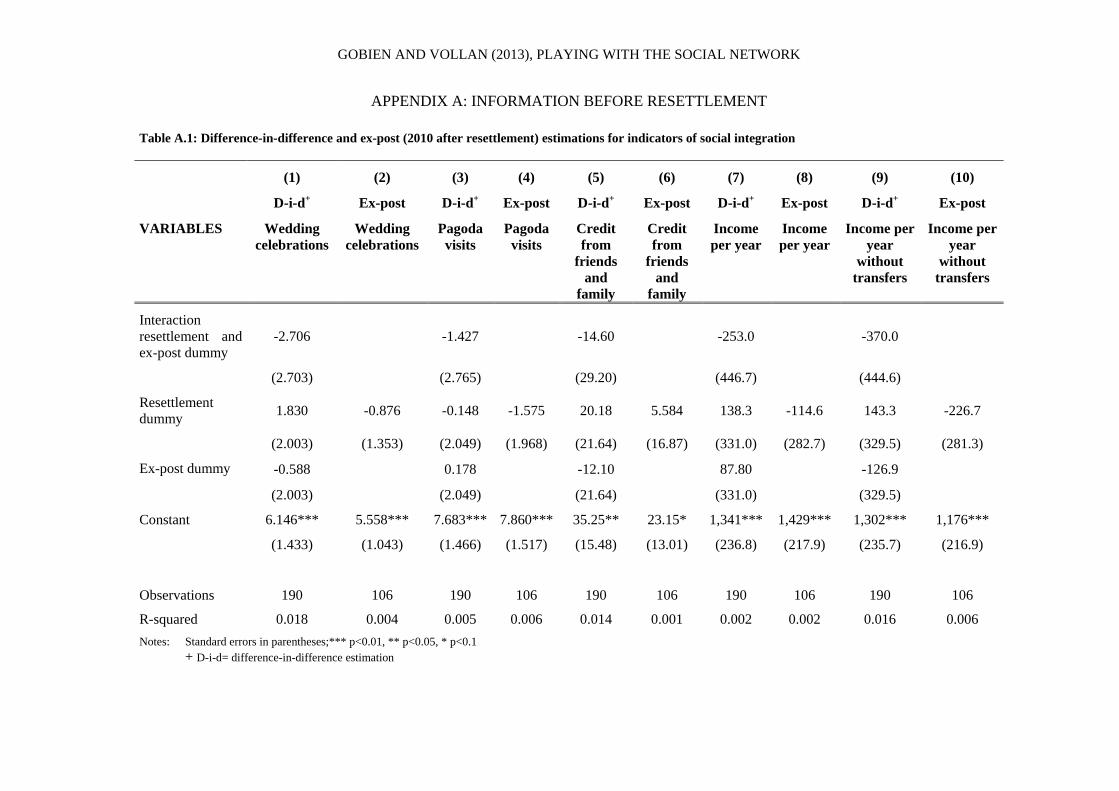
robustness test is to estimate a difference-in-difference regression that mimics random
assignment and to compare the obtained coefficient to the resettlement coefficient of simple ex
post estimation. A significant different coefficient highlights potential ex ante differences.
Although we cannot do this for our experimental measure of willingness-to-transfer, we can test
for potential bias in related variables of social ties and income. Tables A.1 and A.2 in the
appendix show that the coefficients of a difference-in-difference estimation and a “naïve” ex post
estimation for 2010 do not differ for a range of relevant variables.12
3. METHODS
Those who had received only agricultural land played the game with other project
members from their old community, and those who had received both agricultural and residential
land played it with members of their new community. In both cases the participant pool was
restricted to project members.
GOBIEN AND VOLLAN (2013), PLAYING WITH THE SOCIAL NETWORK
(a) The risk and solidarity experiments
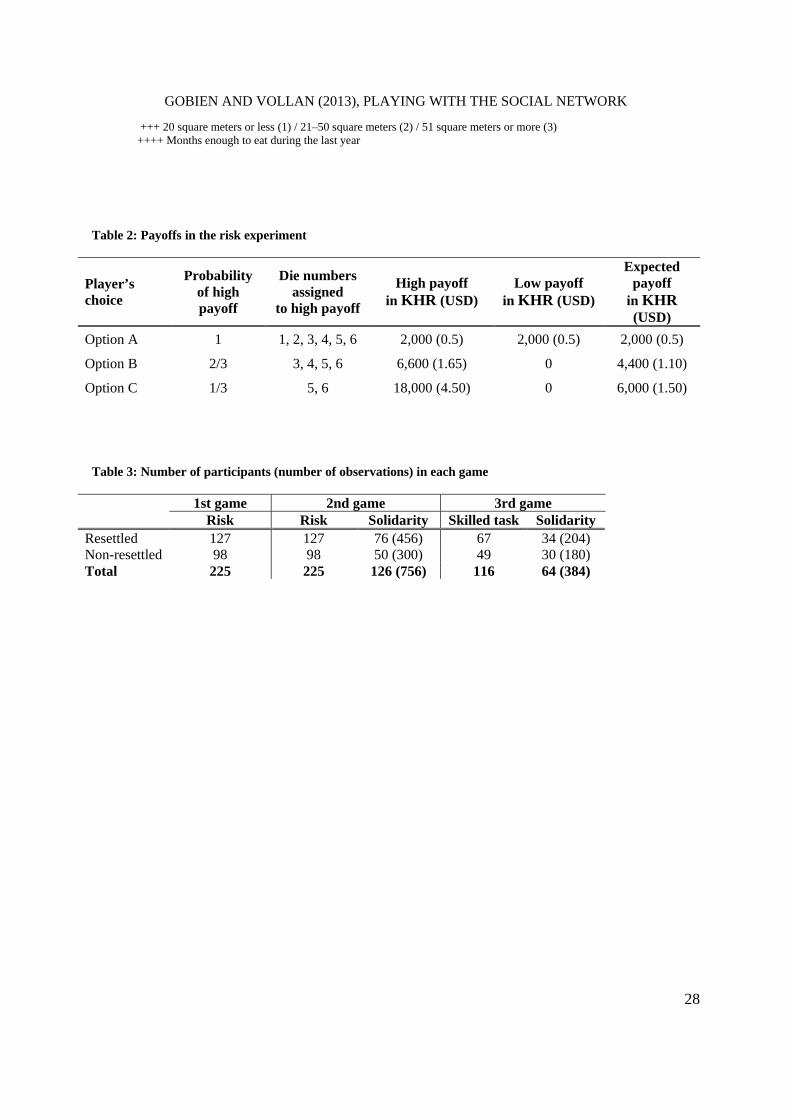
We conducted a set of three independent experiments. The first is a simple risk game
where participants can choose between three different options. The second is the same risk game
followed by a solidarity game in the second stage, consisting of transferring money in
anonymous groups of three. The third game replaces the random winning mechanism in the risk
game with a task involving skill and is again followed by the solidarity game. (See Table 2.)
The participants were aware of whether they had won or lost in one of the three risk
games, but we did not reveal transfer decisions. We informed participants that after all the games
had been played we would randomly select one of the three games and pay out the earnings for
that game. Earnings were paid out privately after a questionnaire had been completed. On
average, a player earned 4,020 riel (KHR), which is about one USD and equals the salary for half
a day’s wage labor. We also offered a free meal instead of a show-up fee.13
Our risk game is adapted from Binswanger (1980; 1981).14 The risk lottery follows an
ordered lottery selection design (see Table 2). We reduced the risk choices to three lotteries
instead of eight. This was necessary to reduce complexity once the risk game was combined with
the strategy method in the solidarity game. In the event of losing, the payoff is zero to activate
pro-social motives in the following stage. The outcome of the gamble is decided by the
participant rolling a die. Option A provides a small but secure payoff (0.50 USD). Options B and
C offer a higher expected payoff than option A, but also incorporate the risk of getting zero
payoff. Option B has a winning probability of 2/3 and appeals to players who will accept a
moderate risk, whereas option C with a winning probability of 1/3 is most attractive for risk-
loving players willing to venture a higher risk.
We were interested in measuring social cohesion at the village level independent of
reputation and reciprocal network ties. Therefore we implemented an anonymous one-shot
solidarity experiment in the second stage of game two. Decisions to transfer money were taken
after the risk choice only by winners of the game. We believe that this increases the validity of
the transfers, since players already knew that transfers were going to be made in the event of
there being losers in their three person group. Players were asked to make transfer decisions for
different possible combinations of
GOBIEN AND VOLLAN (2013), PLAYING WITH THE SOCIAL NETWORK
a) the number of players with zero payoff in the player’s group (one or two) and
b) the risk choice of these players (B or C).
This leads to a total number of six decisions per player (two transfer decisions with one
loser in the group, and four transfer decisions with two losers in the group). To avoid strategic
giving, players were not told about other players’ transfer decisions.
[INSERT TABLE 2 HERE]
In the third game, we replaced the random winning mechanism of the risk game with a skilled
task to enhance external validity. Following Gneezy, Leonard and List (2009), we set the task of
throwing a ball into a bucket.15 After we had pre-tested the task, we set winning probabilities and
the resulting payoffs equal to those of the risk game (option A: at least zero out of 10, option B:
at least four out of 10, option C: at least seven out of 10). Hence, overall changes in risk behavior
and transfer payments can be attributed to the change from a random lottery to a test of skill.
Again, the winners of the skilled task subsequently played the solidarity game.
(b) Experimental procedure and participants
Experimental sessions were carried out in April and May 2010 in four randomly chosen
non-resettled project villages and in the newly founded village. In total, we conducted 16
sessions (two sessions in each of the four non-resettled village and eight sessions in the resettled
village) with 225 participants (127 resettled players and 98 non-resettled players). Participants in
the experiment were randomly chosen from a complete list of project participants (around 35%
of all project households). Household members who were at least 18 years old were eligible for
the experiment. Only one person per household could take part in each session and a maximum
of two players per household were allowed to participate in total. A few days in advance, the
village chief informed the people that they could participate in an activity in which they could
earn money.16
GOBIEN AND VOLLAN (2013), PLAYING WITH THE SOCIAL NETWORK
Sessions were conducted by the same research team in each case. Instructions were read
out loud to all players in the common room of the village community centre. All decisions took
place in private. We illustrated the risk decision during the instruction by showing posters and
reading out examples for gambling choices. Every player practiced throwing the die three times.
Each time a different gambling choice was assumed and the players verified that they understood
the outcomes of the game. When they were making their decisions, posters of the different
gambling choices were available to the players. In games two and game three we explained
money transfer decisions in the same way: firstly, in the common room with examples and
posters for different numbers and types of losers and secondly in private with test questions
about the solidarity game.
As Table 3 shows, all participants played the risk game in game one and game two (N=
225). The transfer decisions in the second stage of game two were only recorded for those
players who won the risk game in the first stage of game two (N= 126, 76 resettled and 50 non-
resettled players). Each player made six transfer decisions, leading to 756 observations in game
two. For game three, we randomly determined half of the sessions for each group that played the
game involving a skilled task (N= 116). Finally 64 subjects won the skills game and made
transfer decisions (34 resettled and 30 non-resettled players).
[INSERT TABLE 3 HERE]
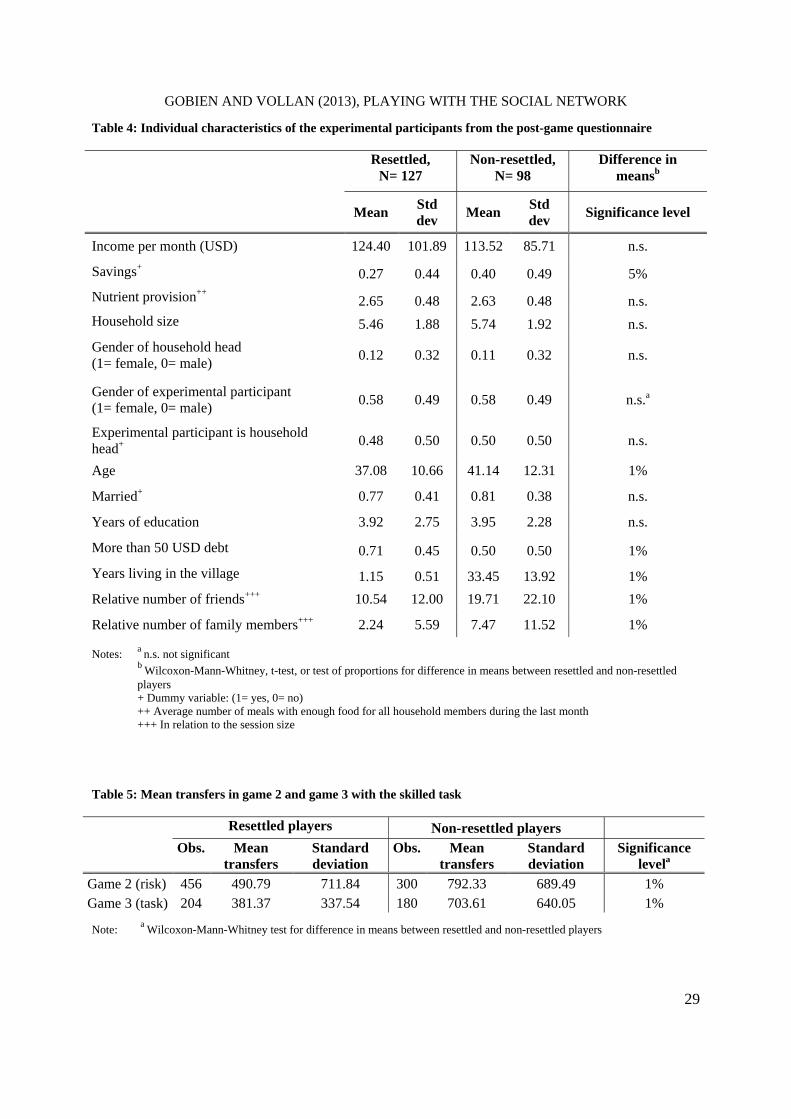
Although we chose participants randomly from a homogeneous group, there was a small
difference between the two groups in terms of age, which we control for in our regression (Table
4). There are also more households who have some savings in the non-resettled group and
household who have more than 50 USD credit in the resettled group, which might be a
consequence of resettlement, since resettled farmers have higher investment needs. Furthermore,
as expected, the non-resettled players reported on average significantly more friends and family
members than the resettled players in the experimental sessions.17 However, this difference is not
very large (the average percentage of friends in the session is 10% for resettled players and 20%
for non-resettled players). Also, 30% of players in both samples reported having no friends
GOBIEN AND VOLLAN (2013), PLAYING WITH THE SOCIAL NETWORK
taking part in the session. In our analysis we control for the network a person had within the
experimental session.
[INSERT TABLE 4 HERE]
(c) Hypotheses
Selten and Ockenfels (1998) find that what they call “giving behavior” in a solidarity
game depends on one’s expectations about the giving behavior of others. As our groups are
anonymous, expectations about transfers at the village level are relevant. Coming into a new
community leads to uncertainties about other people’s behavior. Moreover, as solidarity can be
unconditional and based on feelings of togetherness and cohesion, resettlement may have an
effect on transfer sending beyond rational expectations. We expect a negative effect of
resettlement on solidarity as a result of i) lower expectations that others would have helped, ii)
lower desire to support fellow villagers stemming from lower social cohesion, and iii) fewer
family members and friends taking part in the session.
In the third game, players could actively influence the outcome of the game, which
induced a stronger feeling of being entitled to the money. As Cherry, Frykblom and Shogren
(2002) and Hoffman, McCabe, Shachat and Smith (1994) show for an ultimatum game, subjects
transfer substantially lower amounts if they earn their winnings or earn the right to be the first
mover. This effect is in part attributed to a difference in performance or “status” (Cox, Friedman,
& Gjerstad, 2007), “mental accounting” (Cherry & Shogren, 2008), or a reduction of the supply
effect in experimental economics (Carpenter, Liati, & Vickery, 2010). Furthermore, losers in the
skilled task are responsible for their failure because they misjudged their skills. According to
Trhal and Radermacher (2009), self-inflicted neediness reduces solidarity payments. Therefore,
when it comes to the skilled game we expect a reduction of transfers in both resettled and non-
resettled groups and maybe even an increase in the difference between resettled and non-
resettled players.
GOBIEN AND VOLLAN (2013), PLAYING WITH THE SOCIAL NETWORK
4. RESULTS
(a) Risk
Our analysis of the risk choices in game one confirms our expectation that resettled
players would choose on average riskier gambles than non-resettled players.18 We find a
significant difference in means between the risk choices of the players in game one at the five %
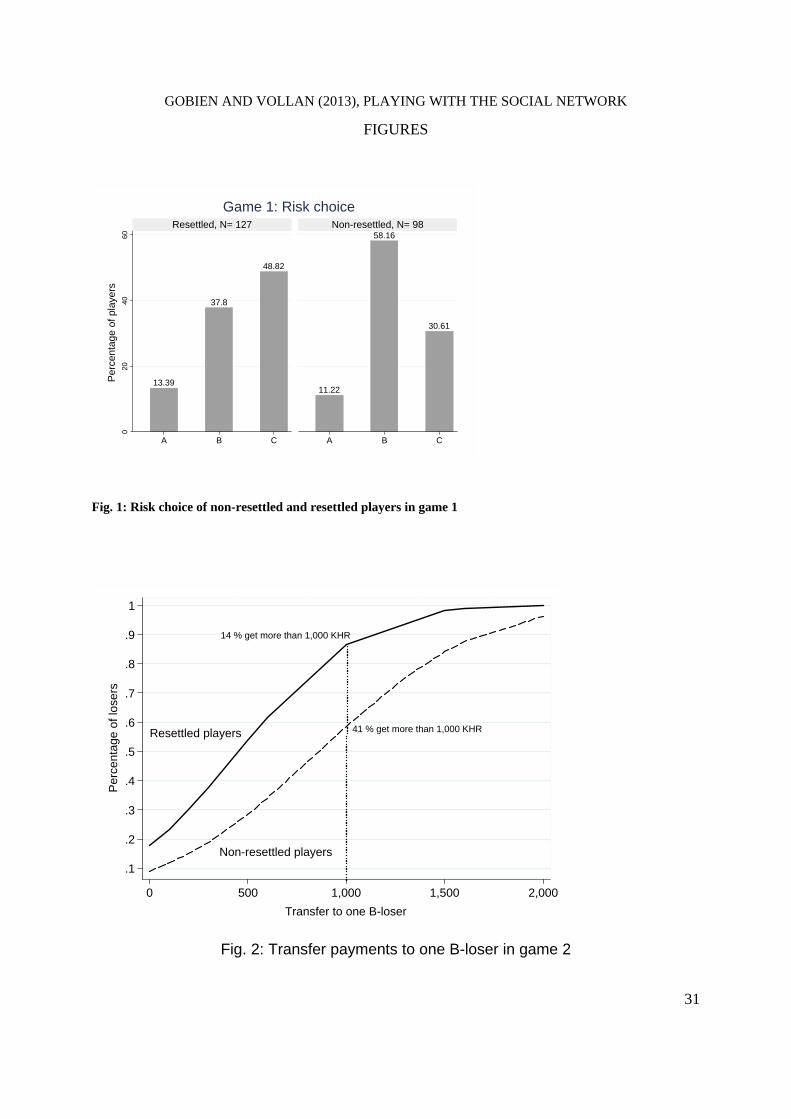
significance level (resettled players: 2.35, non-resettled players: 2.19).19 Figure 1 shows that in
the group of non-resettled players the mode lies with 58% of all players at option B, whereas in
the group of resettled players the mode lies with 48% at option C. Anyhow, these differences
disappear in game two and game three when risk choices are adapted to the experience in game
one and the possibility of transfer sending.20
[INSERT FIGURE 1 HERE]
(b) Transfer decisions
In game two, and game three with the skilled task, winners of the risk game could transfer
money to losers of the risk game in anonymous three-player groups. Table 5 shows that the mean
transfers of resettled players are significantly lower. The resettled players transfer on average
38% less money than non-resettled players. Transfer sending decreases with the skill driven
winning mechanism.21 However, the decrease is larger in the resettled village (22%) than in the
non-resettled villages (11%). Thus, individualistic motives of “earning” and “skill” are more
important in the resettled village, while transfers are more unconditional in the non-resettled
villages. These findings were confirmed through qualitative interviews after the experiment.
Resettled players reported that norms of sharing are not present in the new community; as a
resettled participant remarked, “Giving nothing is just the way people behave in this village”
(April 4, 2010, session one).
[INSERT TABLE 5 HERE]
GOBIEN AND VOLLAN (2013), PLAYING WITH THE SOCIAL NETWORK
When we analyze transfers with respect to how much money a potential sender has at
hand (whether the player chose option A or won option B or C) and how high a risk the potential
receiver(s) took (lost option B or option C), we observe the following patterns (see Table C.1 in
the appendix). Firstly, transfer senders sent lower transfers per person to two losers in their group
than to one loser (except the few C-senders who transferred similar amounts no matter whether
one or two other players lost). Secondly, even though absolute transfers increased with the
available budget, A-senders were willing to give, with an average of 14.19%, the highest
proportion of their earning (283.76 KHR), followed by B-senders (9.52%, 628.26 KHR) and C-
senders (6.94%, 1,250 KHR).22 Higher relative contributions of less wealthy people are also
found in public good games (Buckley & Croson, 2006; Hofmeyr, Burns, & Visser, 2007).23
Thirdly, there is no evidence that senders discriminate over the risk choice of the loser.
Figure 2 shows the cumulated density function of potential transfers to one B-loser for
resettled and non-resettled players. The curve for the resettled players lies entirely above that for
the non-resettled players. Hence, for the whole distribution of transfers, resettled players were
more likely to receive lower transfers. In the non-resettled group the probability of getting no
transfers is less than 10%, whereas for the resettled players it is close to 20%. Taking a transfer
of 1,000 KHR as an example, only 14% of the resettled players received a higher transfer. The
proportion of players receiving a transfer of more than 1,000 KHR increases to 41% in the group
of non-resettled players.
[INSERT FIGURE 2 HERE]
(c) Transfer differences contingent on risk choice and expectations
Since transfer decisions depend on own and others’ risk choices, simple descriptive
analysis can be misleading. We estimate solidarity conditional on a specific risk choice, to
control for potentially higher transfers made by risk-loving individuals, by including dummy
variables for the type of sender and the type of receiver of the transfer.24 We also control for the
payoffs in game one since they might generate some unwanted learning effects. We estimate
GOBIEN AND VOLLAN (2013), PLAYING WITH THE SOCIAL NETWORK
Tobit regressions as our latent variable (willingness to support) is expressed by the left censored
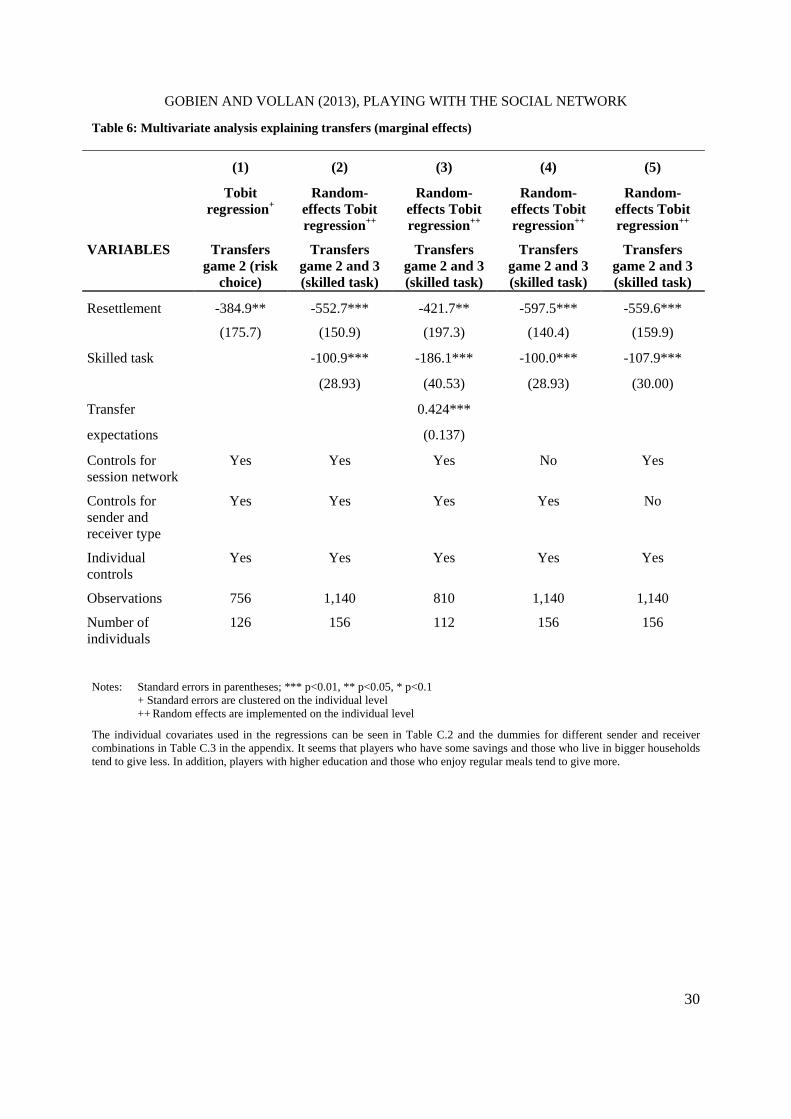
variable transfer payments with 24% of all observations censored at zero. Table 6 contains the
results of Tobit regressions on the six transfer choices that every winner of a risk game made for
all possible types of losers in that person’s group. Individual socio-demographic controls and
session size are included in all regressions.
We focus on the transfer difference between resettled and non-resettled players. We start
by analyzing only the transfer decisions in game two (regression (1), N= 126, observations=
756). Here, the resettlement dummy is negative and significant at the five % level. In a second
step, we estimate a random effects Tobit regression which also includes the transfer decisions in
game three with the skilled task (regression (2), N= 156, observations= 1,140). The resettlement
dummy increases in magnitude and remains negatively significant at the one % level.
To separate the effects of social cohesion from reciprocal motives, we include transfer
expectations in regression (3) (N= 112, observations= 810).25 These have a significant positive
influence on transfers, confirming the results of Selten and Ockenfels (1998). The more
interesting finding, however, is that resettlement remains negatively significant. That is, lower
transfers are driven not only by lower expectations about the support of others, but also by a
preference for not helping people in the resettled village.
In regression (4) (N= 156, observations= 1,140) we exclude the controls for the network
of family and friends in the session. The negative coefficient of the resettlement dummy
increases, as it now also accounts for the loss of social relations in the new village (compare
regressions (2) and (4)). The increase in the coefficient is merely -44.8 KHR. Thus, we believe
that the anonymity of our experiment cancelled out the effect of familiarity in the session. As a
robustness check, we estimate the average treatment effect on the treated using the relative
number of family members and friends with regard to session size as matching variables to
estimate the propensity score (Table C.4 in the appendix). With all different matching methods
we still find a significant negative coefficient of the resettlement dummy ranging from -163 to
-391 KHR. These results show that unconditional giving is driven not so much by the presence
of a personal social network as by social cohesion at the village level. Furthermore, the relatively
small influence of number of family members and friends in the session suggests that anonymity,
GOBIEN AND VOLLAN (2013), PLAYING WITH THE SOCIAL NETWORK
independence of games and no communication successfully removed personalized trust
motivations from the experiment.
Lastly, we estimate transfers without controlling for the risk choices of senders and
receivers, which gives us the total effect of voluntary resettlement taking into account that there
is more risk taking among resettled participants (regression (5), N= 156, observations= 1,140).
Since the resettled players adjusted their risk choice after game one we find hardly any
differences between regressions (2) and (5).
[INSERT TABLE 6 HERE]
Applying regression analysis, taking the risk choice and variation in control variables into
account, the resettlement dummy is significant in all the specifications with a magnitude from
-384.9 KHR to -597.5 KHR. Thus, resettled players transfer between 49% and 75% lower
amounts than non-resettled players in game two (792.3 KHR). The difference between the two
groups is larger than that found by a simple descriptive analysis (38%). Regressions (2) to (5)
show a significant negative coefficient for the skilled task, which confirms our hypothesis that
effort and accountability for the game outcome reduces transfers.26 The magnitude of this
coefficient with -100.9 KHR in regression (2) is more than five times smaller than the
resettlement effect.27 It was interesting to note that households that have some savings transfer
significantly lower amounts in all regressions. This is in line with findings that individuals with
financial resources face heavy demands from relatives and friends to share their fortune and
therefore use saving schemes to hide their wealth. In Africa, for example, women especially are
willing to entrust their money to “susu men” in order to withdraw it from their network (Besley,
1995, page 2150) or to put it into formal saving accounts with effectively negative interest rates
(Dupas & Robinson, 2009). Since non-resettled households are significantly more likely to have
savings, these findings reduce the magnitude of our resettlement effect.
Considering the non-random nature of the resettlement choice, the work of McKenzie,
Stillman and Gibson (2010) provides a conservative measure of the resettlement effect.
GOBIEN AND VOLLAN (2013), PLAYING WITH THE SOCIAL NETWORK
Comparing income improvements after migration, McKenzie et al. find a 25–35% bias in OLS
regressions with non-experimental data in comparison to experimental migration data. But even
then, the resettlement effect identified in regression (2), with -359.3 KHR and 45% of the
average transfer payment of the non-resettled players in game two (792.3 KHR), is still
substantial.
(d) Ex post survey data on the importance of network support
When we consider the prevalence of various types of shock – such as bad weather
conditions, livestock disease, severe illness of a household member, or fire or theft destroying a
household’s property – the importance of risk-sharing for our sample becomes evident. About
two-thirds of the players reported having experienced at least one severe shock during the last
two years, and more than 28% reported several shocks. Furthermore, 97% of these players had
experienced difficulties in coping with these shocks. Taking the monetary transfers in the games
as an indicator of general willingness to support fellow villagers, coping with these shocks in the
resettled community is clearly more difficult.
The importance of social cohesion becomes even more pronounced when we look at the
poverty status before and after resettlement of project participants. Before resettlement in 2008,
about 85% of the project households earned less than 1.25 USD per day. In 2010, the proportion
increased in the group of resettled participants to 88%, whereas it decreased in the group of non-
resettled participants to 79%. Similarly, there were no income differences in 2008 between the
households applying for resettlement and those who did not apply (see Table 1). After
resettlement in 2010, the yearly household income of resettled beneficiaries was on average
about 20% lower than that of non-resettled participants (resettled participants: 1,130.61 USD,
non-resettled participants: 1,429.09 USD, p-value: 0.09). Nevertheless, in our specific case,
project transfers could compensate for the greater vulnerability of resettled players. On average
33.5% of the yearly income of resettled participants came from project transfers, while in the
group of non-resettled participants project transfers account only for 18% of the average yearly
income. Considering the yearly income per household without transfers, participants in the
resettled village had a 36% lower income than non-resettled participants (resettled participants:
751.19 USD, non-resettled participants: 1,175.55 USD, p-value: 0.02). Here, 98% of the resettled
participants would have fallen below the poverty line and 86% of the non-resettled beneficiaries.
GOBIEN AND VOLLAN (2013), PLAYING WITH THE SOCIAL NETWORK
Furthermore, resettled participants’ income was lower in 2010 than it had been in 2008, whereas
for non-resettled participants it was higher. The resettled participants’ income was probably
lower because of time lost building a new home and new community facilities, but more
importantly because of the lack of social capital. Intuitively, a person’s family and friends,
community norms, institutions and associations constitute an important asset people can call for
in a crisis but also in the normal production process (i.e. knowledge transfer, mutual help). As
stated by Narayan and Pritchett (1999) “a village’s social capital has an effect on the incomes of
the households in that village, an effect that is empirically large, definitely social, and plausibly
causal”. One year after the land distribution, in both groups agricultural income accounted for
only a minor share of their income. Nonetheless, non-resettled participants were earning
significantly more income with agricultural production in 2010 (resettled participants: 230.89
USD, non-resettled participants: 164.89 USD, p-value: 0.08).
These findings illustrate the heavy dependence of resettled participants on transfers
mainly coming from the project. It is therefore not surprising that perceived ‘future security’ in
2010 was weaker in the group of resettled participants (p-value: 0.07). We anticipated that
especially after the end of the project in 2013, when no more transfer could be expected, social
cohesion and solidarity inside the new village would become essential for the farmers if they are
to succeed.
5. CONCLUSIONS
We conducted a lab-in-the-field experiment comparing voluntarily resettled and non-
resettled participants of a land reform project. Farmers in our control group (non-resettled
players) received only agricultural land and were still living in their villages of origin. Our
treatment group (resettled players) also received residential as well as agricultural land and
moved to a newly founded village about one year prior to our behavioral experiment. We
conducted a solidarity experiment measuring willingness to transfer money to anonymous
community members and then compared transfer differences between the resettled village and
the non-resettled villages.
We found that resettled players in the experimental game transferred on average between
49% and 77% lower amounts than non-resettled players. Close to 20% of the losers in the
resettled group received no transfers at all, whereas less than 10% of the non-resettled group
GOBIEN AND VOLLAN (2013), PLAYING WITH THE SOCIAL NETWORK
received no transfers. One might argue that non-resettled farmers are richer (given the survey
data) and therefore more likely to transfer money. However, this income effect was not
significant for our experimental participants. On the contrary, we suggest that our analysis
estimates a lower bound of the “social effect of resettlement”. This is because we would expect
even less giving if (i) resettlement was forced instead of voluntary, (ii) no project support was
offered, (iii) we used an non-anonymous experiment to measure reciprocal ties, (iv) savings were
equally distributed, or (v) village composition in the non-resettled villages was taken into
account, instead of including only the poorest individuals, since richer community members
often constitute the main source of financial and technological assistance and share their
agricultural equipment with poorer neighbors (Lin, 2001). A survey carried out before
resettlement indicates that there were no observable differences regarding social integration
predating resettlement. Consequently, the transfer difference is probably caused by voluntary
resettlement. We further find that the resettlement effect remains large and significant when we
match participants with respect to their network size and when we include expectations. Both
results support our view that transfer difference is the result of lower social cohesion in resettled
communities and that this difference is not mainly driven by the specific network people have
and goes beyond consideration of reciprocity. We do not find that people “punish” high risk
taking (or inability); instead, the norm of solidarity applies similarly to everyone and is on
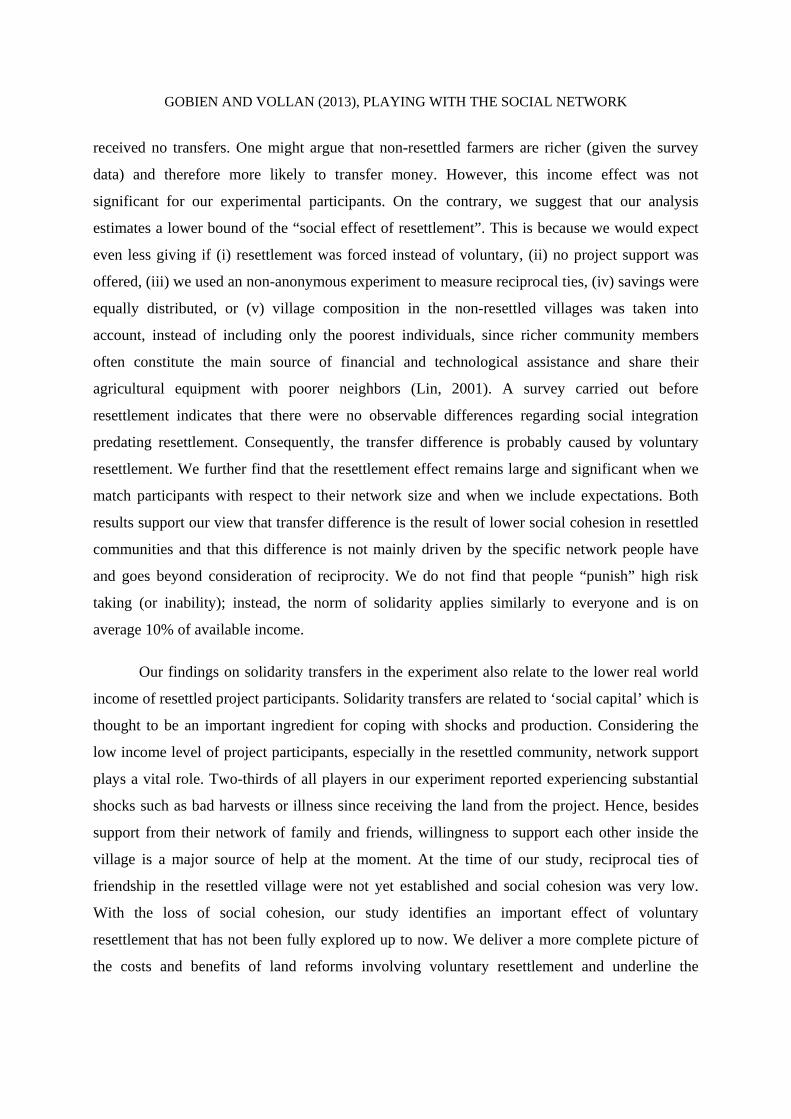
average 10% of available income.
Our findings on solidarity transfers in the experiment also relate to the lower real world
income of resettled project participants. Solidarity transfers are related to ‘social capital’ which is
thought to be an important ingredient for coping with shocks and production. Considering the
low income level of project participants, especially in the resettled community, network support
plays a vital role. Two-thirds of all players in our experiment reported experiencing substantial
shocks such as bad harvests or illness since receiving the land from the project. Hence, besides
support from their network of family and friends, willingness to support each other inside the
village is a major source of help at the moment. At the time of our study, reciprocal ties of
friendship in the resettled village were not yet established and social cohesion was very low.
With the loss of social cohesion, our study identifies an important effect of voluntary
resettlement that has not been fully explored up to now. We deliver a more complete picture of
the costs and benefits of land reforms involving voluntary resettlement and underline the
GOBIEN AND VOLLAN (2013), PLAYING WITH THE SOCIAL NETWORK
importance of counteracting negative social consequences even of voluntary resettlement
projects. Our findings are relevant for resettlement policies based on the “economics of
compensation”, which often neglect these and other social costs. Furthermore, our study can
offer help in understanding the difficulties of migrants who leave their village to find a job in the
metropolitan areas or the difficulties faced by refugees who are forced to resettle in a new
environment.
1 We use the term “social cohesion”, broadly following Emile Durkheim, to mean a “social order [which] results
from interdependence, shared loyalties and solidarities” (Jenson, 1998). 2 Somewhat related to the topic of resettlement is the experimental literature on “social distance”, which captures
people’s increased willingness to give when they have clues about nationality, occupation, race, religion (Charness
& Gneezy, 2008), or friendship and kinship (Vollan, 2011). 3 In his theoretical model of displacement and reconstruction, Cernea (1997, 2000) discusses the risks involved in
resettlement, using the term “social disarticulation”. He observes that planners of resettlement schemes often neglect
these risks. Schmidt-Soltau (2003) and Rogers and Wang (2006), among others, use this model as a basis for their
empirical analysis of the social impacts of involuntary resettlement. 4 Barr and Genicot (2008) construct a game in which participants form risk-sharing groups to insure against income
shocks. This study does not explicitly test an effect of resettlement. The authors do not find a significant difference
between resettled and non-resettled players’ willingness to share risks, but they do find that resettled villagers form
significantly larger risk-sharing groups. 5 While reciprocal, incentive-based risk-sharing motives also play a role, altruism seems to explain the largest part of
transfers in previous lab-in-the-field experiments (Leider, Möbius, Rosenblat, & Do, 2009; Ligon & Schechter,
2012). 6 Furthermore, the risk of losing land mainly through forced eviction because of large infrastructure development
projects is substantial. Amnesty International (2008) estimates that at least 150,000 Cambodians (one % of the rural
population) are living at risk of forced eviction. 7 The average land parcel in Cambodia is 0.69 hectares and small-scale farming is common, with 68% owning less
than 0.5 hectares (MoP & UNDP, 2007). Since the yearly average rice yield between 2000 and 2008 was 2.26 ton/
hectare (Yu & Fan, 2011), the distributed land parcels provide a good opportunity for the project participants. 8 Out of 1,139 applicants 525 households were selected as land recipients. 9 There is thus no influence of social distance due to variation in nationality, education, occupation, race, or religion
between the two groups. 10 Risk-averse individuals may also be more likely to migrate when the area of origin is highly insecure (Jaeger et
al., 2007). Data from our post-game questionnaire suggest, however, that before resettlement resettled players
GOBIEN AND VOLLAN (2013), PLAYING WITH THE SOCIAL NETWORK
experienced fewer economic shocks than non-resettled players. Thus, it is unlikely that the resettled people left
because their area of origin was risky. 11 Additionally, we estimate a probit regression that includes those proxies available for 2008 and socio-
demographic information about the households. None of the social variables is found to be significant. We also do
not find any difference at the village level between the non-resettled villages and the newly founded village with
regard to availability of credit, types of shocks, fluctuation inside the villages, income composition, market
integration, living conditions in the village relative to the rest of the country, collective action on the village level,
presence of minorities including religious differences, or availability of insurance. 12 The same holds true if we restrict the sample to those households with panel data. 13 The experimental protocol and posters used for visualization are available from the authors on request. 14 This game was also used by Barr and Genicot (2008) in Zimbabwe. 15 Gneezy et al. (2009) do not find any gender differences. In our task men performed slightly better than women
(mean value men: 4.38, mean value women: 3.92) but the difference is only significant at the 10% level. We also do
not find a correlation between performance in the task and age. 16 Originally, we planned for 15 players per session. In reality the number of players per session varied and we
include session size in our estimations. Sessions were smaller in the non-resettled villages because of poor
infrastructure connecting the community center to the outskirts of the village, problematic information flow from the
village chief to the chosen players, and higher costs for the players to reach the meeting point. Recruitment was in
general easier in the LASED village, since the whole village consists of project participants who worked closely
together with the project staff. 17 The non-resettled players also reported a slightly higher number of players they disliked in their session. As there
were only three non-resettled and two resettled players who disliked other players, we do not discuss the possible
consequences of this. 18 We use the Wilcoxon-Mann-Whitney test, t-test, or test of proportions to compare resettled and non-resettled
players and the Wilcoxon signed rank sum test to compare the behavior of players over the three games. 19 We assume an ordinal scale: option A=1, option B= 2, and option C= 3. 20 Compare appendix B for a detailed discussion. 21 As there is no significant difference between the mean risk choices of resettled and non-resettled players in game
two and in the skilled task, we only report mean solidarity transfers independent of the risk choice. But also
comparing those players who made the same risk choice in game two and in the skilled task shows a significant
reduction in transfer sending (N= 21, game two: 638.89, skilled task: 607.14, p-value: 0.02). Regression analysis
controls for the type of sender. Graphs of the transfer difference between resettled and non-resettled players in game
two and in the skilled task are shown in Figures C.1, C.2 and C.3 in the appendix. In all risk groups in game two,
considerably more resettled players sent no transfer than non-resettled players.

GOBIEN AND VOLLAN (2013), PLAYING WITH THE SOCIAL NETWORK
22 Figure C.1 in the appendix shows a Gaussian probability curve for the relative transfers from the three risk groups.
Even though A-senders have the highest probability of sending no transfer, the above described order of relative
transfers becomes evident for transfers bigger than 0.3% of the payoff. 23 Winning in game one and game two does not have a significant influence on solidarity transfers in our
multivariate analysis. 24 In total 17 dummies are considered. The coefficients of the dummies and other control variables are presented in
Tables C. 2 and C. 3 in the appendix. 25 Data on expectations are only available for players who were at risk of losing the risk game (risk option B or C) 26 We test also for heterogeneity of treatment effects for resettlement by stepwise including interaction terms
between resettlement status and all socio-demographic variables included in our regression. We also test an
interaction term between resettlement and the ability task. All interaction terms turn out to be insignificant. 27 As robustness check we follow Cameron and Trivedi (2009). The resettlement effect remains significant when by
exclude the upper five % of transfer sending, when we use the natural logarithm and estimate with Tobit or OLS
specification. The effect also holds when we separate censored data from non-censored data using to specifications.
Firstly, we estimate a two-part model which models the decision to send transfers as a logit estimation and secondly
the level of transfers conditional on the transfer being non-zero as an OLS estimation. Secondly, we estimate the
same decisions with a Heckman selection model. In both cases the resettlement dummy is negatively significant for
the decision to send transfers and negatively significant for the level of transfers.
GOBIEN AND VOLLAN (2013), PLAYING WITH THE SOCIAL NETWORK
REFERENCES
Abutte, W. S. (2000). Social re-articulation after resettlement: Observing the Beles valley scheme
in Ethiopia. In M. M. Cernea & C. McDowell (Eds.), Risks and reconstruction:
Experiences of resettlers and refugees (pp. 412–430). Washington: The World Bank.
Amnesty International. (2008). Rights Razed; Forced evictions in Cambodia.
Attanasio, O., Barr, A., Cardenas, J.-C., Genicot, G., & Meghir, C. (2012). Risk Pooling, Risk
Preferences, and Social Networks. American Economic Journal: Applied Economics,
4(2), 134-167.
Barr, A. (2003). Trust and Expected Trustworthiness: Experimental Evidence from Zimbabwean
Villages. The Economic Journal, 113(489), 614-630.
Barr, A., Dekker, M., & Fafchamps, M. (2010). The formation of community based organizations
in sub-Saharan Africa:An analysis of a quasi-experiment: Economic and Social Research
Council (UK).
Barr, A., & Genicot, G. (2008). Risk Sharing, Commitment and Information: An experimental
analysis. Journal of the European Economic Association, 6(6), 1151-1185.
Barsky, R. B., Juster, F. T., Kimball, M. S., & Shapiro, M. D. (1997). Preference Parameters and
Behavioral Heterogeneity: An Experimental Approach in the Health and Retirement
Study. Quarterly Journal of Economics, 112(2), 537-579.
Berg, T. M. V. (1999). “We Are Not Compensating Rocks”: Resettlement and Traditional
Religious Systems. World Development, 27(2), 271-283.
Besley, T. (1995). Savings, Credit and Insurance. In J. Behrman & T. N. Srinivasan (Eds.),
Handbook of Development Economics (Vol. 3). Amsterdam: North-Holland Press.
Binswanger, H. P. (1980). Attitudes Toward Risk: Experimental Measurement in Rural India.
American journal of agricultural economics, 62(3), 395-407.
Binswanger, H. P. (1981). Attitudes Toward Risk: Theoretical Implications of an Experiment in
Rural India. The Economic Journal, 91(364), 867-890.
Buckley, E., & Croson, R. (2006). Income and wealth heterogeneity in the voluntary provision of
linear public goods. Journal of Public Economics, 90(4–5), 935-955.
GOBIEN AND VOLLAN (2013), PLAYING WITH THE SOCIAL NETWORK
23
Cameron, A. C., & Trivedi, P. K. (2009). Microeconometrics using stata (Vol. 5): Stata Press
College Station, TX.
Carpenter, J., Liati, A., & Vickery, B. (2010). They Come To Play. Rationality and Society,
22(1), 83-102.
Cernea, M. (1997). The risks and reconstruction model for resettling displaced populations.
World Development, 25(10), 1569-1587.
Cernea, M. (2000). Risks, Safeguards, and Reconstruction: A Model for Population Displacement
and Resettlement. In M. Cernea & C. McDowell (Eds.), Risks and Reconstruction:
Experiences of Resettlers and Refugees. Washington, DC: The World Bank.
Charness, G., & Gneezy, U. (2008). What's in a name? Anonymity and socialdistance in dictator
and ultimatumgames. Journal of Economic Behavior and Organization, 68(1), 29-35.
Cherry, T., Frykblom, P., & Shogren, J. (2002). Hardnose the Dictator. The American Economic
Review, 92(4), 1218-1221.
Cherry, T., & Shogren, J. F. (2008). Self-interest, sympathy and the origin of endowments.
Economics Letters, 101(1), 69-72.
Cox, J., Friedman, D., & Gjerstad, S. (2007). A tractable model of reciprocity and fairness.
Games and Economic Behavior, 59(1), 17-45.
Dekker, M. (2004). Sustainability and Resourcefulness: Support Networks During Periods of
Stress. World Development, 32(10), 1735-1751.
Dinh, Q. H., Dufhues, T. B., & Buchenrieder, G. (2012). Do connections matter? Individual
social capital and credit constraints in Vietnam. European Journal of Development
Research, 24(3).
Dupas, P., & Robinson, J. (2009). Savings constraints and microenterprise development:
evidence from a field experiment in Kenya: NBER Working Paper Series, Working Paper
14693.
Easterly, W., Ritzen, J., & Woolcock, M. (2006). Social cohesion, institutions, and growth.
Economics & Politics, 18(2), 103-120.
GOBIEN AND VOLLAN (2013), PLAYING WITH THE SOCIAL NETWORK
24
Fafchamps, M., & Gubert, F. (2007). The formation of risk sharing networks. Journal of
Development Economics, 83(2), 326-350.
Fafchamps, M., & Lund, S. (2003). Risk-sharing networks in rural Philippines. Journal of
Development Economics, 71(2), 261-287.
Gneezy, U., Leonard, K. L., & List, J. A. (2009). Gender Differences in Competition: Evidence
From a Matrilineal and a Patriarchal Society. Econometrica, 77(5), 1637-1664.
Haug, S. (2008). Migration Networks and Migration Decision-Making. Journal of Ethnic and
Migration Studies, 34(4), 585-605.
Heitmueller, A. (2005). Unemployment benefits, risk aversion, and migration incentives. Journal
of Population Economics, 18, 93-112.
Hoffman, E., McCabe, K., Shachat, K., & Smith, V. (1994). Preferences, Property Rights, and
Anonymity in Bargaining Games. Games and Economic Behavior, 7(3), 346-380.
Hofmeyr, A., Burns, J., & Visser, M. (2007). Income inequality, reciprocity and public good
provision: An experimental analysis. South African Journal of Economics, 75(3), 508-
520.
Jaeger, D., Bonin, H., Falk, A., Huffman, D., Dohmen, T., & Sunde, U. (2007). Direct Evidence
on Risk Attitudes and Migration. Berlin: Institute for the Study of Labour.
Jenson, J. (1998). Mapping Social Cohesion: the State of Canadian Research. Ottawa: Canadian
Policy Research Network Inc.
Lam, L. M., & Paul, S. (2013). Displacement and Erosion of Informal Risk-Sharing: Evidence
from Nepal. World Development, 43(0), 42-55.
Lee, E. (1966). A theory of migration. Demography, 3(1), 47-57.
Leider, S., Möbius, M. M., Rosenblat, T., & Do, Q.-A. (2009). Directed Altruism and Enforced
Reciprocity in Social Networks. The Quarterly Journal of Economics, 124(4), 1815-1851.
Ligon, E., & Schechter, L. (2012). Motives for sharing in social networks. Journal of
Development Economics, 99(1), 13-26.
Lin, N. (2001). Social capital. Cambridge: Cambridge University Press.
GOBIEN AND VOLLAN (2013), PLAYING WITH THE SOCIAL NETWORK
25
Massey, D. S., Arango, J., Hugo, G., Kouaouci, A., Pellegrino, A., & Taylor, J. E. (1993).
Theories of International Migration: A Review and Appraisal. Population and
Development Review, 19(3), 431-466.
McKenzie, D., Stillman, S., & Gibson, J. (2010). How Important is Selection? Experimental VS.
Non-Experimental Measures of the Income Gains from Migration. Journal of the
European Economic Association, 8(4), 913-945.
Miguel, E., & Gugerty, M. (2005). Ethnic diversity, social sanctions, and public goods in Kenya.
Journal of Public Economics, 89(11-12), 2325-2368.
MoP, & UNDP. (2007). Expanding Choices for Rural Cambodia. Phnom Penh: Ministry of
Planning Cambodia and United Nations Development Programme Cambodia.
Narayan, D., & Pritchett, L. (1999). Cents and sociability: Household income and social capital
in rural Tanzania. Economic Development and Cultural Change, 47(4), 871–897.
Okten, C., & Osili, U. O. (2004). Social Networks and Credit Access in Indonesia. World
Development, 32(7), 1225-1246.
Rogers, S., & Wang, M. (2006). Environmental Resettlement and Social Dis/Rearticulation in
Inner Mongolia, China. Population and Environment, 28(1), 41-68.
Sampson, R. J., Raudenbush, S. W., & Earls, F. (1997). Neighborhoods and Violent Crime: A
Multilevel Study of Collective Efficacy. Science, 277(5328), 918-924.
Schmidt–Soltau, K. (2003). Conservation–related Resettlement in Central Africa: Environmental
and Social Risks. Development and Change, 34(3), 525-551.
Selten, R., & Ockenfels, A. (1998). An experimental solidarity game. Journal of Economic
Behavior and Organization, 34(4), 517-539.
Trhal, N., & Radermacher, R. (2009). Bad luck vs. self-inflicted neediness - An experimental
investigation of gift giving in a solidarity game. Journal of Economic Psychology, 30(4),
517-526.
Tsai, L. (2007). Accountability without Democracy. Solidary Groups and Public Goods Provision
in Rural China. Cambridge: Cambridge University Press.
GOBIEN AND VOLLAN (2013), PLAYING WITH THE SOCIAL NETWORK
26
Vollan, B. (2011). The difference between kinship and friendship: (Field-) experimental evidence
on trust and punishment. Journal of Socio-Economics, 40(1), 14-25.
Yu, B., & Fan, S. (2011). Rice production response in Cambodia. Agricultural Economics, 42(3),
437-450.
GOBIEN AND VOLLAN (2013), PLAYING WITH THE SOCIAL NETWORK
27
TABLES
Table 1: Household characteristics before the allocation of land by the project (data from a random household
survey of project members in September 2008)
Resettled Non-resettled Difference
in meansb
N Mean Std dev N Mean Std dev Significancelevel
Variables for social integration Member of self-help group+
63 0.12 0.33 43 0.11 0.32 n.s.a
Number of wedding celebrations 43 7.97 15.14 41 6.14 5.42 n.s.
Times of visiting the pagoda 43 7.53 9.61 41 7.68 7.43 n.s.
Credit from money lender 43 42.47 103.61 41 64.40 164.76 n.s.
Credit from friends and family 43 55.43 142.46 41 35.25 73.99 n.s.
Credit from employer 43 0.52 2.75 41 0.77 4.95 n.s.
Total credit 43 169.04 226.59 41 192.80 242.11 n.s.
Socio-demographic variables Income per month (USD) 43 123.30 157.23 41 111.77 106.87 n.s.
Savings++ 43 0.60 0.49 41 0.59 0.50 n.s.
Size of the house+++ 43 1.46 0.59 41 1.68 0.72 n.s.
Nutrient provision++++ 43 5.40 0.53 41 4.80 0.55 n.s.
Household size 43 6.06 2,73 41 5.48 1.92 n.s. Gender of household head (1= female, 0= male)
43 0.21 0.41 41 0.41 0.50 5%
Age of household head 43 41.37 9.43 41 42.17 10.85 n.s.
Household head is married++ 43 0.81 0.06 41 0.71 0.07 n.s.
Years of education of household head 43 4.02 0.49 41 3.78 0.48 n.s.
Number of radios 43 0.30 0.51 41 0.27 0.45 n.s.
Number of TVs 43 0.42 0.50 41 0.32 0.47 n.s.
Number of mobile phones 43 0.26 0.66 41 0.22 0.47 n.s.
Number of bicycles 43 0.88 0.82 41 0.76 0.70 n.s.
Number of motorbikes 43 0.21 0.41 41 0.17 0.38 n.s.
Notes: a n.s. not significant
b Wilcoxon-Mann-Whitney, t-test, or test of proportions for difference in means between resettled and non-resettled players + Dummy variable: (1= yes, 0= no) taken from ex-post data from a random household survey in 2010 ++ Dummy variable: (1= yes, 0= no)
GOBIEN AND VOLLAN (2013), PLAYING WITH THE SOCIAL NETWORK
28
+++ 20 square meters or less (1) / 21–50 square meters (2) / 51 square meters or more (3) ++++ Months enough to eat during the last year
Table 2: Payoffs in the risk experiment
Player’s choice
Probability of high payoff
Die numbers assigned
to high payoff
High payoff in KHR (USD)
Low payoff in KHR (USD)
Expected payoff
in KHR (USD)
Option A 1 1, 2, 3, 4, 5, 6 2,000 (0.5) 2,000 (0.5) 2,000 (0.5)
Option B 2/3 3, 4, 5, 6 6,600 (1.65) 0 4,400 (1.10)
Option C 1/3 5, 6 18,000 (4.50) 0 6,000 (1.50)
Table 3: Number of participants (number of observations) in each game
1st game 2nd game 3rd gameRisk Risk Solidarity Skilled task Solidarity
Resettled 127 127 76 (456) 67 34 (204) Non-resettled 98 98 50 (300) 49 30 (180) Total 225 225 126 (756) 116 64 (384)
GOBIEN AND VOLLAN (2013), PLAYING WITH THE SOCIAL NETWORK
29
Table 4: Individual characteristics of the experimental participants from the post-game questionnaire
Resettled, N= 127
Non-resettled, N= 98
Difference in meansb
Mean Std dev Mean Std
dev Significance level
Income per month (USD) 124.40 101.89 113.52 85.71 n.s.
Savings+ 0.27 0.44 0.40 0.49 5%
Nutrient provision++ 2.65 0.48 2.63 0.48 n.s.
Household size 5.46 1.88 5.74 1.92 n.s.
Gender of household head (1= female, 0= male) 0.12 0.32 0.11 0.32 n.s.
Gender of experimental participant (1= female, 0= male) 0.58 0.49 0.58 0.49 n.s.a
Experimental participant is household head+ 0.48 0.50 0.50 0.50 n.s.
Age 37.08 10.66 41.14 12.31 1%
Married+ 0.77 0.41 0.81 0.38 n.s.
Years of education 3.92 2.75 3.95 2.28 n.s.
More than 50 USD debt 0.71 0.45 0.50 0.50 1%
Years living in the village 1.15 0.51 33.45 13.92 1%
Relative number of friends+++ 10.54 12.00 19.71 22.10 1%
Relative number of family members+++ 2.24 5.59 7.47 11.52 1%
Notes: a n.s. not significant
b
Wilcoxon-Mann-Whitney, t-test, or test of proportions for difference in means between resettled and non-resettled players + Dummy variable: (1= yes, 0= no) ++ Average number of meals with enough food for all household members during the last month +++ In relation to the session size
Table 5: Mean transfers in game 2 and game 3 with the skilled task
Resettled players Non-resettled players
Obs. Mean transfers
Standard deviation
Obs. Mean transfers
Standard deviation
Significance levela
Game 2 (risk) 456 490.79 711.84 300 792.33 689.49 1% Game 3 (task) 204 381.37 337.54 180 703.61 640.05 1%
Note: a
Wilcoxon-Mann-Whitney test for difference in means between resettled and non-resettled players
GOBIEN AND VOLLAN (2013), PLAYING WITH THE SOCIAL NETWORK
30
Table 6: Multivariate analysis explaining transfers (marginal effects)
(1) (2) (3) (4) (5)
Tobit regression+
Random-effects Tobit regression++
Random-effects Tobit regression++
Random-effects Tobit regression++
Random-effects Tobit regression++
VARIABLES Transfers game 2 (risk
choice)
Transfers game 2 and 3 (skilled task)
Transfers game 2 and 3 (skilled task)
Transfers game 2 and 3 (skilled task)
Transfers game 2 and 3 (skilled task)
Resettlement -384.9** -552.7*** -421.7** -597.5*** -559.6***
(175.7) (150.9) (197.3) (140.4) (159.9)
Skilled task -100.9*** -186.1*** -100.0*** -107.9***
(28.93) (40.53) (28.93) (30.00)
Transfer 0.424***
expectations (0.137)
Controls for session network
Yes Yes Yes No Yes
Controls for sender and receiver type
Yes Yes Yes Yes No
Individual controls
Yes Yes Yes Yes Yes
Observations 756 1,140 810 1,140 1,140
Number of individuals
126 156 112 156 156
Notes: Standard errors in parentheses; *** p<0.01, ** p<0.05, * p<0.1 + Standard errors are clustered on the individual level ++ Random effects are implemented on the individual level
The individual covariates used in the regressions can be seen in Table C.2 and the dummies for different sender and receiver combinations in Table C.3 in the appendix. It seems that players who have some savings and those who live in bigger households tend to give less. In addition, players with higher education and those who enjoy regular meals tend to give more.
GOBIEN AND VOLLAN (2013), PLAYING WITH THE SOCIAL NETWORK
31
FIGURES
Fig. 1: Risk choice of non-resettled and resettled players in game 1
Fig. 2: Transfer payments to one B-loser in game 2
13.39
37.8
48.82
11.22
58.16
30.61
020
4060
A B C A B C
Resettled, N= 127 Non-resettled, N= 98
Per
cent
age
of p
laye
rs
Game 1: Risk choice
Non-resettled players
Resettled players
14 % get more than 1,000 KHR
41 % get more than 1,000 KHR
.1
.2
.3
.4
.5
.6
.7
.8
.9
1
Per
cent
age
of lo
sers
0 500 1,000 2,0001,500
Transfer to one B-loser
GOBIEN AND VOLLAN (2013), PLAYING WITH THE SOCIAL NETWORK
APPENDIX A: INFORMATION BEFORE RESETTLEMENT
Table A.1: Difference-in-difference and ex-post (2010 after resettlement) estimations for indicators of social integration
(1) (2) (3) (4) (5) (6) (7) (8) (9) (10)
D-i-d+ Ex-post D-i-d+ Ex-post D-i-d+ Ex-post D-i-d+ Ex-post D-i-d+ Ex-post
VARIABLES Wedding celebrations
Wedding celebrations
Pagoda visits
Pagoda visits
Credit from
friends and
family
Credit from
friends and
family
Income per year
Income per year
Income per year
without transfers
Income per year
without transfers
Interaction resettlement and ex-post dummy
-2.706 -1.427 -14.60 -253.0 -370.0
(2.703) (2.765) (29.20) (446.7) (444.6)
Resettlement dummy
1.830 -0.876 -0.148 -1.575 20.18 5.584 138.3 -114.6 143.3 -226.7
(2.003) (1.353) (2.049) (1.968) (21.64) (16.87) (331.0) (282.7) (329.5) (281.3)
Ex-post dummy -0.588 0.178 -12.10 87.80 -126.9
(2.003) (2.049) (21.64) (331.0) (329.5)
Constant 6.146*** 5.558*** 7.683*** 7.860*** 35.25** 23.15* 1,341*** 1,429*** 1,302*** 1,176***
(1.433) (1.043) (1.466) (1.517) (15.48) (13.01) (236.8) (217.9) (235.7) (216.9)
Observations 190 106 190 106 190 106 190 106 190 106
R-squared 0.018 0.004 0.005 0.006 0.014 0.001 0.002 0.002 0.016 0.006
Notes: Standard errors in parentheses;*** p<0.01, ** p<0.05, * p<0.1 + D-i-d= difference-in-difference estimation

GOBIEN AND VOLLAN (2013), PLAYING WITH THE SOCIAL NETWORK
Table A.2: Test for equality of the coefficients of the difference-in-difference and the ex-post estimation
Interaction resettlement and ex-post dummy of
d-i-d estimation
Resettlement dummy of ex-
post estimation
Significance level of test for equality
Wedding celebrations -2.706 -0.876 n.s.a
Pagoda visits -1.427 -1.575 n.s.
Credit from friends and family -14.60 5.584 n.s.
Income per year -253.0 -114.6 n.s.
Income per year without transfers -370.0 -226.7 n.s.
Notes: a n.s. not signifcant
GOBIEN AND VOLLAN (2013), PLAYING WITH THE SOCIAL NETWORK
34
APPENDIX B: ADAPTATION OF RISK IN GAME TWO AND GAME THREE
In the solidarity game (game two) a player might expect a non-zero payoff in the event of
losing the game (depending on the player’s expectation of transfers from fellow villagers). Hence
the risk of losing can be partly shared within the solidarity group and transfers can be interpreted
as an informal insurance mechanism. People might want to avoid being a burden to anyone and
thus play the safe lottery more often. This is, however, an unrealistic interpretation since the
choices were anonymous, and thus humility, shame or other motives cannot be involved. With
informal insurance, players might rather choose a higher risk option as they do not have to bear
the cost of losing alone. Choosing a higher risk is also more efficient for the group of three,
provided that redistribution among them takes place.
A significant increase in higher risk choices in game two is seen only for those players
who won game one, while those players who lost game one significantly decrease their higher
risk choices (see Table B.1 and Fig. B.1 in the appendix). Therefore, players’ reasoning processes
about what level of risk to take is influenced between game one and game two by the introduction
of transfer possibilities, but also (and maybe more) by previous experience in game one. Given
our limited set of choices, with one safe and two risky options, players might be indifferent to the
two risky choices in the first game, but their consequent success or failure is likely to influence
their choices in the second game. The non-resettled players show a stronger increase in cases
where they win in the first game, and a weaker decrease in cases where they lose, than the
resettled players. This different adjustment magnitude can be explained by differences in transfer
expectations. For players who were at risk of losing the game (option B or C), we find that higher
transfer expectations go along with taking higher risks (mean expectation of players who chose
option B: 643.91 KHR, mean expectation of players who chose option C: 838.81 KHR, p-value
0.02). Mean expectations differ at the one % significance level between resettled and non-
resettled players (resettled players: 584.28 KHR, non-resettled players: 905.55 KHR, p-value:
0.00). Non-resettled players expected higher transfers because of stronger social cohesion and
therefore may have been willing to react more strongly to the introduction of informal insurance
in game two.
In game three, the average risk choice in the skilled task is significantly lower than the
average risk choice in game two (game two: 2.19, game three: 2.04, p-value: 0.05, see also Fig.
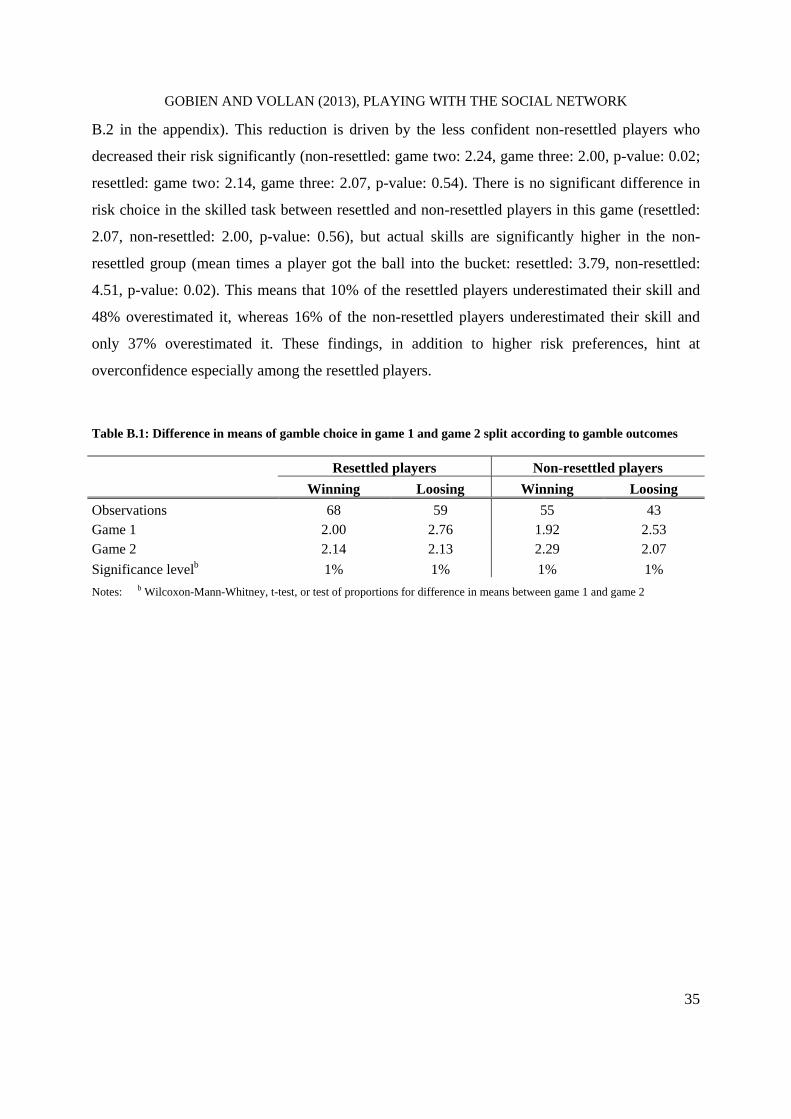
GOBIEN AND VOLLAN (2013), PLAYING WITH THE SOCIAL NETWORK
35
B.2 in the appendix). This reduction is driven by the less confident non-resettled players who
decreased their risk significantly (non-resettled: game two: 2.24, game three: 2.00, p-value: 0.02;
resettled: game two: 2.14, game three: 2.07, p-value: 0.54). There is no significant difference in
risk choice in the skilled task between resettled and non-resettled players in this game (resettled:
2.07, non-resettled: 2.00, p-value: 0.56), but actual skills are significantly higher in the non-
resettled group (mean times a player got the ball into the bucket: resettled: 3.79, non-resettled:
4.51, p-value: 0.02). This means that 10% of the resettled players underestimated their skill and
48% overestimated it, whereas 16% of the non-resettled players underestimated their skill and
only 37% overestimated it. These findings, in addition to higher risk preferences, hint at
overconfidence especially among the resettled players.
Table B.1: Difference in means of gamble choice in game 1 and game 2 split according to gamble outcomes
Resettled players Non-resettled players
Winning Loosing Winning Loosing
Observations 68 59 55 43Game 1 2.00 2.76 1.92 2.53Game 2 2.14 2.13 2.29 2.07
Significance levelb 1% 1% 1% 1%
Notes: b Wilcoxon-Mann-Whitney, t-test, or test of proportions for difference in means between game 1 and game 2

GOBIEN AND VOLLAN (2013), PLAYING WITH THE SOCIAL NETWORK
36
Fig. B.1: Gamble choice in game 1 and game 2 split according to gamble outcomes
25
50
25 23.73
76.27
020
4060
80
A B C A B C
Winners game 1, N= 68 Losers game 1, N= 59
Pe
rce
nta
ge
of
pla
yers
Risk choice game 1; Resettled
16.18
52.94
30.88
20.34
45.76
33.9
020
4060
80
A B C A B C
Winners game 1, N= 68 Losers game 1, N= 59
Pe
rce
nta
ge
of
pla
yers
Risk choice game 2; Resettled
20
67.27
12.73
46.5153.49
020
4060
80
A B C A B C
Winners game 1, N= 55 Losers game 1, N= 43
Pe
rce
nta
ge
of
pla
yers
Risk choice game 1; Non-resettled
18.18
34.55
47.27
18.6
55.81
25.58
020
4060
80
A B C A B C
Winners game 1, N= 55 Losers game 1, N= 43
Pe
rce
nta
ge
of
pla
yers
Risk choice game 2; Non-resettled
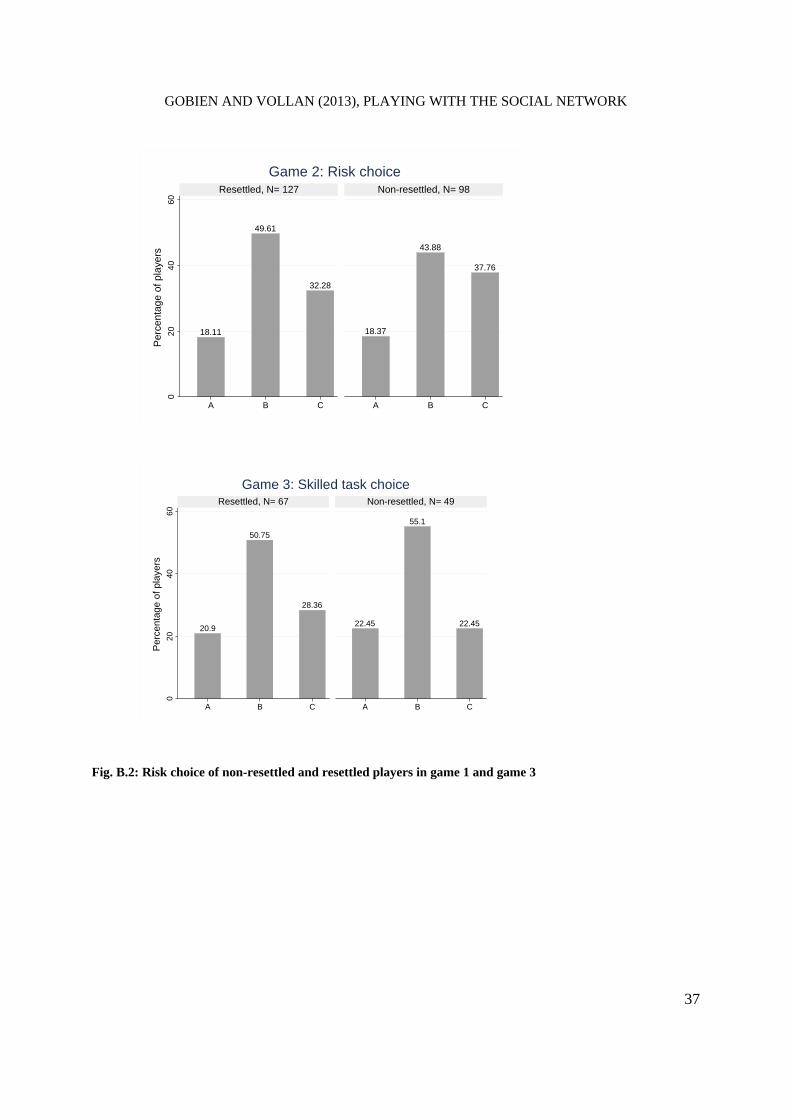
GOBIEN AND VOLLAN (2013), PLAYING WITH THE SOCIAL NETWORK
37
Fig. B.2: Risk choice of non-resettled and resettled players in game 1 and game 3
18.11
49.61
32.28
18.37
43.88
37.76
02
04
06
0
A B C A B C
Resettled, N= 127 Non-resettled, N= 98
Per
cent
age
of p
laye
rs
Game 2: Risk choice
20.9
50.75
28.36
22.45
55.1
22.45
02
04
06
0
A B C A B C
Resettled, N= 67 Non-resettled, N= 49
Per
cent
age
of p
laye
rs
Game 3: Skilled task choice
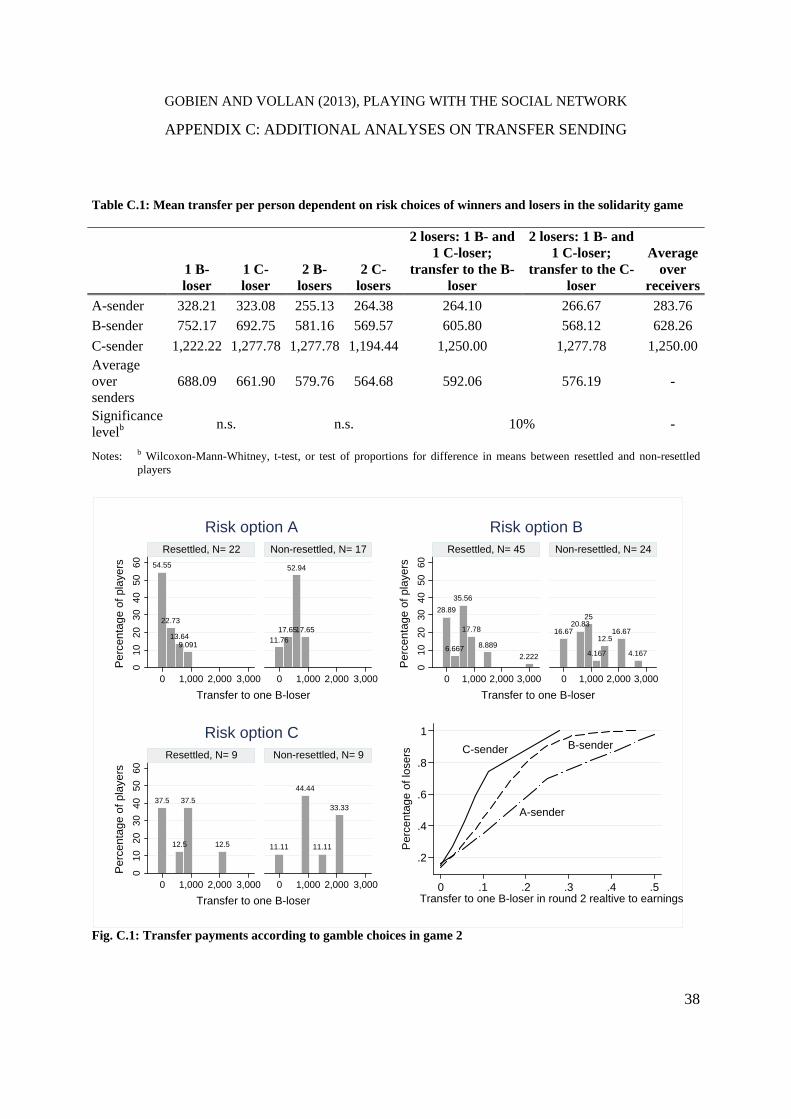
GOBIEN AND VOLLAN (2013), PLAYING WITH THE SOCIAL NETWORK
38
APPENDIX C: ADDITIONAL ANALYSES ON TRANSFER SENDING
Table C.1: Mean transfer per person dependent on risk choices of winners and losers in the solidarity game
1 B-loser
1 C-loser
2 B-losers
2 C-losers
2 losers: 1 B- and 1 C-loser;
transfer to the B-loser
2 losers: 1 B- and 1 C-loser;
transfer to the C-loser
Average over
receivers
A-sender 328.21 323.08 255.13 264.38 264.10 266.67 283.76 B-sender 752.17 692.75 581.16 569.57 605.80 568.12 628.26 C-sender 1,222.22 1,277.78 1,277.78 1,194.44 1,250.00 1,277.78 1,250.00Average over senders
688.09 661.90 579.76 564.68 592.06 576.19 -
Significance levelb n.s. n.s. 10% -
Notes: b Wilcoxon-Mann-Whitney, t-test, or test of proportions for difference in means between resettled and non-resettled players
Fig. C.1: Transfer payments according to gamble choices in game 2
54.55
22.73
13.649.091
11.7617.65
52.94
17.65
01
02
03
04
05
06
0
0 1,000 2,000 3,000 0 1,000 2,000 3,000
Resettled, N= 22 Non-resettled, N= 17
Pe
rce
nta
ge
of
pla
yers
Transfer to one B-loser
Risk option A
28.89
6.667
35.56
17.78
8.889
2.222
16.6720.83
25
4.167
12.516.67
4.167
01
02
03
04
05
06
0
0 1,000 2,000 3,000 0 1,000 2,000 3,000
Resettled, N= 45 Non-resettled, N= 24
Pe
rce
nta
ge
of
pla
yers
Transfer to one B-loser
Risk option B
37.5
12.5
37.5
12.5 11.11
44.44
11.11
33.33
01
02
03
04
05
06
0
0 1,000 2,000 3,000 0 1,000 2,000 3,000
Resettled, N= 9 Non-resettled, N= 9
Pe
rce
nta
ge
of
pla
yers
Transfer to one B-loser
Risk option CC-sender B-sender
A-sender
.2
.4
.6
.8
1
Pe
rce
nta
ge
of
lose
rs
0 .1 .2 .3 .4 .5Transfer to one B-loser in round 2 realtive to earnings
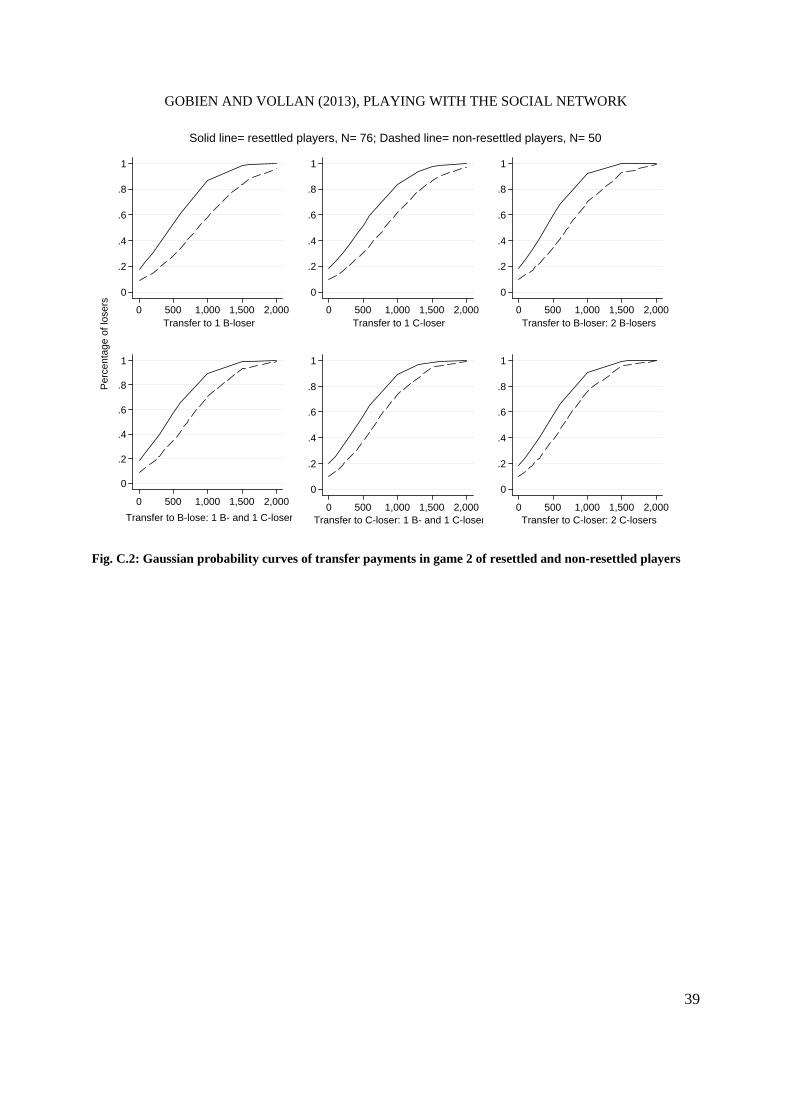
GOBIEN AND VOLLAN (2013), PLAYING WITH THE SOCIAL NETWORK
39
Fig. C.2: Gaussian probability curves of transfer payments in game 2 of resettled and non-resettled players
0
.2
.4
.6
.8
1
0 500 1,000 1,500 2,000Transfer to 1 B-loser
0
.2
.4
.6
.8
1
0 500 1,000 1,500 2,000Transfer to 1 C-loser
0
.2
.4
.6
.8
1
0 500 1,000 1,500 2,000Transfer to B-loser: 2 B-losers
0
.2
.4
.6
.8
1
0 500 1,000 1,500 2,000
Transfer to B-lose: 1 B- and 1 C-loser
Per
cent
age
of lo
sers
0
.2
.4
.6
.8
1
0 500 1,000 1,500 2,000Transfer to C-loser: 1 B- and 1 C-loser
0
.2
.4
.6
.8
1
0 500 1,000 1,500 2,000Transfer to C-loser: 2 C-losers
Solid line= resettled players, N= 76; Dashed line= non-resettled players, N= 50
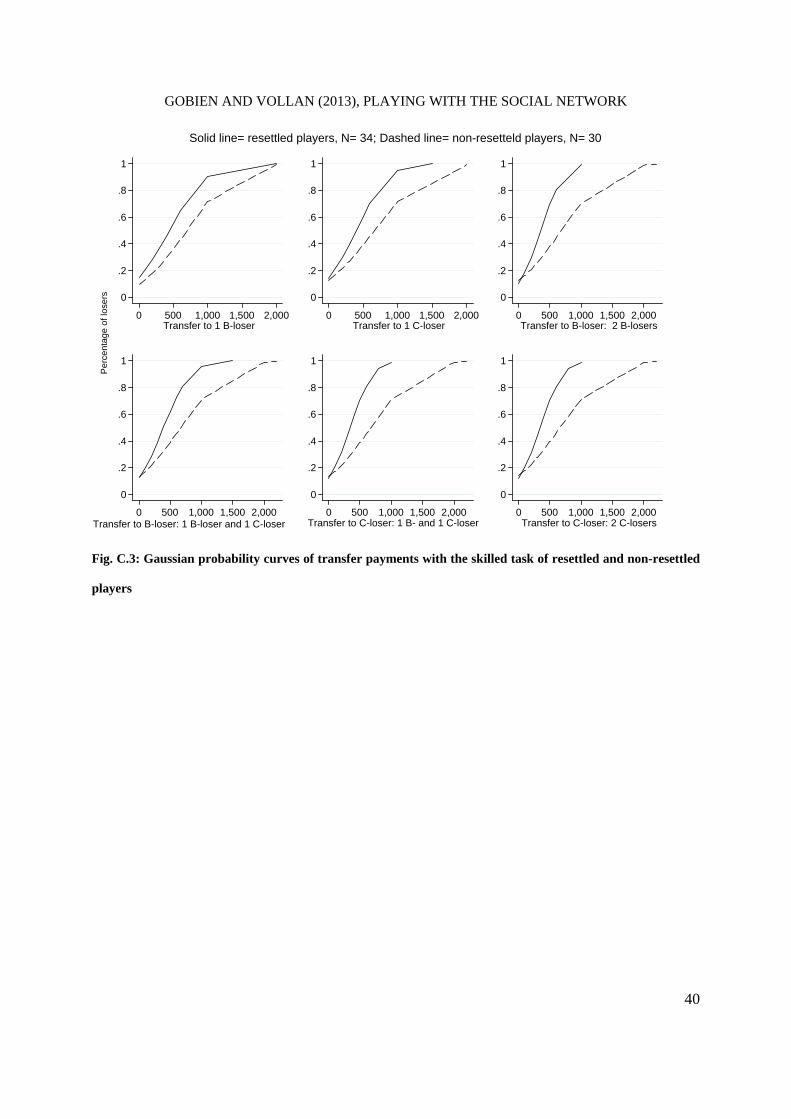
GOBIEN AND VOLLAN (2013), PLAYING WITH THE SOCIAL NETWORK
40
Fig. C.3: Gaussian probability curves of transfer payments with the skilled task of resettled and non-resettled
players
0
.2
.4
.6
.8
1
0 500 1,000 1,500 2,000Transfer to 1 B-loser
0
.2
.4
.6
.8
1
0 500 1,000 1,500 2,000Transfer to 1 C-loser
0
.2
.4
.6
.8
1
0 500 1,000 1,500 2,000Transfer to B-loser: 2 B-losers
0
.2
.4
.6
.8
1
0 500 1,000 1,500 2,000Transfer to B-loser: 1 B-loser and 1 C-loser
0
.2
.4
.6
.8
1
0 500 1,000 1,500 2,000Transfer to C-loser: 1 B- and 1 C-loser
0
.2
.4
.6
.8
1
0 500 1,000 1,500 2,000Transfer to C-loser: 2 C-losers
Solid line= resettled players, N= 34; Dashed line= non-resetteld players, N= 30
Pe
rce
nta
ge
of l
ose
rs
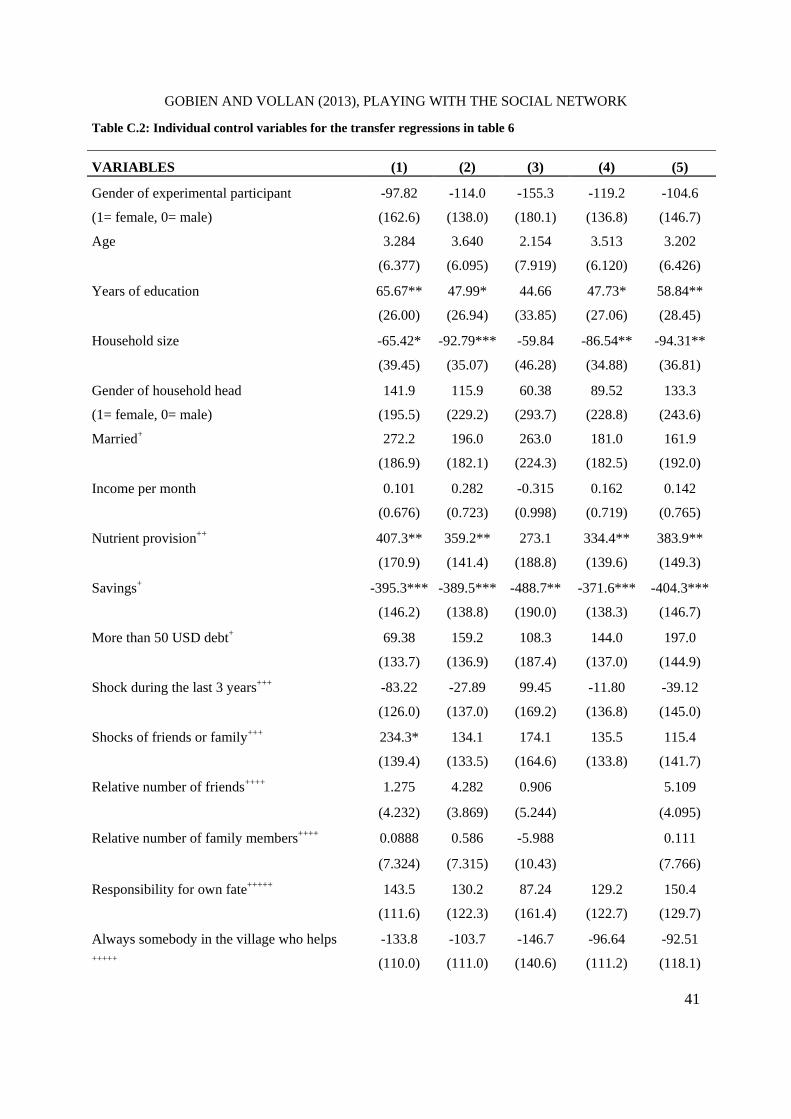
GOBIEN AND VOLLAN (2013), PLAYING WITH THE SOCIAL NETWORK
41
Table C.2: Individual control variables for the transfer regressions in table 6
VARIABLES (1) (2) (3) (4) (5)
Gender of experimental participant -97.82 -114.0 -155.3 -119.2 -104.6
(1= female, 0= male) (162.6) (138.0) (180.1) (136.8) (146.7)
Age 3.284 3.640 2.154 3.513 3.202
(6.377) (6.095) (7.919) (6.120) (6.426)
Years of education 65.67** 47.99* 44.66 47.73* 58.84**
(26.00) (26.94) (33.85) (27.06) (28.45)
Household size -65.42* -92.79*** -59.84 -86.54** -94.31**
(39.45) (35.07) (46.28) (34.88) (36.81)
Gender of household head 141.9 115.9 60.38 89.52 133.3
(1= female, 0= male) (195.5) (229.2) (293.7) (228.8) (243.6)
Married+ 272.2 196.0 263.0 181.0 161.9
(186.9) (182.1) (224.3) (182.5) (192.0)
Income per month 0.101 0.282 -0.315 0.162 0.142
(0.676) (0.723) (0.998) (0.719) (0.765)
Nutrient provision++ 407.3** 359.2** 273.1 334.4** 383.9**
(170.9) (141.4) (188.8) (139.6) (149.3)
Savings+ -395.3*** -389.5*** -488.7** -371.6*** -404.3***
(146.2) (138.8) (190.0) (138.3) (146.7)
More than 50 USD debt+ 69.38 159.2 108.3 144.0 197.0
(133.7) (136.9) (187.4) (137.0) (144.9)
Shock during the last 3 years+++ -83.22 -27.89 99.45 -11.80 -39.12
(126.0) (137.0) (169.2) (136.8) (145.0)
Shocks of friends or family+++ 234.3* 134.1 174.1 135.5 115.4
(139.4) (133.5) (164.6) (133.8) (141.7)
Relative number of friends++++ 1.275 4.282 0.906 5.109
(4.232) (3.869) (5.244) (4.095)
Relative number of family members++++
0.0888 0.586 -5.988 0.111
(7.324) (7.315) (10.43) (7.766)
Responsibility for own fate+++++ 143.5 130.2 87.24 129.2 150.4
(111.6) (122.3) (161.4) (122.7) (129.7)
Always somebody in the village who helps -133.8 -103.7 -146.7 -96.64 -92.51+++++ (110.0) (111.0) (140.6) (111.2) (118.1)
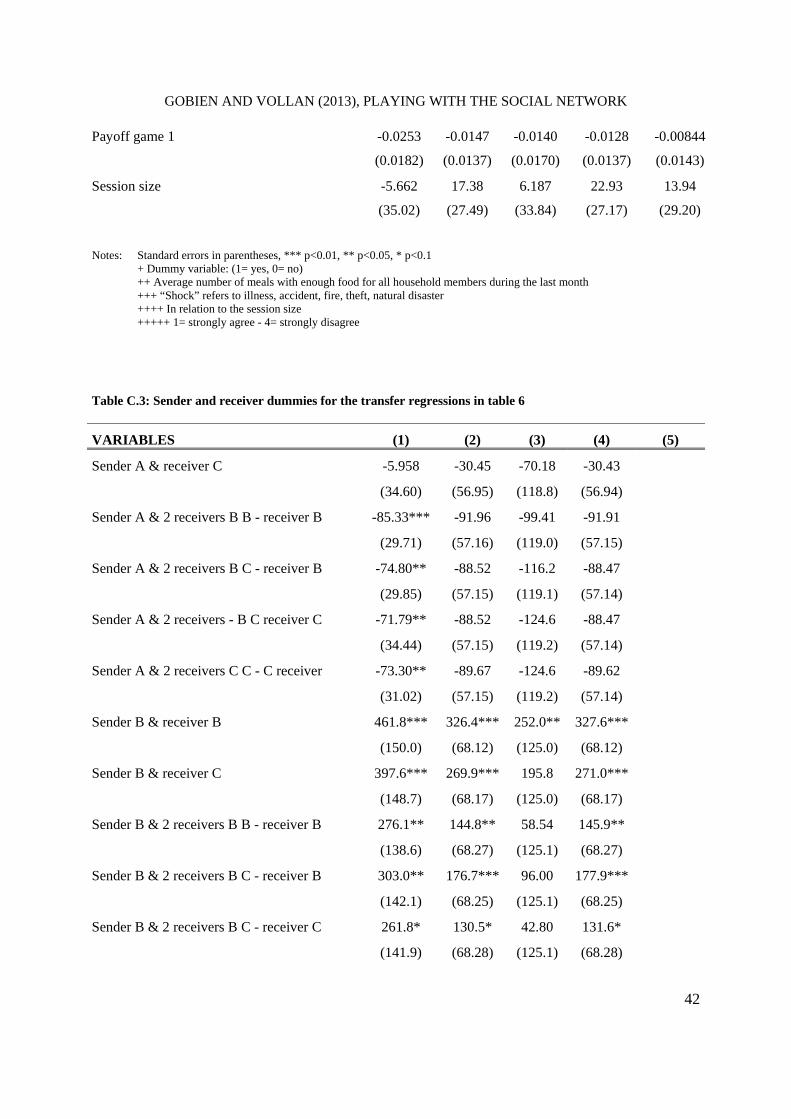
GOBIEN AND VOLLAN (2013), PLAYING WITH THE SOCIAL NETWORK
42
Payoff game 1 -0.0253 -0.0147 -0.0140 -0.0128 -0.00844
(0.0182) (0.0137) (0.0170) (0.0137) (0.0143)
Session size -5.662 17.38 6.187 22.93 13.94
(35.02) (27.49) (33.84) (27.17) (29.20)
Notes: Standard errors in parentheses, *** p<0.01, ** p<0.05, * p<0.1 + Dummy variable: (1= yes, 0= no) ++ Average number of meals with enough food for all household members during the last month +++ “Shock” refers to illness, accident, fire, theft, natural disaster ++++ In relation to the session size +++++ 1= strongly agree - 4= strongly disagree
Table C.3: Sender and receiver dummies for the transfer regressions in table 6
VARIABLES (1) (2) (3) (4) (5)
Sender A & receiver C -5.958 -30.45 -70.18 -30.43
(34.60) (56.95) (118.8) (56.94)
Sender A & 2 receivers B B - receiver B -85.33*** -91.96 -99.41 -91.91
(29.71) (57.16) (119.0) (57.15)
Sender A & 2 receivers B C - receiver B -74.80** -88.52 -116.2 -88.47
(29.85) (57.15) (119.1) (57.14)
Sender A & 2 receivers - B C receiver C -71.79** -88.52 -124.6 -88.47
(34.44) (57.15) (119.2) (57.14)
Sender A & 2 receivers C C - C receiver -73.30** -89.67 -124.6 -89.62
(31.02) (57.15) (119.2) (57.14)
Sender B & receiver B 461.8*** 326.4*** 252.0** 327.6***
(150.0) (68.12) (125.0) (68.12)
Sender B & receiver C 397.6*** 269.9*** 195.8 271.0***
(148.7) (68.17) (125.0) (68.17)
Sender B & 2 receivers B B - receiver B 276.1** 144.8** 58.54 145.9**
(138.6) (68.27) (125.1) (68.27)
Sender B & 2 receivers B C - receiver B 303.0** 176.7*** 96.00 177.9***
(142.1) (68.25) (125.1) (68.25)
Sender B & 2 receivers B C - receiver C 261.8* 130.5* 42.80 131.6*
(141.9) (68.28) (125.1) (68.28)
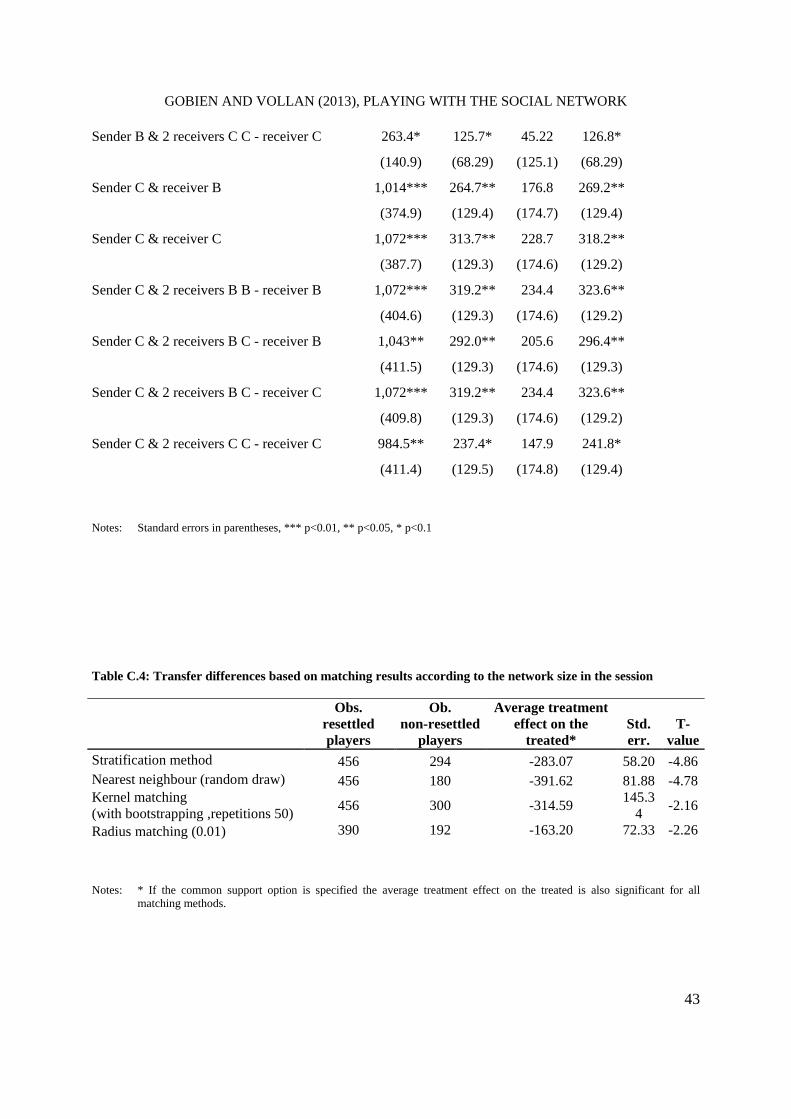
GOBIEN AND VOLLAN (2013), PLAYING WITH THE SOCIAL NETWORK
43
Sender B & 2 receivers C C - receiver C 263.4* 125.7* 45.22 126.8*
(140.9) (68.29) (125.1) (68.29)
Sender C & receiver B 1,014*** 264.7** 176.8 269.2**
(374.9) (129.4) (174.7) (129.4)
Sender C & receiver C 1,072*** 313.7** 228.7 318.2**
(387.7) (129.3) (174.6) (129.2)
Sender C & 2 receivers B B - receiver B 1,072*** 319.2** 234.4 323.6**
(404.6) (129.3) (174.6) (129.2)
Sender C & 2 receivers B C - receiver B 1,043** 292.0** 205.6 296.4**
(411.5) (129.3) (174.6) (129.3)
Sender C & 2 receivers B C - receiver C 1,072*** 319.2** 234.4 323.6**
(409.8) (129.3) (174.6) (129.2)
Sender C & 2 receivers C C - receiver C 984.5** 237.4* 147.9 241.8*
(411.4) (129.5) (174.8) (129.4)
Notes: Standard errors in parentheses, *** p<0.01, ** p<0.05, * p<0.1
Table C.4: Transfer differences based on matching results according to the network size in the session
Obs. resettled players
Ob. non-resettled
players
Average treatment effect on the
treated* Std. err.
T-value
Stratification method 456 294 -283.07 58.20 -4.86Nearest neighbour (random draw) 456 180 -391.62 81.88 -4.78Kernel matching (with bootstrapping ,repetitions 50) 456 300 -314.59 145.3
4 -2.16
Radius matching (0.01) 390 192 -163.20 72.33 -2.26
Notes: * If the common support option is specified the average treatment effect on the treated is also significant for all matching methods.