Embed Size (px)
Citation preview

Cost Analysis
Dr Rakesh Kumar
Moderator- Dr PR Deshmukh
Framework
Introduction What is cost analysis and economics analysis Uses of Cost- Analysis Steps in Cost- Analysis ◦ Planning a cost analysis study◦Calculating costs ◦Measuring outcomes◦Applying cost analysis methods◦Analysis, interpretation & presentation
Strengths and limitations of cost- analysis References
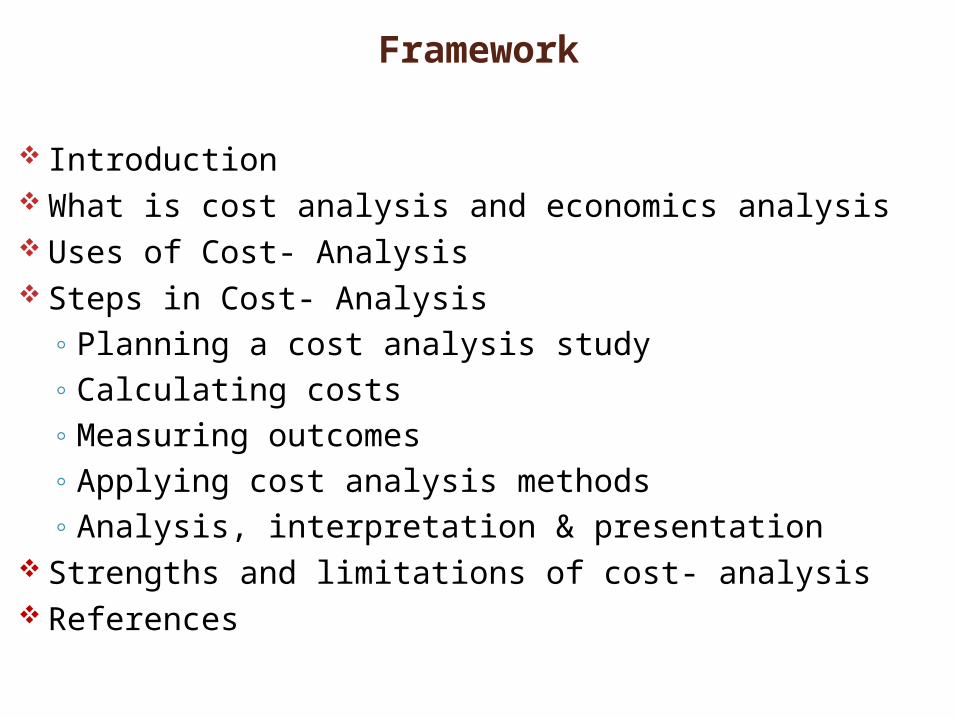
Some Questions ???
What is the average cost of providing a service?
Input category
Service type or activity
Facility or location
Distribution of costs
1. What has been expenditure and revenues on a project ?
2. What are the trend?
3. Does expenditure compares with the budget?
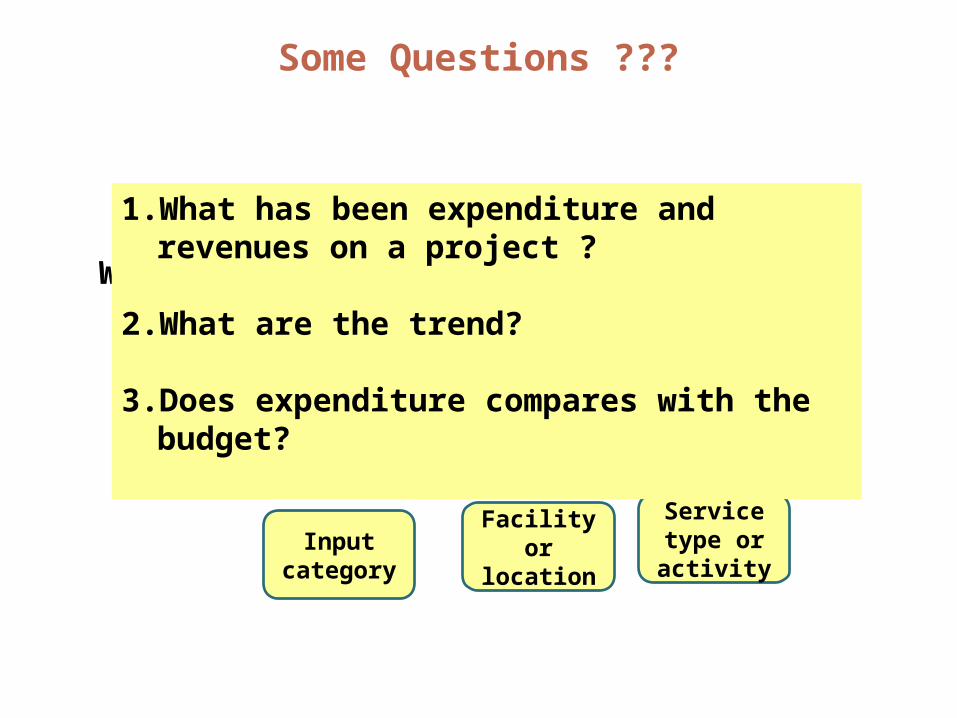
What is Cost Analysis
Definition:- • It is the element-by-element examination of the expenditure to
determine how resources have been spent.
A critical process needed to solve management problems
Helps to understand how funds have been used
Guides in optimal utilization of scarce resources
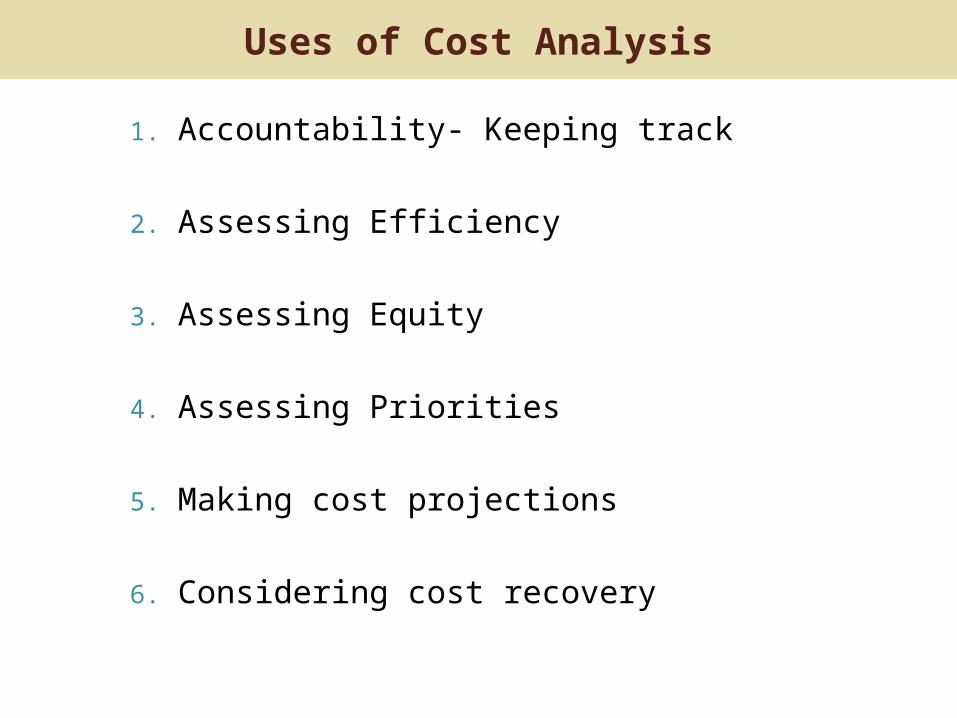
Uses of Cost Analysis
1. Accountability- Keeping track
2. Assessing Efficiency
3. Assessing Equity
4. Assessing Priorities
5. Making cost projections
6. Considering cost recovery
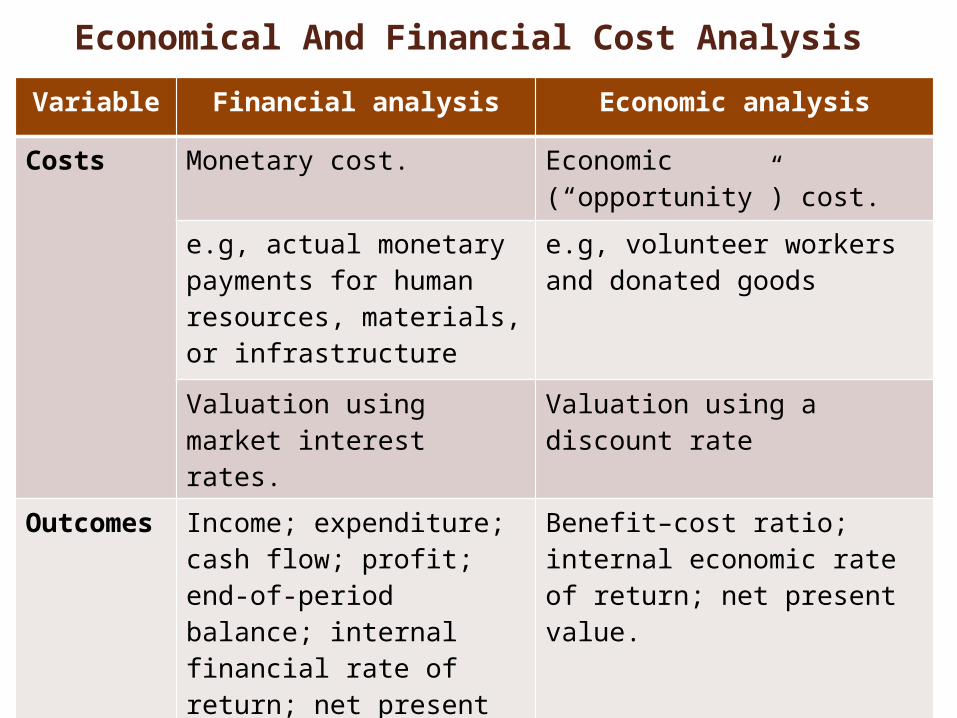
Economical And Financial Cost Analysis
Variable Financial analysis Economic analysis
Costs Monetary cost. Economic (“opportunity”) cost.
e.g, actual monetary payments for human resources, materials, or infrastructure
e.g, volunteer workers and donated goods
Valuation using market interest rates.
Valuation using a discount rate
Outcomes Income; expenditure; cash flow; profit; end-of-period balance; internal financial rate of return; net present financial value.
Benefit–cost ratio; internal economic rate of return; net present value.
Financial consequences Resource consequences
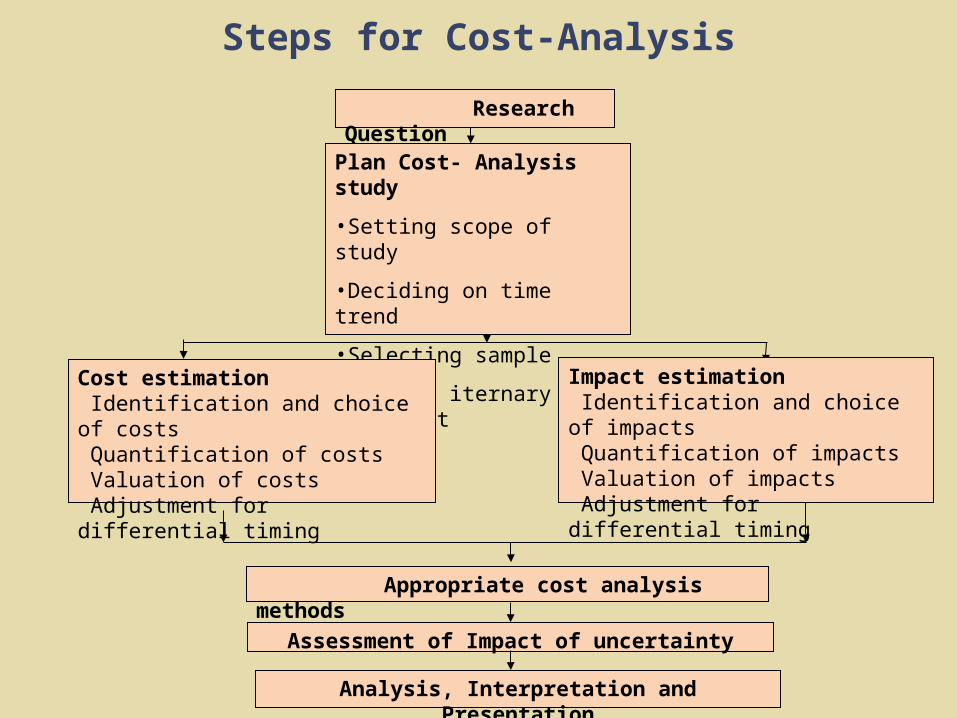
Steps for Cost-Analysis
Research Question
Plan Cost- Analysis study
•Setting scope of study
•Deciding on time trend
•Selecting sample
•Drawing iternary & checklist
Cost estimation Identification and choice of costs Quantification of costs Valuation of costs Adjustment for differential timing
Appropriate cost analysis methods
Analysis, Interpretation and Presentation
Assessment of Impact of uncertainty
Impact estimation Identification and choice of impacts Quantification of impacts Valuation of impacts Adjustment for differential timing
Planning Cost- Analysis Study
Setting scope of study
Deciding on time trend
Selecting sample
Drawing iternary & checklist
Cost- Estimation
Identification of main costs and their sources
Quantification of costs
Valuation of costs and discounting.
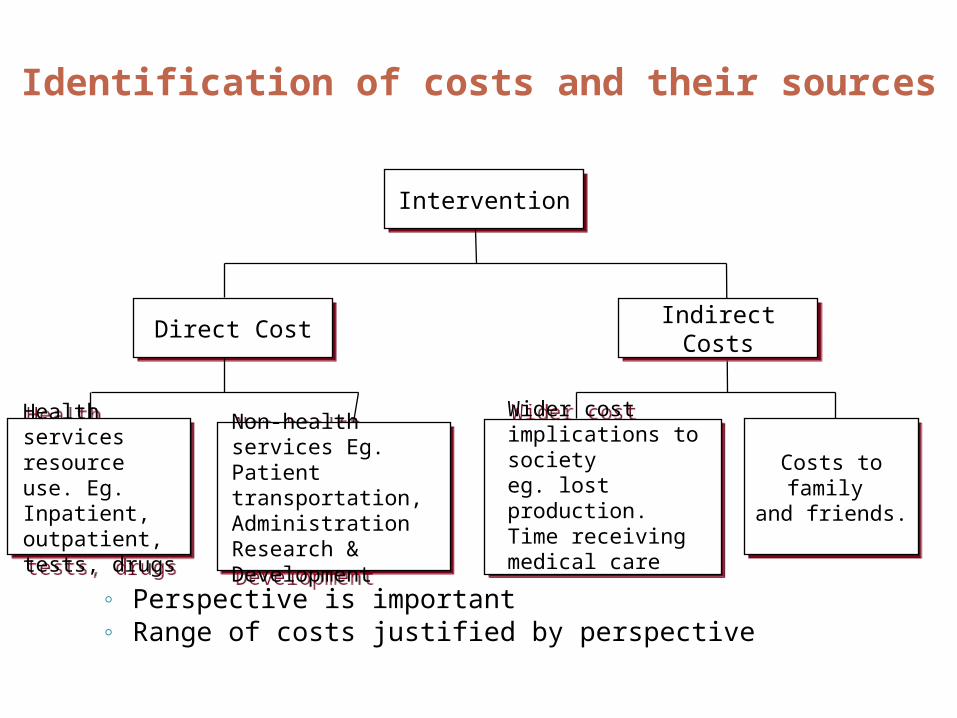
Identification of costs and their sources
InterventionIntervention
Direct CostDirect Cost Indirect CostsIndirect Costs
Wider cost implications to society eg. lost production.Time receiving medical care
Wider cost implications to society eg. lost production.Time receiving medical care
Non-health services Eg. Patient transportation, AdministrationResearch & Development
Non-health services Eg. Patient transportation, AdministrationResearch & Development
Health services resource use. Eg. Inpatient, outpatient, tests, drugs
Health services resource use. Eg. Inpatient, outpatient, tests, drugs
Costs to family and friends.
Costs to family and friends.
◦ Perspective is important◦ Range of costs justified by perspective
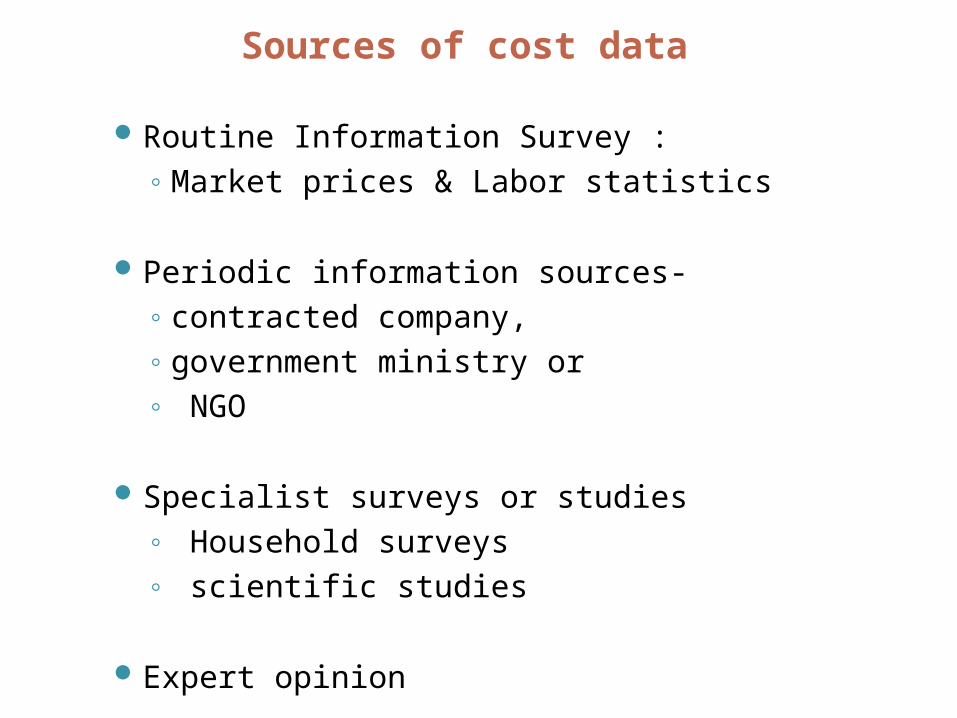
Sources of cost data
Routine Information Survey :◦Market prices & Labor statistics
Periodic information sources- ◦ contracted company, ◦ government ministry or◦ NGO
Specialist surveys or studies ◦ Household surveys ◦ scientific studies
Expert opinion
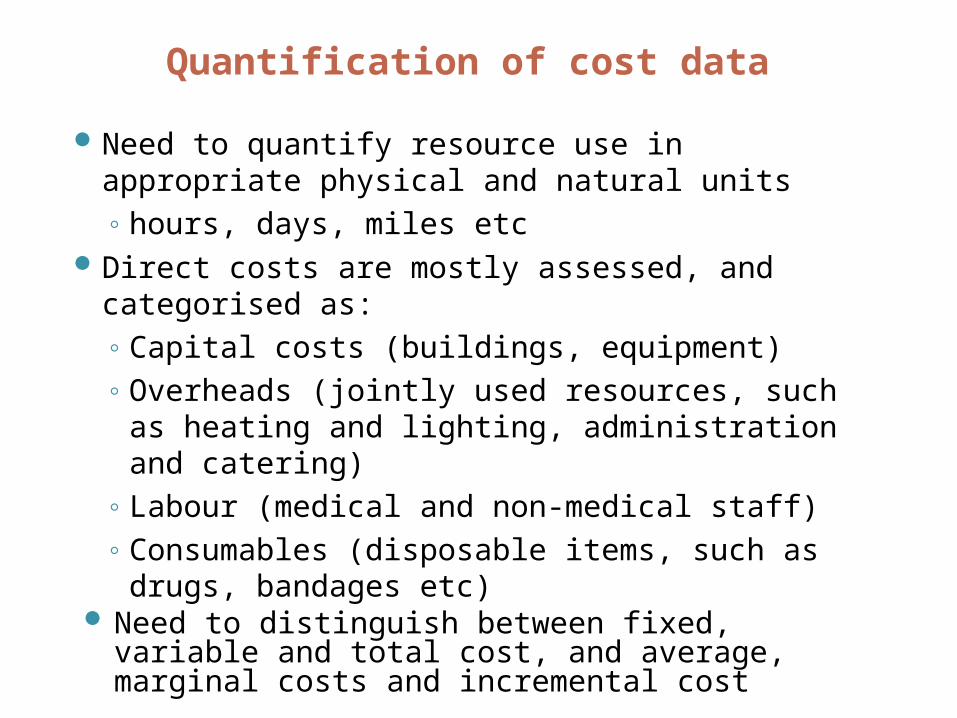
Quantification of cost data
Need to quantify resource use in appropriate physical and natural units◦ hours, days, miles etc
Direct costs are mostly assessed, and categorised as:◦Capital costs (buildings, equipment)◦Overheads (jointly used resources, such as heating and
lighting, administration and catering)◦ Labour (medical and non-medical staff)◦Consumables (disposable items, such as drugs, bandages
etc) Need to distinguish between fixed, variable and total cost,
and average, marginal costs and incremental cost
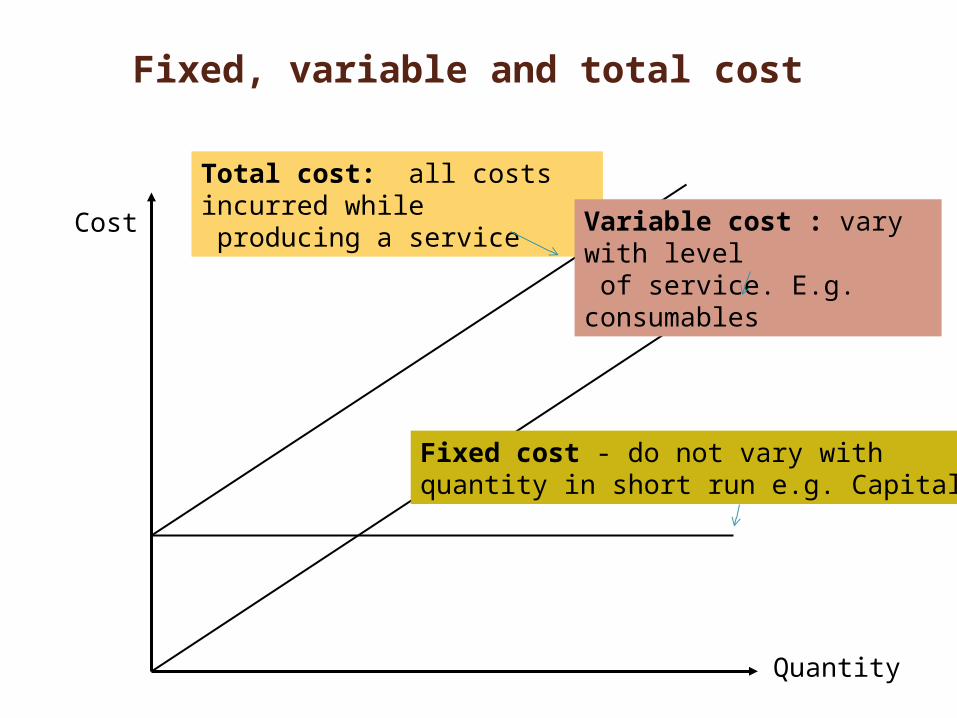
Fixed, variable and total cost
Total cost: all costs incurred while producing a service
Fixed cost - do not vary with quantity in short run e.g. Capital costs
Cost
Quantity
Variable cost : vary with level of service. E.g. consumables
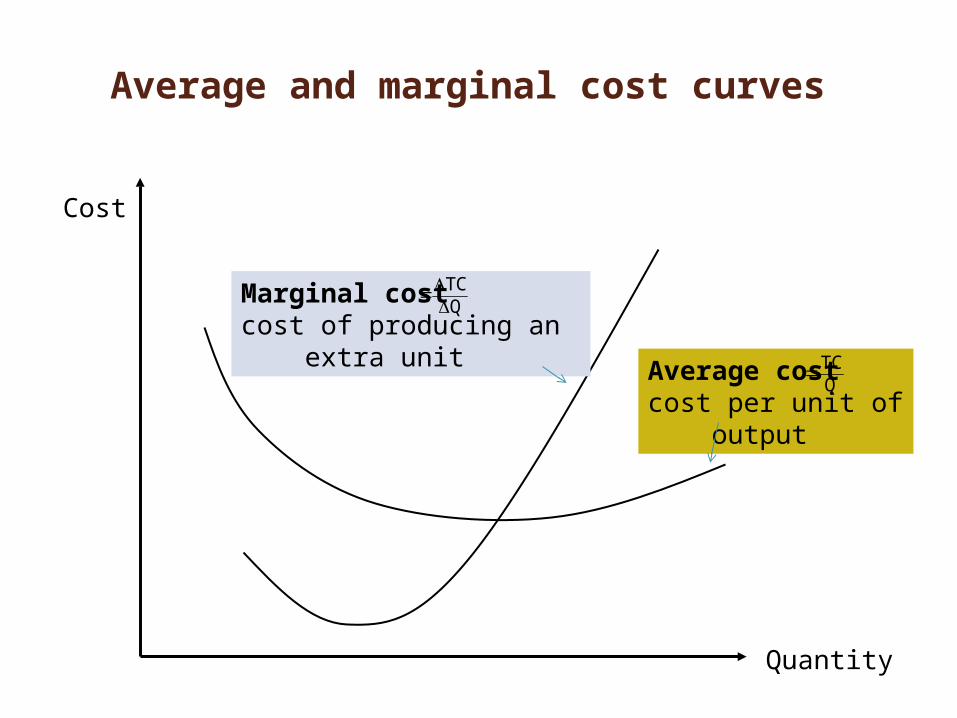
Average and marginal cost curves
Cost
Quantity
Average cost cost per unit of output
QTC
Marginal costcost of producing an extra unit
QTC
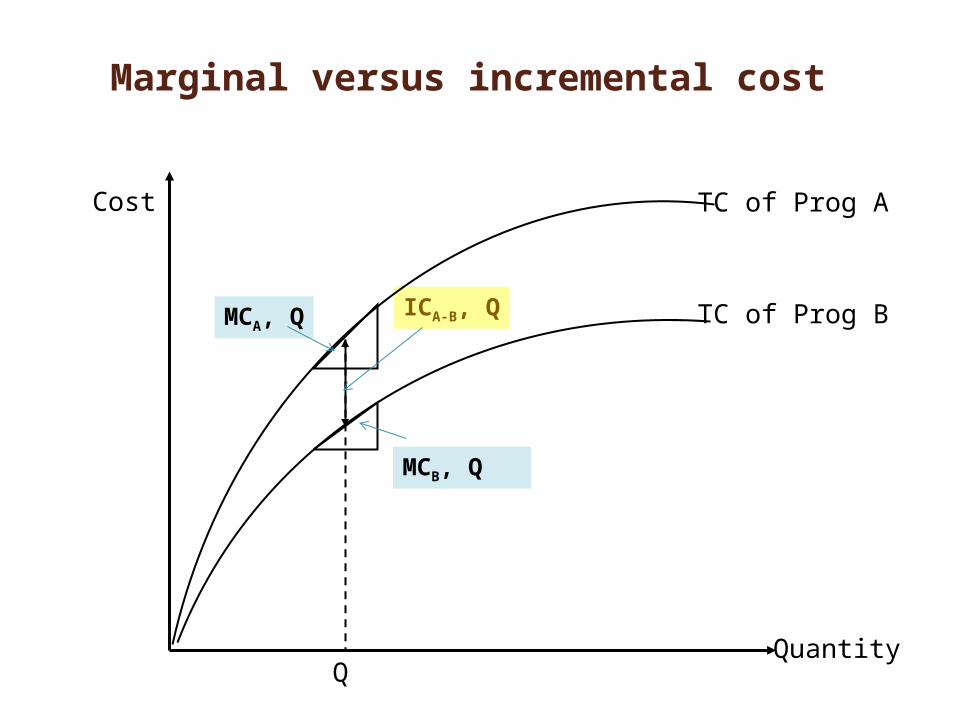
Marginal versus incremental cost
Cost
Q
MCB, Q
MCA, Q ICA-B, Q
TC of Prog A
TC of Prog B
Quantity
Discounting
To allow for differential timing of costs (and benefits) between programmes all future costs (and benefits) should be stated in terms of their present value using discount rate
Prefer to have benefits now and bear costs in the future – ‘time preference’
‘Rate’ of time preference is termed ‘discount rate’
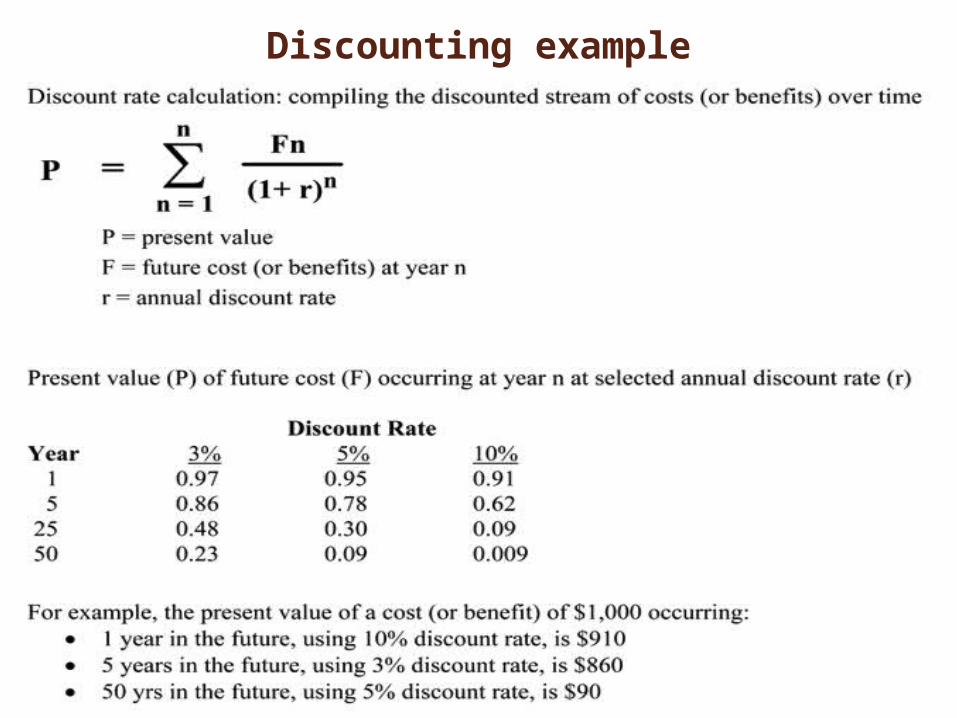
Discounting example
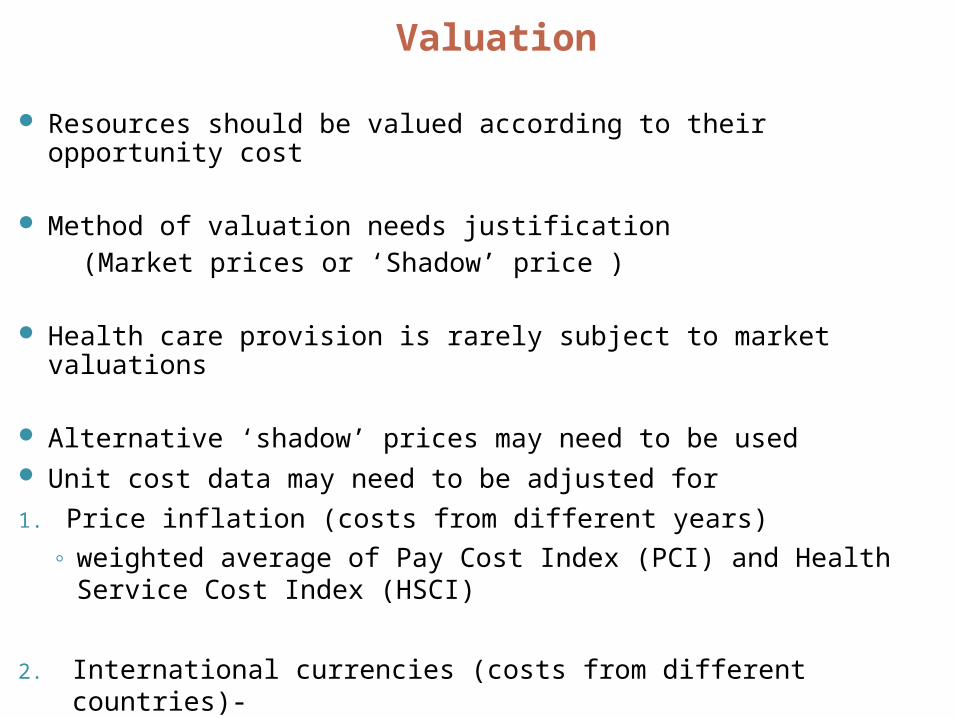
Valuation
Resources should be valued according to their opportunity cost
Method of valuation needs justification (Market prices or ‘Shadow’ price )
Health care provision is rarely subject to market valuations
Alternative ‘shadow’ prices may need to be used Unit cost data may need to be adjusted for
1. Price inflation (costs from different years)
◦ weighted average of Pay Cost Index (PCI) and Health Service Cost Index (HSCI)
2. International currencies (costs from different countries)- ◦ Purchasing Power Parities (PPPs) and exchange rates◦ PPPs are more appropriate
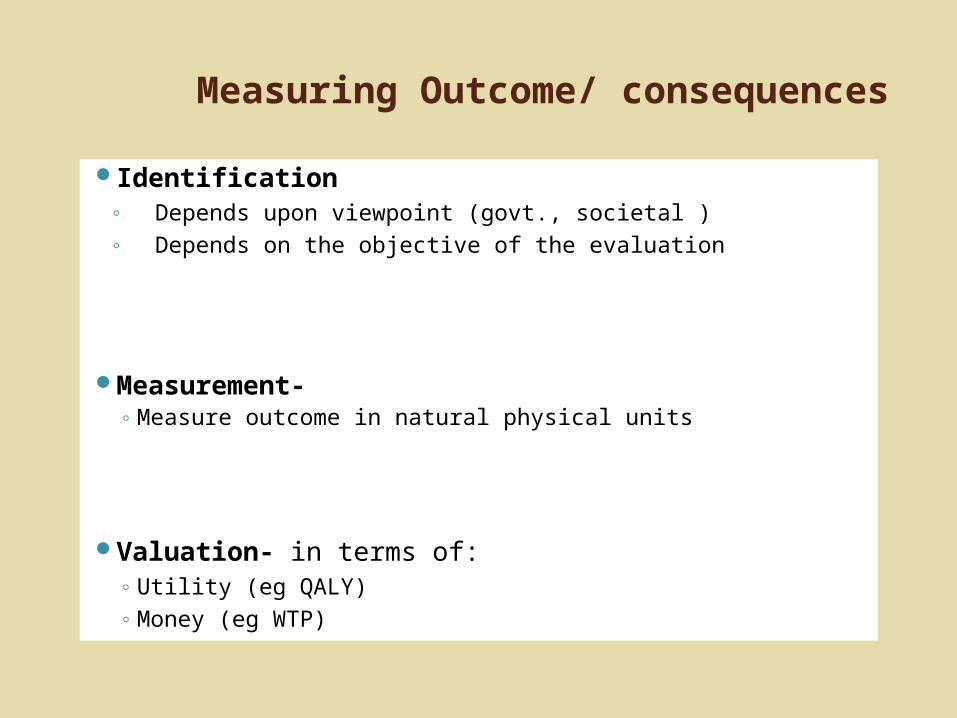
Measuring Outcome/ consequences
Identification◦ Depends upon viewpoint (govt., societal )◦ Depends on the objective of the evaluation
Measurement- ◦ Measure outcome in natural physical units
Valuation- in terms of:◦ Utility (eg QALY)◦ Money (eg WTP)
Cost Analysis Methods
1. Cost-effectiveness analysis (CEA):
2. Cost-utility analysis (CUA)
3. Cost-benefit analysis (CBA):
4. Cost-of-illness analysis:
5. Cost-minimization analysis:
6. Cost-consequence analysis:
Cost-Effectiveness Analysis
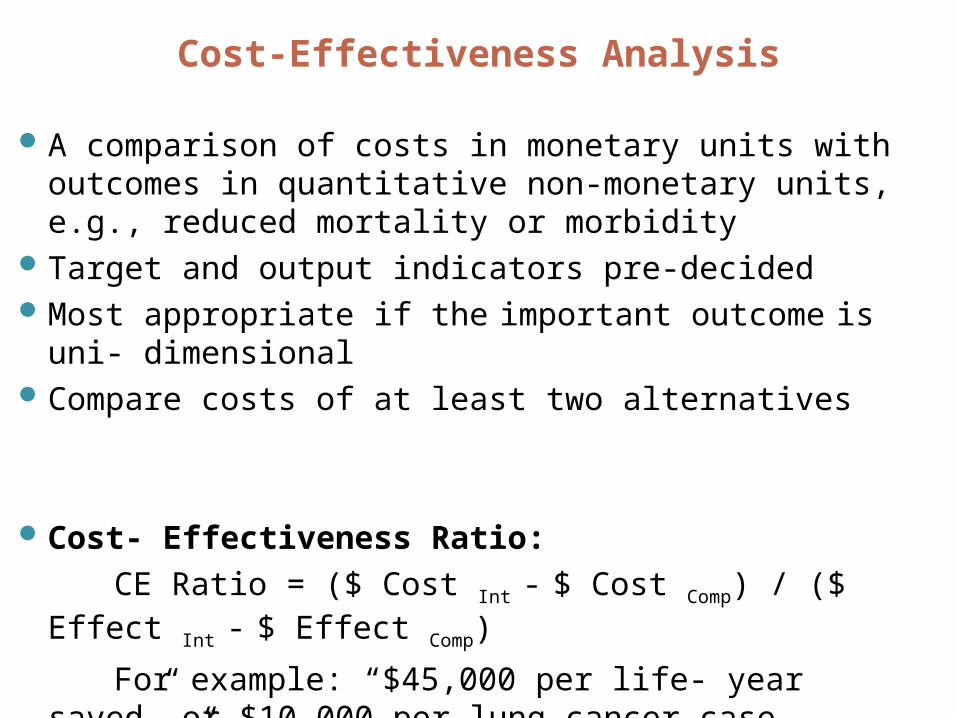
A comparison of costs in monetary units with outcomes in quantitative non-monetary units, e.g., reduced mortality or morbidity
Target and output indicators pre-decidedMost appropriate if the important outcome is uni- dimensionalCompare costs of at least two alternatives
Cost- Effectiveness Ratio:
CE Ratio = ($ Cost Int - $ Cost Comp) / ($ Effect Int - $ Effect Comp)
For example: “$45,000 per life- year saved” or $10,000 per lung cancer case averted”
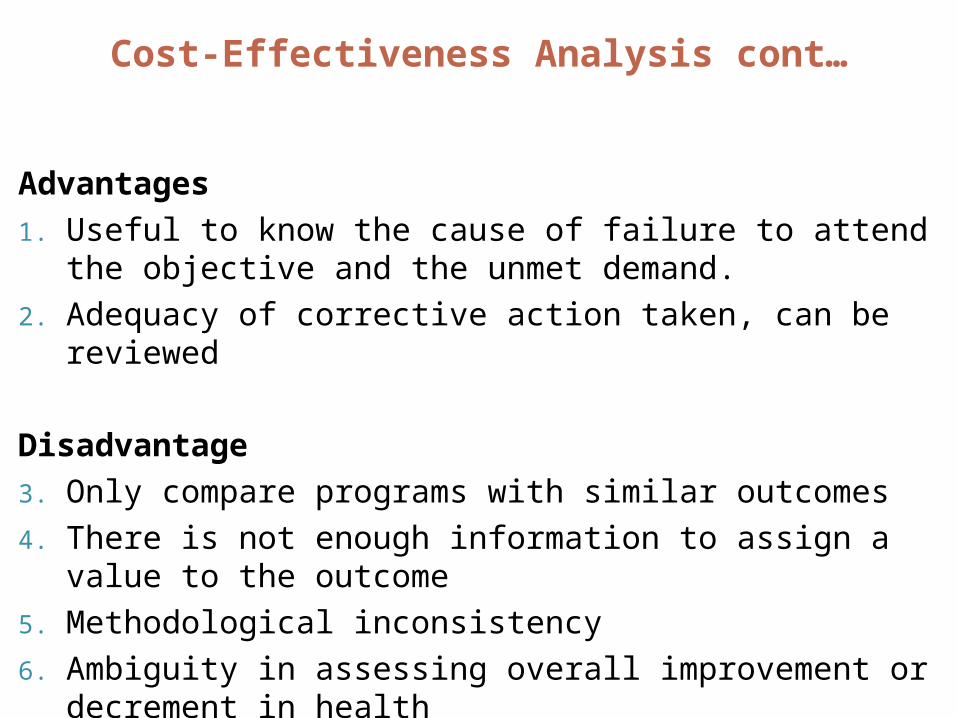
Cost-Effectiveness Analysis cont…
Advantages
1. Useful to know the cause of failure to attend the objective and the unmet demand.
2. Adequacy of corrective action taken, can be reviewed
Disadvantage
3. Only compare programs with similar outcomes
4. There is not enough information to assign a value to the outcome
5. Methodological inconsistency
6. Ambiguity in assessing overall improvement or decrement in health
7. Cannot address the issue of allocative efficiency
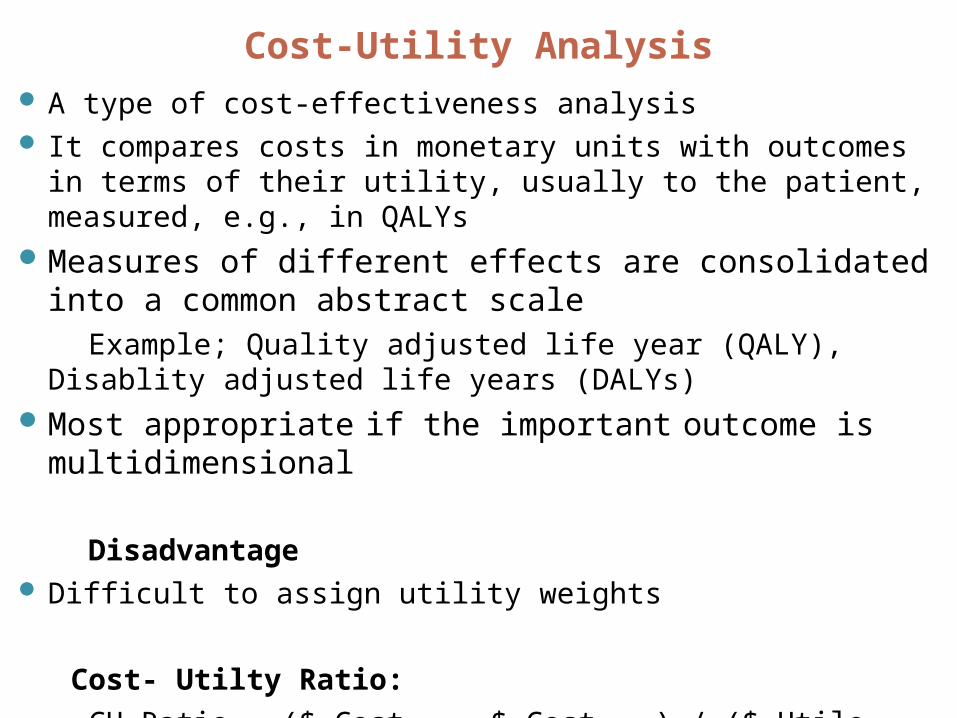
Cost-Utility Analysis A type of cost-effectiveness analysis It compares costs in monetary units with outcomes in terms of their utility,
usually to the patient, measured, e.g., in QALYs Measures of different effects are consolidated into a common abstract
scale
Example; Quality adjusted life year (QALY), Disablity adjusted life years (DALYs)
Most appropriate if the important outcome is multidimensional
Disadvantage Difficult to assign utility weights
Cost- Utilty Ratio:
CU Ratio = ($ Cost Int - $ Cost Comp) / ($ Utile Int - $ Utile Comp)
For example: “$10,000 per QALY gained”
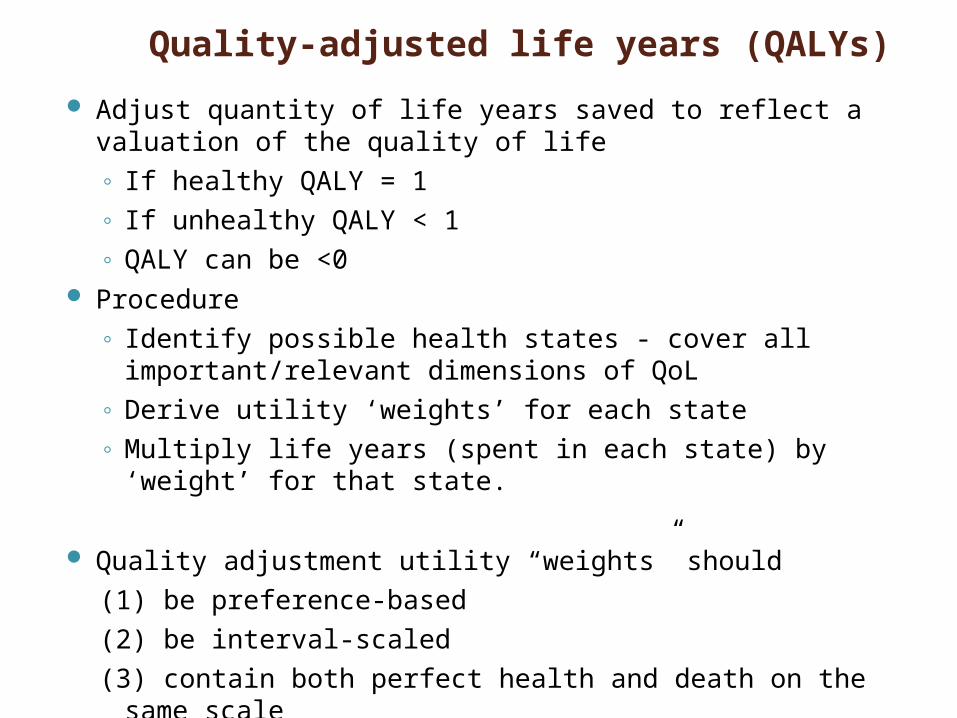
Quality-adjusted life years (QALYs)
Adjust quantity of life years saved to reflect a valuation of the quality of life
◦ If healthy QALY = 1
◦ If unhealthy QALY < 1
◦ QALY can be <0 Procedure
◦ Identify possible health states - cover all important/relevant dimensions of QoL
◦ Derive utility ‘weights’ for each state
◦ Multiply life years (spent in each state) by ‘weight’ for that state.
Quality adjustment utility “weights” should
(1) be preference-based
(2) be interval-scaled
(3) contain both perfect health and death on the same scale
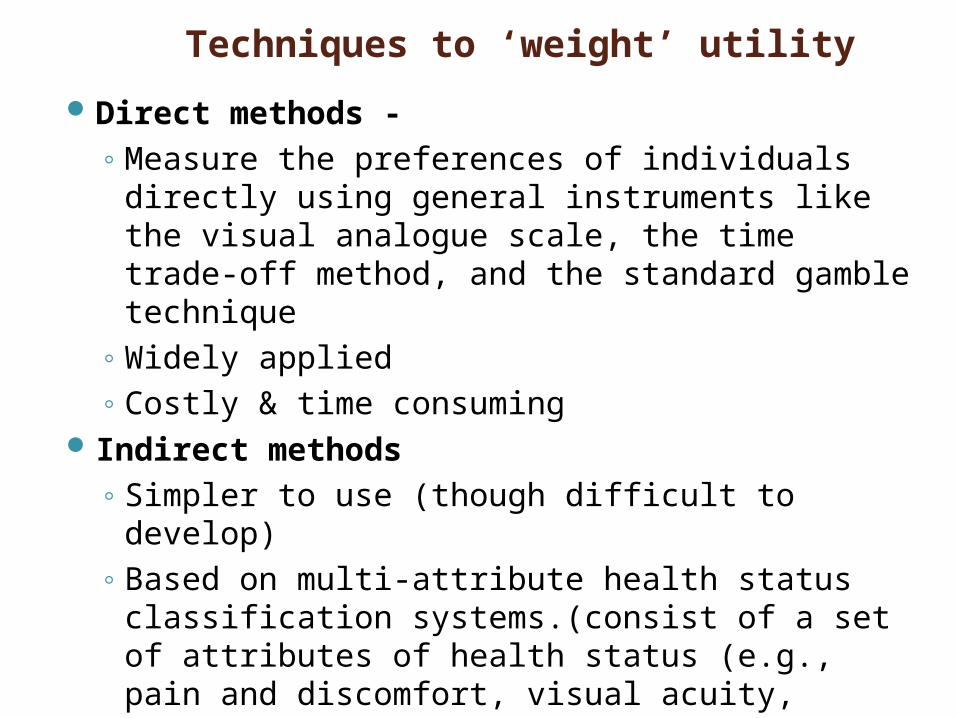
Techniques to ‘weight’ utility
Direct methods -◦Measure the preferences of individuals directly using general
instruments like the visual analogue scale, the time trade-off method, and the standard gamble technique
◦Widely applied◦Costly & time consuming
Indirect methods ◦ Simpler to use (though difficult to develop)◦Based on multi-attribute health status classification systems.
(consist of a set of attributes of health status (e.g., pain and discomfort, visual acuity, ambulation, cognitive function, etc.), and levels of function associated with each attribute from full function to impaired function (e.g. perfect vision — totally blind)
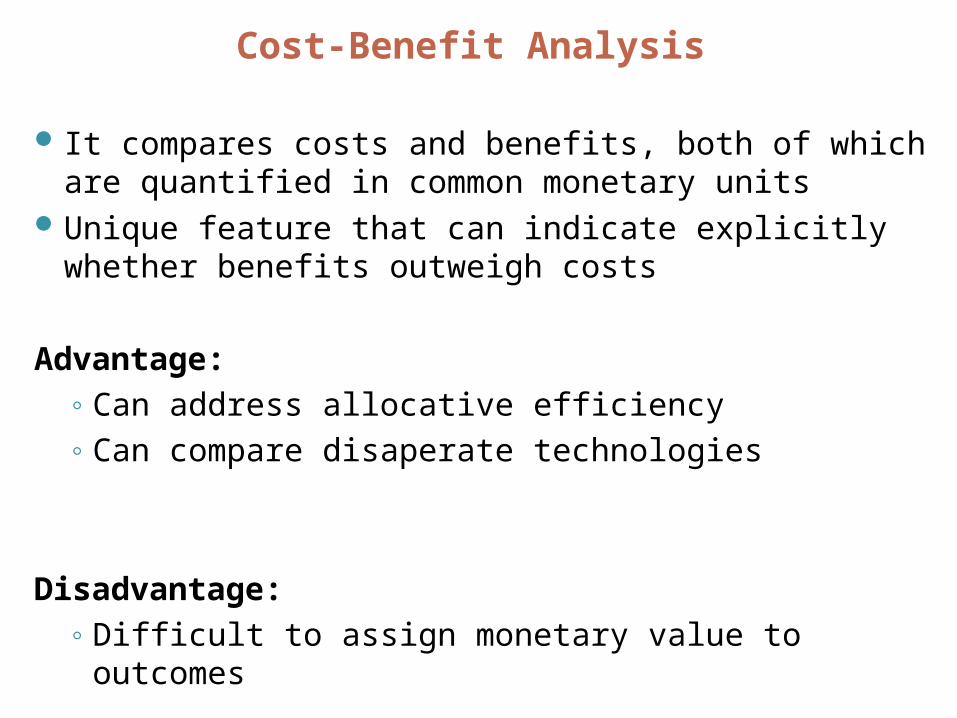
Cost-Benefit Analysis
It compares costs and benefits, both of which are quantified in common monetary units
Unique feature that can indicate explicitly whether benefits outweigh costs
Advantage: ◦Can address allocative efficiency◦Can compare disaperate technologies
Disadvantage: ◦Difficult to assign monetary value to outcomes
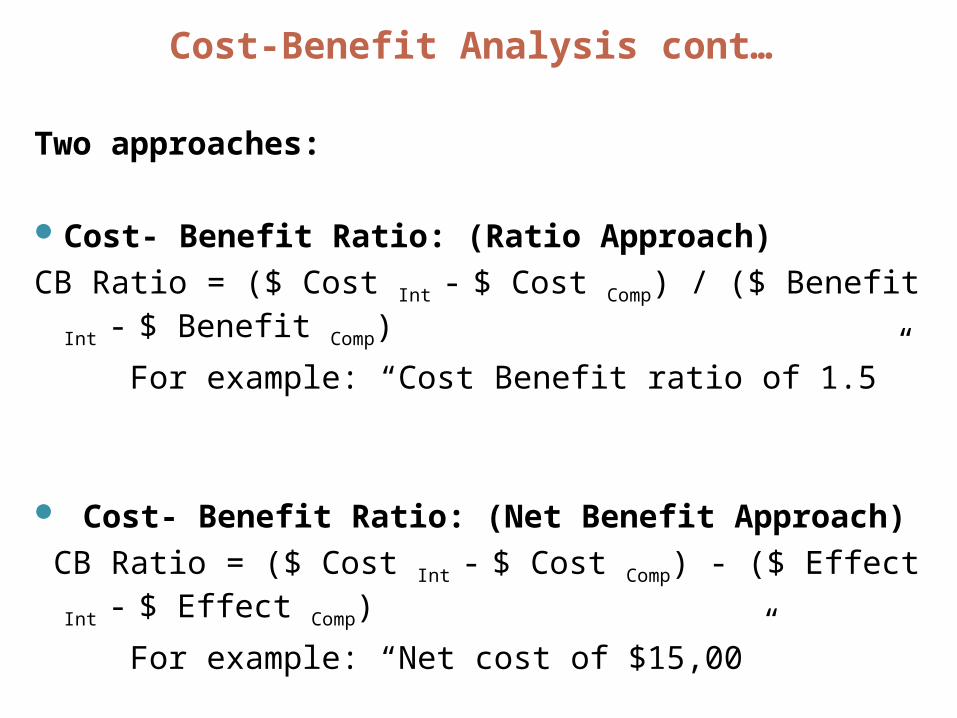
Cost-Benefit Analysis cont…
Two approaches:
Cost- Benefit Ratio: (Ratio Approach)
CB Ratio = ($ Cost Int - $ Cost Comp) / ($ Benefit Int - $ Benefit Comp)
For example: “Cost Benefit ratio of 1.5”
Cost- Benefit Ratio: (Net Benefit Approach)
CB Ratio = ($ Cost Int - $ Cost Comp) - ($ Effect Int - $ Effect Comp)
For example: “Net cost of $15,00”
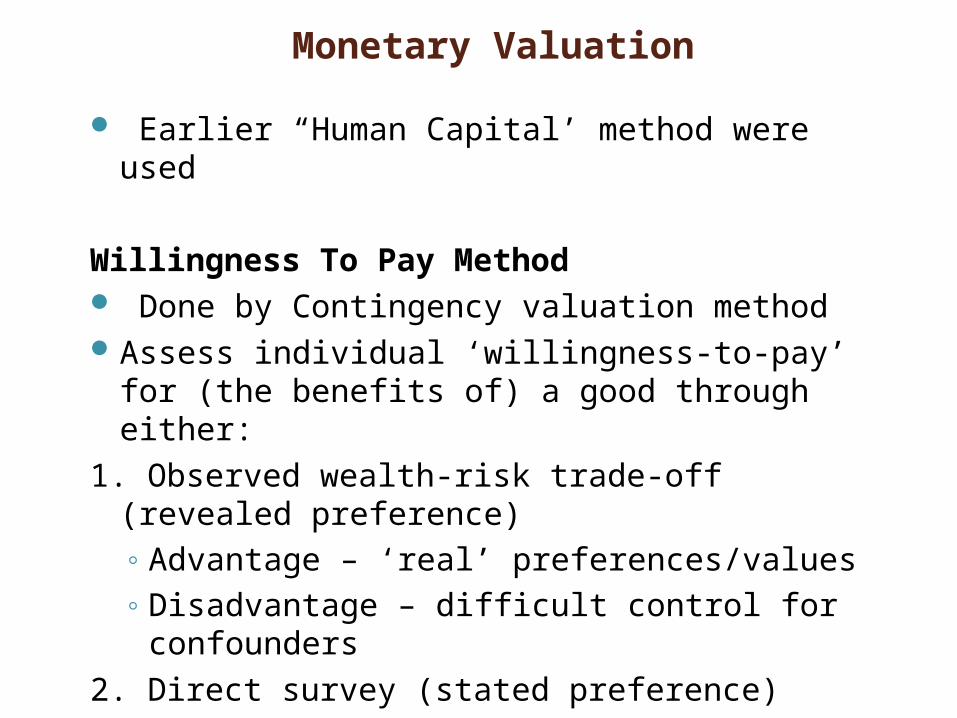
Monetary Valuation
Earlier “Human Capital’ method were used
Willingness To Pay Method Done by Contingency valuation methodAssess individual ‘willingness-to-pay’ for (the benefits of) a
good through either:
1. Observed wealth-risk trade-off (revealed preference)◦Advantage – ‘real’ preferences/values◦Disadvantage – difficult control for confounders
2. Direct survey (stated preference)◦Advantage – direct valuation of good◦Disadvantage – hypothetical/survey problems
Vast majority of CBA use direct survey
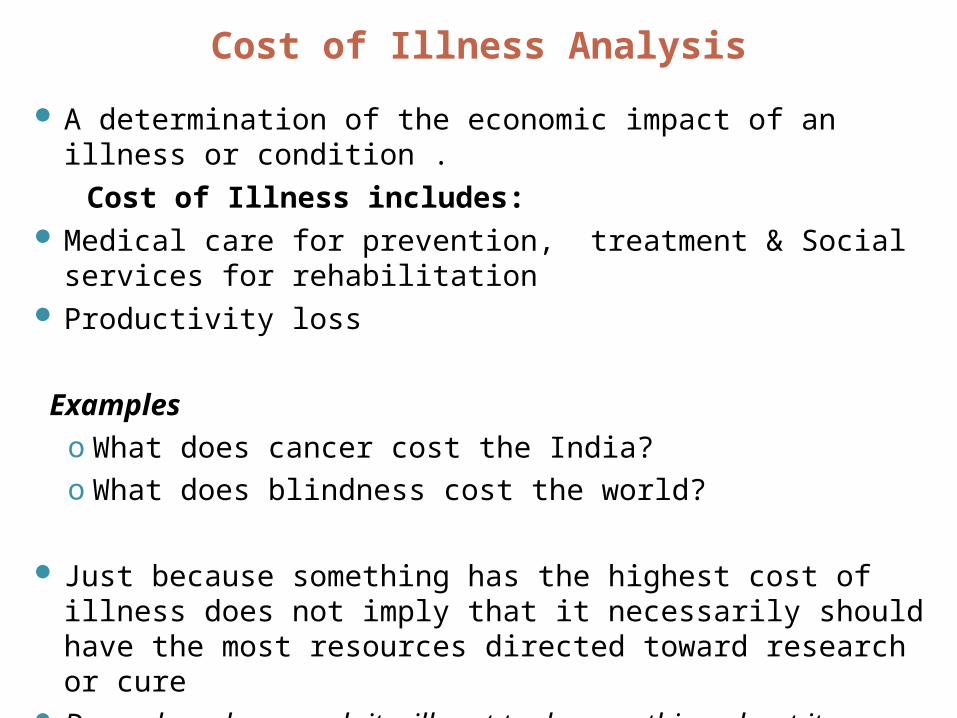
Cost of Illness Analysis
A determination of the economic impact of an illness or condition .
Cost of Illness includes: Medical care for prevention, treatment & Social services for rehabilitation Productivity loss
Exampleso What does cancer cost the India?o What does blindness cost the world?
Just because something has the highest cost of illness does not imply that it necessarily should have the most resources directed toward research or cure
Depends on how much it will cost to do something about it
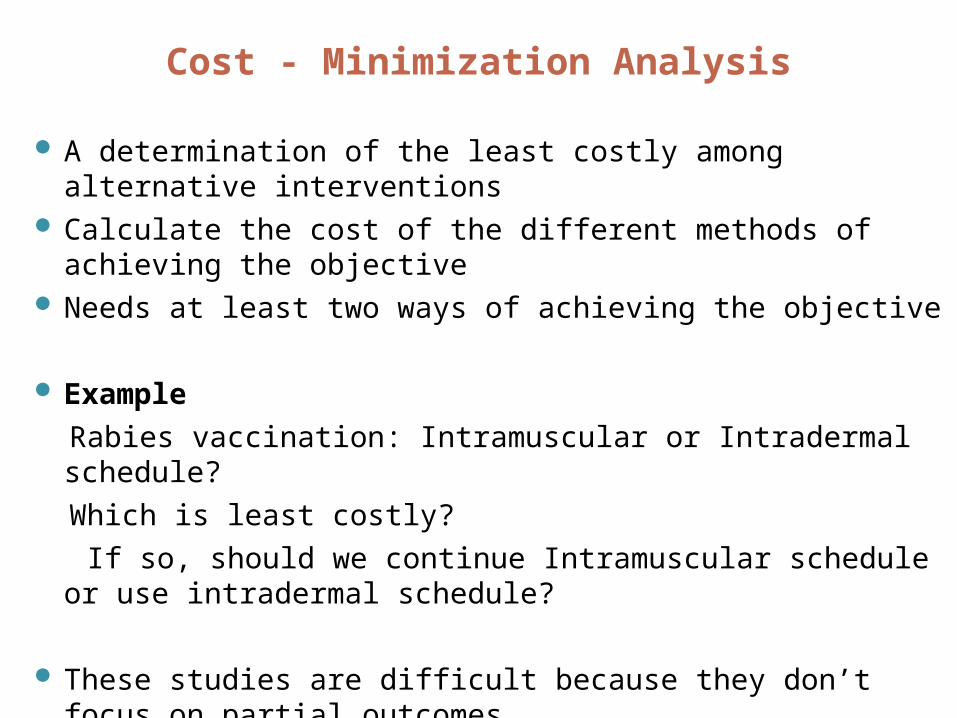
Cost - Minimization Analysis
A determination of the least costly among alternative interventions Calculate the cost of the different methods of achieving the objective Needs at least two ways of achieving the objective
Example
Rabies vaccination: Intramuscular or Intradermal schedule?
Which is least costly?
If so, should we continue Intramuscular schedule or use intradermal schedule?
These studies are difficult because they don’t focus on partial outcomes Need a high degree of certainty that outcome can be obtained or else these
studies are not particularly helpful
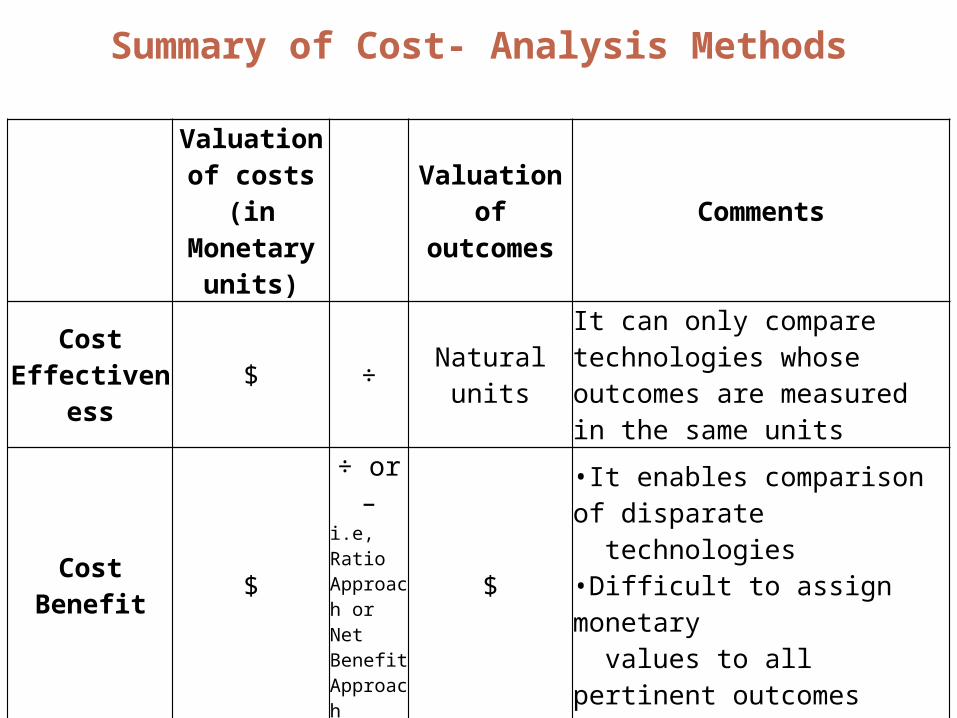
Summary of Cost- Analysis Methods
Valuation of costs
(in Monetary units)
Valuation of
outcomesComments
Cost Effectiveness
$ ÷ Natural unitsIt can only compare technologies whose outcomes are measured in the same units
Cost Benefit $
÷ or –i.e, Ratio Approach or Net Benefit Approach
$
•It enables comparison of disparate technologies•Difficult to assign monetary values to all pertinent outcomes
Cost Utility $ ÷Utilities (e.g.,
QALYs)It enables comparisons of disparate technologies
Cost of Illness $ vs. NoneA determination of the economic impact of an illness or condition .
Cost Minimization
$ vs.Assume same
outcomeA determination of the least costly among alternative interventions
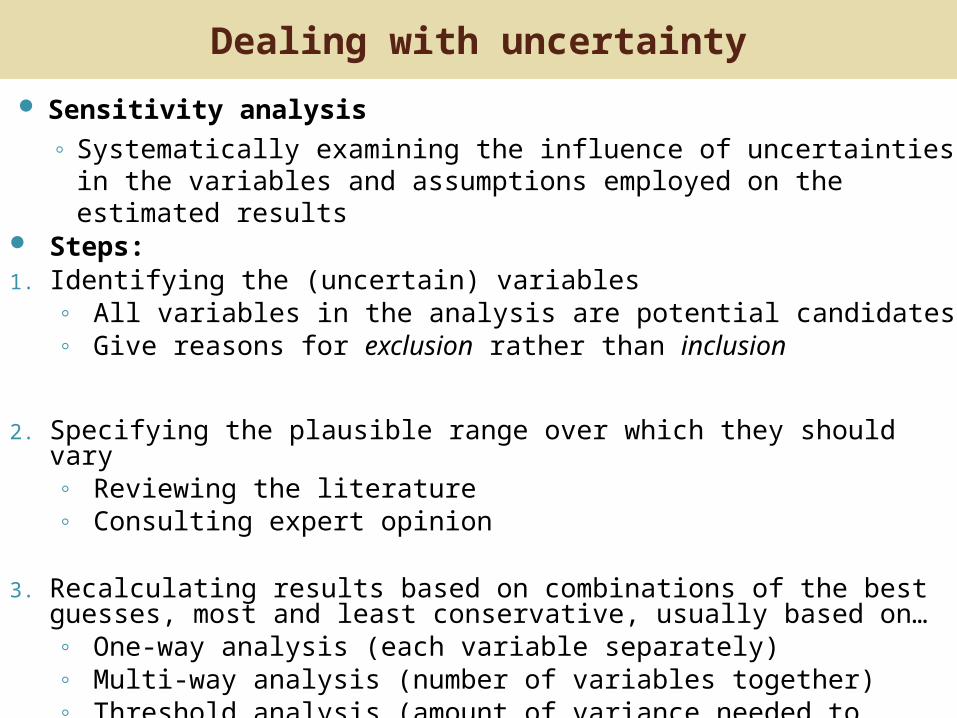
Dealing with uncertainty
Sensitivity analysis
◦ Systematically examining the influence of uncertainties in the variables and assumptions employed on the estimated results
Steps:1. Identifying the (uncertain) variables
◦ All variables in the analysis are potential candidates◦ Give reasons for exclusion rather than inclusion
2. Specifying the plausible range over which they should vary◦ Reviewing the literature◦ Consulting expert opinion
3. Recalculating results based on combinations of the best guesses, most and least conservative, usually based on…◦ One-way analysis (each variable separately)◦ Multi-way analysis (number of variables together)◦ Threshold analysis (amount of variance needed to achieve specified result)
Analysis, interpretation & presentation
Set up "dummy tables" and graphs at initial phase
Analysis should include interpretation-
i.e. What do the data mean?
Finally, Report the result◦ Stick to objective ◦Keep presentation simple and use tables & graphs◦Write an executive summary
Strengths & Limitations
Strengths o a very useful tool for the manager and policy makero In the absence of certainty, even approximations can help improve
decision-making
Limitations o It's difficult to estimate "true costs" or opportunity costoAllocation of costs; often very difficult
References
Creese A, Parker D. Cost Analysis in Primary Health Care. A training manual for programme managers. Geneva: World Health Organization; 1994.
Torres T, Baltussen R, Adam T, Hutubessy R, Acharya A, EvansD, Murray C. WHO Guide to cost effectiveness analysis. Geneva: World Health Organization; 2003.
Hutton G, Rehfuess E. Guidelines for conducting cost–benefit analysis of household energy and health interventions. Geneva: World Health Organization; 2006.
Module E Cost and Sustainability analysis. Aga Khan FoundationCost Analysis Methods. Available from URL:
www.nlm.nih.gov/nichsr/
Thanks