Embed Size (px)
Citation preview
CONSULTANT REPORT
COST‐EFFECTIVENESS OF ROOFTOP PHOTOVOLTAIC SYSTEMS FOR CONSIDERATION IN CALIFORNIA’S BUILDING ENERGY EFFICIENCY STANDARDS
DRAFT
Prepared for: California Energy Commission
Prepared by: Energy and Environmental Economics, Inc.
MAY 2013
CEC ‐400 ‐2013 ‐005 ‐D
Prepared by: Primary Author(s):
Katie Pickrell Andrew DeBenedictis Amber Mahone
Snuller Price Energy and Environmental Economics, Inc. 101 Montgomery Street, Suite 1600 San Francisco, CA 94104 415-391-5100 www.ethree.com Contract Number: 400-09-002 Prepared for: California Energy Commission Ron Yasny Contract Manager Martha Brook Project Manager Eurlyne Geiszler Office Manager High Performance Buildings and Standards Development Office Dave Ashuckian Deputy Director Efficiency and Renewable Energy Division Robert P. Oglesby Executive Director
DISCLAIMER
This report was prepared as the result of work sponsored by the California Energy Commission. It does not necessarily represent the views of the Energy Commission, its employees or the State of California. The Energy Commission, the State of California, its employees, contractors and subcontractors make no warrant, express or implied, and assume no legal liability for the information in this report; nor does any party represent that the uses of this information will not infringe upon privately owned rights. This report has not been approved or disapproved by the California Energy Commission nor has the California Energy Commission passed upon the accuracy or adequacy of the information in this report.
ABSTRACT
This consultant report was written for the California Energy Commission in response to the requirements of Senate Bill 1 (Murray, Chapter 132, Statutes of 2006). The report provides information about the cost‐effectiveness of rooftop photovoltaic systems, including the analysis approach and results. The report will be used to help the Energy Commission address the requirement in SB 1 for determining when and under which conditions solar electric systems should be required in the Building Energy Efficiency Standards. SB 1 guides the consideration of cost‐effectiveness in making this determination.
Keywords: Photovoltaic, cost‐effectiveness, Building Energy Efficiency Standards, rooftop.
Mahone, Amber, Katie Pickrell, Andrew DeBenedictis, Snuller Price. (Energy and Environmental Economics, Inc). 2011. Cost‐Effectiveness of Rooftop Photovoltaic Systems for Consideration in California’s Building Energy Efficiency Standards. California Energy Commission. Publication Number: CEC‐400‐2013‐005‐D.
i
TABLE OF CONTENTS
ABSTRACT ................................................................................................................................................. i
TABLE OF CONTENTS .......................................................................................................................... ii
EXECUTIVE SUMMARY ........................................................................................................................ 1
CHAPTER 1: Introduction ....................................................................................................................... 3
Approach ................................................................................................................................................. 3
Average Consumer Savings Analysis ............................................................................................. 4
Market‐Segmented Savings Analysis .............................................................................................. 4
Key Assumptions ................................................................................................................................... 4
Key Findings ........................................................................................................................................... 6
CHAPTER 2 Benefit–Cost Analysis Approach ................................................................................... 8
Costs: PV Cost Assumptions ................................................................................................................ 8
Installed System Cost and Progress Ratios .................................................................................... 8
System Performance by Climate Zone .......................................................................................... 11
Treatment of Uncertainty Through Two Scenarios ..................................................................... 13
Levelized Cost of Energy Produced by PV Systems ................................................................... 14
Benefits: Avoided Cost of Electricity ................................................................................................. 18
Average Consumer Savings ........................................................................................................... 18
Market‐Segmented Savings ............................................................................................................ 23
CHAPTER 3 Results ............................................................................................................................... 28
Average Consumer Results ................................................................................................................ 28
Market‐Segmented Results ................................................................................................................. 31
Residential Market‐Segmented Results ........................................................................................ 32
Commercial Market‐Segmented Results ...................................................................................... 36
CHAPTER 4 Summary of Results ........................................................................................................ 40
Average Consumer .......................................................................................................................... 41
Market‐Segmented ........................................................................................................................... 42
ACRONYMS ............................................................................................................................................ 44
ii
LIST OF FIGURES
Figure 1: High and Low PV Capital Cost Forecasts.................................................................................. 11
Figure 2: California Building Energy Efficiency Standards Climate Zones ......................................... 12
Figure 3: PV Capacity Factors by Climate Zone ........................................................................................ 13
Figure 4: Percentage of Third‐Party Financed PV Installations in CSI Database ................................ 14
Figure 5: PV Levelized Cost by System Financing Structure .................................................................. 15
Figure 6: Effect of the Expected Reduction in the Federal Investment Tax Credit on the Levelized
Cost of Electricity From Rooftop PV Projects ............................................................................................ 16
Figure 7: Average Consumer Savings Analysis: Retail Rate Forecast ................................................... 19
Figure 8: One Year of Hourly Avoided Costs of Electricity, Average Consumer Scenario .............. 20
Figure 9: 2014 Life‐Cycle Benefits of PV Generation Average Consumer Savings Assumptions .... 25
Figure 10: 2011 Residential and Commercial Retail Rates ($/kWh, 2011) ............................................. 25
Figure 11: Average Consumer Cost‐Effectiveness Results, 2014 ............................................................ 29
Figure 12: Average Consumer Cost‐Effectiveness Results, 2017 ............................................................ 30
Figure 13: Average Consumer Cost‐Effectiveness Results, 2020 ............................................................ 31
Figure 14: Residential Market‐Segmented Results Based on a Building’s Annual Electricity
Consumption, 2014 ......................................................................................................................................... 33
Figure 15: Residential Market‐Segmented Results Based on a Building’s Annual Electricity
Consumption, 2017 ......................................................................................................................................... 34
Figure 16: Residential Market‐Segmented Results Based on a Building’s Annual Electricity
Consumption, 2020 ......................................................................................................................................... 35
Figure 17: Commercial Market‐Segmented Results, 2014 ....................................................................... 36
Figure 18: Commercial Market‐Segmented Results, 2017 ....................................................................... 37
Figure 19: Commercial Market‐Segmented Results, 2020 ....................................................................... 38
iii
iv
LIST OF TABLES
Table 1: Summary of Cost‐Effectiveness Results of California Rooftop PV for Newly Constructed
Buildings, 2020 ................................................................................................................................................... 6
Table 2: CSI Installed Systems, in $/Watt, From the PowerClerk Database ........................................... 9
Table 3: Assumptions Applied in Scenarios 1 and 2 ................................................................................ 14
Table 4: Key Financing Assumptions .......................................................................................................... 17
Table 5: 20‐Year Levelized Cost (LCOE) for Rooftop PV in 2014, Examples of Climate Zone 3 and
Climate Zone 10 ($/kWh) ............................................................................................................................... 21
Table 6: Average Consumer Savings: Key Input Assumptions ............................................................. 21
Table 7: Investor‐Owned Utility Retail Rates Used in the Market‐Segmented Analysis .................. 24
Table 8: Market‐Segmented Savings: Electricity Input Assumptions ................................................... 26
Table 9: Summary of Average Consumer Analysis Results, 2020 ......................................................... 31
Table 10: Utility Assignment by Climate Zone .......................................................................................... 32
Table 11: Summary of Residential Market‐Segmented Cost‐Effectiveness Results, 2020 .................. 35
Table 12: Summary of Commercial Market‐Segmented Cost‐Effectiveness Results, 2020................ 39
Table 13: Average Consumer Savings Results ........................................................................................... 41
Table 14: Residential Market‐Segmented Savings Results ...................................................................... 42
Table 15: Commercial Market‐Segmented Savings Results .................................................................... 43
EXECUTIVE SUMMARY
This report was written for the California Energy Commission in response to the requirements of Senate Bill 1 (Murray, Chapter 132, Statutes of 2006), which calls for an evaluation of whether, and under what conditions, solar electric systems are cost‐effective for inclusion in the state’s Building Energy Efficiency Standards (Title 24, Part 6). The cost‐effectiveness analysis, which forms the basis for the conclusions of this report, is based on the Warren‐Alquist Act (1974), which requires the California Building Energy Efficiency Standards (“standards”) to be cost‐effective when taken in their entirety and when amortized over the economic life of the structure compared with historical practice.
Using the input assumptions and method described in this report, which projects the current trend in solar photovoltaic (PV) costs and maintains current rate structures and policies, we find that rooftop solar electric systems will be cost‐effective in 2020 for a large portion of California’s commercial and residential electricity consumers. The scope of this study is narrowly defined, with a particular focus on cost‐effectiveness within the standards. Other factors besides cost‐effectiveness must also be considered before PV installations are required in the standards. This report does not address any of the impacts of potential changes in practices within the construction or PV industries, nor does it consider the impacts of rooftop PV on the reliable operation of California’s electric grid.
The cost‐effectiveness analysis detailed here relies on several important assumptions about California’s solar energy landscape through 2020. These key assumptions are:
• Utility electricity rate structures and Net Energy Metering (NEM) rules do not change significantly throughout the lifetime of rooftop PV systems installed through 2020. Changes in those areas could have a dramatic impact on solar’s cost‐effectiveness, but due to the difficulty in predicting what form such changes may take, the research team’s analysis relies on existing rate structures and a continuation of the NEM policy.
• If rooftop PV systems are included in a Title 24 requirement, they will not be eligible for existing incentives such as the California Solar Initiative (CSI) and the New Solar Homes Partnership (NSHP).
• The federal investment tax credit (ITC) drops from 30 percent to 10 percent in 2017, as called for in existing legislation.
• Utility electricity rates increase at 2.11 percent per year through 2020 and 1.42 percent per year after 2020, in real terms. This is based on a forecast of retail rate escalation under an “AB 32” compliant scenario, which accounts for the impact of California’s greenhouse gas reduction policies on retail electricity rates.
• Rooftop PV system costs continue to decline through 2020. The research team’s PV cost forecast begins with reported 2012 costs from the CSI project database and then assumes that costs will drop significantly each year through 2020, continuing the trend in actual PV cost reductions observed from 2007 to 2012. For California’s PV costs to meet this forecast, both module and installation costs must decline consistently, driven by a robust and competitive PV market.
1
The authors examine PV’s cost‐effectiveness using two approaches. The first approach, referred to as the average consumer analysis, follows the adopted time dependent valuation (TDV) method used in Title 24 evaluation since 2005. TDV is a time varying measure of energy that accounts for both the enery used at the building site and consumed in producing and delivering energy to the site, including, but not limited to power generation, transmission and distribution losses. Using the the average consumer analysis method, the authors find that rooftop PV will be cost‐effective for both residential and nonresidential new construction across all climate zones by 2020. The second approach, the market‐segmented analysis, calculates PV’s cost‐effectiveness based on projected utility bill savings. Bill savings are calculated specific to different building types, annual electricity consumption, climate zones, and utility rates. The market‐segmented analysis demonstrates the variability of PV cost‐effectiveness based on those critical consumer characteristics. Rooftop solar installations are shown to be cost‐effective in 2020 only for residential consumers whose annual electricity usage is above 5,000 kilowatt hours (kWh). Furthermore, while the average consumer analysis suggests that PV will be cost‐effective for large and small commercial consumers in 2020, the market‐segmented analysis projects that PV will be consistently cost‐effective only for small commercial consumers, while cost‐effectiveness for large commercial customers varies by utility service territory. This discrepancy is due to differences in rate structure: Small commercial consumers’ rates allow them to access larger bill savings than large commercial customers. Contrasting the average consumer results to the market‐segmented results demonstrates the importance of utility rate structures, climate zone, and annual consumption in determining PV cost‐effectiveness.
2
CHAPTER 1: Introduction This report prepared by Energy and Environmental Economics, Inc. (E3) was commissioned by the California Energy Commission to evaluate the cost‐effectiveness of solar electric systems in the context of the state’s Building Energy Efficiency Standards (“standards”). The report is written in compliance with the requirements of Senate Bill 1 (Murray, Chapter 132, Statutes of 2006) and is designed to help the Energy Commission determine whether, and under what conditions, solar electric systems1 should be required on new residential and new nonresidential buildings as part of the state’s standards. Furthermore, rooftop PV systems are expected to play an important role in meeting California’s Long‐Term Energy Efficiency Strategic Plan zero net‐energy building goals and are included as part of the California Air Resources Board’s Scoping Plan to meet the state’s greenhouse gas reduction targets under Assembly Bill 32 (Nuñez, Chapter 488, Statutes of 2006).2 The conclusions in this report are based on a range of forecasts of the cost‐effectiveness of rooftop photovoltaic installations on newly constructed buildings between 2014 and 2020. This report answers the following research questions:
• Under what conditions is rooftop PV on newly constructed residential and nonresidential buildings expected to be cost‐effective from an average consumer savings perspective from 2014 to 2020?
• Is rooftop PV for newly constructed buildings expected to be cost‐effective from 2014 to
2020 for specific residential or commercial market segments? Approach Cost‐effectiveness is evaluated using two metrics: 1) average consumer savings, which evaluates whether PV is cost‐effective to residential and commercial building owners on average across climate zones, and 2) market‐segmented savings, which evaluates whether PV is cost‐effective to building owners based on their specific retail rate and annual electricity consumption, again compared by climate zone. In both approaches, the life‐cycle benefits and life‐cycle costs of PV are evaluated over a 25‐year horizon, corresponding with the current industry‐standard PV module warranty lifetime. The life‐cycle costs of PV are evaluated over a
1 For purposes of this report, solar electric systems are limited to rooftop photovoltaic (PV) systems.
2 See the Energy Efficiency Strategic Plan at http://www.cpuc.ca.gov/PUC/energy/Energy+Efficiency/eesp/ ; the ZNE Action Plan at: http://www.cpuc.ca.gov/NR/rdonlyres/6C2310FE‐AFE0‐48E4‐AF03‐530A99D28FCE/0/ZNEActionPlanFINAL83110.pdf ; and the California Air Resources Board Scoping Plan at: http://www.arb.ca.gov/cc/scopingplan/document/scopingplandocument.htm
3
20‐year period, the standard duration of rooftop solar power purchase agreements (PPAs), followed by a 5‐year period of no additional costs to the customer. Average Consumer Savings Analysis3 The average consumer savings is analyzed for residential and nonresidential customer classes based on a forecast of average residential and nonresidential retail rates. The approach is the same as the one used to evaluate new building requirements in the Energy Commission Title 24 process based on time dependent valuation (TDV). The forecast reflects wholesale market forecasts for the future cost of electricity, including natural gas fuel, the cost of new conventional generation capacity, the cost of new renewable generation capacity, transmission, distribution, ancillary services, losses, and a forecast of market prices for carbon dioxide emissions and other air emissions criteria. The retail rate forecast includes the expected effects of current electricity sector policy goals, such as the 33 percent renewable electricity standard and higher levels of energy efficiency. Market-Segmented Savings Analysis In the market‐segmented savings analysis4, the benefits of a rooftop PV installation are calculated differently than for the average consumer analysis. The benefits include the avoided cost of retail electricity prices based on a customer’s existing specific retail rate. Rate structures vary significantly by customer type. Most residential electricity rates in California are “inclining block,” or tiered, meaning that the cost of electricity increases with higher volume consumption. In contrast, most commercial electricity rates in California do not increase with higher consumption. Many medium to large commercial rates vary based on the time of use (TOU) of electricity consumption. Under TOU rates, on‐peak reductions in electricity use are valued more highly than off‐peak reductions. An additional difference between residential and commercial rate structures is the inclusion of demand charges: Commercial consumers typically pay charges per their maximum energy demand in a specific period. For example, many TOU commercial rates include a high per kW demand charge during the summer on‐peak period. Key Assumptions Evaluating the cost‐effectiveness of rooftop PV installations for newly constructed buildings is complex and depends on many variables. The authors address this complexity by using scenario analysis and categorizing the results by climate zone and broad customer classes. However, it would be impossible to evaluate every possible combination of conditions that
3 The average consumer savings analysis is based on the time dependent valuation “base” values developed as part of the Commission’s update to the 2013 Building Energy Efficiency Standards. For more information on this method, see: http://www.energy.ca.gov/title24/2013standards/prerulemaking/documents/
4 The market‐segmented savings analysis approximates consumers’ bill savings.
4
could affect PV’s cost‐effectiveness across California. Therefore, the results of the analysis should be interpreted as broadly indicative of cost trends for PV across the state. PV system costs and characteristics are one set of critical variables that affect the cost‐effectiveness analysis. The authors assume that the capital cost of PV will continue to decrease over time, in line with historical trends that have shown significant cost reductions since 2007 and earlier. Because the expected electricity generation of a PV system varies by location based on the solar resource available, the authors show PV cost‐effectiveness results for each of California’s 16 climate zones. PV system size is another important input; in this analysis, the authors assume that all residential and small commercial systems are smaller than 10 kW in size, while all large commercial PV installations are between 10 to 100 kW. The authors assume that all PV systems are roof‐mounted and do not evaluate the cost‐effectiveness of ground‐mounted systems or larger “community solar” type installations.5 Throughout this analysis, the authors assume that rooftop PV systems accrue benefits over a 25‐year economic lifetime. Another factor in this analysis is the forecast of electricity retail rate escalation. The research team assumes that retail rates will increase by 2.11 percent per year through 2020 and 1.42 percent per year after 2020 (in real terms), as California replaces much of its electricity generation with less‐polluting resources and implements other greenhouse gas reduction measures in compliance with the Global Warming Solutions Act of 2006 (AB 32)6. E3’s analysis assumes that if PV were incorporated into the building code, installations would not directly receive a financial credit for helping to meet the state’s Renewables Portfolio Standard (RPS), nor would they be eligible for current state solar incentives such as the California Solar Initiative (CSI) and the New Solar Homes Partnership (NSHP).7 The structure of electricity rates and the Net Energy Metering (NEM) program is also important to the analysis. The authors assume that the structure of California utility rates will not change dramatically before 2020. Changes to utility rates, such as increasing demand and/or service charges while decreasing energy charges, could have a large effect on consumers’ utility bill savings upon installing PV. Furthermore, the authors assume that California’s existing NEM program will remain in place in its current form for the lifetime of systems installed through
5 Community solar projects are expected to show some cost benefits over rooftop‐mounted PV systems because the larger systems could achieve economies of scale. However, there are significant challenges to widespread deployment of community solar including tariffs and interconnection rules that are beyond the scope of this analysis.
6 For more information about AB 32, please see the California Environmental Protection Agency Air Resources Board website at http://www.arb.ca.gov/cc/ab32/ab32.htm.
7 Depending on how the Commission chooses to implement the updated Base Code and CALGreen Tiers 1 and 2, the NSHP incentive could continue to be available to new home construction. However, this analysis does not predicate the cost‐effectiveness results based on the presence of state solar incentives.
5
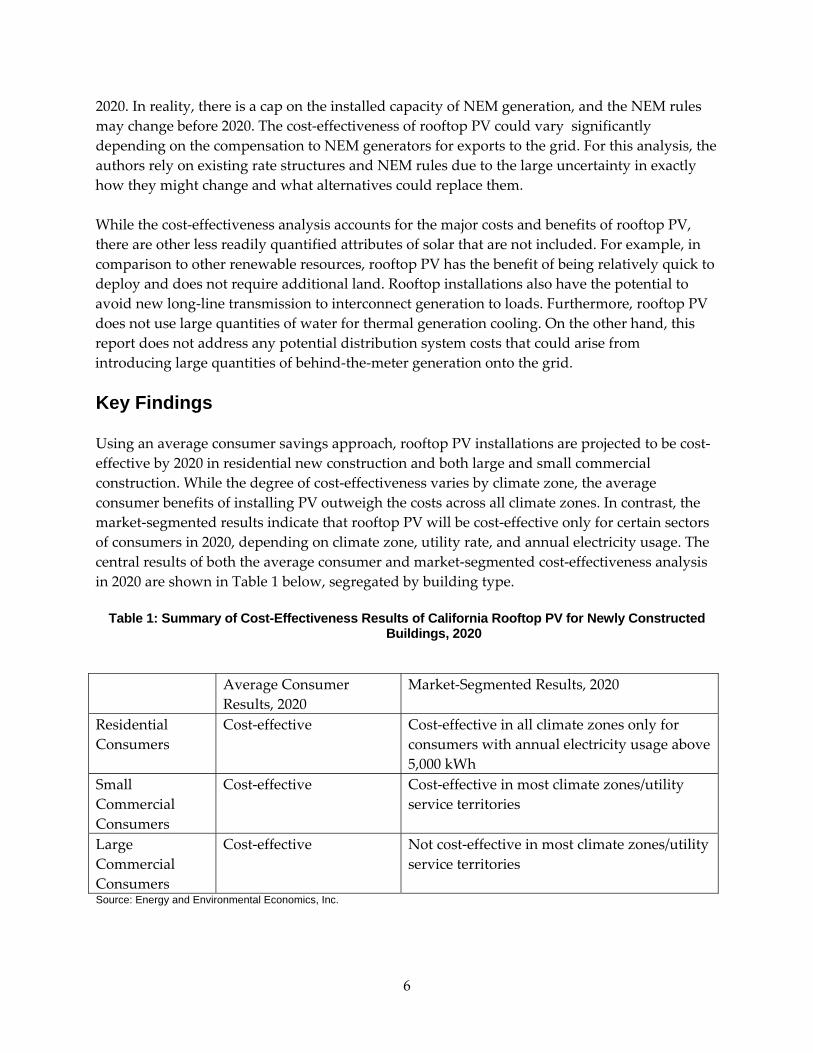
2020. In reality, there is a cap on the installed capacity of NEM generation, and the NEM rules may change before 2020. The cost‐effectiveness of rooftop PV could vary significantly depending on the compensation to NEM generators for exports to the grid. For this analysis, the authors rely on existing rate structures and NEM rules due to the large uncertainty in exactly how they might change and what alternatives could replace them. While the cost‐effectiveness analysis accounts for the major costs and benefits of rooftop PV, there are other less readily quantified attributes of solar that are not included. For example, in comparison to other renewable resources, rooftop PV has the benefit of being relatively quick to deploy and does not require additional land. Rooftop installations also have the potential to avoid new long‐line transmission to interconnect generation to loads. Furthermore, rooftop PV does not use large quantities of water for thermal generation cooling. On the other hand, this report does not address any potential distribution system costs that could arise from introducing large quantities of behind‐the‐meter generation onto the grid. Key Findings Using an average consumer savings approach, rooftop PV installations are projected to be cost‐effective by 2020 in residential new construction and both large and small commercial construction. While the degree of cost‐effectiveness varies by climate zone, the average consumer benefits of installing PV outweigh the costs across all climate zones. In contrast, the market‐segmented results indicate that rooftop PV will be cost‐effective only for certain sectors of consumers in 2020, depending on climate zone, utility rate, and annual electricity usage. The central results of both the average consumer and market‐segmented cost‐effectiveness analysis in 2020 are shown in Table 1 below, segregated by building type.
Table 1: Summary of Cost-Effectiveness Results of California Rooftop PV for Newly Constructed Buildings, 2020
Average Consumer Results, 2020
Market‐Segmented Results, 2020
Residential Consumers
Cost‐effective Cost‐effective in all climate zones only for consumers with annual electricity usage above 5,000 kWh
Small Commercial Consumers
Cost‐effective Cost‐effective in most climate zones/utility service territories
Large Commercial Consumers
Cost‐effective Not cost‐effective in most climate zones/utility service territories
Source: Energy and Environmental Economics, Inc.
6
Ultimately, deciding whether to include PV in the California Building Energy Efficiency Standards requires consideration of more than just the cost‐effectiveness issues raised here. The integration of PV into the energy code should happen in a well‐planned and phased manner, taking into account the state’s policy objectives, as well as the costs, benefits, and less tangible attributes of PV. Any PV requirement would ideally be designed to ensure that the solar and building industries in California are ready to meet the additional need for solar installations with each successive building standard requirement. In addition, the code would need to include provisions to handle locations that are not suitable for solar generation. These other considerations are not addressed in this study.
7
CHAPTER 2: Benefit–Cost Analysis Approach The research team evaluates the cost‐effectiveness of PV using an approach that compares the costs and benefits over the life of the system from the owner’s perspective. To calculate a benefit‐cost ratio, the life‐cycle benefits of PV are divided by the life‐cycle costs of PV. If the ratio of benefits to costs is greater than one with reasonable certainty, then PV is determined to be cost‐effective. The cost of electricity produced by a solar electric system depends on the installed capital cost, financing costs, taxes, and federal incentives associated with PV, as well as the amount of electricity generated by the PV system. The benefits of solar to the consumer (that is, building owner) are the avoided utility bills. In the average consumer savings analysis, average consumer savings are calculated using the hourly time dependent valuation (TDV) costs adopted in the 2013 Title 24 proceeding. These TDV factors reflect the shape of the underlying market value of electricity in each hour of the year, including avoided greenhouse gas emissions, avoided energy and capacity costs, and avoided transmission and distribution costs. In the market‐segmented savings analysis, the current utility rates, such as tiered residential retail rates and time‐of‐use commercial retail rates, are used to calculate the bill savings by segmented customer class. Each component of these benefit‐cost analyses is discussed in more detail below. Costs: PV Cost Assumptions Installed System Cost and Progress Ratios Installed PV system costs are based on the PowerClerk database8 of California Solar Initiative systems, with adjustments to create a forward‐looking forecast of capital costs. The PowerClerk data reflect the “self‐reported” cost of more than 100,000 actual PV systems installed on buildings between 2007 and 2012. This database was used because it is the most detailed rooftop PV dataset available for actual California installations. Installed capital cost data from the New Solar Homes Partnership program are used to benchmark capital cost data for rooftop PV installations on newly constructed buildings.
8 The research team obtained data directly from the PowerClerk database manager, Clean Power Research. The PowerClerk database holds solar system data from applicants who have participated California Solar Initiative solar incentive program.The data are available online at https://csi.powerclerk.com/CSIProgramData.aspx; however, some fields are not publicly available to protect customer identities.
8
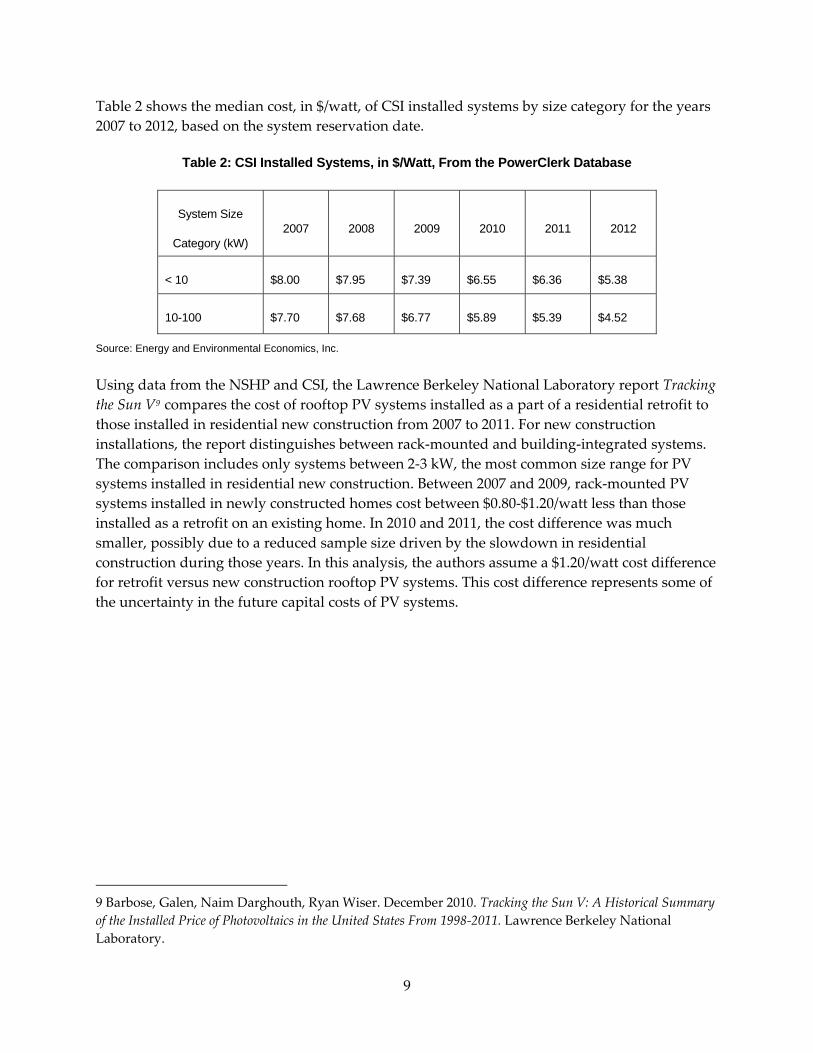
Table 2 shows the median cost, in $/watt, of CSI installed systems by size category for the years 2007 to 2012, based on the system reservation date.
Table 2: CSI Installed Systems, in $/Watt, From the PowerClerk Database
System Size
Category (kW) 2007 2008 2009 2010 2011 2012
< 10 $8.00 $7.95 $7.39 $6.55 $6.36 $5.38
10-100 $7.70 $7.68 $6.77 $5.89 $5.39 $4.52
Source: Energy and Environmental Economics, Inc.
Using data from the NSHP and CSI, the Lawrence Berkeley National Laboratory report Tracking the Sun V9 compares the cost of rooftop PV systems installed as a part of a residential retrofit to those installed in residential new construction from 2007 to 2011. For new construction installations, the report distinguishes between rack‐mounted and building‐integrated systems. The comparison includes only systems between 2‐3 kW, the most common size range for PV systems installed in residential new construction. Between 2007 and 2009, rack‐mounted PV systems installed in newly constructed homes cost between $0.80‐$1.20/watt less than those installed as a retrofit on an existing home. In 2010 and 2011, the cost difference was much smaller, possibly due to a reduced sample size driven by the slowdown in residential construction during those years. In this analysis, the authors assume a $1.20/watt cost difference for retrofit versus new construction rooftop PV systems. This cost difference represents some of the uncertainty in the future capital costs of PV systems.
9 Barbose, Galen, Naim Darghouth, Ryan Wiser. December 2010. Tracking the Sun V: A Historical Summary of the Installed Price of Photovoltaics in the United States From 1998‐2011. Lawrence Berkeley National Laboratory.
9
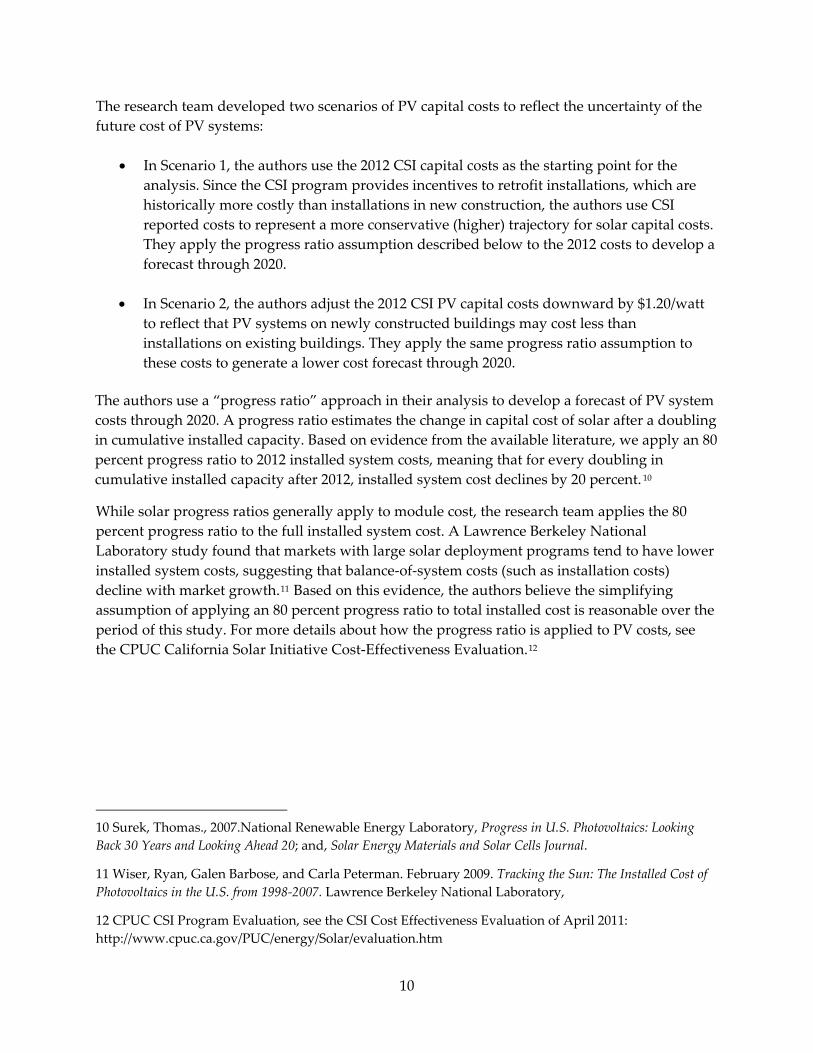
The research team developed two scenarios of PV capital costs to reflect the uncertainty of the future cost of PV systems:
• In Scenario 1, the authors use the 2012 CSI capital costs as the starting point for the analysis. Since the CSI program provides incentives to retrofit installations, which are historically more costly than installations in new construction, the authors use CSI reported costs to represent a more conservative (higher) trajectory for solar capital costs. They apply the progress ratio assumption described below to the 2012 costs to develop a forecast through 2020.
• In Scenario 2, the authors adjust the 2012 CSI PV capital costs downward by $1.20/watt to reflect that PV systems on newly constructed buildings may cost less than installations on existing buildings. They apply the same progress ratio assumption to these costs to generate a lower cost forecast through 2020.
The authors use a “progress ratio” approach in their analysis to develop a forecast of PV system costs through 2020. A progress ratio estimates the change in capital cost of solar after a doubling in cumulative installed capacity. Based on evidence from the available literature, we apply an 80 percent progress ratio to 2012 installed system costs, meaning that for every doubling in cumulative installed capacity after 2012, installed system cost declines by 20 percent. 10
While solar progress ratios generally apply to module cost, the research team applies the 80 percent progress ratio to the full installed system cost. A Lawrence Berkeley National Laboratory study found that markets with large solar deployment programs tend to have lower installed system costs, suggesting that balance‐of‐system costs (such as installation costs) decline with market growth.11 Based on this evidence, the authors believe the simplifying assumption of applying an 80 percent progress ratio to total installed cost is reasonable over the period of this study. For more details about how the progress ratio is applied to PV costs, see the CPUC California Solar Initiative Cost‐Effectiveness Evaluation.12
10 Surek, Thomas., 2007.National Renewable Energy Laboratory, Progress in U.S. Photovoltaics: Looking Back 30 Years and Looking Ahead 20; and, Solar Energy Materials and Solar Cells Journal.
11 Wiser, Ryan, Galen Barbose, and Carla Peterman. February 2009. Tracking the Sun: The Installed Cost of Photovoltaics in the U.S. from 1998‐2007. Lawrence Berkeley National Laboratory,
12 CPUC CSI Program Evaluation, see the CSI Cost Effectiveness Evaluation of April 2011: http://www.cpuc.ca.gov/PUC/energy/Solar/evaluation.htm
10
The high and low forecasts of installed system cost for Scenarios 1 and 2 are shown in Figure 1 below.
Figure 1: High and Low PV Capital Cost Forecasts
$2.00
$3.00
$4.00
$5.00
$6.00 Installed PV
Cost ($/Watt D
C)
Year
<10 kW cost range 10‐100 kW cost range
Source: Energy and Environmental Economics, Inc
For this analysis, all residential and small commercial systems are modeled using the median cost of solar systems under 10 kW in size. For large commercial customers, the authors use the median average solar cost for systems between 10 and 100 kW in size.13
System Performance by Climate Zone
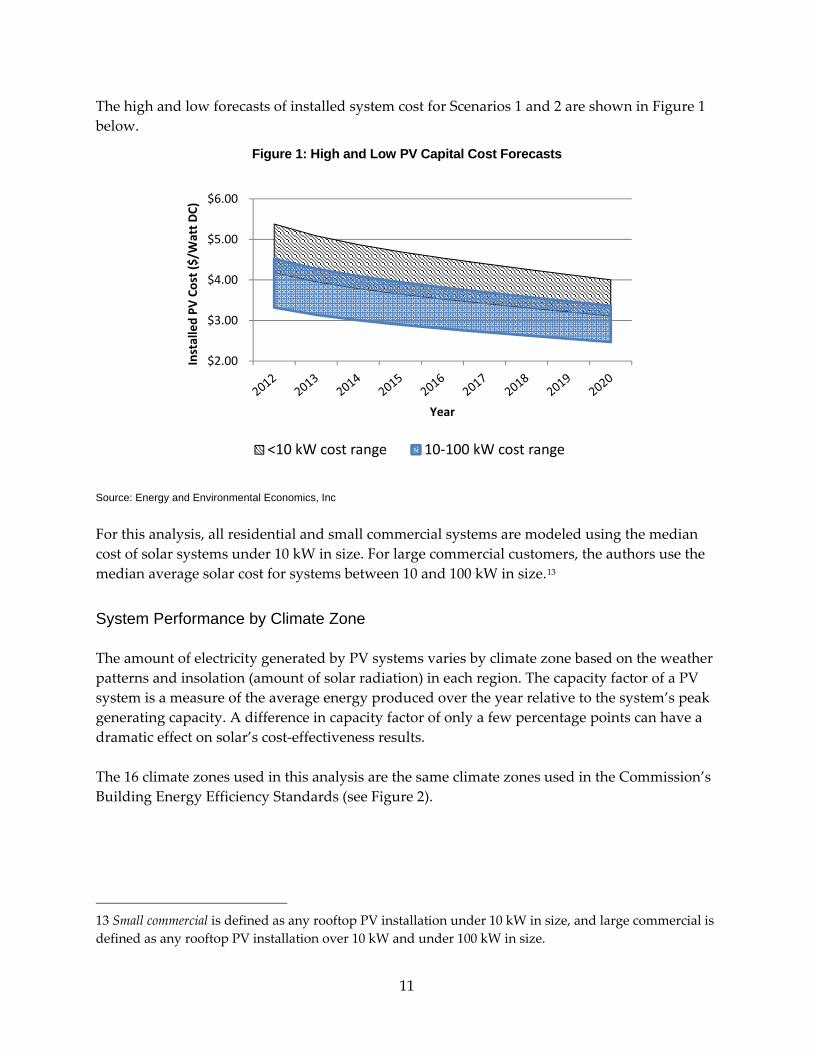
The amount of electricity generated by PV systems varies by climate zone based on the weather patterns and insolation (amount of solar radiation) in each region. The capacity factor of a PV system is a measure of the average energy produced over the year relative to the system’s peak generating capacity. A difference in capacity factor of only a few percentage points can have a dramatic effect on solar’s cost‐effectiveness results.
The 16 climate zones used in this analysis are the same climate zones used in the Commission’s Building Energy Efficiency Standards (see Figure 2).
13 Small commercial is defined as any rooftop PV installation under 10 kW in size, and large commercial is defined as any rooftop PV installation over 10 kW and under 100 kW in size.
11
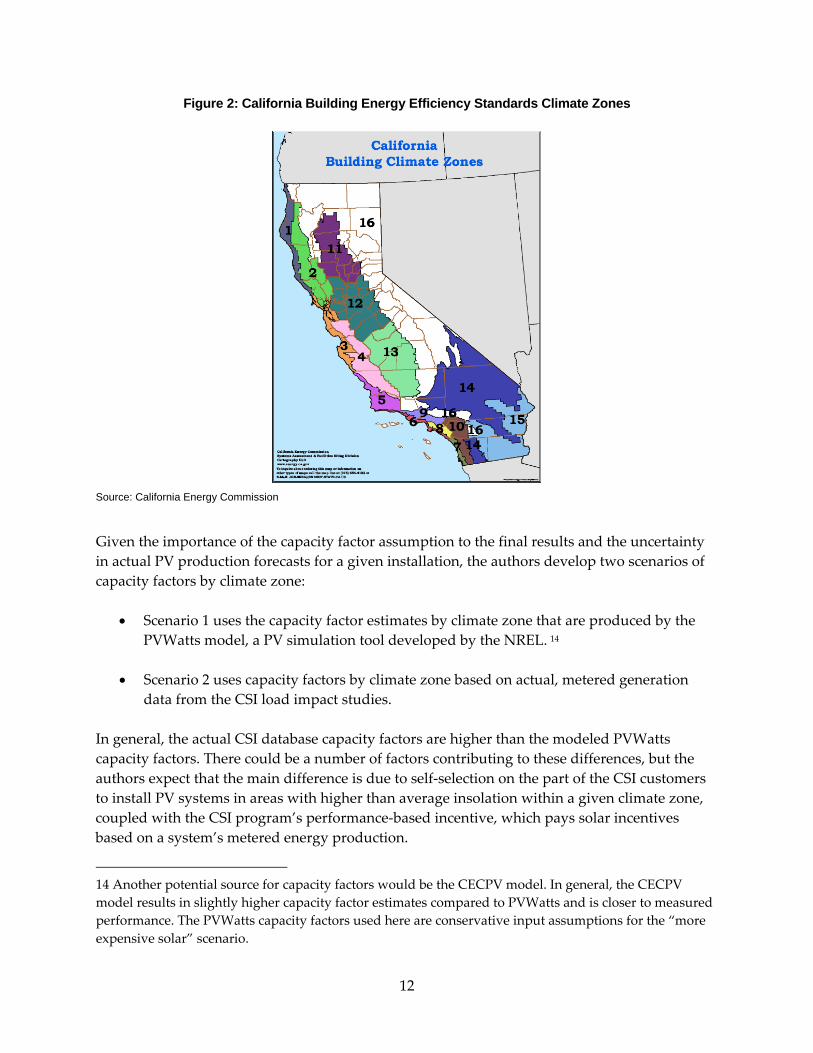
Figure 2: California Building Energy Efficiency Standards Climate Zones
Source: California Energy Commission
Given the importance of the capacity factor assumption to the final results and the uncertainty in actual PV production forecasts for a given installation, the authors develop two scenarios of capacity factors by climate zone:
• Scenario 1 uses the capacity factor estimates by climate zone that are produced by the PVWatts model, a PV simulation tool developed by the NREL. 14
• Scenario 2 uses capacity factors by climate zone based on actual, metered generation data from the CSI load impact studies.
In general, the actual CSI database capacity factors are higher than the modeled PVWatts capacity factors. There could be a number of factors contributing to these differences, but the authors expect that the main difference is due to self‐selection on the part of the CSI customers to install PV systems in areas with higher than average insolation within a given climate zone, coupled with the CSI program’s performance‐based incentive, which pays solar incentives based on a system’s metered energy production.
14 Another potential source for capacity factors would be the CECPV model. In general, the CECPV model results in slightly higher capacity factor estimates compared to PVWatts and is closer to measured performance. The PVWatts capacity factors used here are conservative input assumptions for the “more expensive solar” scenario.
12
Although it is likely that the effects of shading differ between retrofit and newly constructed buildings, the authors have not found any documented evidence to suggest that the capacity factor varies for retrofit versus newly constructed building installations or between residential and commercial installations (for a given system type). Figure 3 shows the capacity factors by climate zone applied in Scenario 1 (PVWatts) and Scenario 2 (average metered CSI generation data).
Figure 3: PV Capacity Factors by Climate Zone
Scenario 1 Uses PVWatts Data, Scenario 2 Is Based on Average Performance of Actual CSI Installed Systems
0%
5%
10%
15%
20%
25%
DC Ca
pacity Factor
Climate Zone
Scenario 1: Estimated Using PVWatts
Scenario 2: Average Metered CSI Program Data
Source: Energy and Environmental Economics, Inc. Treatment of Uncertainty Through Two Scenarios The research team uses two scenarios to reflect the uncertainty in forecasting PV cost‐effectiveness. By combining the range of capital costs described in the section “Installed System Cost and Progress Ratios” and the range of capacity factors described in the section “System Performance by Climate Zone,” the authors generate the following two scenarios:
1. Scenario 1 reflects a forecast of “more expensive solar” using higher capital costs and lower capacity factors.
2. Scenario 2 reflects a forecast of “less expensive solar” using lower capital costs and higher capacity factors.
13
These scenarios create reasonable uncertainty bounds on a range of potential PV costs and are summarized in Table 3 below.
Table 3: Assumptions Applied in Scenarios 1 and 2
Scenario Capital cost assumptions Capacity factor assumptions
Scenario 1: More expensive solar
Higher capital costs: CSI data based on retrofit installations, adjusted for 80% progress ratio
Lower capacity factors: PVWatts modeled data
Scenario 2: Less expensive solar
Lower capital costs: CSI costs reduced by $1.20/watt to approximate installations on newly constructed buildings, adjusted for 80% progress ratio
Higher capacity factors: actual CSI program metered generation data
Source: Energy and Environmental Economics, Inc. Levelized Cost of Energy Produced by PV Systems System Financing
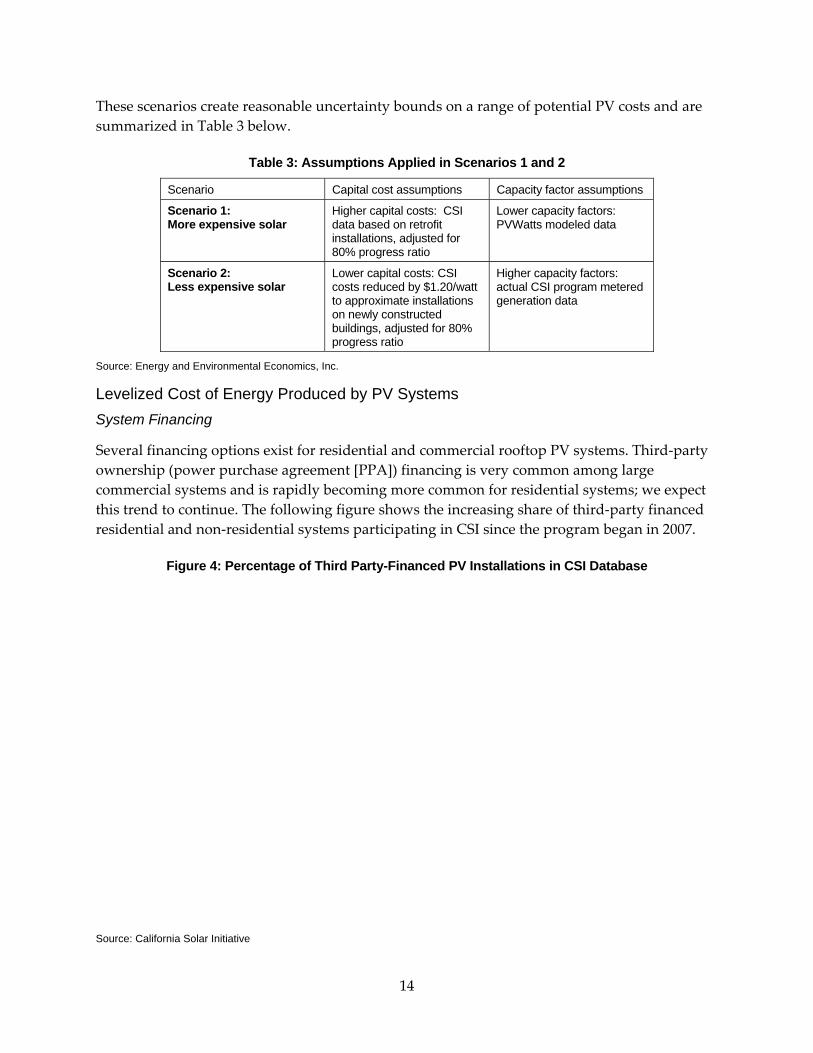
Several financing options exist for residential and commercial rooftop PV systems. Third‐party ownership (power purchase agreement [PPA]) financing is very common among large commercial systems and is rapidly becoming more common for residential systems; we expect this trend to continue. The following figure shows the increasing share of third‐party financed residential and non‐residential systems participating in CSI since the program began in 2007.
Figure 4: Percentage of Third Party-Financed PV Installations in CSI Database
Source: California Solar Initiative
14
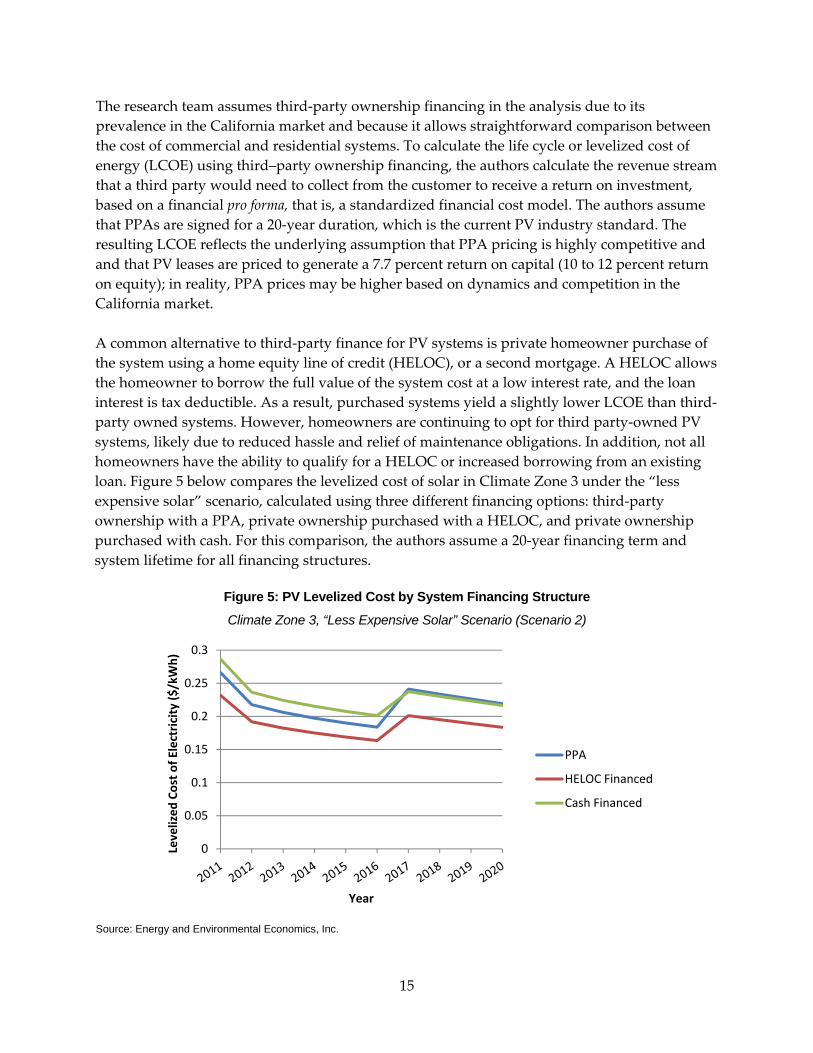
The research team assumes third‐party ownership financing in the analysis due to its prevalence in the California market and because it allows straightforward comparison between the cost of commercial and residential systems. To calculate the life cycle or levelized cost of energy (LCOE) using third–party ownership financing, the authors calculate the revenue stream that a third party would need to collect from the customer to receive a return on investment, based on a financial pro forma, that is, a standardized financial cost model. The authors assume that PPAs are signed for a 20‐year duration, which is the current PV industry standard. The resulting LCOE reflects the underlying assumption that PPA pricing is highly competitive and and that PV leases are priced to generate a 7.7 percent return on capital (10 to 12 percent return on equity); in reality, PPA prices may be higher based on dynamics and competition in the California market. A common alternative to third‐party finance for PV systems is private homeowner purchase of the system using a home equity line of credit (HELOC), or a second mortgage. A HELOC allows the homeowner to borrow the full value of the system cost at a low interest rate, and the loan interest is tax deductible. As a result, purchased systems yield a slightly lower LCOE than third‐party owned systems. However, homeowners are continuing to opt for third party‐owned PV systems, likely due to reduced hassle and relief of maintenance obligations. In addition, not all homeowners have the ability to qualify for a HELOC or increased borrowing from an existing loan. Figure 5 below compares the levelized cost of solar in Climate Zone 3 under the “less expensive solar” scenario, calculated using three different financing options: third‐party ownership with a PPA, private ownership purchased with a HELOC, and private ownership purchased with cash. For this comparison, the authors assume a 20‐year financing term and system lifetime for all financing structures.
Figure 5: PV Levelized Cost by System Financing Structure
Climate Zone 3, “Less Expensive Solar” Scenario (Scenario 2)
Source: Energy and Environmental Economics, Inc.
0
0.05
0.1
0.15
0.2
0.25
0.3
Levelized
Cost o
f Electricity ($
/kWh)
Year
PPA
HELOC Financed
Cash Financed
15
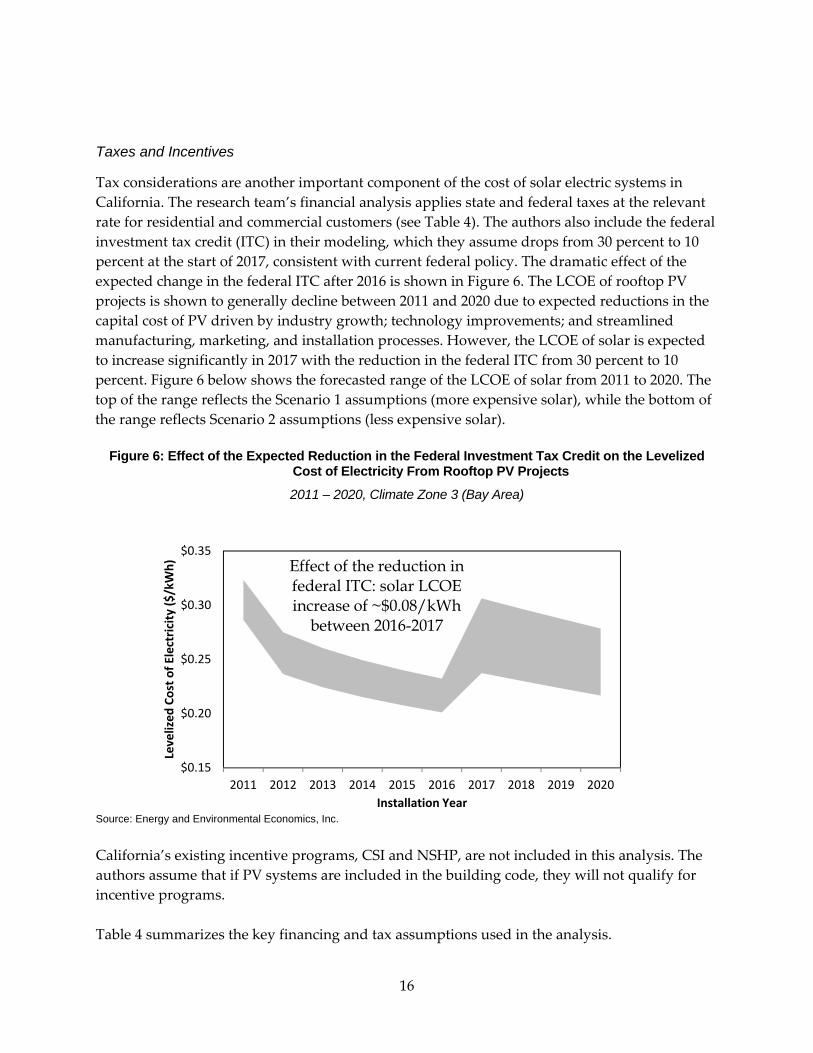
Taxes and Incentives
Tax considerations are another important component of the cost of solar electric systems in California. The research team’s financial analysis applies state and federal taxes at the relevant rate for residential and commercial customers (see Table 4). The authors also include the federal investment tax credit (ITC) in their modeling, which they assume drops from 30 percent to 10 percent at the start of 2017, consistent with current federal policy. The dramatic effect of the expected change in the federal ITC after 2016 is shown in Figure 6. The LCOE of rooftop PV projects is shown to generally decline between 2011 and 2020 due to expected reductions in the capital cost of PV driven by industry growth; technology improvements; and streamlined manufacturing, marketing, and installation processes. However, the LCOE of solar is expected to increase significantly in 2017 with the reduction in the federal ITC from 30 percent to 10 percent. Figure 6 below shows the forecasted range of the LCOE of solar from 2011 to 2020. The top of the range reflects the Scenario 1 assumptions (more expensive solar), while the bottom of the range reflects Scenario 2 assumptions (less expensive solar).
Figure 6: Effect of the Expected Reduction in the Federal Investment Tax Credit on the Levelized Cost of Electricity From Rooftop PV Projects
2011 – 2020, Climate Zone 3 (Bay Area)
Source: Energy and Environmental Economics, Inc.
$0.15
$0.20
$0.25
$0.30
$0.35
2011 2012 2013 2014 2015 2016 2017 2018 2019 2020
Levelized
Cost o
f Electricity ($
/kWh)
Installation Year
Effect of the reduction in federal ITC: solar LCOE increase of ~$0.08/kWh
between 2016-2017
California’s existing incentive programs, CSI and NSHP, are not included in this analysis. The authors assume that if PV systems are included in the building code, they will not qualify for incentive programs.
Table 4 summarizes the key financing and tax assumptions used in the analysis.
16
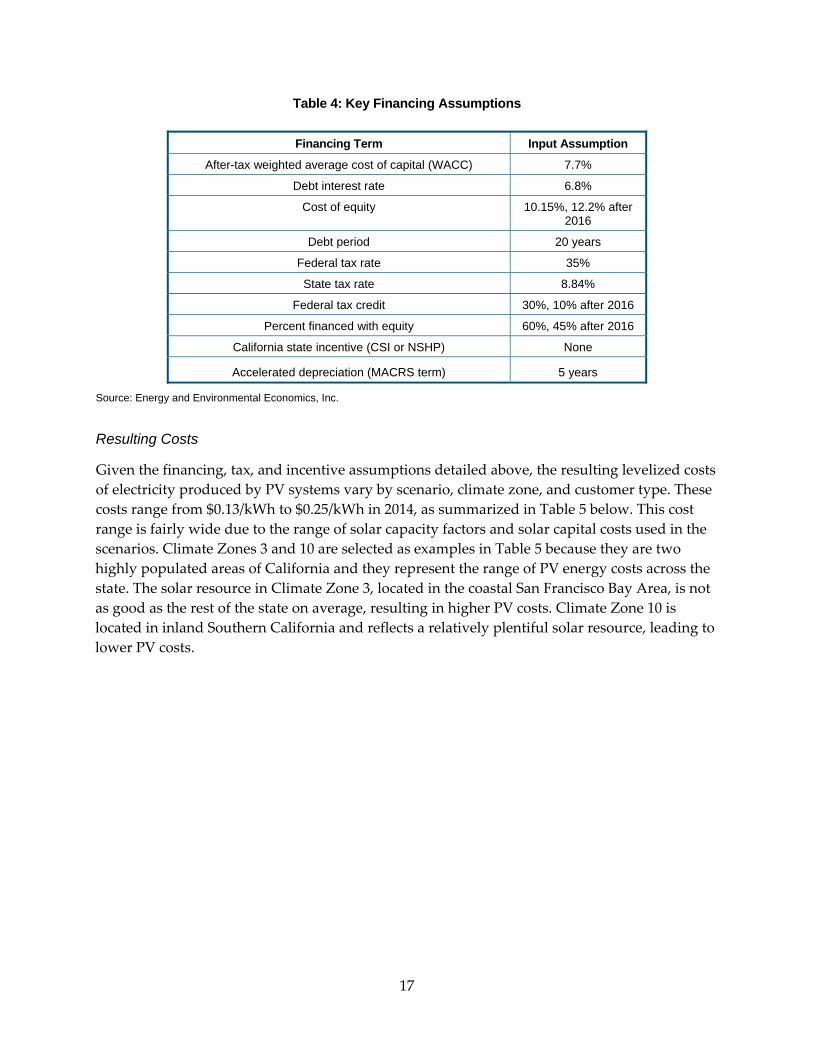
Table 4: Key Financing Assumptions
Financing Term Input Assumption
After-tax weighted average cost of capital (WACC) 7.7%
Debt interest rate 6.8%
Cost of equity 10.15%, 12.2% after 2016
Debt period 20 years
Federal tax rate 35%
State tax rate 8.84%
Federal tax credit 30%, 10% after 2016
Percent financed with equity 60%, 45% after 2016
California state incentive (CSI or NSHP) None
Accelerated depreciation (MACRS term) 5 years
Source: Energy and Environmental Economics, Inc. Resulting Costs
Given the financing, tax, and incentive assumptions detailed above, the resulting levelized costs of electricity produced by PV systems vary by scenario, climate zone, and customer type. These costs range from $0.13/kWh to $0.25/kWh in 2014, as summarized in Table 5 below. This cost range is fairly wide due to the range of solar capacity factors and solar capital costs used in the scenarios. Climate Zones 3 and 10 are selected as examples in Table 5 because they are two highly populated areas of California and they represent the range of PV energy costs across the state. The solar resource in Climate Zone 3, located in the coastal San Francisco Bay Area, is not as good as the rest of the state on average, resulting in higher PV costs. Climate Zone 10 is located in inland Southern California and reflects a relatively plentiful solar resource, leading to lower PV costs.
17
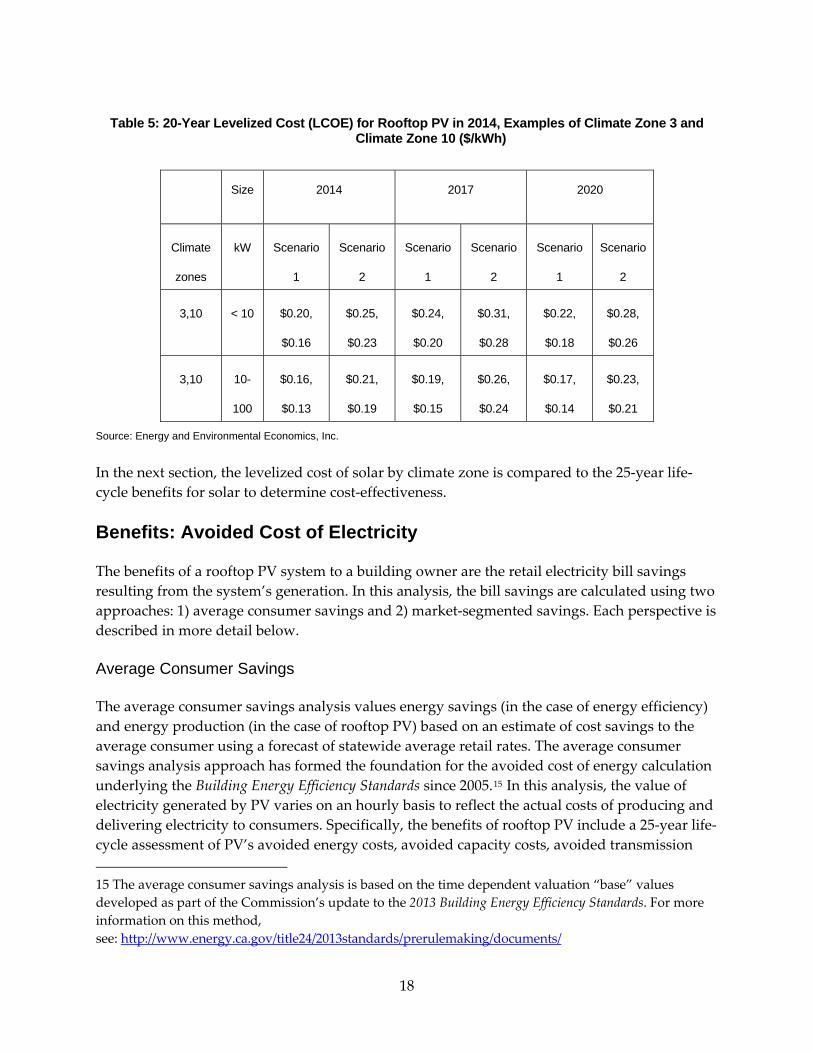
Table 5: 20-Year Levelized Cost (LCOE) for Rooftop PV in 2014, Examples of Climate Zone 3 and
Climate Zone 10 ($/kWh)
Size 2014 2017 2020
Climate
zones
kW Scenario
1
Scenario
2
Scenario
1
Scenario
2
Scenario
1
Scenario
2
3,10 < 10 $0.20,
$0.16
$0.25,
$0.23
$0.24,
$0.20
$0.31,
$0.28
$0.22,
$0.18
$0.28,
$0.26
3,10 10-
100
$0.16,
$0.13
$0.21,
$0.19
$0.19,
$0.15
$0.26,
$0.24
$0.17,
$0.14
$0.23,
$0.21
Source: Energy and Environmental Economics, Inc.
In the next section, the levelized cost of solar by climate zone is compared to the 25‐year life‐cycle benefits for solar to determine cost‐effectiveness. Benefits: Avoided Cost of Electricity The benefits of a rooftop PV system to a building owner are the retail electricity bill savings resulting from the system’s generation. In this analysis, the bill savings are calculated using two approaches: 1) average consumer savings and 2) market‐segmented savings. Each perspective is described in more detail below. Average Consumer Savings The average consumer savings analysis values energy savings (in the case of energy efficiency) and energy production (in the case of rooftop PV) based on an estimate of cost savings to the average consumer using a forecast of statewide average retail rates. The average consumer savings analysis approach has formed the foundation for the avoided cost of energy calculation underlying the Building Energy Efficiency Standards since 2005.15 In this analysis, the value of electricity generated by PV varies on an hourly basis to reflect the actual costs of producing and delivering electricity to consumers. Specifically, the benefits of rooftop PV include a 25‐year life‐cycle assessment of PV’s avoided energy costs, avoided capacity costs, avoided transmission 15 The average consumer savings analysis is based on the time dependent valuation “base” values developed as part of the Commission’s update to the 2013 Building Energy Efficiency Standards. For more information on this method, see: http://www.energy.ca.gov/title24/2013standards/prerulemaking/documents/
18
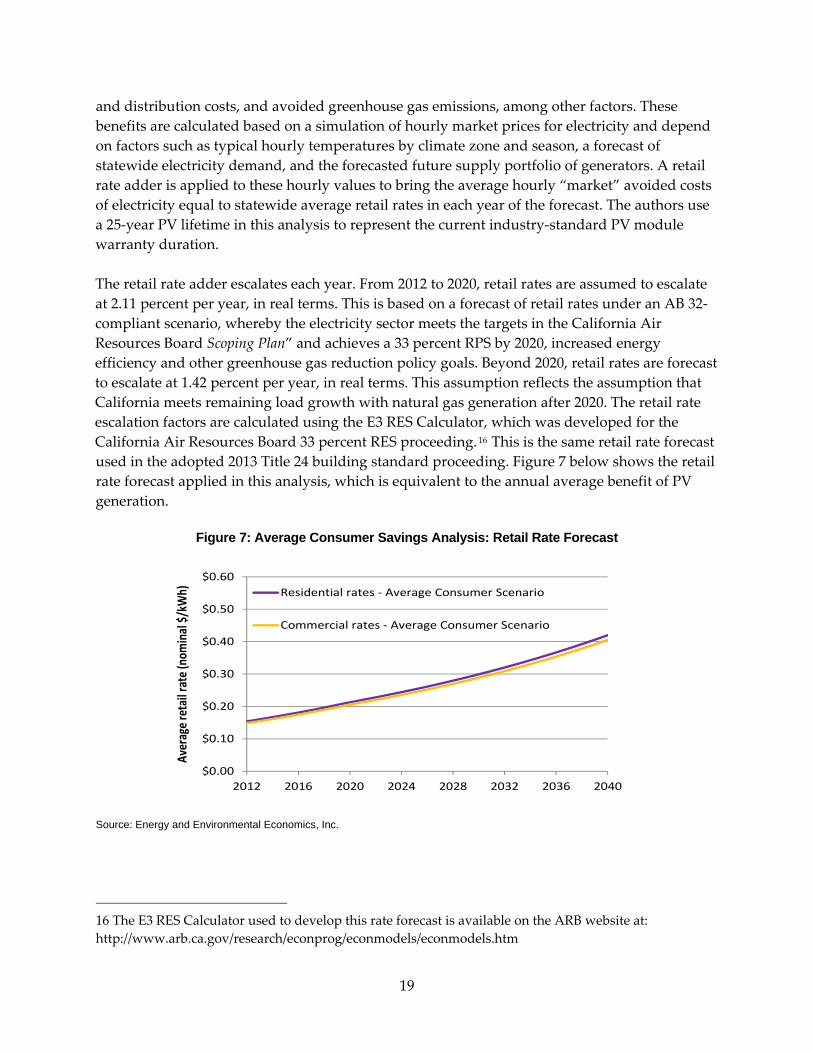
and distribution costs, and avoided greenhouse gas emissions, among other factors. These benefits are calculated based on a simulation of hourly market prices for electricity and depend on factors such as typical hourly temperatures by climate zone and season, a forecast of statewide electricity demand, and the forecasted future supply portfolio of generators. A retail rate adder is applied to these hourly values to bring the average hourly “market” avoided costs of electricity equal to statewide average retail rates in each year of the forecast. The authors use a 25‐year PV lifetime in this analysis to represent the current industry‐standard PV module warranty duration. The retail rate adder escalates each year. From 2012 to 2020, retail rates are assumed to escalate at 2.11 percent per year, in real terms. This is based on a forecast of retail rates under an AB 32‐compliant scenario, whereby the electricity sector meets the targets in the California Air Resources Board Scoping Plan” and achieves a 33 percent RPS by 2020, increased energy efficiency and other greenhouse gas reduction policy goals. Beyond 2020, retail rates are forecast to escalate at 1.42 percent per year, in real terms. This assumption reflects the assumption that California meets remaining load growth with natural gas generation after 2020. The retail rate escalation factors are calculated using the E3 RES Calculator, which was developed for the California Air Resources Board 33 percent RES proceeding. 16 This is the same retail rate forecast used in the adopted 2013 Title 24 building standard proceeding. Figure 7 below shows the retail rate forecast applied in this analysis, which is equivalent to the annual average benefit of PV generation.
Figure 7: Average Consumer Savings Analysis: Retail Rate Forecast
$0.00
$0.10
$0.20
$0.30
$0.40
$0.50
2012 2016 2020 2024 2028 2032 2036 2040
Average retail rate (n
ominal $/kWh)
$0.60Residential rates ‐ Average Consumer Scenario
Commercial rates ‐ Average Consumer Scenario
Source: Energy and Environmental Economics, Inc.
16 The E3 RES Calculator used to develop this rate forecast is available on the ARB website at: http://www.arb.ca.gov/research/econprog/econmodels/econmodels.htm
19
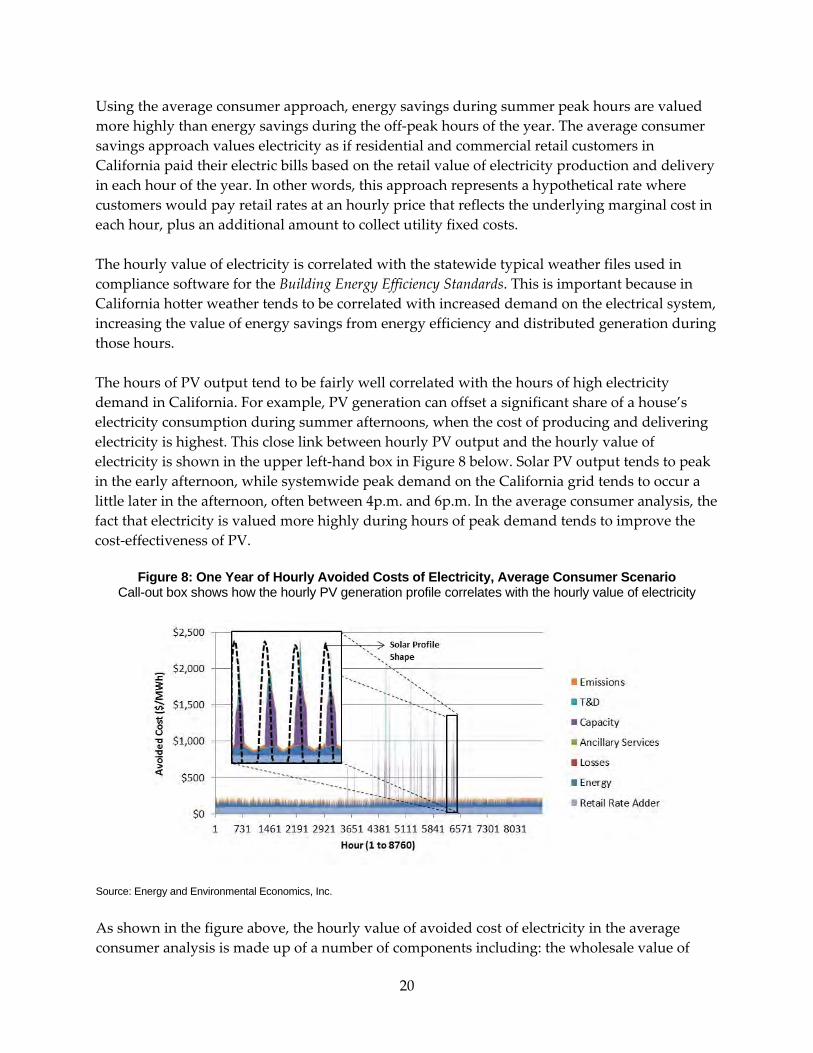
Using the average consumer approach, energy savings during summer peak hours are valued more highly than energy savings during the off‐peak hours of the year. The average consumer savings approach values electricity as if residential and commercial retail customers in California paid their electric bills based on the retail value of electricity production and delivery in each hour of the year. In other words, this approach represents a hypothetical rate where customers would pay retail rates at an hourly price that reflects the underlying marginal cost in each hour, plus an additional amount to collect utility fixed costs. The hourly value of electricity is correlated with the statewide typical weather files used in compliance software for the Building Energy Efficiency Standards. This is important because in California hotter weather tends to be correlated with increased demand on the electrical system, increasing the value of energy savings from energy efficiency and distributed generation during those hours. The hours of PV output tend to be fairly well correlated with the hours of high electricity demand in California. For example, PV generation can offset a significant share of a house’s electricity consumption during summer afternoons, when the cost of producing and delivering electricity is highest. This close link between hourly PV output and the hourly value of electricity is shown in the upper left‐hand box in Figure 8 below. Solar PV output tends to peak in the early afternoon, while systemwide peak demand on the California grid tends to occur a little later in the afternoon, often between 4p.m. and 6p.m. In the average consumer analysis, the fact that electricity is valued more highly during hours of peak demand tends to improve the cost‐effectiveness of PV.
Figure 8: One Year of Hourly Avoided Costs of Electricity, Average Consumer Scenario Call-out box shows how the hourly PV generation profile correlates with the hourly value of electricity
Source: Energy and Environmental Economics, Inc.
As shown in the figure above, the hourly value of avoided cost of electricity in the average consumer analysis is made up of a number of components including: the wholesale value of
20
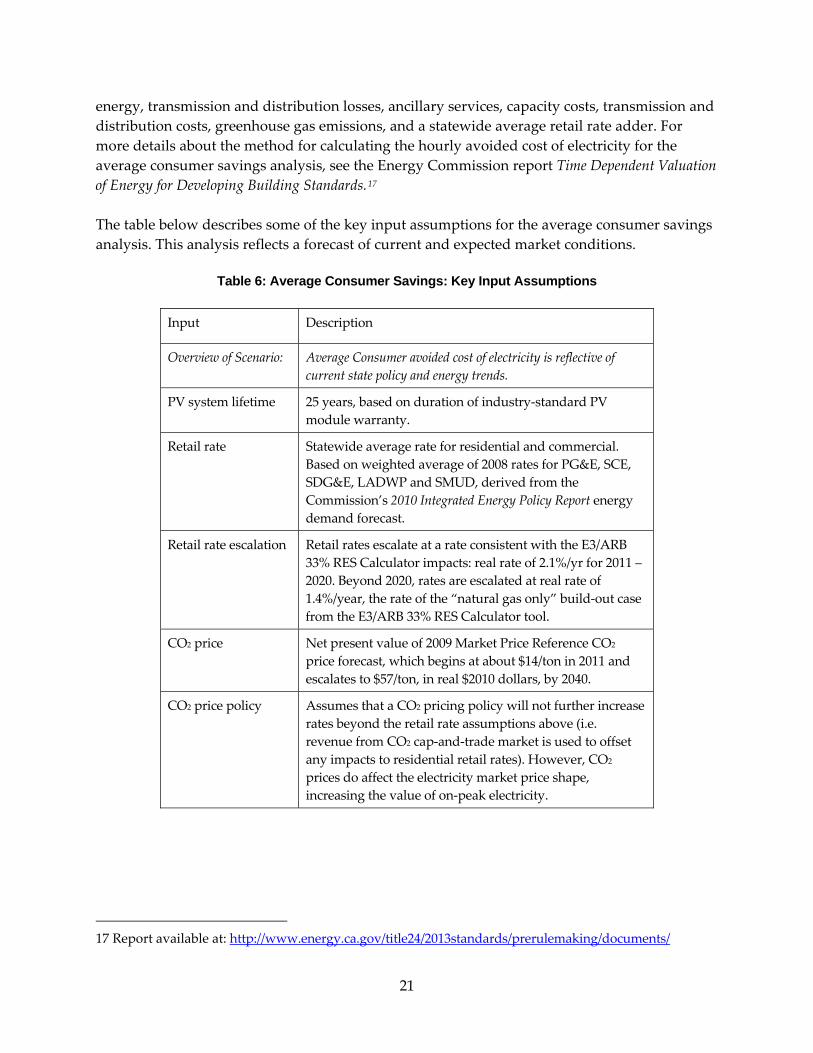
energy, transmission and distribution losses, ancillary services, capacity costs, transmission and distribution costs, greenhouse gas emissions, and a statewide average retail rate adder. For more details about the method for calculating the hourly avoided cost of electricity for the average consumer savings analysis, see the Energy Commission report Time Dependent Valuation of Energy for Developing Building Standards.17 The table below describes some of the key input assumptions for the average consumer savings analysis. This analysis reflects a forecast of current and expected market conditions.
Table 6: Average Consumer Savings: Key Input Assumptions
Input Description
Overview of Scenario: Average Consumer avoided cost of electricity is reflective of current state policy and energy trends.
PV system lifetime 25 years, based on duration of industry‐standard PV module warranty.
Retail rate Statewide average rate for residential and commercial. Based on weighted average of 2008 rates for PG&E, SCE, SDG&E, LADWP and SMUD, derived from the Commission’s 2010 Integrated Energy Policy Report energy demand forecast.
Retail rate escalation Retail rates escalate at a rate consistent with the E3/ARB 33% RES Calculator impacts: real rate of 2.1%/yr for 2011 – 2020. Beyond 2020, rates are escalated at real rate of 1.4%/year, the rate of the “natural gas only” build‐out case from the E3/ARB 33% RES Calculator tool.
CO2 price Net present value of 2009 Market Price Reference CO2 price forecast, which begins at about $14/ton in 2011 and escalates to $57/ton, in real $2010 dollars, by 2040.
CO2 price policy Assumes that a CO2 pricing policy will not further increase rates beyond the retail rate assumptions above (i.e. revenue from CO2 cap‐and‐trade market is used to offset any impacts to residential retail rates). However, CO2 prices do affect the electricity market price shape, increasing the value of on‐peak electricity.
17 Report available at: http://www.energy.ca.gov/title24/2013standards/prerulemaking/documents/
21
Input Description
Electricity market price shape
The market price shape of electricity in 2020 is determined by the “High Wind” 33% RES case developed as part of the Commission’s “Electricity System Implications of 33 Percent Renewables” Study completed in June 29, 2009. For years between 2008 and 2020, the change in the market price shape is based on an hourly linear extrapolation. No changes to the market price shape are forecast beyond 2020.
Other Policies (AB 32 Scoping Plan, Once‐through cooling regulations)
Assumes statewide energy efficiency, rooftop PV and combined heat and power generation by 2020 are consistent with the AB 32 Scoping Plan goals and statewide compliance with proposed regulations on once‐through cooling of coastal thermal power plants. The impact of these policies is reflected in the market price shape from the “High Wind” 33% RES case developed as part of the Commission’s Electricity System Implications of 33 Percent Renewables study completed in June 29, 2009.
Real Discount Rate 3% real discount rate, consistent with Building Energy Efficiency Standards assumptions.
Source: Energy and Environmental Economics, Inc.
Using these input assumptions, the analysis shows that on a life‐cycle (levelized) basis, the value of PV generation is expected to range from $0.27/kWh ‐ $0.29/kWh for a residential PV system installed in 2014, depending on the climate zone. The example in Figure 9 below shows the components of the overall PV benefits in Climate Zone 3 for a residential system. The total life‐cycle benefits of residential rooftop PV in Climate Zone 3 total $0.28/kWh in 2014.
22
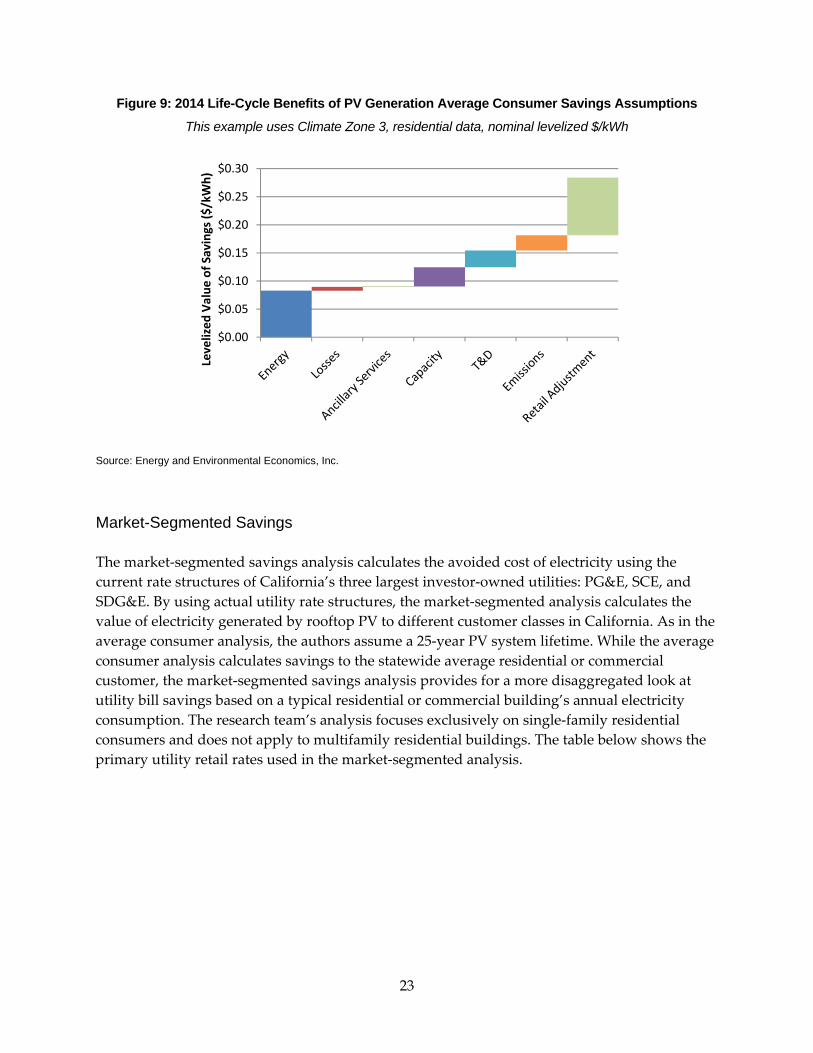
Figure 9: 2014 Life-Cycle Benefits of PV Generation Average Consumer Savings Assumptions
This example uses Climate Zone 3, residential data, nominal levelized $/kWh
$0.00
$0.05
$0.10
$0.15
$0.20
$0.25
$0.30
Levelized
Value
of Savings ($
/kWh)
Source: Energy and Environmental Economics, Inc.
Market-Segmented Savings
The market‐segmented savings analysis calculates the avoided cost of electricity using the current rate structures of California’s three largest investor‐owned utilities: PG&E, SCE, and SDG&E. By using actual utility rate structures, the market‐segmented analysis calculates the value of electricity generated by rooftop PV to different customer classes in California. As in the average consumer analysis, the authors assume a 25‐year PV system lifetime. While the average consumer analysis calculates savings to the statewide average residential or commercial customer, the market‐segmented savings analysis provides for a more disaggregated look at utility bill savings based on a typical residential or commercial building’s annual electricity consumption. The research team’s analysis focuses exclusively on single‐family residential consumers and does not apply to multifamily residential buildings. The table below shows the primary utility retail rates used in the market‐segmented analysis.
23
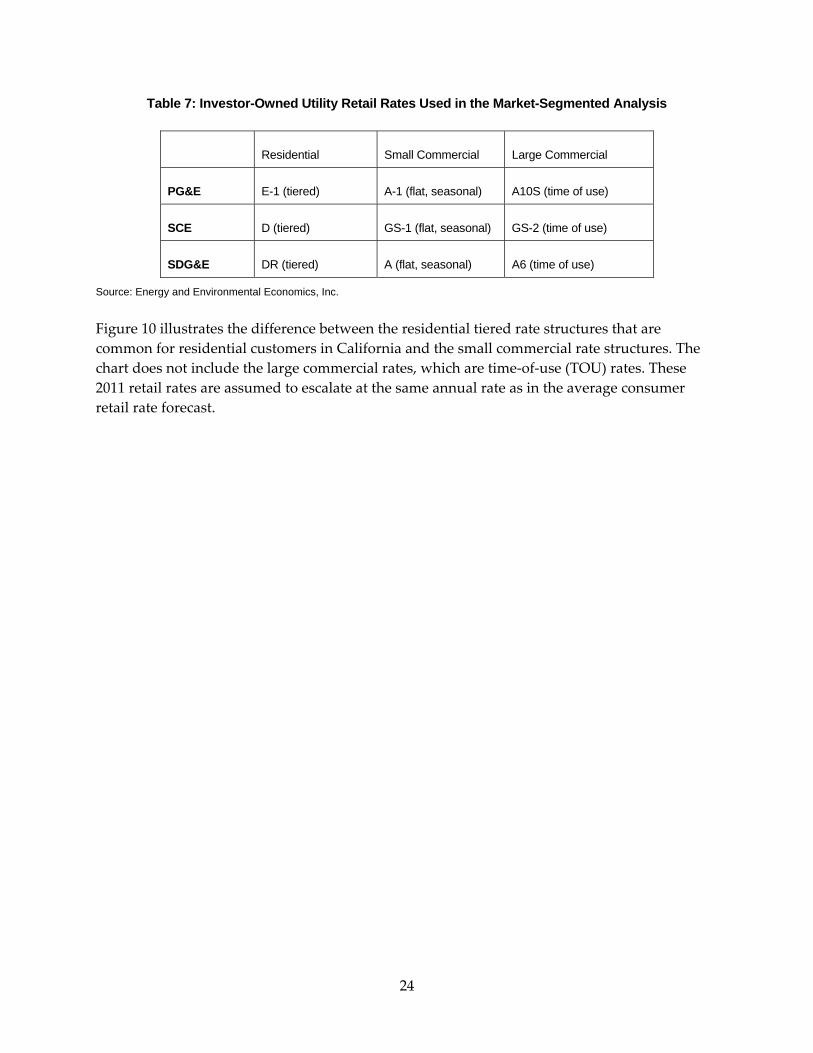
Table 7: Investor-Owned Utility Retail Rates Used in the Market-Segmented Analysis
Residential Small Commercial Large Commercial
PG&E E-1 (tiered) A-1 (flat, seasonal) A10S (time of use)
SCE D (tiered) GS-1 (flat, seasonal) GS-2 (time of use)
SDG&E DR (tiered) A (flat, seasonal) A6 (time of use)
Source: Energy and Environmental Economics, Inc.
Figure 10 illustrates the difference between the residential tiered rate structures that are common for residential customers in California and the small commercial rate structures. The chart does not include the large commercial rates, which are time‐of‐use (TOU) rates. These 2011 retail rates are assumed to escalate at the same annual rate as in the average consumer retail rate forecast.
24
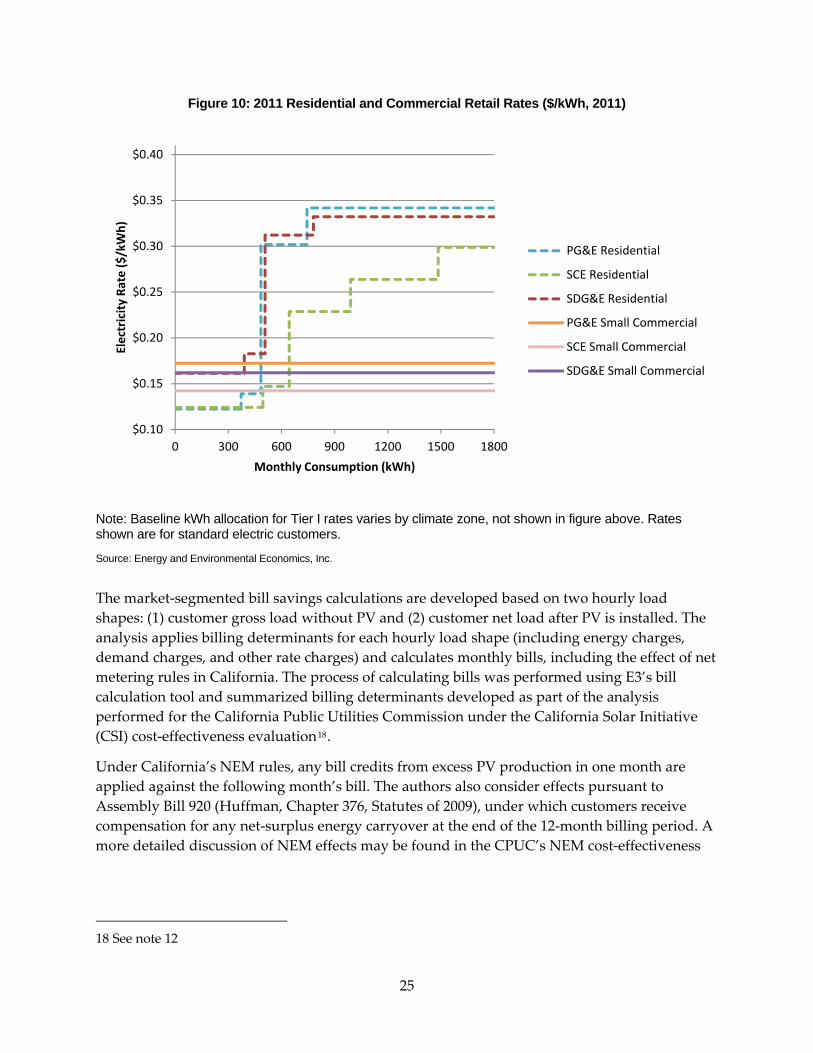
Figure 10: 2011 Residential and Commercial Retail Rates ($/kWh, 2011)
$0.10
$0.15
$0.20
$0.25
$0.30
$0.35
$0.40
0 300 600 900 1200 1500 1800
Electricity Ra
te ($
/kWh)
Monthly Consumption (kWh)
PG&E Residential
SCE Residential
SDG&E Residential
PG&E Small Commercial
SCE Small Commercial
SDG&E Small Commercial
Note: Baseline kWh allocation for Tier I rates varies by climate zone, not shown in figure above. Rates shown are for standard electric customers.
Source: Energy and Environmental Economics, Inc.
The market‐segmented bill savings calculations are developed based on two hourly load shapes: (1) customer gross load without PV and (2) customer net load after PV is installed. The analysis applies billing determinants for each hourly load shape (including energy charges, demand charges, and other rate charges) and calculates monthly bills, including the effect of net metering rules in California. The process of calculating bills was performed using E3’s bill calculation tool and summarized billing determinants developed as part of the analysis performed for the California Public Utilities Commission under the California Solar Initiative (CSI) cost‐effectiveness evaluation18.
Under California’s NEM rules, any bill credits from excess PV production in one month are applied against the following month’s bill. The authors also consider effects pursuant to Assembly Bill 920 (Huffman, Chapter 376, Statutes of 2009), under which customers receive compensation for any net‐surplus energy carryover at the end of the 12‐month billing period. A more detailed discussion of NEM effects may be found in the CPUC’s NEM cost‐effectiveness
18 See note 12
25
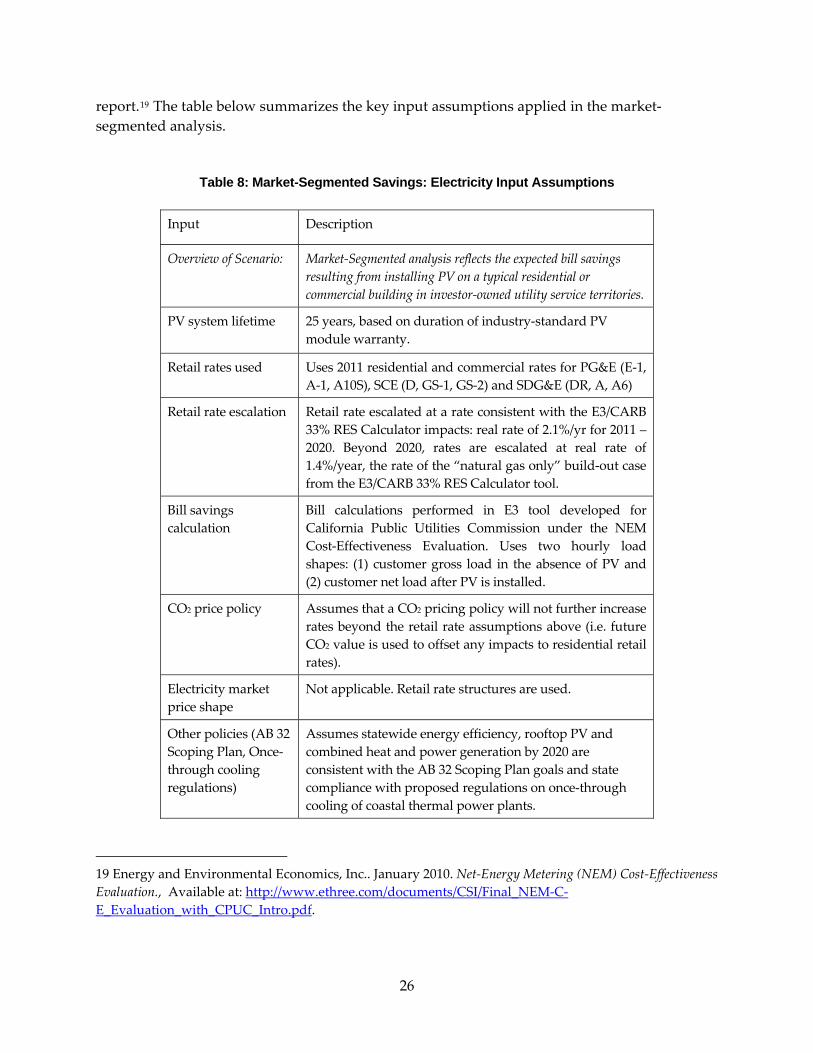
report.19 The table below summarizes the key input assumptions applied in the market‐segmented analysis.
Table 8: Market-Segmented Savings: Electricity Input Assumptions
Input Description
Overview of Scenario: Market‐Segmented analysis reflects the expected bill savings resulting from installing PV on a typical residential or commercial building in investor‐owned utility service territories.
PV system lifetime 25 years, based on duration of industry‐standard PV module warranty.
Retail rates used Uses 2011 residential and commercial rates for PG&E (E‐1, A‐1, A10S), SCE (D, GS‐1, GS‐2) and SDG&E (DR, A, A6)
Retail rate escalation Retail rate escalated at a rate consistent with the E3/CARB 33% RES Calculator impacts: real rate of 2.1%/yr for 2011 – 2020. Beyond 2020, rates are escalated at real rate of 1.4%/year, the rate of the “natural gas only” build‐out case from the E3/CARB 33% RES Calculator tool.
Bill savings calculation
Bill calculations performed in E3 tool developed for California Public Utilities Commission under the NEM Cost‐Effectiveness Evaluation. Uses two hourly load shapes: (1) customer gross load in the absence of PV and (2) customer net load after PV is installed.
CO2 price policy Assumes that a CO2 pricing policy will not further increase rates beyond the retail rate assumptions above (i.e. future CO2 value is used to offset any impacts to residential retail rates).
Electricity market price shape
Not applicable. Retail rate structures are used.
Other policies (AB 32 Scoping Plan, Once‐through cooling regulations)
Assumes statewide energy efficiency, rooftop PV and combined heat and power generation by 2020 are consistent with the AB 32 Scoping Plan goals and state compliance with proposed regulations on once‐through cooling of coastal thermal power plants.
19 Energy and Environmental Economics, Inc.. January 2010. Net‐Energy Metering (NEM) Cost‐Effectiveness Evaluation., Available at: http://www.ethree.com/documents/CSI/Final_NEM‐C‐E_Evaluation_with_CPUC_Intro.pdf.
26

Input Description
Real discount rate Residential: 3.43%, reflective of a low interest rate mortgage‐style cost of borrowing Nonresidential: 6.13%, reflective of the commercial cost of borrowing
27
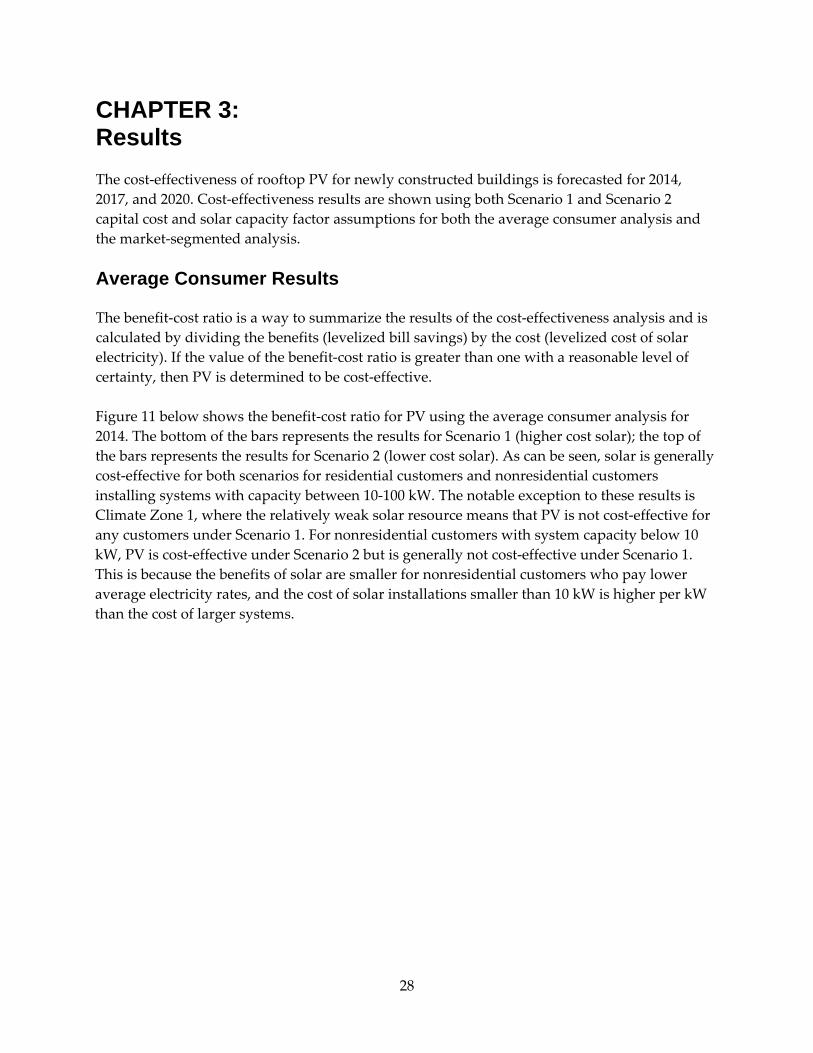
CHAPTER 3: Results The cost‐effectiveness of rooftop PV for newly constructed buildings is forecasted for 2014, 2017, and 2020. Cost‐effectiveness results are shown using both Scenario 1 and Scenario 2 capital cost and solar capacity factor assumptions for both the average consumer analysis and the market‐segmented analysis. Average Consumer Results The benefit‐cost ratio is a way to summarize the results of the cost‐effectiveness analysis and is calculated by dividing the benefits (levelized bill savings) by the cost (levelized cost of solar electricity). If the value of the benefit‐cost ratio is greater than one with a reasonable level of certainty, then PV is determined to be cost‐effective. Figure 11 below shows the benefit‐cost ratio for PV using the average consumer analysis for 2014. The bottom of the bars represents the results for Scenario 1 (higher cost solar); the top of the bars represents the results for Scenario 2 (lower cost solar). As can be seen, solar is generally cost‐effective for both scenarios for residential customers and nonresidential customers installing systems with capacity between 10‐100 kW. The notable exception to these results is Climate Zone 1, where the relatively weak solar resource means that PV is not cost‐effective for any customers under Scenario 1. For nonresidential customers with system capacity below 10 kW, PV is cost‐effective under Scenario 2 but is generally not cost‐effective under Scenario 1. This is because the benefits of solar are smaller for nonresidential customers who pay lower average electricity rates, and the cost of solar installations smaller than 10 kW is higher per kW than the cost of larger systems.
28
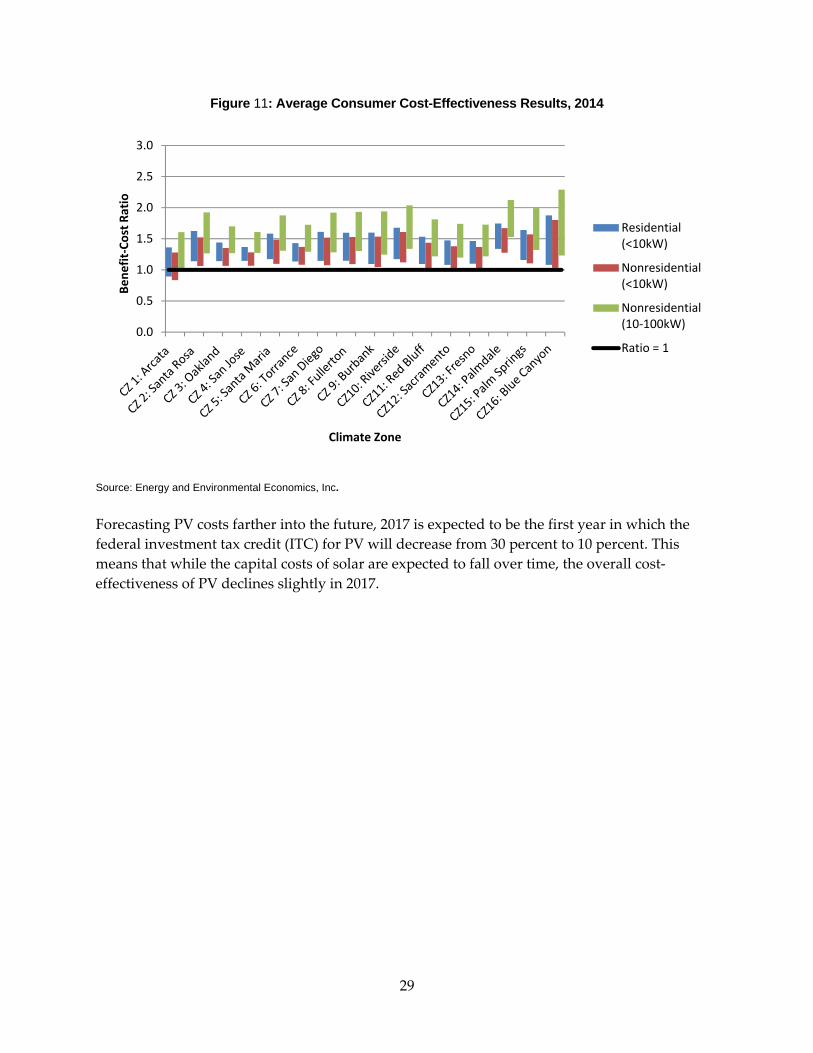
Figure 11: Average Consumer Cost-Effectiveness Results, 2014
0.0
0.5
1.0
1.5
2.0
2.5
3.0
Bene
fit‐Cost R
atio
Climate Zone
Residential (<10kW)
Nonresidential (<10kW)
Nonresidential(10‐100kW)
Ratio = 1
Source: Energy and Environmental Economics, Inc.
Forecasting PV costs farther into the future, 2017 is expected to be the first year in which the federal investment tax credit (ITC) for PV will decrease from 30 percent to 10 percent. This means that while the capital costs of solar are expected to fall over time, the overall cost‐effectiveness of PV declines slightly in 2017.
29
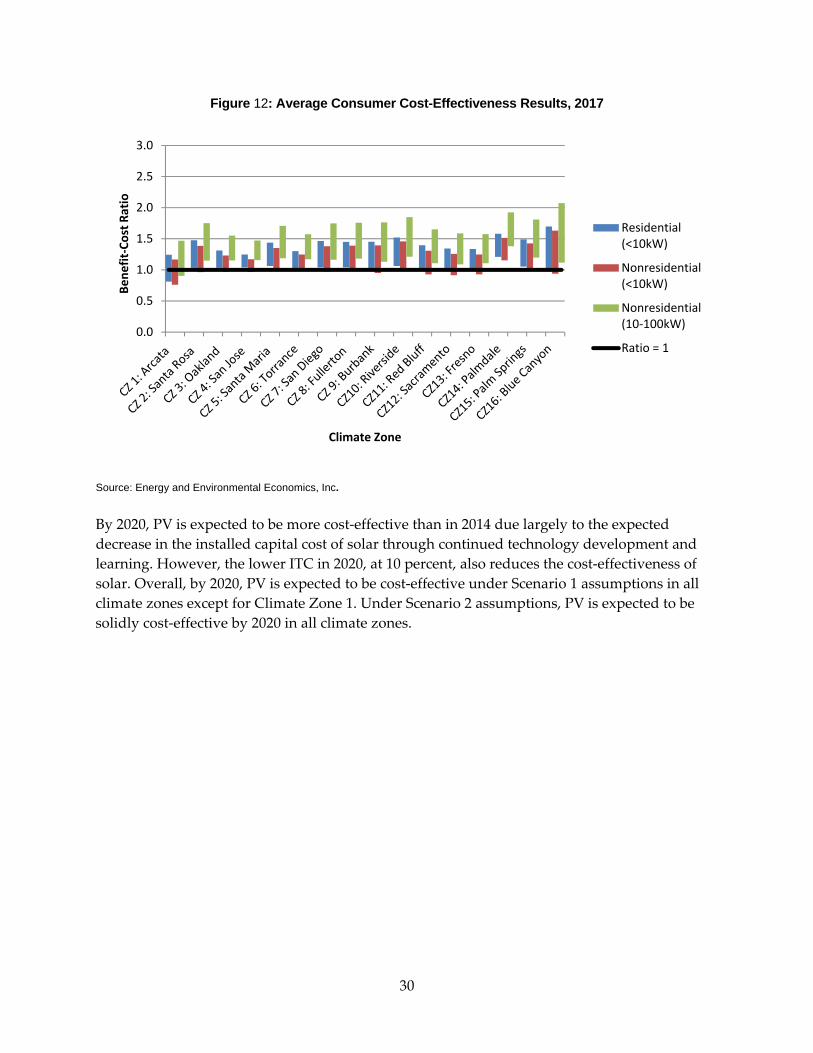
Figure 12: Average Consumer Cost-Effectiveness Results, 2017
0.0
0.5
1.0
1.5
2.0
2.5
3.0
Bene
fit‐Cost R
atio
Climate Zone
Residential (<10kW)
Nonresidential (<10kW)
Nonresidential(10‐100kW)
Ratio = 1
Source: Energy and Environmental Economics, Inc.
By 2020, PV is expected to be more cost‐effective than in 2014 due largely to the expected decrease in the installed capital cost of solar through continued technology development and learning. However, the lower ITC in 2020, at 10 percent, also reduces the cost‐effectiveness of solar. Overall, by 2020, PV is expected to be cost‐effective under Scenario 1 assumptions in all climate zones except for Climate Zone 1. Under Scenario 2 assumptions, PV is expected to be solidly cost‐effective by 2020 in all climate zones.
30
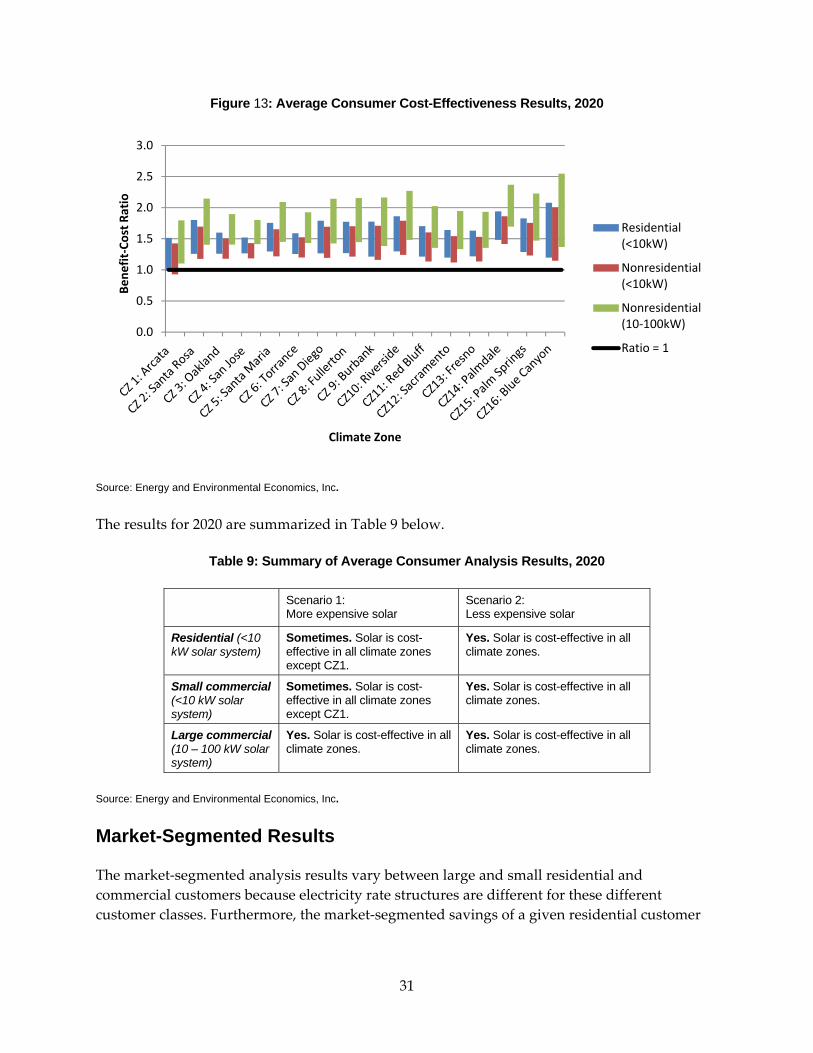
Figure 13: Average Consumer Cost-Effectiveness Results, 2020
0.0
0.5
1.0
1.5
2.0
2.5
3.0
Bene
fit‐Cost R
atio
Climate Zone
Residential (<10kW)
Nonresidential (<10kW)
Nonresidential(10‐100kW)
Ratio = 1
Source: Energy and Environmental Economics, Inc.
The results for 2020 are summarized in Table 9 below.
Table 9: Summary of Average Consumer Analysis Results, 2020
Scenario 1: More expensive solar
Scenario 2: Less expensive solar
Residential (<10 kW solar system)
Sometimes. Solar is cost-effective in all climate zones except CZ1.
Yes. Solar is cost-effective in all climate zones.
Small commercial (<10 kW solar system)
Sometimes. Solar is cost-effective in all climate zones except CZ1.
Yes. Solar is cost-effective in all climate zones.
Large commercial (10 – 100 kW solar system)
Yes. Solar is cost-effective in all climate zones.
Yes. Solar is cost-effective in all climate zones.
Source: Energy and Environmental Economics, Inc.
Market-Segmented Results The market‐segmented analysis results vary between large and small residential and commercial customers because electricity rate structures are different for these different customer classes. Furthermore, the market‐segmented savings of a given residential customer
31
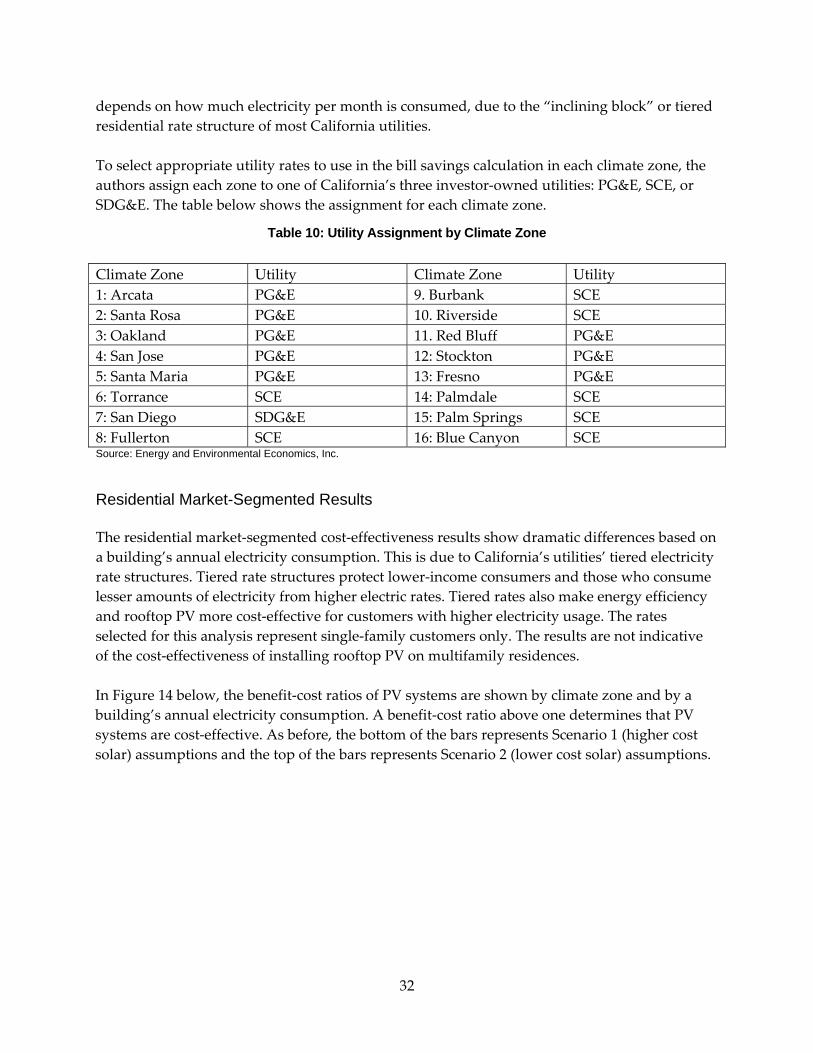
depends on how much electricity per month is consumed, due to the “inclining block” or tiered residential rate structure of most California utilities. To select appropriate utility rates to use in the bill savings calculation in each climate zone, the authors assign each zone to one of California’s three investor‐owned utilities: PG&E, SCE, or SDG&E. The table below shows the assignment for each climate zone.
Table 10: Utility Assignment by Climate Zone
Climate Zone Utility Climate Zone Utility 1: Arcata PG&E 9. Burbank SCE 2: Santa Rosa PG&E 10. Riverside SCE 3: Oakland PG&E 11. Red Bluff PG&E 4: San Jose PG&E 12: Stockton PG&E 5: Santa Maria PG&E 13: Fresno PG&E 6: Torrance SCE 14: Palmdale SCE 7: San Diego SDG&E 15: Palm Springs SCE 8: Fullerton SCE 16: Blue Canyon SCE Source: Energy and Environmental Economics, Inc.
Residential Market-Segmented Results The residential market‐segmented cost‐effectiveness results show dramatic differences based on a building’s annual electricity consumption. This is due to California’s utilities’ tiered electricity rate structures. Tiered rate structures protect lower‐income consumers and those who consume lesser amounts of electricity from higher electric rates. Tiered rates also make energy efficiency and rooftop PV more cost‐effective for customers with higher electricity usage. The rates selected for this analysis represent single‐family customers only. The results are not indicative of the cost‐effectiveness of installing rooftop PV on multifamily residences. In Figure 14 below, the benefit‐cost ratios of PV systems are shown by climate zone and by a building’s annual electricity consumption. A benefit‐cost ratio above one determines that PV systems are cost‐effective. As before, the bottom of the bars represents Scenario 1 (higher cost solar) assumptions and the top of the bars represents Scenario 2 (lower cost solar) assumptions.
32
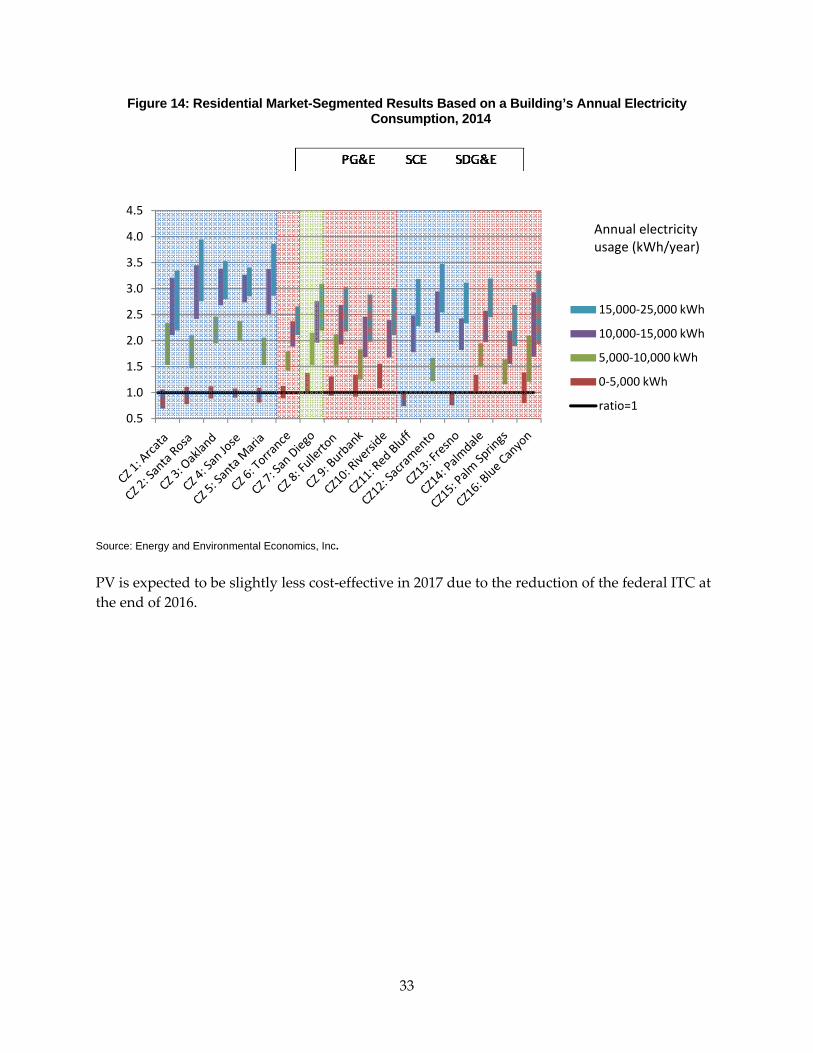
Figure 14: Residential Market-Segmented Results Based on a Building’s Annual Electricity Consumption, 2014
0.5
1.0
1.5
2.0
2.5
3.0
3.5
4.0
4.5
15,000‐25,000 kWh
10,000‐15,000 kWh
5,000‐10,000 kWh
0‐5,000 kWh
ratio=1
Annual electricityusage (kWh/year)
Source: Energy and Environmental Economics, Inc.
PV is expected to be slightly less cost‐effective in 2017 due to the reduction of the federal ITC at the end of 2016.
33
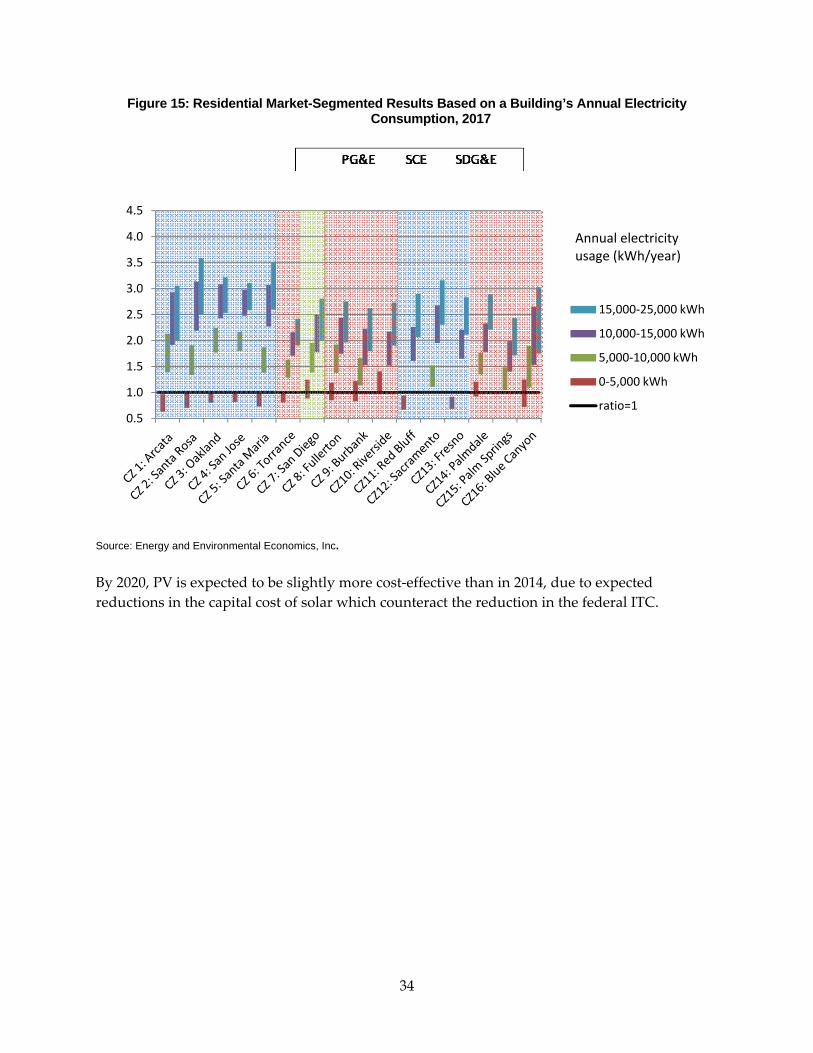
Figure 15: Residential Market-Segmented Results Based on a Building’s Annual Electricity Consumption, 2017
0.5
1.0
1.5
2.0
2.5
3.0
3.5
4.0
4.5
15,000‐25,000 kWh
10,000‐15,000 kWh
5,000‐10,000 kWh
0‐5,000 kWh
ratio=1
Annual electricity usage (kWh/year)
Source: Energy and Environmental Economics, Inc.
By 2020, PV is expected to be slightly more cost‐effective than in 2014, due to expected reductions in the capital cost of solar which counteract the reduction in the federal ITC.
34
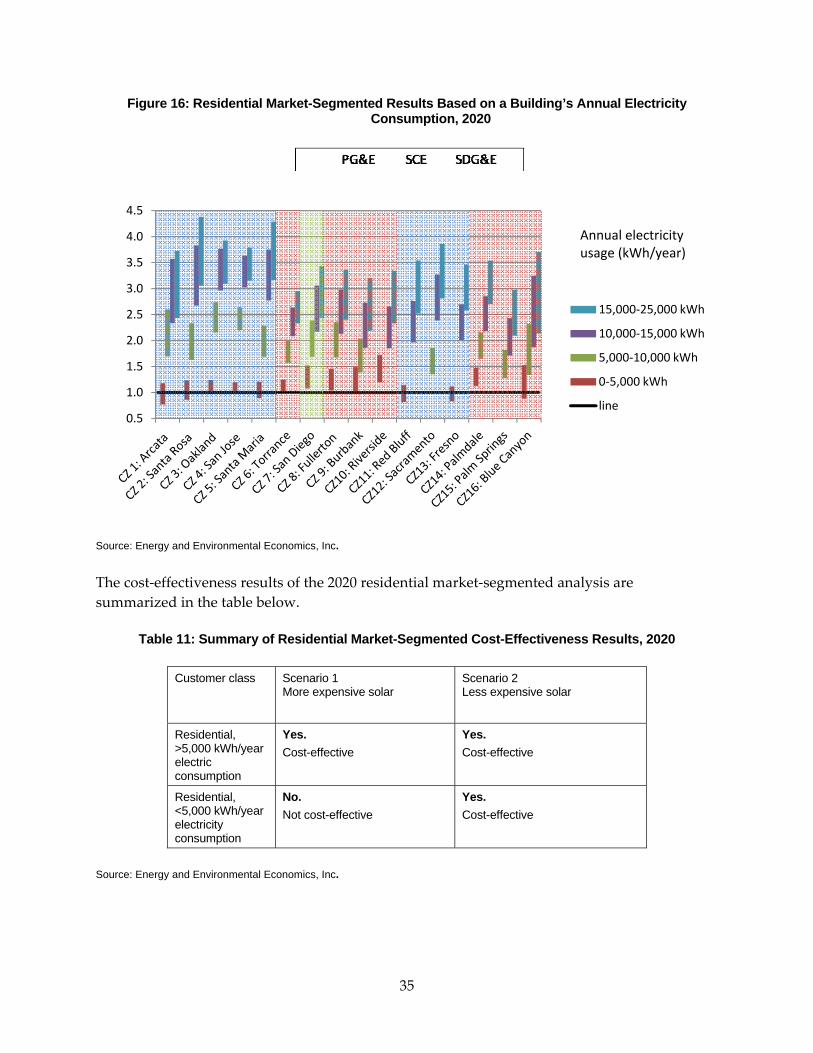
Figure 16: Residential Market-Segmented Results Based on a Building’s Annual Electricity Consumption, 2020
0.5
1.0
1.5
2.0
2.5
3.0
3.5
4.0
4.5
15,000‐25,000 kWh
10,000‐15,000 kWh
5,000‐10,000 kWh
0‐5,000 kWh
line
Annual electricity usage (kWh/year)
Source: Energy and Environmental Economics, Inc.
The cost‐effectiveness results of the 2020 residential market‐segmented analysis are summarized in the table below.
Table 11: Summary of Residential Market-Segmented Cost-Effectiveness Results, 2020
Customer class Scenario 1 More expensive solar
Scenario 2 Less expensive solar
Residential, >5,000 kWh/year electric consumption
Yes. Cost-effective
Yes. Cost-effective
Residential, <5,000 kWh/year electricity consumption
No. Not cost-effective
Yes. Cost-effective
Source: Energy and Environmental Economics, Inc.
35
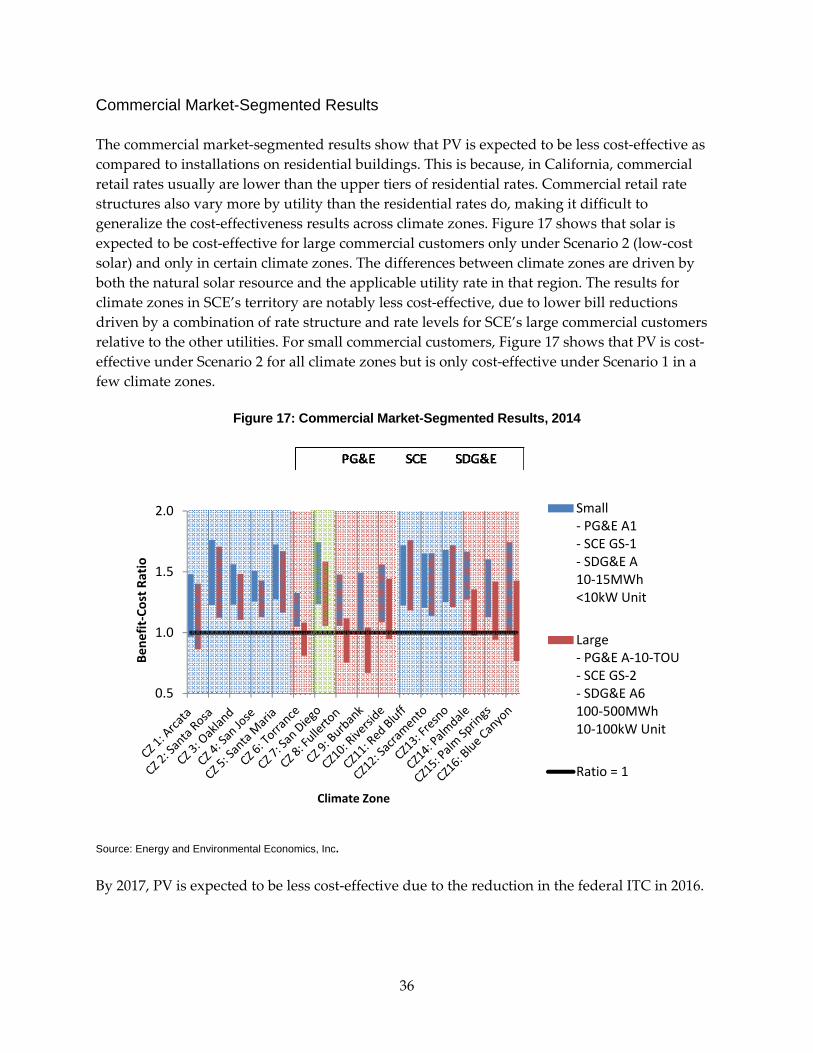
Commercial Market-Segmented Results
The commercial market‐segmented results show that PV is expected to be less cost‐effective as compared to installations on residential buildings. This is because, in California, commercial retail rates usually are lower than the upper tiers of residential rates. Commercial retail rate structures also vary more by utility than the residential rates do, making it difficult to generalize the cost‐effectiveness results across climate zones. Figure 17 shows that solar is expected to be cost‐effective for large commercial customers only under Scenario 2 (low‐cost solar) and only in certain climate zones. The differences between climate zones are driven by both the natural solar resource and the applicable utility rate in that region. The results for climate zones in SCE’s territory are notably less cost‐effective, due to lower bill reductions driven by a combination of rate structure and rate levels for SCE’s large commercial customers relative to the other utilities. For small commercial customers, Figure 17 shows that PV is cost‐effective under Scenario 2 for all climate zones but is only cost‐effective under Scenario 1 in a few climate zones.
Figure 17: Commercial Market-Segmented Results, 2014
0.5
1.0
1.5
2.0
Bene
fit‐Cost R
atio
Climate Zone
Small ‐ PG&E A1‐ SCE GS‐1‐ SDG&E A10‐15MWh<10kW Unit
Large ‐ PG&E A‐10‐TOU‐ SCE GS‐2‐ SDG&E A6100‐500MWh10‐100kW Unit
Ratio = 1
Source: Energy and Environmental Economics, Inc.
By 2017, PV is expected to be less cost‐effective due to the reduction in the federal ITC in 2016.
36
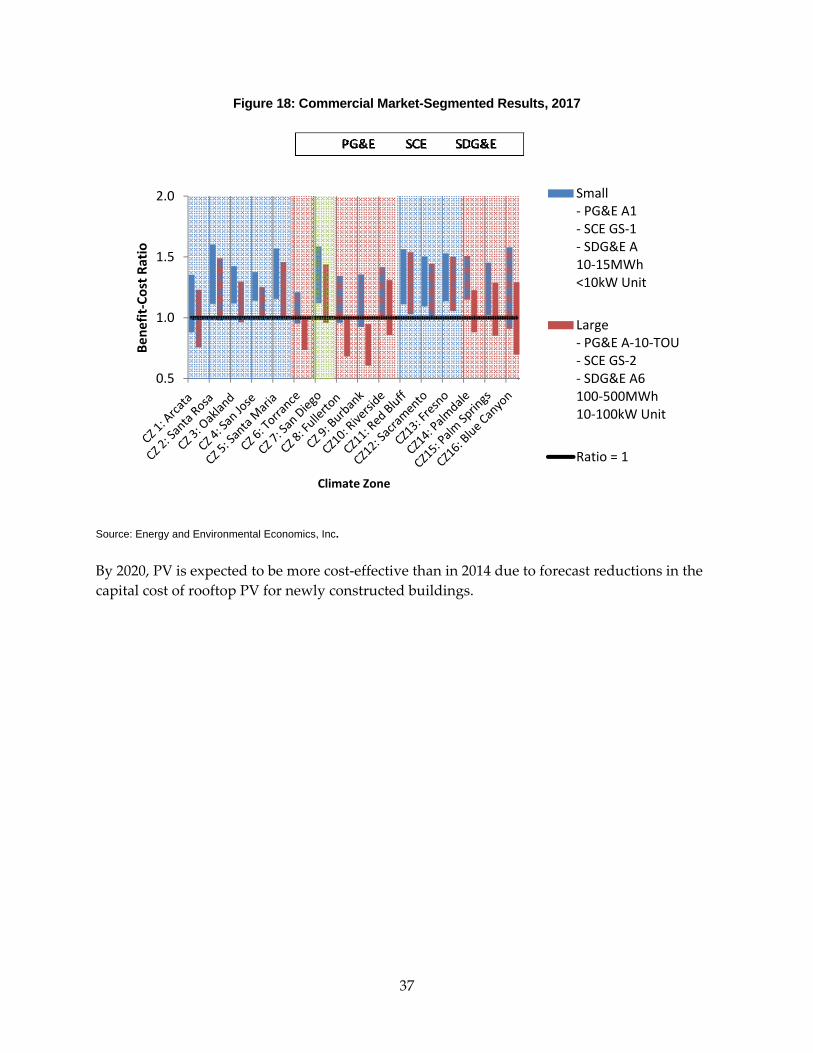
Figure 18: Commercial Market-Segmented Results, 2017
0.5
1.0
1.5
2.0
Bene
fit‐Cost Ra
tio
Climate Zone
Small ‐ PG&E A1‐ SCE GS‐1‐ SDG&E A10‐15MWh<10kW Unit
Large ‐ PG&E A‐10‐TOU‐ SCE GS‐2‐ SDG&E A6100‐500MWh10‐100kW Unit
Ratio = 1
Source: Energy and Environmental Economics, Inc.
By 2020, PV is expected to be more cost‐effective than in 2014 due to forecast reductions in the capital cost of rooftop PV for newly constructed buildings.
37
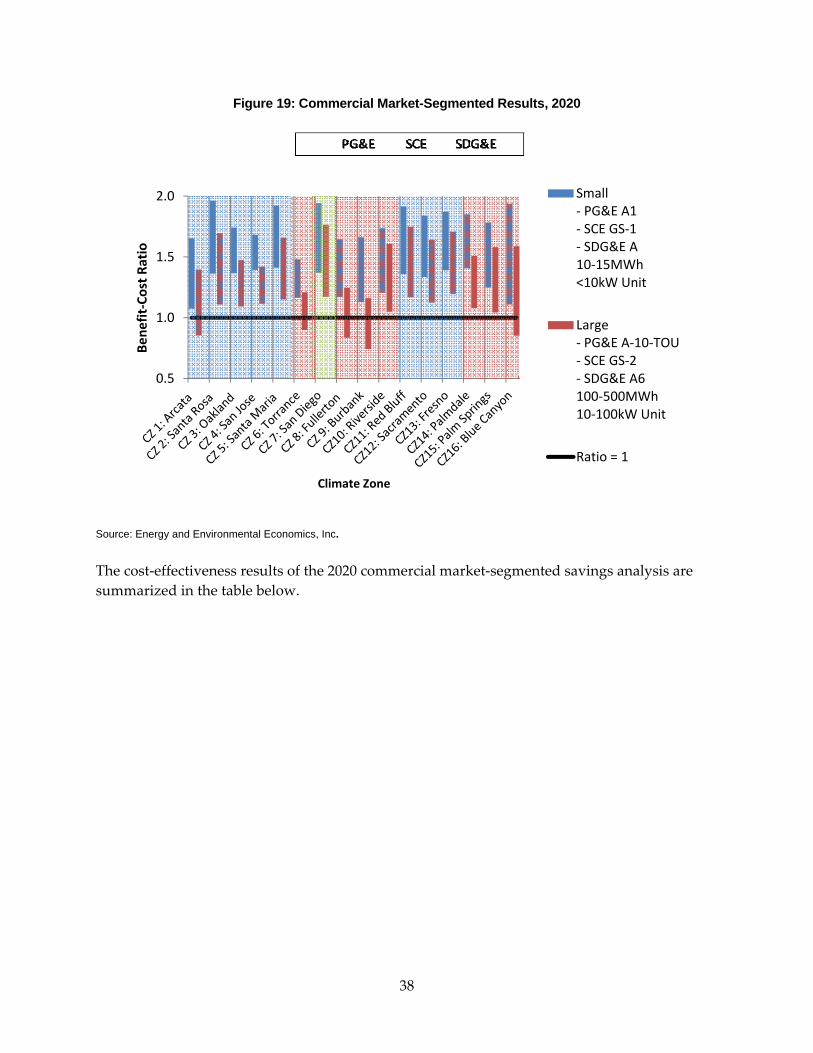
Figure 19: Commercial Market-Segmented Results, 2020
0.5
1.0
1.5
2.0
Bene
fit‐Cost Ra
tio
Climate Zone
Small ‐ PG&E A1‐ SCE GS‐1‐ SDG&E A10‐15MWh<10kW Unit
Large ‐ PG&E A‐10‐TOU‐ SCE GS‐2‐ SDG&E A6100‐500MWh10‐100kW Unit
Ratio = 1
Source: Energy and Environmental Economics, Inc.
The cost‐effectiveness results of the 2020 commercial market‐segmented savings analysis are summarized in the table below.
38
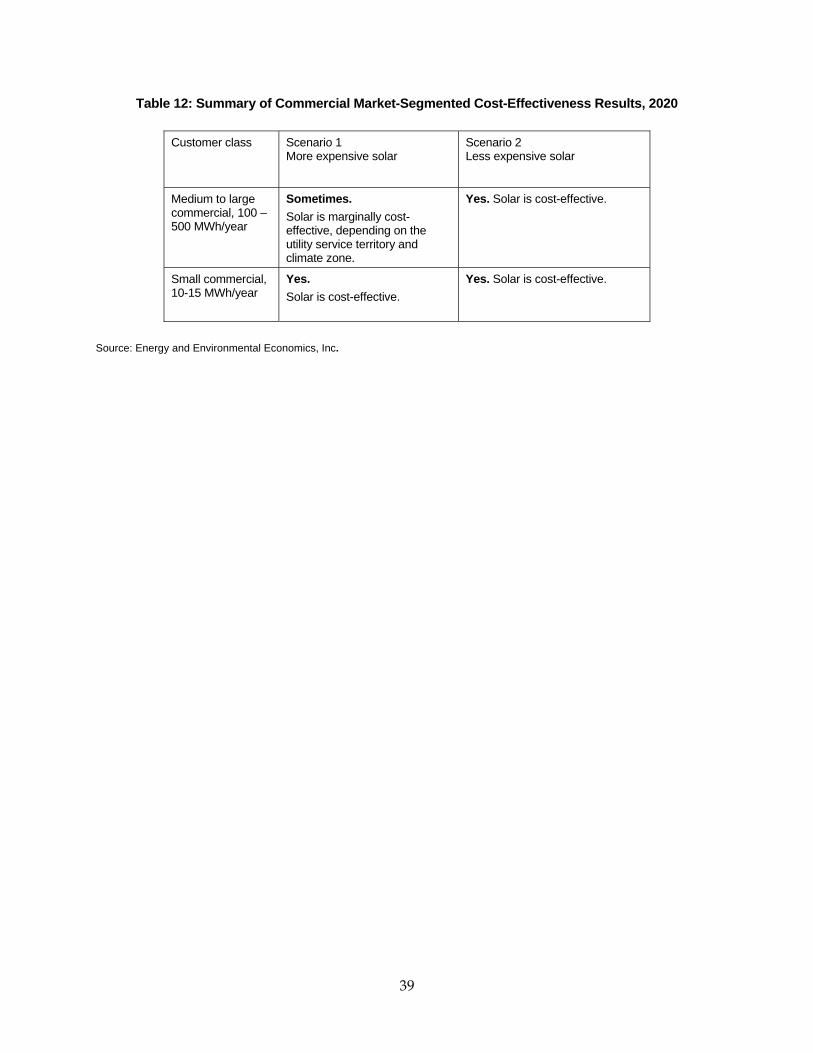
Table 12: Summary of Commercial Market-Segmented Cost-Effectiveness Results, 2020
Customer class Scenario 1 More expensive solar
Scenario 2 Less expensive solar
Medium to large commercial, 100 – 500 MWh/year
Sometimes. Solar is marginally cost-effective, depending on the utility service territory and climate zone.
Yes. Solar is cost-effective.
Small commercial, 10-15 MWh/year
Yes. Solar is cost-effective.
Yes. Solar is cost-effective.
Source: Energy and Environmental Economics, Inc.
39
CHAPTER 4: Summary of Results Evaluating the cost‐effectiveness of PV is a complex task, involving multiple uncertain variables. The authors have applied what they consider to be the best publicly available, unbiased assumptions about the future costs of PV. The conclusions in this report are based, in part, on the following key assumptions, which have a strong influence on the cost‐effectiveness results:
• Increase in retail electricity rates, at 2.11 percent per year through 2020 and at 1.46 percent per year thereafter, in real terms.
• In the market‐segmented analysis, existing utility retail rate structures (TOU rates and tiered rates) are maintained.
• Rooftop PV installations in the building standards are assumed to not qualify for state CSI and NSHP incentives but do qualify for the federal ITC.
Other key input assumptions that have a greater effect on the long‐term, 2017 and 2020, results include:
• Steadily falling capital costs for PV through 2020 due to industry economies of scale and the effect of “learning by doing” on installer costs.
• Current net‐energy metering rules remain applicable to all new PV installations. • Maintenance of the federal investment tax credit for PV at 30 percent through 2016 and
at 10 percent after 2016.
Any major changes to these assumptions could alter the cost‐effectiveness of PV. The market‐segmented results are especially sensitive to the structure of California utility rates and NEM rules, since they use utility bill savings to determine PV benefits and customer bill savings are very sensitive to rate structure under existing NEM policy. If the structure of utility rates is changed, for example by reducing energy‐based charges and increasing demand‐based and/or service charges, utility bill savings achieved installing PV could drop significantly. Similarly, if NEM were replaced with a different policy, for example, a flat compensation rate per kWh of distributed generation, the cost‐effectiveness of solar may decrease. In this report’s cost‐effectiveness projections, the research team assumes that utility rates and the NEM program will not change other than the overall forecasted rate level increase. Given the key assumptions above, the cost‐effectiveness results for each of the two analysis approaches are shown in the following tables.
40
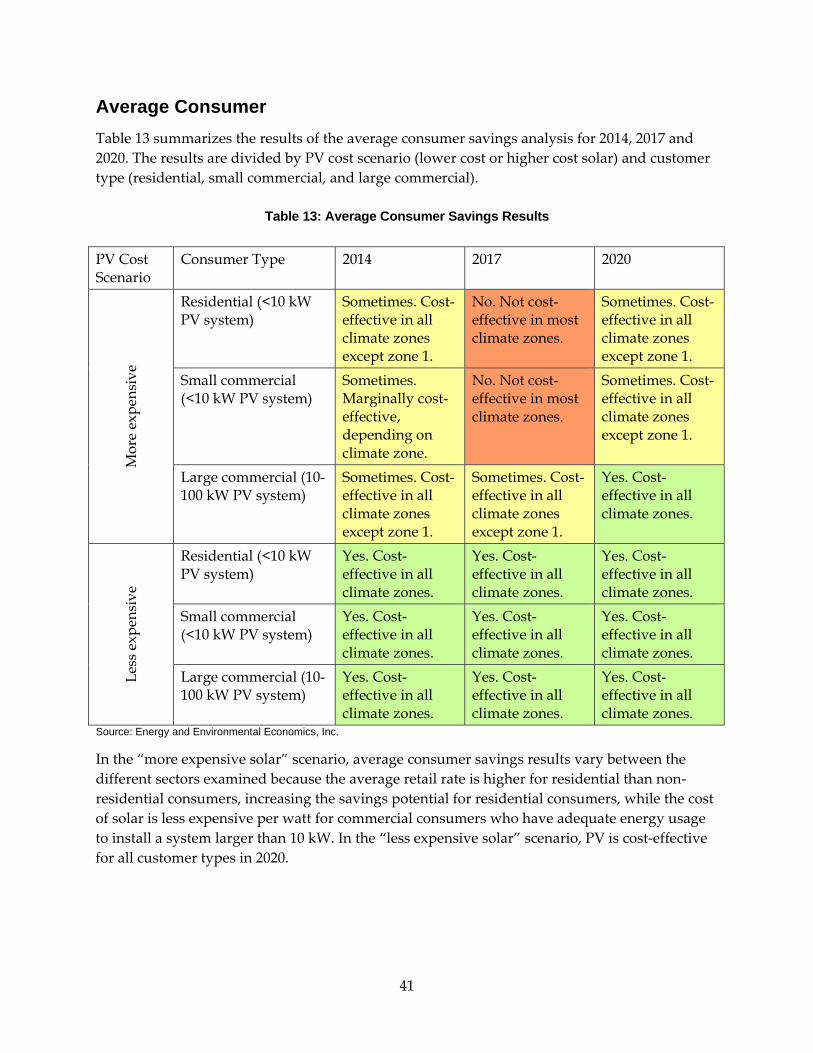
Average Consumer Table 13 summarizes the results of the average consumer savings analysis for 2014, 2017 and 2020. The results are divided by PV cost scenario (lower cost or higher cost solar) and customer type (residential, small commercial, and large commercial).
Table 13: Average Consumer Savings Results
PV Cost Scenario
Consumer Type 2014 2017 2020
Mor
e ex
pens
ive
Residential (<10 kW PV system)
Sometimes. Cost-effective in all climate zones except zone 1.
No. Not cost-effective in most climate zones.
Sometimes. Cost-effective in all climate zones except zone 1.
Small commercial (<10 kW PV system)
Sometimes. Marginally cost-effective, depending on climate zone.
No. Not cost-effective in most climate zones.
Sometimes. Cost-effective in all climate zones except zone 1.
Large commercial (10-100 kW PV system)
Sometimes. Cost-effective in all climate zones except zone 1.
Sometimes. Cost-effective in all climate zones except zone 1.
Yes. Cost-effective in all climate zones.
Less
exp
ensi
ve
Residential (<10 kW PV system)
Yes. Cost-effective in all climate zones.
Yes. Cost-effective in all climate zones.
Yes. Cost-effective in all climate zones.
Small commercial (<10 kW PV system)
Yes. Cost-effective in all climate zones.
Yes. Cost-effective in all climate zones.
Yes. Cost-effective in all climate zones.
Large commercial (10-100 kW PV system)
Yes. Cost-effective in all climate zones.
Yes. Cost-effective in all climate zones.
Yes. Cost-effective in all climate zones.
Source: Energy and Environmental Economics, Inc.
In the “more expensive solar” scenario, average consumer savings results vary between the different sectors examined because the average retail rate is higher for residential than non‐residential consumers, increasing the savings potential for residential consumers, while the cost of solar is less expensive per watt for commercial consumers who have adequate energy usage to install a system larger than 10 kW. In the “less expensive solar” scenario, PV is cost‐effective for all customer types in 2020.
41
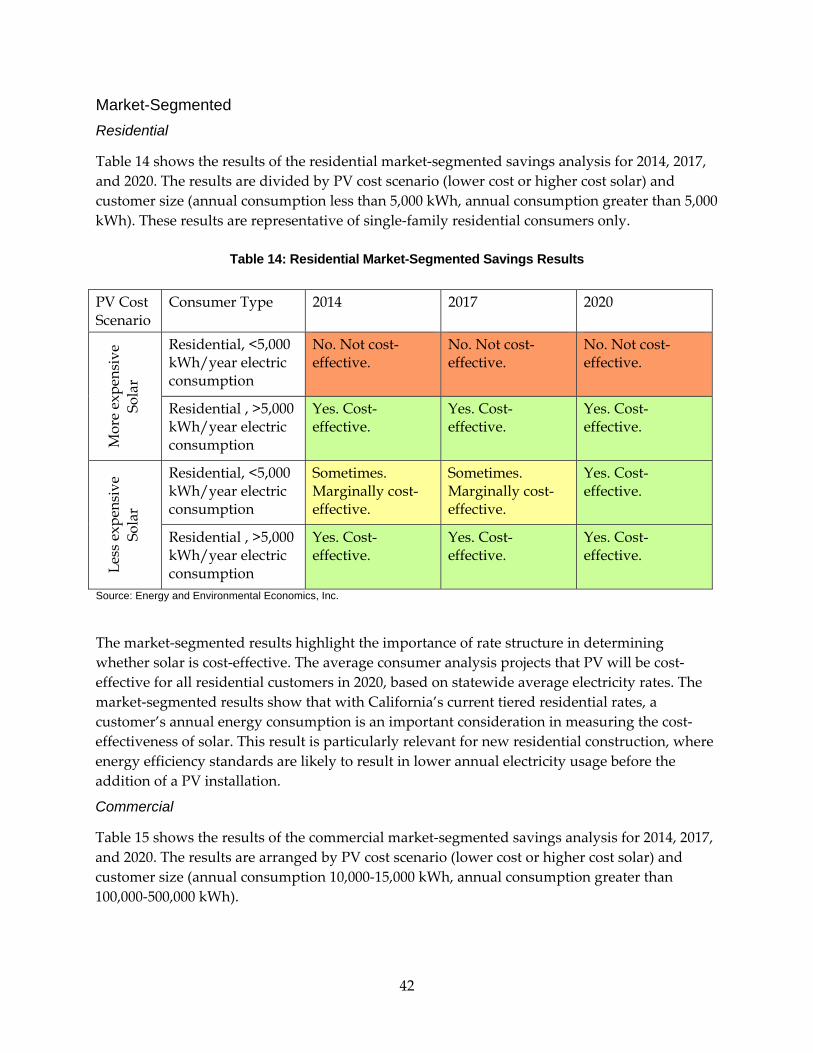
Market-Segmented Residential
Table 14 shows the results of the residential market‐segmented savings analysis for 2014, 2017, and 2020. The results are divided by PV cost scenario (lower cost or higher cost solar) and customer size (annual consumption less than 5,000 kWh, annual consumption greater than 5,000 kWh). These results are representative of single‐family residential consumers only.
Table 14: Residential Market-Segmented Savings Results
PV Cost Scenario
Consumer Type 2014 2017 2020
Mor
e ex
pens
ive
Sola
r
Residential, <5,000 kWh/year electric consumption
No. Not cost-effective.
No. Not cost-effective.
No. Not cost-effective.
Residential , >5,000 kWh/year electric consumption
Yes. Cost-effective.
Yes. Cost-effective.
Yes. Cost-effective.
Less
exp
ensi
ve
Sola
r
Residential, <5,000 kWh/year electric consumption
Sometimes. Marginally cost-effective.
Sometimes. Marginally cost-effective.
Yes. Cost-effective.
Residential , >5,000 kWh/year electric consumption
Yes. Cost-effective.
Yes. Cost-effective.
Yes. Cost-effective.
Source: Energy and Environmental Economics, Inc.
The market‐segmented results highlight the importance of rate structure in determining whether solar is cost‐effective. The average consumer analysis projects that PV will be cost‐effective for all residential customers in 2020, based on statewide average electricity rates. The market‐segmented results show that with California’s current tiered residential rates, a customer’s annual energy consumption is an important consideration in measuring the cost‐effectiveness of solar. This result is particularly relevant for new residential construction, where energy efficiency standards are likely to result in lower annual electricity usage before the addition of a PV installation.
Commercial
Table 15 shows the results of the commercial market‐segmented savings analysis for 2014, 2017, and 2020. The results are arranged by PV cost scenario (lower cost or higher cost solar) and customer size (annual consumption 10,000‐15,000 kWh, annual consumption greater than 100,000‐500,000 kWh).
42
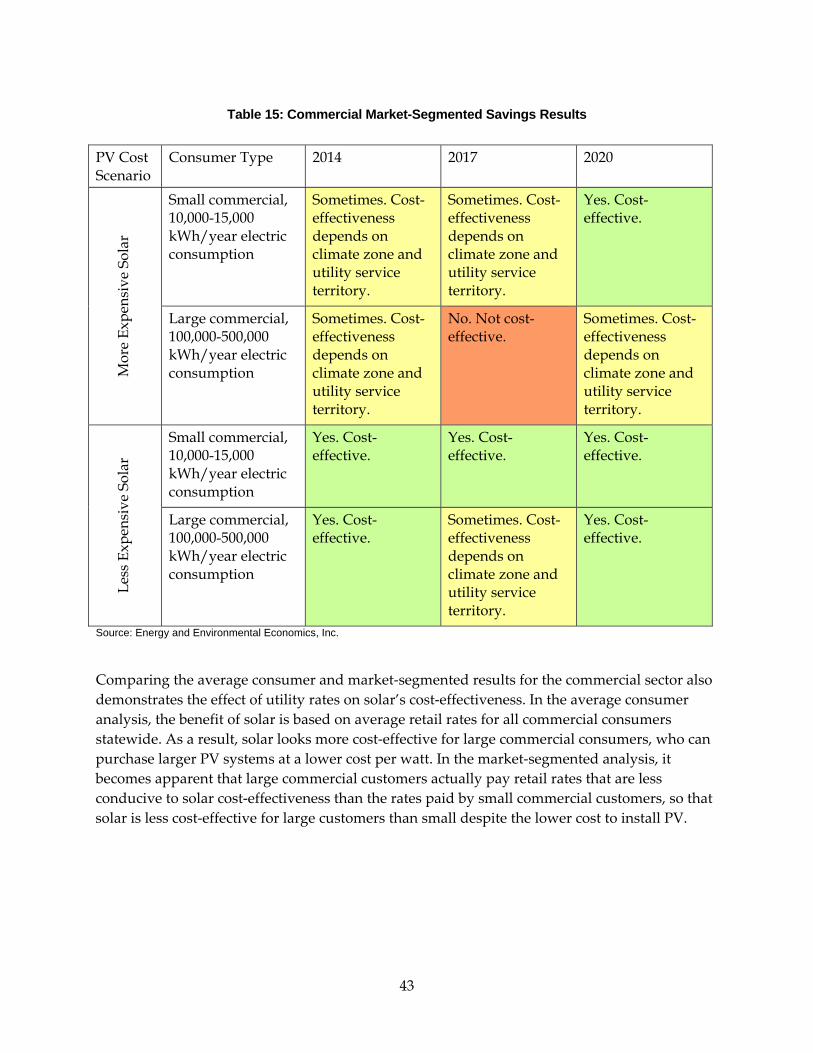
Table 15: Commercial Market-Segmented Savings Results
PV Cost Scenario
Consumer Type 2014 2017 2020
Mor
e Ex
pens
ive
Sola
r
Small commercial, 10,000-15,000 kWh/year electric consumption
Sometimes. Cost-effectiveness depends on climate zone and utility service territory.
Sometimes. Cost-effectiveness depends on climate zone and utility service territory.
Yes. Cost-effective.
Large commercial, 100,000-500,000 kWh/year electric consumption
Sometimes. Cost-effectiveness depends on climate zone and utility service territory.
No. Not cost-effective.
Sometimes. Cost-effectiveness depends on climate zone and utility service territory.
Less
Exp
ensi
ve S
olar
Small commercial, 10,000-15,000 kWh/year electric consumption
Yes. Cost-effective.
Yes. Cost-effective.
Yes. Cost-effective.
Large commercial, 100,000-500,000 kWh/year electric consumption
Yes. Cost-effective.
Sometimes. Cost-effectiveness depends on climate zone and utility service territory.
Yes. Cost-effective.
Source: Energy and Environmental Economics, Inc.
Comparing the average consumer and market‐segmented results for the commercial sector also demonstrates the effect of utility rates on solar’s cost‐effectiveness. In the average consumer analysis, the benefit of solar is based on average retail rates for all commercial consumers statewide. As a result, solar looks more cost‐effective for large commercial consumers, who can purchase larger PV systems at a lower cost per watt. In the market‐segmented analysis, it becomes apparent that large commercial customers actually pay retail rates that are less conducive to solar cost‐effectiveness than the rates paid by small commercial customers, so that solar is less cost‐effective for large customers than small despite the lower cost to install PV.
43
ACRONYMS Acronym Definition
ACM Alternative Calculation Method
ARB California Air Resources Board
Energy Commission California Energy Commission
CO2 Carbon dioxide
CPUC California Public Utilities Commission
CSI California Solar Initiative
DC Direct current
GHG Greenhouse gas
ITC Investment tax credit
kW Kilowatt
kWh Kilowatt-hour
LADWP Los Angeles Department of Water & Power
LCOE Levelized cost of energy
NREL National Renewable Energy Laboratory
NSHP New Solar Homes Partnership
PG&E Pacific Gas and Electric
PPA Power purchase agreement
PV Photovoltaic
RES Renewable Electricity Standard
RPS Renewables Portfolio Standard
44
45
Acronym Definition
SCE Southern California Edison
SDG&E San Diego Gas & Electric
SMUD Sacramento Municipal Utility District
TDV Time dependent valuation
TOU Time of use