Embed Size (px)
Citation preview
2/29/2016
1
www.countyhealthrankings.org
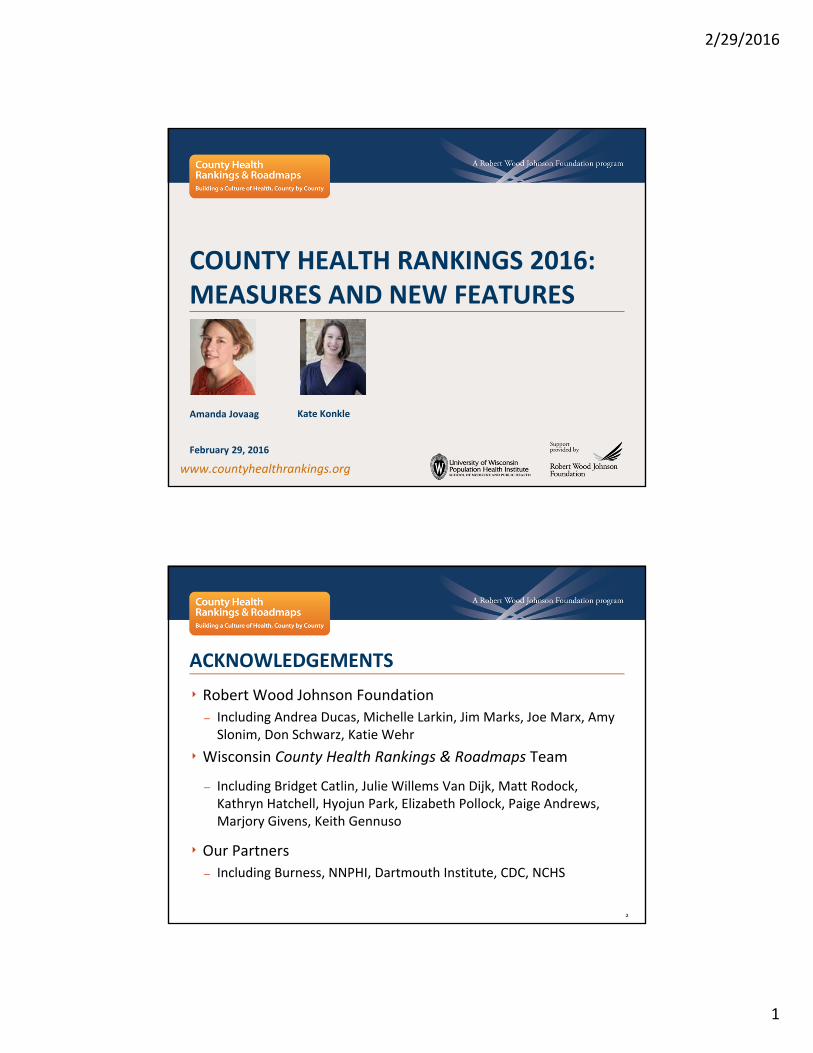
COUNTY HEALTH RANKINGS 2016: MEASURES AND NEW FEATURES
Amanda Jovaag Kate Konkle
February 29, 2016
2
ACKNOWLEDGEMENTS
‣ Robert Wood Johnson Foundation
– Including Andrea Ducas, Michelle Larkin, Jim Marks, Joe Marx, Amy Slonim, Don Schwarz, Katie Wehr
‣ Wisconsin County Health Rankings & Roadmaps Team
– Including Bridget Catlin, Julie Willems Van Dijk, Matt Rodock, Kathryn Hatchell, Hyojun Park, Elizabeth Pollock, Paige Andrews, Marjory Givens, Keith Gennuso
‣ Our Partners
– Including Burness, NNPHI, Dartmouth Institute, CDC, NCHS

2/29/2016
2
3
County Health Rankings & Roadmaps Background
What’s New for 2016?
2016 Measures and data changes
2016 New additional measures
Wrap‐Up; Q & A
OUTLINE
4

2/29/2016
3
5
COUNTY HEALTH RANKINGS: 2 RANKINGS
Today’s Health
Health Outcomes
Tomorrow’s Health
Health Factors
6
County Health Rankings & Roadmaps Background
What’s New for 2016?
2016 Measures and data changes
2016 New additional measures
Wrap‐Up; Q & A
OUTLINE

2/29/2016
4
7
8
Improved feature–Our Approach
2/29/2016
5
9
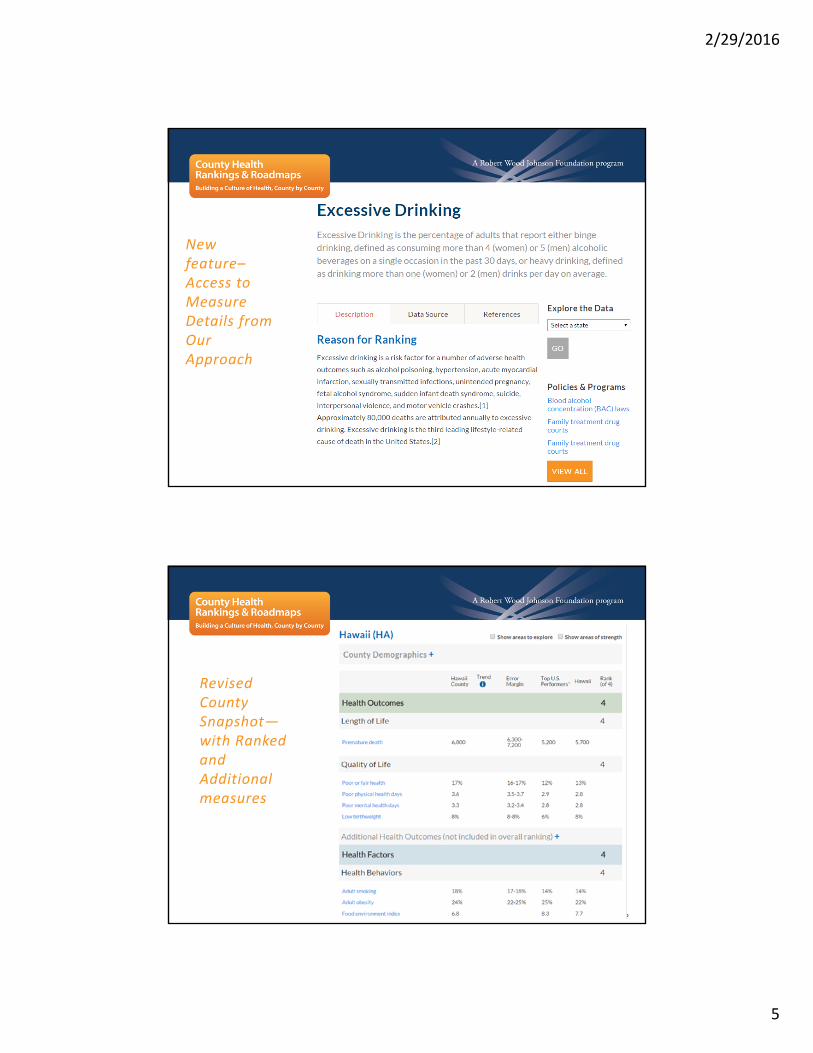
New feature–Access to Measure Details from Our Approach
10
Revised County Snapshot—with Ranked and Additional measures

2/29/2016
6
11
Created with Haiku Deck
New feature–Show areas of strength
12
New feature–Compare counties across states

2/29/2016
7
13
County Health Rankings & Roadmaps Background
What’s New for 2016?
2016 Measures and data changes
2016 New additional measures
Wrap‐Up; Q & A
OUTLINE
14
‣ Reflects aspects of population health in our model that can be improved
‣ Communicable
‣ Fewer measures are better than more
‣ Emerging health issue
‣ Closer alignment with intended topic
‣ Aligned with other metric initiatives (e.g., America’s Health Rankings)
‣ Advance efforts to address health equity
HOW ARE MEASURES SELECTED?

2/29/2016
8
15
‣ Available at the county level
‣ From data sources that are valid, reliable, and recognized
‣ Measures that have been tested and used by others
‣ Data available for nearly all counties nationwide
‣ Short time lag (recently available within the past 3‐5 years)
‣ Collected regularly and publicly available
‣ Rankable
HOW ARE MEASURES SELECTED?
16

2/29/2016
9
17
FOCUS AREA MEASURE DATA SOURCE YEARS
LENGTH OF LIFE (50%)
Premature Death (50%)(Years Of Potential Life Lost)
National Center for Health Statistics 2011‐2013
QUALITY OF LIFE (50%)
Poor or Fair Health (10%)
Poor Physical Health Days (10%)
Poor Mental Health Days (10%)
Behavioral Risk Factor Surveillance System (BRFSS)
2014
Low Birthweight (20%) National Center for Health Statistics 2007‐2013
HEALTH OUTCOMES
18
FOCUS AREA MEASURE DATA SOURCE YEARS
TOBACCO USE (10%)
Adult Smoking (10%) BRFSS 2014
DIET AND EXERCISE (10%)
Adult Obesity (5%)
Food Environment Index (2%)
Physical Inactivity (2%)
Access To Exercise Opportunities (1%)
CDC Diabetes Interactive Atlas
USDA & Feeding America
CDC Diabetes Interactive Atlas
Delorme & ESRI
2012
2013
2012
2012 & 2013
ALCOHOL USE (5%)
Excessive Drinking (2.5%)
Alcohol‐impaired Driving Deaths (2.5%)
BRFSS
Fatality Analysis Reporting System
2014
2010‐2014
SEXUAL ACTIVITY (5%)
Sexually Transmitted Infections (2.5%)
Teen Births (2.5%)
National Center for Hepatitis, HIV, STD, and TB Prevention
National Center for Health Statistics
2013
2007‐2013
HEALTH BEHAVIORS
2/29/2016
10
19
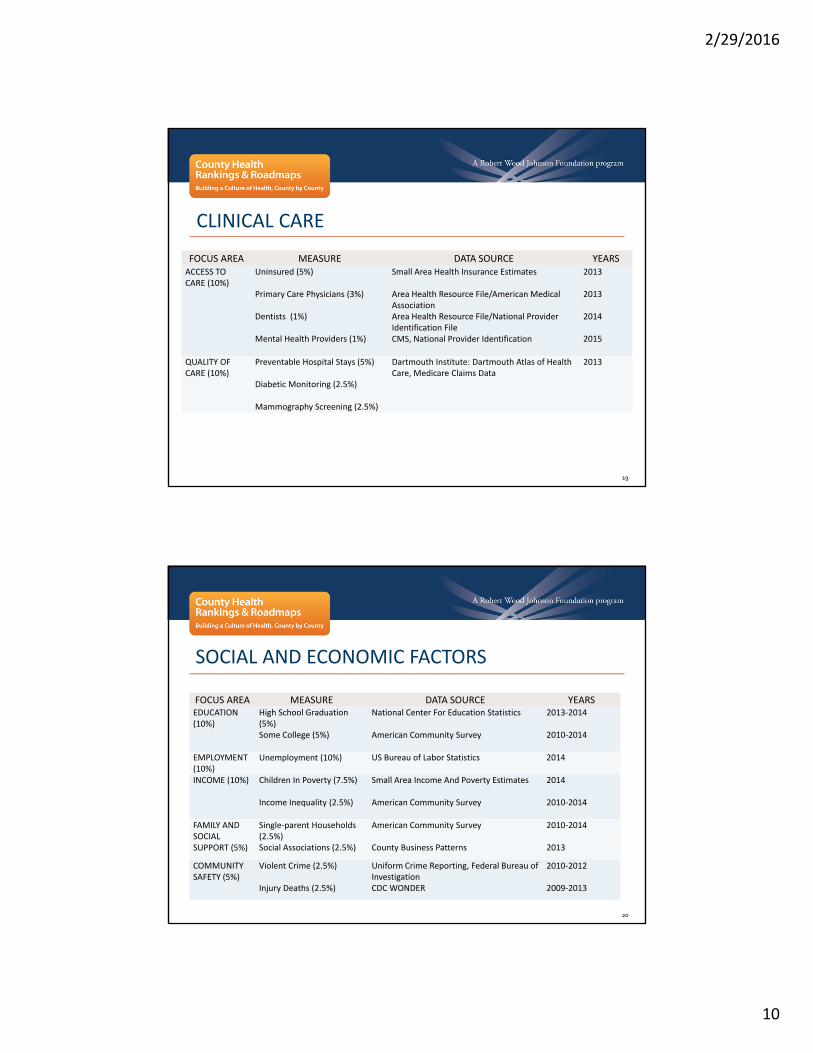
FOCUS AREA MEASURE DATA SOURCE YEARSACCESS TO CARE (10%)
Uninsured (5%)
Primary Care Physicians (3%)
Dentists (1%)
Mental Health Providers (1%)
Small Area Health Insurance Estimates
Area Health Resource File/American Medical AssociationArea Health Resource File/National Provider Identification FileCMS, National Provider Identification
2013
2013
2014
2015
QUALITY OF CARE (10%)
Preventable Hospital Stays (5%)
Diabetic Monitoring (2.5%)
Mammography Screening (2.5%)
Dartmouth Institute: Dartmouth Atlas of Health Care, Medicare Claims Data
2013
CLINICAL CARE
20
FOCUS AREA MEASURE DATA SOURCE YEARSEDUCATION (10%)
High School Graduation (5%)Some College (5%)
National Center For Education Statistics
American Community Survey
2013‐2014
2010‐2014
EMPLOYMENT (10%)
Unemployment (10%) US Bureau of Labor Statistics 2014
INCOME (10%) Children In Poverty (7.5%)
Income Inequality (2.5%)
Small Area Income And Poverty Estimates
American Community Survey
2014
2010‐2014
FAMILY AND SOCIAL SUPPORT (5%)
Single‐parent Households (2.5%)Social Associations (2.5%)
American Community Survey
County Business Patterns
2010‐2014
2013
COMMUNITY SAFETY (5%)
Violent Crime (2.5%)
Injury Deaths (2.5%)
Uniform Crime Reporting, Federal Bureau of InvestigationCDC WONDER
2010‐2012
2009‐2013
SOCIAL AND ECONOMIC FACTORS
2/29/2016
11
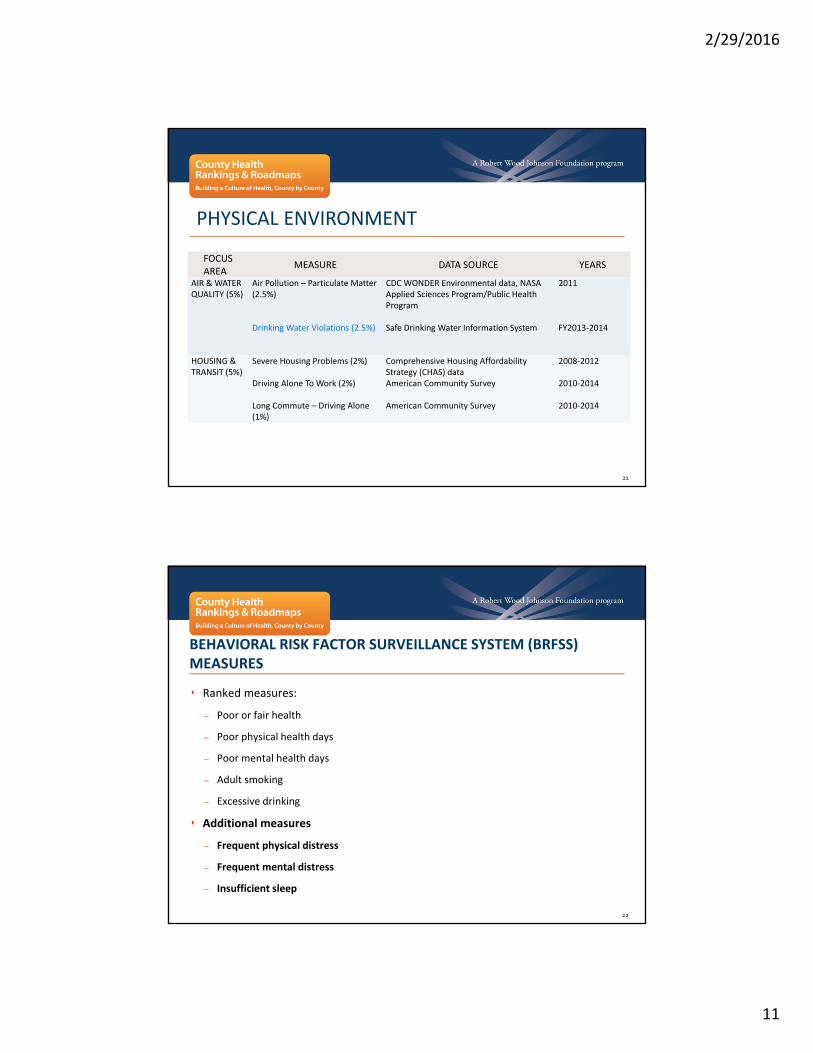
21
FOCUS AREA
MEASURE DATA SOURCE YEARS
AIR & WATER QUALITY (5%)
Air Pollution – Particulate Matter (2.5%)
Drinking Water Violations (2.5%)
CDC WONDER Environmental data, NASA Applied Sciences Program/Public Health Program
Safe Drinking Water Information System
2011
FY2013‐2014
HOUSING & TRANSIT (5%)
Severe Housing Problems (2%)
Driving Alone To Work (2%)
Long Commute – Driving Alone (1%)
Comprehensive Housing Affordability Strategy (CHAS) dataAmerican Community Survey
American Community Survey
2008‐2012
2010‐2014
2010‐2014
PHYSICAL ENVIRONMENT
22
BEHAVIORAL RISK FACTOR SURVEILLANCE SYSTEM (BRFSS) MEASURES
‣ Ranked measures:
– Poor or fair health
– Poor physical health days
– Poor mental health days
– Adult smoking
– Excessive drinking
‣ Additional measures
– Frequent physical distress
– Frequent mental distress
– Insufficient sleep

2/29/2016
12
23
BRFSS MEASURES
‣Why are we seeing these changes?
– Change in measure over time
– Inclusion of cell phone respondents
– Modeling
24
County Health Rankings & Roadmaps Background
What’s New for 2016?
2016 Measures and data changes
2016 New additional measures
Wrap‐Up; Q & A
OUTLINE

2/29/2016
13
25
ADDITIONAL MEASURES – HEALTH OUTCOMES
Health Outcomes
Premature age‐adjusted mortality
Child mortality
Infant mortality
Frequent physical distress
Frequent mental distress
Diabetes prevalence
HIV prevalence
26
ADDITIONAL MEASURES – HEALTH FACTORS
Health Behaviors
Food insecurity
Limited access to healthy foods
Drug overdose deaths
Drug overdose deaths ‐modeled
Motor vehicle crash deaths
Insufficient sleep

2/29/2016
14
27
ADDITIONAL MEASURES – HEALTH FACTORS
Clinical Care Uninsured adults
Uninsured children
Health care costs
Other primary care providers
Social and Economic Factors
Median household income
Children eligible for free lunch
Residential segregation ‐ black/white
Residential segregation ‐ non‐white/white
Homicides
28
NEW ADDITIONAL MEASURES
‣ Health outcomes
– Frequent physical distress
– Frequent mental distress
‣ Health factors
– Drug overdose deaths – modeled
– Residential segregation – black/white
– Residential segregation – non‐white/white
– Insufficient sleep

2/29/2016
15
29
FREQUENT MENTAL AND PHYSICAL DISTRESS
30
DRUG OVERDOSES ‐MODELED

2/29/2016
16
31
RESIDENTIAL SEGREGATION
Why does it matter?
32
‣ A county with 100 residents
– 50 black
– 50 white
‣ In this example, 30 out of 50 or 60% of residents (either black or white) would have to move in order for both neighborhoods to have equivalent distributions.
RESIDENTIAL SEGREGATION
40 black residents
10 white residents
10 black residents
40 white residents
40 black residents
40 white residents
10 black residents
10 white residents
Index=60 (Highly segregated)
Neighborhood 2
Neighborhood 1
Index=0 (Complete integration)
30 whites

2/29/2016
17
33
INSUFFICIENT SLEEPMap of SUFFICIENT SLEEP
Behavioral Risk Factor Surveillance System, United States, 2014
Liu Y, Wheaton AG, Chapman DP, Cunningham TJ, Lu H, Croft JB. Prevalence of Healthy Sleep Duration among Adults —United States, 2014. MMWR Morb Mortal Wkly Rep 2016;65:137–141. DOI: http://dx.doi.org/10.15585/mmwr.mm6506a1
38
County Health Rankings & Roadmaps Background
What’s New for 2016?
2016 Measures and data changes
2016 New additional measures
Wrap‐Up; Q & A
OUTLINE

2/29/2016
18
39
UPCOMING WEBINARS
March 8
Community Engagement for Health Equity,
Racial & Social Justice
April 5
County Health Rankings & Roadmaps 101 and
Website Tour
40
STAYING CONNECTED
e‐Newsletter: [email protected]

2/29/2016
19
Amanda Jovaag, MSCounty Health Rankings Data LeadUniversity of Wisconsin Population Health Institutewww.countyhealthrankings.org
THANK YOU!