Embed Size (px)
Citation preview
Cambridge Public Schools Grade 8 Accelerated Pathway Mathematics Curriculum Map
MATH IN FOCUS/Edgenuity 2015 – 2016
In the Grade 8 Accelerated Pathway, instructional time should focus on four Critical Areas: (1) deepening and extending understanding of linear and exponential relationships;; (2) contrasting linear and exponential relationships with each other and engaging in methods for analyzing, solving, and using quadratic functions;; (3) extending the laws of exponents to square and cube roots;; and (4) applying linear models to data that exhibit a linear trend.
(1) Students use linear equations and systems of linear equations to represent, analyze, and solve a variety of problems. Students recognize equations for proportions ( y / x = m or y = mx ) as special linear equations ( y = mx + b ), understanding that the constant of proportionality ( m ) is the slope, and the graphs are lines through the origin. They understand that the slope ( m ) of a line is a constant rate of change, so that if the input or x -coordinate changes by an amount A , the output or y -coordinate changes by the amount m ⋅ A . Students also use a linear equation to describe the association between two quantities in bivariate data (such as arm span vs. height for students in a classroom). At this grade, fitting the model, and assessing its fit to the data are done informally. Interpreting the model in the context of the data requires students to express a relationship between the two quantities in question and to interpret components of the relationship (such as slope and y -intercept) in terms of the situation. Students strategically choose and efficiently implement procedures to solve linear equations in one variable, understanding that when they use the properties of equality and the concept of logical equivalence, they maintain the solutions of the original equation. Students solve systems of two linear equations in two variables and relate the systems to pairs of lines in the plane;; these intersect, are parallel, or are the same line. Students use linear equations, systems of linear equations, linear functions, and their understanding of slope of a line to analyze situations and solve problems.
(2) Students grasp the concept of a function as a rule that assigns to each input exactly one output. They
understand that functions describe situations where one quantity determines another. They can translate among representations and partial representations of functions (noting that tabular and graphical representations may be partial representations), and they describe how aspects of the function are reflected in the different representations.
(3) By the end of eighth grade, students have learned to solve linear equations in one variable and have applied
graphical and algebraic methods to analyze and solve systems of linear equations in two variables. In Algebra I, students analyze and explain the process of solving an equation and justify the process used in solving a system of equations. Students develop fluency writing, interpreting, and translating among various forms of linear equations and inequalities, and use them to solve problems. They master the solution of linear equations and apply related solution techniques and the laws of exponents to the creation and solution of simple exponential equations.
(4) In earlier grades, students define, evaluate, and compare functions, and use them to model relationships
between quantities. In Algebra I, students learn function notation and develop the concepts of domain and range. They focus on linear, quadratic, and exponential functions, including sequences, and also explore absolute value, step, and piecewise-defined functions;; they interpret functions given graphically, numerically, symbolically, and verbally;; translate between representations;; and understand the limitations of various representations. Students build on and extend their understanding of integer exponents to consider exponential functions. They compare and contrast linear and exponential functions, distinguishing between
Cambridge Public Schools Page 1 2015-2016
Cambridge Public Schools Grade 8 Accelerated Pathway Mathematics Curriculum Map
MATH IN FOCUS/Edgenuity 2015 – 2016
additive and multiplicative change. Students explore systems of equations and inequalities, and they find and interpret their solutions. They interpret arithmetic sequences as linear functions and geometric sequences as exponential functions.
(5) Students extend the laws of exponents to rational exponents involving square and cube roots and apply this
new understanding of number;; they strengthen their ability to see structure in and create quadratic and exponential expressions. They create and solve equations, inequalities, and systems of equations involving quadratic expressions. Students become facile with algebraic manipulation, including rearranging and collecting terms, and factoring, identifying, and canceling common factors in rational expressions. Students consider quadratic functions, comparing the key characteristics of quadratic functions to those of linear and exponential functions. They select from among these functions to model phenomena. Students learn to anticipate the graph of a quadratic function by interpreting various forms of quadratic expressions. In particular, they identify the real solutions of a quadratic equation as the zeros of a related quadratic function. Students expand their experience with functions to include more specialized functions—absolute value, step, and those that are piecewisedefined.
(6) Building upon their prior experiences with data, students explore a more formal means of assessing how a
model fits data. Students use regression techniques to describe approximately linear relationships between quantities. They use graphical representations and knowledge of context to make judgments about the appropriateness of linear models. With linear models, they look at residuals to analyze the goodness of fit.
Cambridge Public Schools Page 2 2015-2016
Cambridge Public Schools Grade 8 Accelerated Pathway Mathematics Curriculum Map
MATH IN FOCUS/Edgenuity 2015 – 2016
Information from the PARCC Model Content Framework for Mathematics
Grade 8 The following are examples of Key Advances from Grade 7 to Grade 8
Students build on previous work with proportional relationships, unit rates and graphing to connect these
ideas and understand that the points ( x , y ) on a non-vertical line are the solutions of the equation y = mx + b , where m is the slope of the line as well as the unit rate of a proportional relationship (in the case b = 0). Students also formalize their previous work with linear relationships by working with functions — rules that assign to each input exactly one output.
By working with equations such as x 2 = 2 and in geometric contexts such as the Pythagorean theorem, students enlarge their concept of number beyond the system of rationals to include irrational numbers.
They represent these numbers with radical expressions and approximate these numbers with rationals. Fluency Expectations or Examples of Culminating Standards 8.EE.7 Students have been working informally with one-variable linear equations since as early as
kindergarten. This important line of development culminates in grade 8 with the solution of general
one-variable linear equations, including cases with infinitely many solutions or no solutions as well as
cases requiring algebraic manipulation using properties of operations. Coefficients and constants in
these equations may be any rational numbers. 8.G.9 When students learn to solve problems involving volumes of cones, cylinders and spheres — together
with their previous grade 7 work in angle measure, area, surface area and volume (7.G.4–6) — they
will have acquired a well-developed set of geometric measurement skills. These skills, along with
proportional reasoning (7.RP) and multistep numerical problem solving (7.EE.3), can be combined
and used in flexible ways as part of modeling during high school — not to mention after high school
for college and careers. Examples of Major Within-Grade Dependencies
An important development takes place in grade 8 when students make connections between proportional
relationships, lines and linear equations (8.EE, second cluster ). Making these connections depends on
prior grades’ work, including 7.RP.2 and 6.EE.9. There is also a major dependency within grade 8 itself:
The angle-angle criterion for triangle similarity underlies the fact that a non-vertical line in the
coordinate plane has equation y = mx + b . Therefore, students must do work with congruence and 1
similarity (8.G.1–5) before they are able to justify the connections among proportional relationships,
lines and linear equations. Hence the indicated geometry work should likely begin at or near the very
start of the year. 2
Much of the work of grade 8 involves lines, linear equations and linear functions (8.EE.5–8;; 8.F.3–4;;
8.SP.2–3). Irrational numbers, radicals, the Pythagorean theorem and volume (8.NS.1–2;; 8.EE.2;;
8.G.6–9) are nonlinear in nature. Curriculum developers might choose to address linear and nonlinear
bodies of content somewhat separately. An exception, however, might be that when addressing
functions, pervasively treating linear functions as separate from nonlinear functions might obscure the
1 See page 12 of the Progression for Expressions and Equations: http://commoncoretools.files.wordpress.com/2011/04/ccss_progression_ee_2011_04_25.pdf 2 Note that the Geometry cluster “Understand congruence and similarity using physical models, transparencies or geometry software” supports high school work with congruent triangles and congruent figures. Cambridge Public Schools Page 3 2015-2016
Cambridge Public Schools Grade 8 Accelerated Pathway Mathematics Curriculum Map
MATH IN FOCUS/Edgenuity 2015 – 2016
concept of function per se . There should also be sufficient treatment of nonlinear functions to avoid giving students the misleading impression that all functional relationships are linear (see also 7.RP.2a).
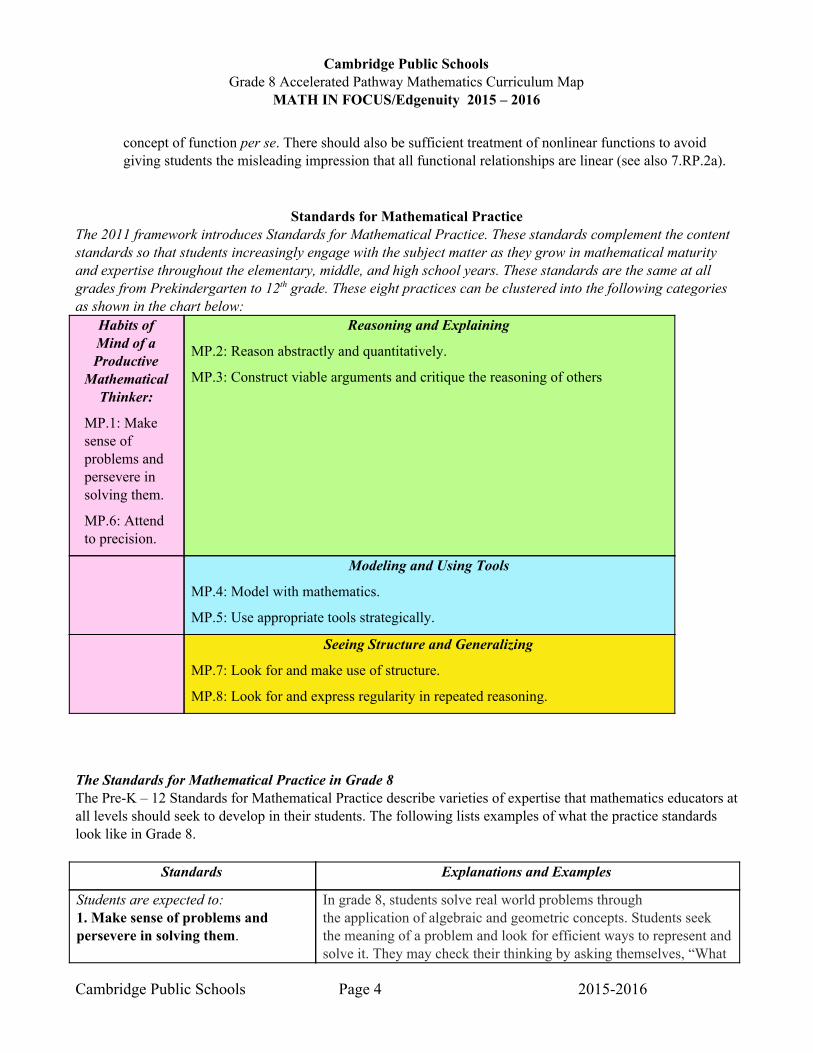
Standards for Mathematical Practice The 2011 framework introduces Standards for Mathematical Practice. These standards complement the content standards so that students increasingly engage with the subject matter as they grow in mathematical maturity and expertise throughout the elementary, middle, and high school years. These standards are the same at all grades from Prekindergarten to 12 th grade. These eight practices can be clustered into the following categories as shown in the chart below:
Habits of
Mind of a
Productive
Mathematical
Thinker: MP.1: Make sense of problems and persevere in solving them. MP.6: Attend to precision.
Reasoning and Explaining MP.2: Reason abstractly and quantitatively. MP.3: Construct viable arguments and critique the reasoning of others
Modeling and Using Tools MP.4: Model with mathematics. MP.5: Use appropriate tools strategically.
Seeing Structure and Generalizing MP.7: Look for and make use of structure. MP.8: Look for and express regularity in repeated reasoning.
The Standards for Mathematical Practice in Grade 8 The Pre-K – 12 Standards for Mathematical Practice describe varieties of expertise that mathematics educators at all levels should seek to develop in their students. The following lists examples of what the practice standards look like in Grade 8.
Standards Explanations and Examples
Students are expected to: 1. Make sense of problems and persevere in solving them .
In grade 8, students solve real world problems through the application of algebraic and geometric concepts. Students seek the meaning of a problem and look for efficient ways to represent and solve it. They may check their thinking by asking themselves, “What
Cambridge Public Schools Page 4 2015-2016
Cambridge Public Schools Grade 8 Accelerated Pathway Mathematics Curriculum Map
MATH IN FOCUS/Edgenuity 2015 – 2016
is the most efficient way to solve the problem?”, “Does this make
sense?”, and “Can I solve the problem in a different way?”
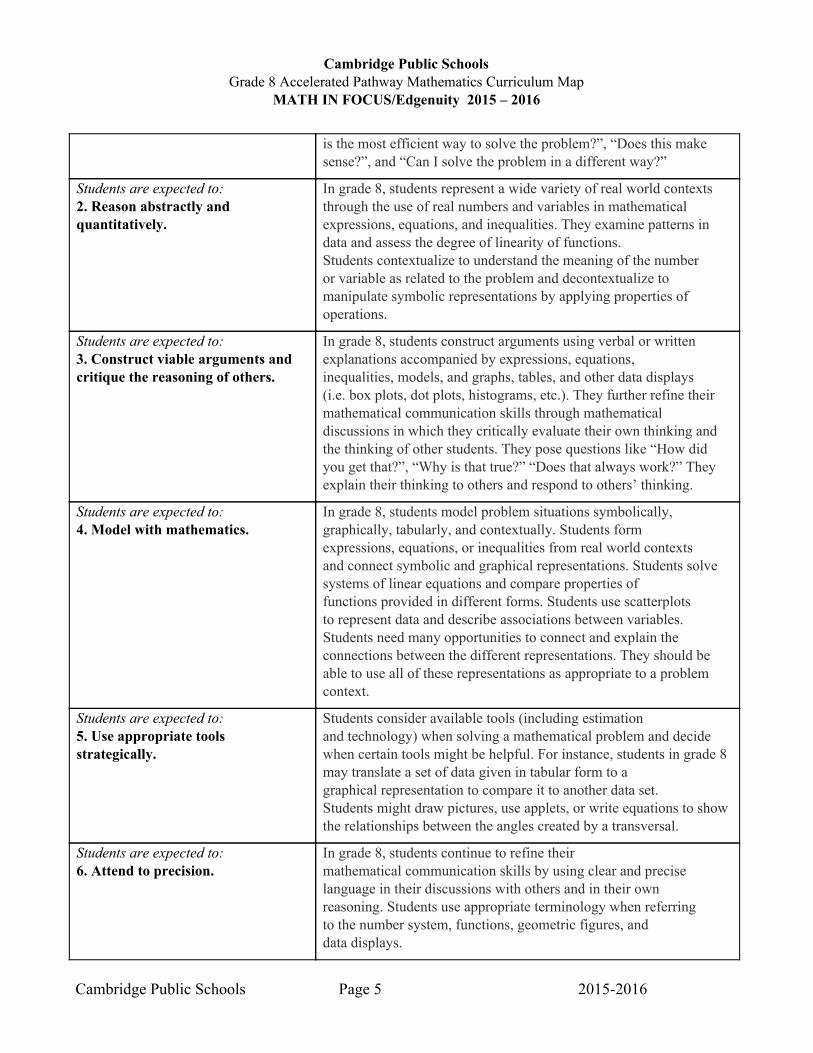
Students are expected to: 2. Reason abstractly and quantitatively.
In grade 8, students represent a wide variety of real world contexts
through the use of real numbers and variables in mathematical
expressions, equations, and inequalities. They examine patterns in
data and assess the degree of linearity of functions.
Students contextualize to understand the meaning of the number
or variable as related to the problem and decontextualize to manipulate symbolic representations by applying properties of
operations.
Students are expected to: 3. Construct viable arguments and critique the reasoning of others.
In grade 8, students construct arguments using verbal or written
explanations accompanied by expressions, equations,
inequalities, models, and graphs, tables, and other data displays
(i.e. box plots, dot plots, histograms, etc.). They further refine their mathematical communication skills through mathematical
discussions in which they critically evaluate their own thinking and
the thinking of other students. They pose questions like “How did
you get that?”, “Why is that true?” “Does that always work?” They
explain their thinking to others and respond to others’ thinking.
Students are expected to: 4. Model with mathematics.
In grade 8, students model problem situations symbolically,
graphically, tabularly, and contextually. Students form
expressions, equations, or inequalities from real world contexts
and connect symbolic and graphical representations. Students solve systems of linear equations and compare properties of
functions provided in different forms. Students use scatterplots
to represent data and describe associations between variables.
Students need many opportunities to connect and explain the
connections between the different representations. They should be
able to use all of these representations as appropriate to a problem
context.
Students are expected to: 5. Use appropriate tools strategically.
Students consider available tools (including estimation
and technology) when solving a mathematical problem and decide
when certain tools might be helpful. For instance, students in grade 8
may translate a set of data given in tabular form to a
graphical representation to compare it to another data set.
Students might draw pictures, use applets, or write equations to show
the relationships between the angles created by a transversal.
Students are expected to: 6. Attend to precision.
In grade 8, students continue to refine their
mathematical communication skills by using clear and precise
language in their discussions with others and in their own
reasoning. Students use appropriate terminology when referring
to the number system, functions, geometric figures, and
data displays.
Cambridge Public Schools Page 5 2015-2016
Cambridge Public Schools Grade 8 Accelerated Pathway Mathematics Curriculum Map
MATH IN FOCUS/Edgenuity 2015 – 2016
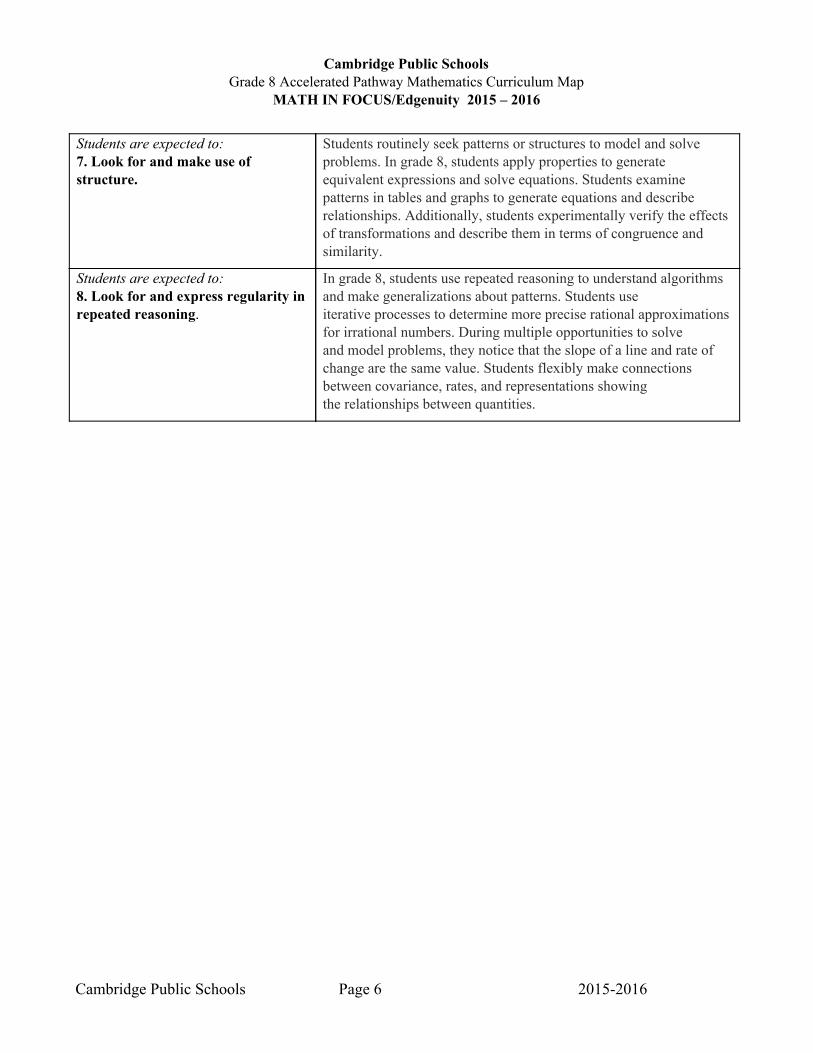
Students are expected to: 7. Look for and make use of structure.
Students routinely seek patterns or structures to model and solve problems. In grade 8, students apply properties to generate equivalent expressions and solve equations. Students examine patterns in tables and graphs to generate equations and describe relationships. Additionally, students experimentally verify the effects of transformations and describe them in terms of congruence and similarity.
Students are expected to: 8. Look for and express regularity in repeated reasoning .
In grade 8, students use repeated reasoning to understand algorithms and make generalizations about patterns. Students use iterative processes to determine more precise rational approximations for irrational numbers. During multiple opportunities to solve and model problems, they notice that the slope of a line and rate of change are the same value. Students flexibly make connections between covariance, rates, and representations showing the relationships between quantities.
Cambridge Public Schools Page 6 2015-2016
Cambridge Public Schools Grade 8 Accelerated Pathway Mathematics Curriculum Map
MATH IN FOCUS/Edgenuity 2015 – 2016
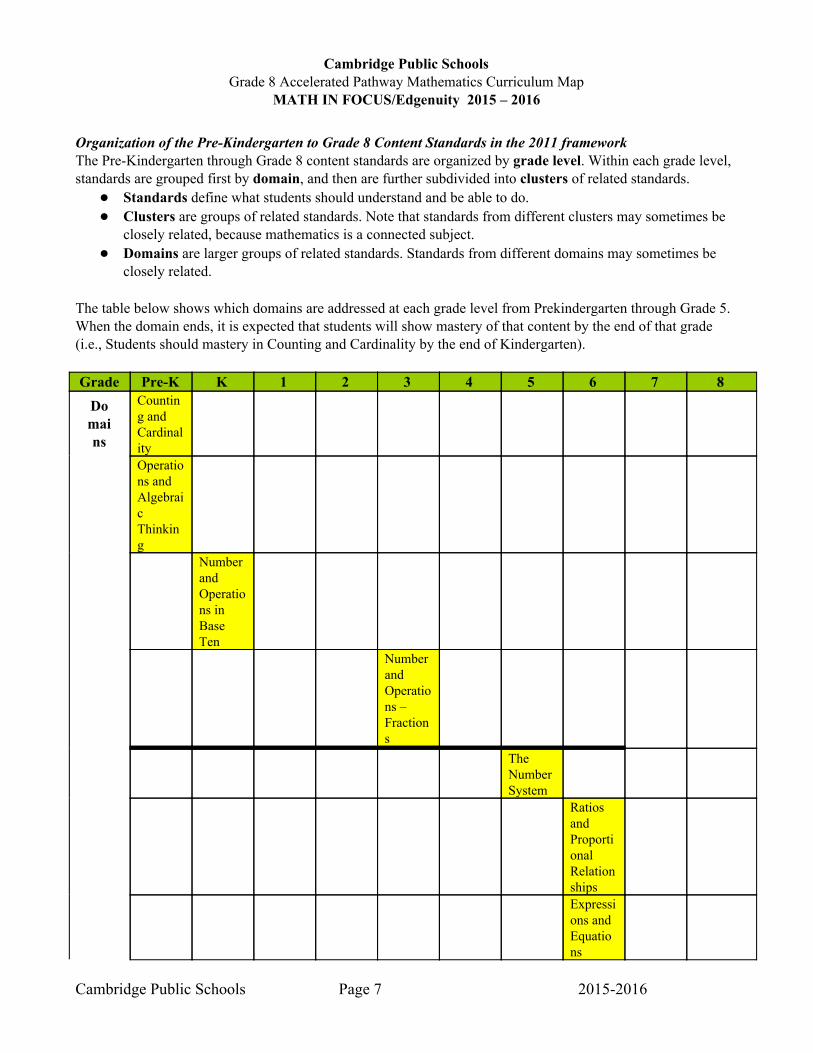
Organization of the Pre-Kindergarten to Grade 8 Content Standards in the 2011 framework The Pre-Kindergarten through Grade 8 content standards are organized by grade level . Within each grade level, standards are grouped first by domain , and then are further subdivided into clusters of related standards.
Standards define what students should understand and be able to do. Clusters are groups of related standards. Note that standards from different clusters may sometimes be
closely related, because mathematics is a connected subject. Domains are larger groups of related standards. Standards from different domains may sometimes be
closely related. The table below shows which domains are addressed at each grade level from Prekindergarten through Grade 5. When the domain ends, it is expected that students will show mastery of that content by the end of that grade (i.e., Students should mastery in Counting and Cardinality by the end of Kindergarten). Grade Pre-K K 1 2 3 4 5 6 7 8 Domains
Countin
g and
Cardinal
ity
Operatio
ns and
Algebrai
c
Thinkin
g
Number
and
Operatio
ns in
Base
Ten
Number
and
Operatio
ns –
Fraction
s
The
Number
System
Ratios
and
Proporti
onal
Relation
ships
Expressi
ons and
Equatio
ns
Cambridge Public Schools Page 7 2015-2016
Cambridge Public Schools Grade 8 Accelerated Pathway Mathematics Curriculum Map
MATH IN FOCUS/Edgenuity 2015 – 2016
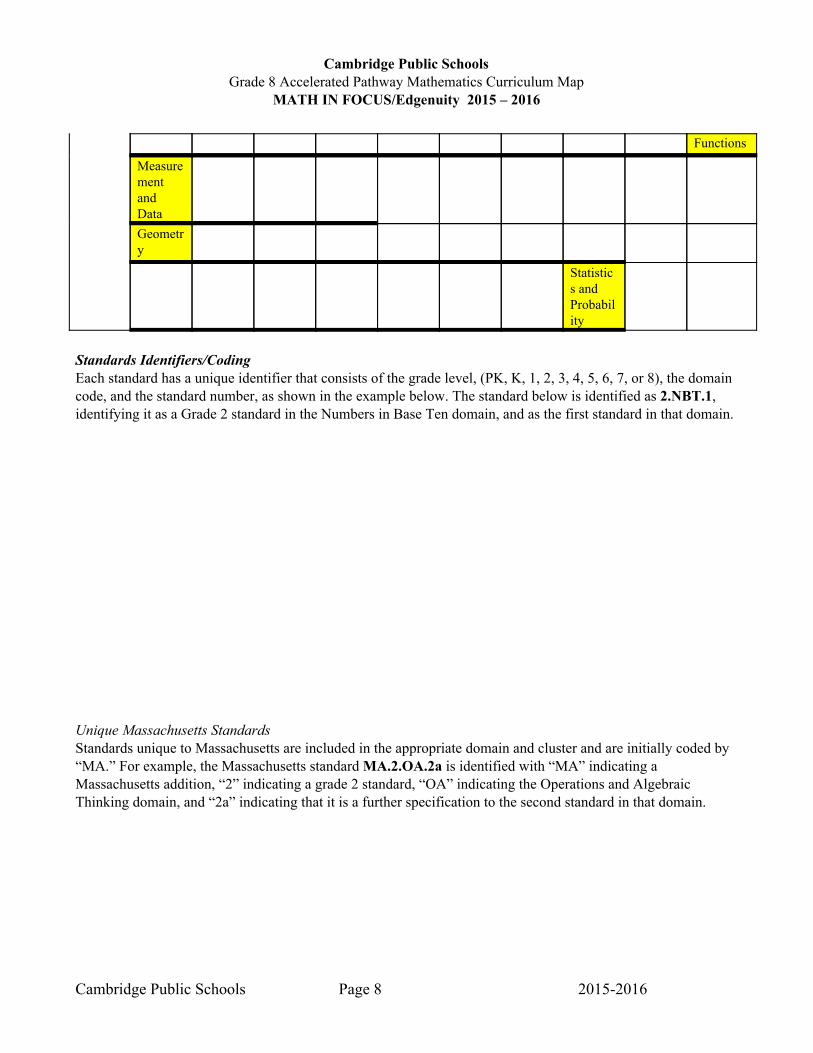
Functions Measure
ment and Data
Geometry
Statistics and Probability
Standards Identifiers/Coding Each standard has a unique identifier that consists of the grade level, (PK, K, 1, 2, 3, 4, 5, 6, 7, or 8), the domain
code, and the standard number, as shown in the example below. The standard below is identified as 2.NBT.1 , identifying it as a Grade 2 standard in the Numbers in Base Ten domain, and as the first standard in that domain.
Unique Massachusetts Standards Standards unique to Massachusetts are included in the appropriate domain and cluster and are initially coded by
“MA.” For example, the Massachusetts standard MA.2.OA.2a is identified with “MA” indicating a
Massachusetts addition, “2” indicating a grade 2 standard, “OA” indicating the Operations and Algebraic
Thinking domain, and “2a” indicating that it is a further specification to the second standard in that domain.
Cambridge Public Schools Page 8 2015-2016
Cambridge Public Schools Grade 8 Accelerated Pathway Mathematics Curriculum Map
MATH IN FOCUS/Edgenuity 2015 – 2016
Note for AMP teachers: In the 7
th grade AMP classroom, the students covered all of the 7
th grade standards as well as all of the 8
th
grade Geometry standards. This means that they have already learned about volume of cylinders, cones, and
sphere;; The Pythagorean Theorem;; Transformations;; and Similarity/Congruence. As this is a year of transition,
some students may have covered Bivariate Data (Math in Focus Course 3 Book B Chapter 10), but it is worth
revisiting after covering linear relationships and scatterplots through Edgenuity. Some students may have
covered the Number System standards.
During the 2015-2016 school year, 7 th grade AMP students will all cover the Number System standards
but NOT the Data & Statistics standards.
Overview of the 8 th grade AMP year: 8 th grade AMP begins by covering Chapters 1 and 2 in the Math in Focus Course 3 Book A. At that
point, the idea is to introduce the Algebra 1 curriculum through Edgenuity. The Edgenuity course also covers
many of the remaining 8 th grade Common Core Standards. Supplement the first four Edgenuity units with
material from Math in Focus Course 3 Book A as detailed in Unit Notes.
If students have not yet covered the Number System, go back to Course 2 Book A Chapter 1 sections 1.3
and 1.4, which cover the following standards:
8.NS.1 Know that numbers that are not rational are called irrational. Understand informally that every number has a decimal expansion;; for rational numbers show that the decimal expansion repeats
eventually, and convert a decimal expansion which repeats eventually into a rational number. 8.NS.2 Use rational approximations of irrational numbers to compare the size of irrational numbers, locate them approximately on a number line diagram, and estimate the value of expressions
NOTE: When necessary, reference elementary MiF books from previous grades on how to teach bar
modeling as the expectation is that all students already know how to use this form of representation. The
trajectory can be found in grade 2, chapter 4;; grade 3, chapter 5;; grade 4, chapter 3;; and grade 5, chapter 2.
Cambridge Public Schools Page 9 2015-2016
Cambridge Public Schools Grade 8 Accelerated Pathway Mathematics Curriculum Map
MATH IN FOCUS/Edgenuity 2015 – 2016
UNIT 1 : September 8 – October 1 Chapter 1: Exponents Sequencing: Pre-assess the following standards before beginning Chapter 1 in the textbook. If needed, start instruction
with the Course 2 lessons below (available online): o Lesson 1.2: Writing Rational Numbers as Decimals (8.NS.1, 8.NS.2) o Lesson 1.3: Introducing Irrational Numbers (8.NS.1, 8.NS.2, 8.EE.2) o Lesson 1.4: Introducing the Real Number System (8.NS.1, 8.NS.2, 8.EE.2)
Unit Notes: Students need to be able to apply the properties of exponents to create equivalent expressions. This chapter
extends student understanding that expressions can be manipulated to solve problems. Expanded form is used to show students why the rules for operations with exponents work. Be sure to repeat
these several times so students can figure out, for instance, the quotient rule or the power of a power rule. Students will use square roots and cube roots to solve equations and to represent solutions to equations. This is a fairly abstract chapter, and students will have to understand that sometimes practice in these
abstract concepts is required so they can use them later on. Students will work with all types of rational numbers throughout this chapter;; this is a good time to review
some operations with rational numbers. Skip prime factorization (part of 1.1). Standards (8.NS.1, 8.NS.2, and 8.EE.2 are prerequisites. See “Sequencing” above): 8.NS.1 Know that numbers that are not rational are called irrational. Understand informally that every number
has a decimal expansion;; for rational numbers show that the decimal expansion repeats eventually, and convert a decimal expansion which repeats eventually into a rational number.
Scope of standard: Students understand that Real numbers are either rational or irrational. They distinguish between rational and
irrational numbers, recognizing that any number that can be expressed as a fraction is a rational number. Students recognize that the decimal equivalent of a fraction will either terminate or repeat. Fractions that
terminate will have denominators containing only prime factors of 2 and/or 5. This understanding builds on work in 7 th grade when students used long division to distinguish between repeating and terminating decimals.
Students convert repeating decimals into their fraction equivalent using patterns or algebraic reasoning. Additionally, students can investigate repeating patterns that occur when fractions have denominators of 9,
99, or 11. 8.NS.2 Use rational approximations of irrational numbers to compare the size of irrational numbers, locate
them approximately on a number line diagram, and estimate the value of expressions (e.g., π 2 ). For example, by truncating the decimal expansion of , show that is between 1 and 2, then between 1.4 and 1.5, and explain how to continue on to get better approximations.
Scope of standard: Students locate rational and irrational numbers on the number line. Students compare and order rational and
irrational numbers. Students also recognize that square roots may be negative and written as . Additionally, students understand that the value of a square root can be approximated between integers and
that non-perfect square roots are irrational.
Cambridge Public Schools Page 10 2015-2016
Cambridge Public Schools Grade 8 Accelerated Pathway Mathematics Curriculum Map
MATH IN FOCUS/Edgenuity 2015 – 2016
8.EE.1 Know and apply the properties of integer exponents to generate equivalent numerical expressions. For
example, 3 2 x 3 -5 = 3 -3 = 1/3 3 = 1/27. Scope of standard: In 6 th grade, students wrote and evaluated simple numerical expressions with whole number exponents
(ie. 5 3 = 5 • 5 • 5 = 125). Integer (positive and negative) exponents are further developed to generate equivalent numerical expressions when multiplying, dividing or raising a power to a power. Using numerical bases and the laws of exponents, students generate equivalent expressions.
Students understand: o Bases must be the same before exponents can be added, subtracted or multiplied. o Exponents are subtracted when like bases are being divided. o A number raised to the zero (0) power is equal to one. o Negative exponents occur when there are more factors in the denominator. These exponents can be
expressed as a positive if left in the denominator. o Exponents are added when like bases are being multiplied. o Exponents are multiplied when an exponents is raised to an exponent. o Several properties may be used to simplify an expression.
8.EE.2 Use square root and cube root symbols to represent solutions to equations of the form x 2 = p and
x 3 = p, where p is a positive rational number. Evaluate square roots of small perfect squares and cube roots of small perfect cubes. Know that is irrational.
Scope of standard: Students recognize perfect squares and cubes, understanding that non-perfect squares and non-perfect cubes
are irrational. Students recognize that squaring a number and taking the square root of a number are inverse operations;;
likewise, cubing a number and taking the cube root are inverse operations. This understanding is used to solve equations containing square or cube numbers. Rational numbers would
have perfect squares or perfect cubes for the numerator and denominator. In the standard, the value of p for square root and cube root equations must be positive.
Students understand that in geometry, the square root of the area is the length of the side of a square and a cube root of the volume is the length of the side of a cube. Students use this information to solve problems, such as finding the perimeter.
Cambridge Public Schools Page 11 2015-2016
Cambridge Public Schools Grade 8 Accelerated Pathway Mathematics Curriculum Map
MATH IN FOCUS/Edgenuity 2015 – 2016
UNIT 2 : October 2 – October 13 Chapter 2: Scientific Notation
Unit Notes: Students should understand why we use scientific notation and choose appropriate size measurements for
very small or very large quantities. If possible, collaborate with science teachers for meaningful applications (astronomy, chemistry, physics). Use this chapter to assess student understanding of decimal place value and rules for operations with
exponents. Lesson 2.2 can be used as an extension. Students are not required to add/subtract in scientific notation, but
may find it to be a useful skill in future math and science courses. Standards: 8.EE.3 Use numbers expressed in the form of a single digit times an integer power of 10 to estimate very large
or very small quantities, and to express how many times as much one is than the other. For example, estimate the population of the United States as 3 × 10 8 and the population of the world as 7 × 10 9 , and determine that the world population is more than 20 times larger. ( 8.N.1, 8.N.4 )
Scope of standard: Students use scientific notation to express very large or very small numbers. Students compare and interpret
scientific notation quantities in the context of the situation, recognizing that if the exponent increases by one, the value increases 10 times. Likewise, if the exponent decreases by one, the value decreases 10 times.
Students solve problems using addition, subtraction or multiplication, expressing the answer in scientific notation. (Addition and subtraction can be done in standard form with the answer expressed in scientific notation. Multiplication and division should be done in scientific notation, which also serves as review of Chapter 1.)
8.EE.4 Perform operations with numbers expressed in scientific notation, including problems where both
decimal and scientific notation are used. Use scientific notation and choose units of appropriate size for measurements of very large or very small quantities (e.g., use millileters per year for seafloor spreading). Interpret scientific notation that has been generated by technology.
Scope of standard: Students understand scientific notation as generated on various calculators or other technology. Students
enter scientific notation using E or EE (scientific notation), * (multiplication), and ^ (exponent) symbols.
Cambridge Public Schools Page 12 2015-2016
Cambridge Public Schools Grade 8 Accelerated Pathway Mathematics Curriculum Map
MATH IN FOCUS/Edgenuity 2015 – 2016
UNIT 3 : October 14 - November 4 Edgenuity: Representing Relationships
Unit Notes:
From this point on, Edgenuity will be used as the primary source for instruction. Supplement with Math in Focus and other resources as needed.
The following lessons are included in this Edgenuity unit, but will not be taught until later in the year: Analyzing Graphs and Analyzing Tables .
Recognizing Patterns can be used as an extension. Lessons:
Quantitative Reasoning Dimensional Analysis Writing and Solving Equations in Two Variables Writing and Graphing Equations in Two Variables Intro to Functions Function Notation Evaluating Functions
Standards: F-IF.1 Understand that a function from one set (called the domain) to another set (called the range) assigns to
each element of the domain exactly one element of the range. If f is a function and x is an element of its domain, then f(x) denotes the output of f corresponding to the input x. The graph of f is the graph of the equation y = f(x).
F-IF.2 Use function notation, evaluate functions for inputs in their domains, and interpret statements that use
function notation in terms of a context. F-IF.4 For a function that models a relationship between two quantities, interpret key features of graphs and
tables in terms of the quantities, and sketch graphs showing key features given a verbal description of the relationship. Key features include: intercepts;; intervals where the function is increasing, decreasing, positive, or negative;; relative maximums and minimums;; symmetries;; end behavior;; and
periodicity. F-IF.5 Relate the domain of a function to its graph and, where applicable, to the quantitative relationship it
describes F-IF.7 Graph functions expressed symbolically and show key features of the graph, by hand in simple cases
and using technology for more complicated cases. F-IF.7a Graph linear and quadratic functions and show intercepts, maxima, and minima. F-IF.7b Graph square root, cube root, and piecewise-defined functions, including step functions and
absolute value functions. NQ.1 Use units as a way to understand problems and to guide the solution of multi-step problems;; choose
and interpret units consistently in formulas;; choose and interpret the scale and the origin in graphs and data displays.
Cambridge Public Schools Page 13 2015-2016
Cambridge Public Schools Grade 8 Accelerated Pathway Mathematics Curriculum Map
MATH IN FOCUS/Edgenuity 2015 – 2016
NQ.2 Define appropriate quantities for the purpose of descriptive modeling. NQ.3 Choose a level of accuracy appropriate to limitations on measurement when reporting quantities. A-CED.2Create equations in two or more variables to represent relationships between quantities;; graph
equations on coordinate axes with labels and scales. A-CED.3Represent constraints by equations or inequalities, and by systems of equations and/or inequalities,
and interpret solutions as viable or non-viable options in a modeling context. For example, represent inequalities describing nutritional and cost constraints on combinations of different foods.
F-BF.1 Write a function that describes a relationship between two quantities.*
F-BF.1a Determine an explicit expression, a recursive process, or steps for calculation from a context.* F-BF.1b Combine standard function types using arithmetic operations. For example, build a function
that models the temperature of a cooling body by adding a constant function to a decaying exponential, and relate these functions to the model. *
F-BF.1c (+) Compose functions. For example, if T(y) is the temperature in the atmosphere as a function of height, and h ( t ) is the height of a weather balloon as a function of time, then T ( h ( t )) is the temperature at the location of the weather balloon as a function of time. *
F-BF.4 Find inverse functions.
F-BF.4a Solve an equation of the form f(x) = c for a simple function f that has an inverse and write an expression for the inverse. For example, f ( x ) =2 x 3 or f ( x ) = ( x + 1)/( x - 1) for x ≠ 1.
F-BF.4b (+) Verify by composition that one function is the inverse of another. F-BF.4c (+) Read values of an inverse function from a graph or a table, given that the function has an
inverse. F-BF.4d (+) Produce an invertible function from a non-invertible function by restricting the domain.
A-REI.10 Understand that the graph of an equation in two variables is the set of all its solutions plotted in the
coordinate plane, often forming a curve (which could be a line). F-LE.5 Interpret the parameters in a linear or exponential function in terms of a context.*
* indicates Modeling standard. (+) indicates standard beyond College and Career Ready.
Cambridge Public Schools Page 14 2015-2016
Cambridge Public Schools Grade 8 Accelerated Pathway Mathematics Curriculum Map
MATH IN FOCUS/Edgenuity 2015 – 2016
UNIT 4 : November 6 - November 20 Edgenuity: Linear Functions and lessons from Data Analysis
Unit Notes:
In Special Linear Relationships, use the last lesson on sequences as extension. Include creating scatter plots, finding and writing the equation of the line of best fit. ( Use Edgenuity
Lessons from Data Analysis: Line of Best Fit, Analyzing Residuals, Strength of Correlation, and Regression Models . Additional resource: Math in Focus Chapter 10.1-10.2)
Lessons:
Intro to Linear Functions Slope of a Line Slope-Intercept form of a Line Point-Slope Form of a Line Writing Linear Equations Special Linear Relationships
Standards: F-IF.1 Understand that a function from one set (called the domain) to another set (called the range) assigns to
each element of the domain exactly one element of the range. If f is a function and x is an element of its domain, then f(x) denotes the output of f corresponding to the input x. The graph of f is the graph of the equation y = f(x).
F-IF.2 Use function notation, evaluate functions for inputs in their domains, and interpret statements that use
function notation in terms of a context. F-IF.3 Recognize that sequences are functions, sometimes defined recursively, whose domain is a subset of
the integers. F-IF.4 For a function that models a relationship between two quantities, interpret key features of graphs and
tables in terms of the quantities, and sketch graphs showing key features given a verbal description of the relationship. Key features include: intercepts;; intervals where the function is increasing, decreasing, positive, or negative;; relative maximums and minimums;; symmetries;; end behavior;; and periodicity.
F-IF.5 Relate the domain of a function to its graph and, where applicable, to the quantitative relationship it
describes F-IF.6 Calculate and interpret the average rate of change of a function (presented symbolically or as a table)
over a specified interval. Estimate the rate of change from a graph. F-IF.7 Graph functions expressed symbolically and show key features of the graph, by hand in simple cases
and using technology for more complicated cases. F-IF.7a Graph linear and quadratic functions and show intercepts, maxima, and minima. F-IF.7b Graph square root, cube root, and piecewise-defined functions, including step functions and
absolute value functions.
Cambridge Public Schools Page 15 2015-2016
Cambridge Public Schools Grade 8 Accelerated Pathway Mathematics Curriculum Map
MATH IN FOCUS/Edgenuity 2015 – 2016
F-IF.8 Write a function defined by an expression in different but equivalent forms to reveal and explain
different properties of the function. a. Use the process of factoring and completing the square in a quadratic function to show zeros, extreme values, and symmetry of the graph, and interpret these in terms of a context.
F-IF.9 Compare properties of two functions each represented in a different way (algebraically, graphically,
numerically in tables, or by verbal descriptions) F-LE.1 Distinguish between situations that can be modeled with linear functions and with exponential
functions. F-LE.1a Prove that linear functions grow by equal differences over equal intervals, and that exponential
functions grow by equal factors over equal intervals. F-LE.1b Recognize situations in which one quantity changes at a constant rate per unit interval relative to
another. F-LE.2 Construct linear and exponential functions, including arithmetic and geometric sequences, given a
graph, a description of a relationship, or two input - output pairs (include reading these from a table). A-CED.2 Create equations in two or more variables to represent relationships between quantities;; graph
equations on coordinate axes with labels and scales. A-CED.3 Represent constraints by equations or inequalities, and by systems of equations and/or inequalities,
and interpret solutions as viable or non-viable options in a modeling context. For example, represent inequalities describing nutritional and cost constraints on combinations of different foods.
F-BF.1 Write a function that describes a relationship between two quantities.*
F-BF.1a Determine an explicit expression, a recursive process, or steps for calculation from a context.* F-BF.1b Combine standard function types using arithmetic operations. For example, build a function that
models the temperature of a cooling body by adding a constant function to a decaying exponential, and relate these functions to the model. *
F-BF.1c (+) Compose functions. For example, if T(y) is the temperature in the atmosphere as a function of height, and h ( t ) is the height of a weather balloon as a function of time, then T ( h ( t )) is the temperature at the location of the weather balloon as a function of time. *
F-BF.2 Write arithmetic and geometric sequences both recursively and with an explicit formula, use them to
model situations, and translate between the two forms. N.Q.1 Use units as a way to understand problems and to guide the solution of multi-step problems;; choose
and interpret units consistently in formulas;; choose and interpret the scale and the origin in graphs and data displays.
S-ID.6 Represent data on two quantitative variables on a scatter plot, and describe how the variables are
related.
Cambridge Public Schools Page 16 2015-2016
Cambridge Public Schools Grade 8 Accelerated Pathway Mathematics Curriculum Map
MATH IN FOCUS/Edgenuity 2015 – 2016
S-ID.6a Fit a function to the data;; use functions fitted to data to solve problems in the context of the data. Use given functions or choose a function suggested by the context. Emphasize linear, quadratic, and exponential models.
S-ID.6b Informally assess the fit of a function by plotting and analyzing residuals. S-ID.6c Fit a linear function for a scatter plot that suggests a linear association.
S-ID.7 Interpret the slope (rate of change) and the intercept (constant term) of a linear model in the context of
the data. S-ID.8 Compute (using technology) and interpret the correlation coefficient of a linear fit. S-ID.9 Distinguish between correlation and causation.
Cambridge Public Schools Page 17 2015-2016
Cambridge Public Schools Grade 8 Accelerated Pathway Mathematics Curriculum Map
MATH IN FOCUS/Edgenuity 2015 – 2016
UNIT 5 : November 30 - December 18 Edgenuity: Linear Equations and Inequalities
Lessons: Solving Linear Equation: Variable on One Side
Solving Linear Equation: Variable on Both Sides
Solving Linear Equation: Distributive Property
Solving Mixture Problems
Solving Rate Problems
Literal Equations
Solving Absolute Value Equations
Solving One-Variable Inequalities
Introduction to Compound Inequalities
Standards: A-CED.1 Create equations and inequalities in one variable and use them to solve problems. Include equations
arising from linear and quadratic functions, and simple rational and exponential functions. A-CED.3 Represent constraints by equations or inequalities, and by systems of equations and/or inequalities,
and interpret solutions as viable or non-viable options in a modeling context. For example, represent
inequalities describing nutritional and cost constraints on combinations of different foods.
A-CED.4Rearrange formulas to highlight a quantity of interest, using the same reasoning as in solving
equations. For example, rearrange Ohm’s law V = IR to highlight resistance R.
A-REI.1 Explain each step in solving a simple equation as following from the equality of numbers asserted at
the previous step, starting from the assumption that the original equation has a solution. Construct a
viable argument to justify a solution method.
A-REI.11Explain why the x- coordinates of the points where the graphs of the equation y = f(x) and y = g(x)
intersect are the solutions of the equation f(x) = g(x) ;; find the solutions approximately, e.g., using
technology to graph the functions, make tables of values, or find successive approximations. Include
cases where f(x) and/or g(x) are linear, polynomial, rational, absolute value, exponential, and
logarithmic functions.
F-BF.1 Write a function that describes a relationship between two quantities.*
F-BF.1a Determine an explicit expression, a recursive process, or steps for calculation from a context.* F-BF.1b Combine standard function types using arithmetic operations. For example, build a function that
models the temperature of a cooling body by adding a constant function to a decaying
exponential, and relate these functions to the model. *
F-BF.1c (+) Compose functions. For example, if T(y) is the temperature in the atmosphere as a function of height, and h ( t ) is the height of a weather balloon as a function of time, then T ( h ( t )) is the
temperature at the location of the weather balloon as a function of time. *
Cambridge Public Schools Page 18 2015-2016
Cambridge Public Schools Grade 8 Accelerated Pathway Mathematics Curriculum Map
MATH IN FOCUS/Edgenuity 2015 – 2016
UNIT 6 : December 21 - January 25 Edgenuity: Systems of Equations and Inequalities Lessons:
Solving Systems of Linear Equations: Graphing Solving Systems of Linear Equations: Substitution Solving Systems: Intro to Linear Combinations (Elimination) Solving Systems: Linear Combinations (Elimination) Modeling with Systems of Linear Equations Graphing Two-Variable Linear Inequalities Modeling with Two-Variable Linear Inequalities Solving Systems of Linear Inequalities Modeling with Systems of Linear Inequalities
Standards: A-REI.5 Prove that, given a system of two equations in two variables, replacing one equation by the sum of
that equation and a multiple of the other produces a system with the same solutions. A-REI.6 Solve systems of linear equations exactly and approximately (e.g., with graphs), focusing on pairs of
linear equations in two variables. A-REI.12Graph the solutions to a linear inequality in two variables as a half-plane (excluding the boundary in
the case of a strict inequality), and graph the solution set to a system of linear inequalities in two variables as the intersection of the corresponding half-planes.
A-CED.3 Represent constraints by equations or inequalities, and by systems of equations and/or inequalities,
and interpret solutions as viable or non-viable options in a modeling context. For example, represent inequalities describing nutritional and cost constraints on combinations of different foods.
Cambridge Public Schools Page 19 2015-2016
Cambridge Public Schools Grade 8 Accelerated Pathway Mathematics Curriculum Map
MATH IN FOCUS/Edgenuity 2015 – 2016
UNIT 7 : January 26 - February 8 Edgenuity: Non-linear Functions
Lessons:
Linear Piece-Wise Defined Functions Step Functions Absolute Value Functions and Translations Reflections and Dilations of Absolute Value Functions Square Root Function Cube Root Function
Standards: F-IF.2 Use function notation, evaluate functions for inputs in their domains, and interpret statements that use
function notation in terms of a context. F-IF.5 Relate the domain of a function to its graph and, where applicable, to the quantitative relationship it
describes F-IF.7 Graph functions expressed symbolically and show key features of the graph, by hand in simple cases
and using technology for more complicated cases. F-IF.7a Graph linear and quadratic functions and show intercepts, maxima, and minima. F-IF.7b Graph square root, cube root, and piecewise-defined functions, including step functions and
absolute value functions. F-BF.3 Identify the effect on the graph of replacing f(x) by f(x) + k, kf(x), f(kx), and f(x + k) for specific
values of k (both positive and negative);; find the value of k given the graphs. Experiment with cases and illustrate an explanation of the effects on the graph using technology. Include recognizing even and odd functions from their graphs and algebraic expressions for them.
N-RN.2 Rewrite expressions involving radicals and rational exponents using the properties of exponents.
Cambridge Public Schools Page 20 2015-2016
Cambridge Public Schools Grade 8 Accelerated Pathway Mathematics Curriculum Map
MATH IN FOCUS/Edgenuity 2015 – 2016
UNIT 8 : February 22 - March 4 Edgenuity: Exponential Functions Lessons:
Exponential Growth Functions Exponential Decay Functions Vertical Stretches and Shrinks of Exponential Functions Reflections of Exponential Functions Translations of Exponential Functions Exponential Functions with Radical Bases (supporting) Geometric Sequences (supporting)
Standards: A-SSE.1 Interpret expressions that represent a quantity in terms of its context.
A-SSE.1a Interpret parts of an expression, such as terms, factors, and coefficients. A-SSE.1b Interpret complicated expressions by viewing one or more of their parts as a single entity .
For example, interpret P(1 + r) n as the product of P and a factor not depending on P. A-SSE.3 Choose and produce an equivalent form of an expression to reveal and explain properties of the
quantity represented by the expression. A-SSE.3a Factor a quadratic expression to reveal the zeros of the function it defines. A-SSE.3b Complete the square in a quadratic expression to reveal the maximum or minimum value of
the function it defines. A-SSE.3c Use the properties of exponents to transform expressions for exponential functions. For
example, the expression 1.15 t can be rewritten as (1.15 1/12 ) 12t ≈ 1.012 12t to reveal the approximate equivalent monthly interest rate if the annual rate is 15%.
F-IF.3 Recognize that sequences are functions, sometimes defined recursively, whose domain is a subset of
the integers. F-IF.4 For a function that models a relationship between two quantities, interpret key features of graphs and
tables in terms of the quantities, and sketch graphs showing key features given a verbal description of the relationship. Key features include: intercepts;; intervals where the function is increasing, decreasing, positive, or negative;; relative maximums and minimums;; symmetries;; end behavior;; and periodicity.
F-IF.7 Graph functions expressed symbolically and show key features of the graph, by hand in simple cases
and using technology for more complicated cases. F-IF.7a Graph linear and quadratic functions and show intercepts, maxima, and minima. F-IF.7b Graph square root, cube root, and piecewise-defined functions, including step functions and
absolute value functions. F-IF.8 Write a function defined by an expression in different but equivalent forms to reveal and explain
different properties of the function. a. Use the process of factoring and completing the square in a quadratic function to show zeros, extreme values, and symmetry of the graph, and interpret these in terms of a context.
Cambridge Public Schools Page 21 2015-2016
Cambridge Public Schools Grade 8 Accelerated Pathway Mathematics Curriculum Map
MATH IN FOCUS/Edgenuity 2015 – 2016
F-LE.1 Distinguish between situations that can be modeled with linear functions and with exponential
functions.
F-LE.1a Prove that linear functions grow by equal differences over equal intervals, and that exponential functions grow by equal factors over equal intervals.
F-LE.1b Recognize situations in which one quantity changes at a constant rate per unit interval relative to another.
F-LE.3 Observe using graphs and tables that a quantity increasing exponentially eventually exceeds a quantity
increasing linearly, quadratically, or (more generally) as a polynomial function.
F-LE.5 Interpret the parameters in a linear or exponential function in terms of a context. F-BF.1 Write a function that describes a relationship between two quantities.*
F-BF.1a Determine an explicit expression, a recursive process, or steps for calculation from a context.* F-BF.1b Combine standard function types using arithmetic operations. For example, build a function that
models the temperature of a cooling body by adding a constant function to a decaying exponential, and relate these functions to the model. *
F-BF.1c (+) Compose functions. For example, if T(y) is the temperature in the atmosphere as a function of height, and h ( t ) is the height of a weather balloon as a function of time, then T ( h ( t )) is the temperature at the location of the weather balloon as a function of time. *
F-BF.2 Write arithmetic and geometric sequences both recursively and with an explicit formula, use them to
model situations, and translate between the two forms.
F-BF.3 Identify the effect on the graph of replacing f(x) by f(x) + k, kf(x), f(kx), and f(x + k) for specific
values of k (both positive and negative);; find the value of k given the graphs. Experiment with cases
and illustrate an explanation of the effects on the graph using technology. Include recognizing even and odd functions from their graphs and algebraic expressions for them.
N-RN.1 Explain how the definition of the meaning of rational exponents follows from extending the properties of integer exponents to those values, allowing for a notation for radicals in terms of rational exponents.
N-RN.2 Rewrite expressions involving radicals and rational exponents using the properties of exponents.
Cambridge Public Schools Page 22 2015-2016
Cambridge Public Schools Grade 8 Accelerated Pathway Mathematics Curriculum Map
MATH IN FOCUS/Edgenuity 2015 – 2016
UNIT 9 : March 7 - March 24 Edgenuity: Polynomial Expressions
Lessons:
Introduction to Polynomials Adding and Subtracting Polynomials Multiplying Monomials and Polynomials Multiplying Polynomials and Simplifying Expressions Factoring Polynomials: GCF Factoring Polynomials: Double Grouping Factoring Trinomials: a=1 Factoring Trinomials: a=1 (continued) Factoring Trinomials: a>1 Factoring Polynomials: Difference of Squares Factoring Polynomials: Sum and Difference of Cubes Factoring Polynomials Completely
Standards: A-SSE.1 Interpret expressions that represent a quantity in terms of its context.
A-SSE.1a Interpret parts of an expression, such as terms, factors, and coefficients. A-SSE.1b Interpret complicated expressions by viewing one or more of their parts as a single entity .
For example, interpret P(1 + r) n as the product of P and a factor not depending on P. A-SSE.2 Use the structure of an expression to identify ways to rewrite it. For example, see x 4 – y 4 as (x 2 ) 2 –
(y 2 ) 2 , thus recognizing it as a difference of squares that can be factored as (x 2 – y 2 )(x 2 + y 2 ). A-APR.1 Understand that polynomials form a system analogous to the integers, namely, they are closed under
the operations of addition, subtraction, and multiplication;; add, subtract, and multiply polynomials. A-APR.MA.1a Divide polynomials.
Cambridge Public Schools Page 23 2015-2016
Cambridge Public Schools Grade 8 Accelerated Pathway Mathematics Curriculum Map
MATH IN FOCUS/Edgenuity 2015 – 2016
UNIT 10 : March 28 - April 8 Edgenuity: Quadratic Functions
Lessons:
Intro to Quadratic Functions Quadratic Functions: Standard Form Quadratic Functions: Factored Form Quadratic Functions: Vertex Form Completing the Square Completing the Square (continued) Modeling with Quadratic Functions
Standards: A-CED.2Create equations in two or more variables to represent relationships between quantities;; graph
equations on coordinate axes with labels and scales. F-IF.7 Graph functions expressed symbolically and show key features of the graph, by hand in simple cases
and using technology for more complicated cases. F-IF.7a Graph linear and quadratic functions and show intercepts, maxima, and minima. F-IF.7b Graph square root, cube root, and piecewise-defined functions, including step functions and
absolute value functions. F-IF.8 Write a function defined by an expression in different but equivalent forms to reveal and explain
different properties of the function. a. Use the process of factoring and completing the square in a quadratic function to show zeros, extreme values, and symmetry of the graph, and interpret these in terms of a context.
F-IF.9 Compare properties of two functions each represented in a different way (algebraically, graphically,
numerically in tables, or by verbal descriptions) A-SSE.3 Choose and produce an equivalent form of an expression to reveal and explain properties of the
quantity represented by the expression. A-SSE.3a Factor a quadratic expression to reveal the zeros of the function it defines. A-SSE.3b Complete the square in a quadratic expression to reveal the maximum or minimum value of
the function it defines. A-SSE.3c Use the properties of exponents to transform expressions for exponential functions. For
example, the expression 1.15 t can be rewritten as (1.15 1/12 ) 12 t ≈ 1.012 12 t to reveal the
approximate equivalent monthly interest rate if the annual rate is 15%. F-BF.3 Identify the effect on the graph of replacing f ( x ) by f ( x ) + k , kf ( x ), f ( kx ), and f ( x + k ) for specific
values of k (both positive and negative);; find the value of k given the graphs. Experiment with cases and illustrate an explanation of the effects on the graph using technology. Include recognizing even and odd functions from their graphs and algebraic expressions for them.
Cambridge Public Schools Page 24 2015-2016
Cambridge Public Schools Grade 8 Accelerated Pathway Mathematics Curriculum Map
MATH IN FOCUS/Edgenuity 2015 – 2016
A-REI.4 Solve quadratic equations in one variable. A-REI.4a Use the method of completing the square to transform any quadratic equation in x into an
equation of the form (x-p) 2 =q that has the same solutions. Derive the quadratic formula from this form.
A-REI.4b Solve quadratic equations by inspection, taking square roots, completing the square, the quadratic formula and factoring, as appropriate to the initial form of the equation. Recognize when the quadratic formula gives complex solutions and write them as a+-bi for real numbers a and b .
Cambridge Public Schools Page 25 2015-2016
Cambridge Public Schools Grade 8 Accelerated Pathway Mathematics Curriculum Map
MATH IN FOCUS/Edgenuity 2015 – 2016
UNIT 11 : April 11 - May 4 Edgenuity: Quadratic Equations
Lessons:
Solving Quadratic Equations: Zero Product Property Solving Quadratic Equations: Factoring Solving Quadratic Equations: Square Root Property Solving Quadratic Equations: Completing the Square Solving Quadratic Equations: Completing the Square ( continued) Introduction to the Quadratic Formula Solving Quadratic Equations: Quadratic Formula Modeling with Quadratic Equations Solving Linear and Quadratic Systems
Standards: A-REI.4 Solve quadratic equations in one variable.
A-REI.4a Use the method of completing the square to transform any quadratic equation in x into an equation of the form (x-p) 2 =q that has the same solutions. Derive the quadratic formula from this form.
A-REI.4b Solve quadratic equations by inspection, taking square roots, completing the square, the quadratic formula and factoring, as appropriate to the initial form of the equation. Recognize when the quadratic formula gives complex solutions and write them as a+-bi for real numbers a and b .
A-REI.7 Solve a simple system consisting of a linear equation and a quadratic equation in two variables
algebraically and graphically. A-REI.11Explain why the x- coordinates of the points where the graphs of the equation y = f(x) and y = g(x)
intersect are the solutions of the equation f(x) = g(x) ;; find the solutions approximately, e.g., using technology to graph the functions, make tables of values, or find successive approximations. Include cases where f(x) and/or g(x) are linear, polynomial, rational, absolute value, exponential, and logarithmic functions.
F-IF.8 Write a function defined by an expression in different but equivalent forms to reveal and explain
different properties of the function. a. Use the process of factoring and completing the square in a quadratic function to show zeros, extreme values, and symmetry of the graph, and interpret these in terms of a context.
N-RN.3 Explain why the sum or product of two rational numbers is rational;; that the sum of a rational number
and an irrational number is irrational;; and that the product of a nonzero rational number and an irrational number is irrational.
Cambridge Public Schools Page 26 2015-2016
Cambridge Public Schools Grade 8 Accelerated Pathway Mathematics Curriculum Map
MATH IN FOCUS/Edgenuity 2015 – 2016
UNIT 12 : May 9 - May 27 Edgenuity: Data Analysis
Lessons: Describing Data
Two-Way Tables
Relative Frequencies and Association
Measures of Center
Standard Deviation
Line of Best Fit
Analyzing Residuals
Strength of Correlation
Regression Models
Standards: S-ID.1 Observe using graphs and tables that a quantity increasing exponentially eventually exceeds a quantity
increasing linearly, quadratically, or (more generally) as a polynomial function. S-ID.2 Use statistics appropriate to the shape of the data distribution to compare center (median, mean) and
spread (interquartile range, standard deviation) of two or more different data sets. S-ID.3 Interpret differences in shape, center, and spread in the context of the data sets, accounting for
possible effects of extreme data points (outliers).
S-ID.4 Use the mean and standard deviation of a data set to fit it to a normal distribution and to estimate
population percentages. Recognize that there are data sets for which such a procedure is not
appropriate. Use calculators, spreadsheets, and tables to estimate areas under the normal curve.
S-ID.5 Summarize categorical data for two categories in two-way frequency tables. Interpret relative
frequencies in the context of the data (including joint, marginal, and conditional relative frequencies).
Recognize possible associations and trends in the data. (will be expanded in Algebra II) N.Q.1 Use units as a way to understand problems and to guide the solution of multi-step problems;; choose
and interpret units consistently in formulas;; choose and interpret the scale and the origin in graphs and
data displays.
UNIT 13 : May 31 – June 21 End-of-Year Unit: Extensions
Unit Notes: In this unit, students will:
o review for Algebra I Exam.
o revisit extension work from previous units.
Cambridge Public Schools Page 27 2015-2016