Embed Size (px)
Citation preview
Creating Value in Colombia: Profitable Production Growth
& High-Impact Exploration, Funded Through Cash Flow
May 2018

2
General Advisory The information contained in this presentation does not purport to be all-inclusive or contain all information that readers may require. You are encouraged to conduct your own analysis and review of Gran Tierra Energy Inc. (“Gran Tierra”, “GTE”, or the “Company”) and of the information contained in this presentation. Without limitation, you should read the entire record of publicly filed documents relating to the Company, consider the advice of your financial, legal, accounting, tax and other professional advisors and such other factors you consider appropriate in investigating and analyzing the Company. You should rely only on the information provided by the Company and not rely on parts of that information to the exclusion of others. The Company has not authorized anyone to provide you with additional or different information, and any such information, including statements in media articles about Gran Tierra, should not be relied upon. No representation or warranty, express or implied, is made by Gran Tierra as to the accuracy or completeness of the information contained in this document, and nothing contained in this presentation is, or shall be relied upon as, a promise or representation by Gran Tierra.
An investment in the securities of Gran Tierra is speculative and involves a high degree of risk that should be considered by potential purchasers. Gran Tierra’s business is subject to the risks normally encountered in the oil and gas industry and, more specifically, certain other risks that are associated with Gran Tierra’s operations and current stage of development. An investment in the Company’s securities is suitable only for those purchasers who are willing to risk a loss of some or all of their investment and who can afford to lose some or all of their investment. You should carefully consider the risks described under the heading “Risk Factors” in the Company’s Annual Report on Form 10-K for the year ended December 31, 2017 and in the Company’s other SEC filings.
In this presentation, unless otherwise indicated, all dollar amounts are expressed in U.S. dollars. All production, reserves and resources are working interest before royalties (“WI”). Please see the appendices to this presentation for important advisories relating to the Company’s presentation of oil and gas information and financial information, including the presentation of non-GAAP measures, available at www.grantierra.com. Current market values are based on a NYSE share price of US$3.32 as at close on April 27, 2018 and 394.8 million issued and outstanding shares as of April 27, 2018.
Forward-Looking Information Advisory This presentation contains forward-looking statements within the meaning of the United States Private Securities Litigation Reform Act of 1995, Section 27A of the Securities Act of 1933, as amended, and Section 21E of the Securities Exchange Act of 1934, as amended, and financial outlook and forward looking information within the meaning of applicable Canadian securities laws (collectively, “forward-looking statements”). All statements other than statements of historical facts included in this presentation regarding our financial position, estimated quantities and net present value of reserves, business strategy, plans and objectives for future operations, capital spending plans and those statements preceded by, followed by or that otherwise include the words “believe”, “expect”, “intend”, “anticipate”, “forecast”, “will”, “estimate”, “target”, “project”, “goal”, “plan”, “should” or similar expressions are forward-looking statements. Such forward-looking statements include, but are not limited to, statements about: future projected or target production and the growth of production including the product mix of such production and expectations respecting production growth; our ability to grow in both the near and long term and the funding of our growth opportunities; our possible creation of new core areas; our prospects and leads; our pursuit of opportunities in Mexico; the plans, objectives, expectations and intentions of the Company regarding production, exploration and exploration upside, drilling, permitting, testing and development; Gran Tierra’s 2018 capital program including the changes thereto along with the expected costs and the expected allocation of the capital program; and Gran Tierra’s financial position and the future development of the company’s business. Statements respecting reserves are forward-looking statements as they involve the implied assessment, based on estimates and assumptions, that the reserves and resources described exist in the quantities predicted or estimated and can be profitably produced in the future.
Estimates of future production, cash flow guidance and certain expenses may be considered to be future-oriented financial information or a financial outlook for the purposes of applicable Canadian securities laws. Financial outlook and future-oriented financial information contained in this presentation about prospective financial performance, financial position or cash flows are based on assumptions about future events, including economic conditions and proposed courses of action, based on management’s assessment of the relevant information currently available, and to become available in the future. In particular, this presentation contains projected production and operational information for 2018, 2019 and 2020. These projections contain forward-looking statements and are based on a number of material assumptions and factors set out above. Actual results may differ significantly from the projections presented herein. These projections may also be considered to contain future-oriented financial information or a financial outlook. The actual results of Gran Tierra’s operations for any period will likely vary from the amounts set forth in these projections, and such variations may be material. See above for a discussion of the risks that could cause actual results to vary. The future-oriented financial information and financial outlooks contained in this presentation have been approved by management as of the date of this presentation. Readers are cautioned that any such financial outlook and future-oriented financial information contained herein should not be used for purposes other than those for which it is disclosed herein. The Company and its management believe that the prospective financial information has been prepared on a reasonable basis, reflecting management’s best estimates and judgments, and represent, to the best of management’s knowledge and opinion, the Company’s expected course of action. However, because this information is highly subjective, it should not be relied on as necessarily indicative of future results.
The forward-looking statements contained in this presentation are based on certain assumptions made by Gran Tierra based on management’s experience and perception of historical trends, current conditions, anticipated future development and other factors believed to be appropriate. Such statements are subject to a number of assumptions, risks and uncertainties, many of which are beyond Gran Tierra’s control, which may cause actual results to differ materially from those implied or expressed by the forward-looking statements. These include the factors discussed or referenced under the heading “Part 1. Item 1A. Risk Factors” in Gran Tierra’s 2017 Annual Report on Form 10-K, under the heading “Part II. Item 1A. Risk Factors” in Gran Tierra’s Quarterly Reports on Form 10-Q and in the other reports and filings with the Securities and Exchange Commission.
All forward-looking statements speak only as of the date on which such statements are made, and Gran Tierra undertakes no obligation to correct or update any forward-looking statements, whether as a result of new information, future events or otherwise, except as required by applicable law. Gran Tierra’s forward-looking statements are expressly qualified in their entirety by this cautionary statement.
3
Larger font projection layout
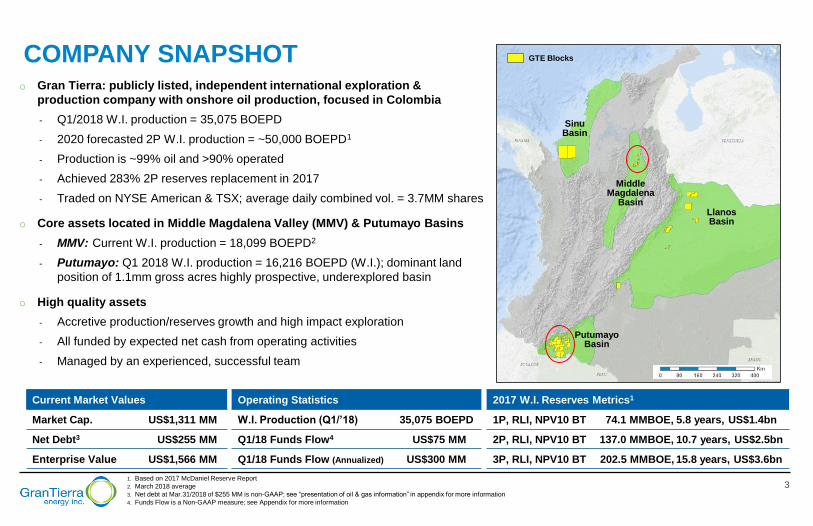
COMPANY SNAPSHOT
1. Based on 2017 McDaniel Reserve Report
2. March 2018 average
3. Net debt at Mar.31/2018 of $255 MM is non-GAAP; see “presentation of oil & gas information” in appendix for more information
4. Funds Flow is a Non-GAAP measure; see Appendix for more information
o Gran Tierra: publicly listed, independent international exploration &
production company with onshore oil production, focused in Colombia
- Q1/2018 W.I. production = 35,075 BOEPD
- 2020 forecasted 2P W.I. production = ~50,000 BOEPD1
- Production is ~99% oil and >90% operated
- Achieved 283% 2P reserves replacement in 2017
- Traded on NYSE American & TSX; average daily combined vol. = 3.7MM shares
o Core assets located in Middle Magdalena Valley (MMV) & Putumayo Basins
- MMV: Current W.I. production = 18,099 BOEPD2
- Putumayo: Q1 2018 W.I. production = 16,216 BOEPD (W.I.); dominant land
position of 1.1mm gross acres highly prospective, underexplored basin
o High quality assets
- Accretive production/reserves growth and high impact exploration
- All funded by expected net cash from operating activities
- Managed by an experienced, successful team
Current Market Values
Market Cap. US$1,311 MM
Net Debt3 US$255 MM
Enterprise Value US$1,566 MM
2017 W.I. Reserves Metrics1
1P, RLI, NPV10 BT 74.1 MMBOE, 5.8 years, US$1.4bn
2P, RLI, NPV10 BT 137.0 MMBOE, 10.7 years, US$2.5bn
3P, RLI, NPV10 BT 202.5 MMBOE, 15.8 years, US$3.6bn
Operating Statistics
W.I. Production (Q1/’18) 35,075 BOEPD
Q1/18 Funds Flow4 US$75 MM
Q1/18 Funds Flow (Annualized) US$300 MM
Sinu Basin
Middle Magdalena
Basin Llanos Basin
Putumayo Basin
GTE Blocks
4
Larger font projection layout
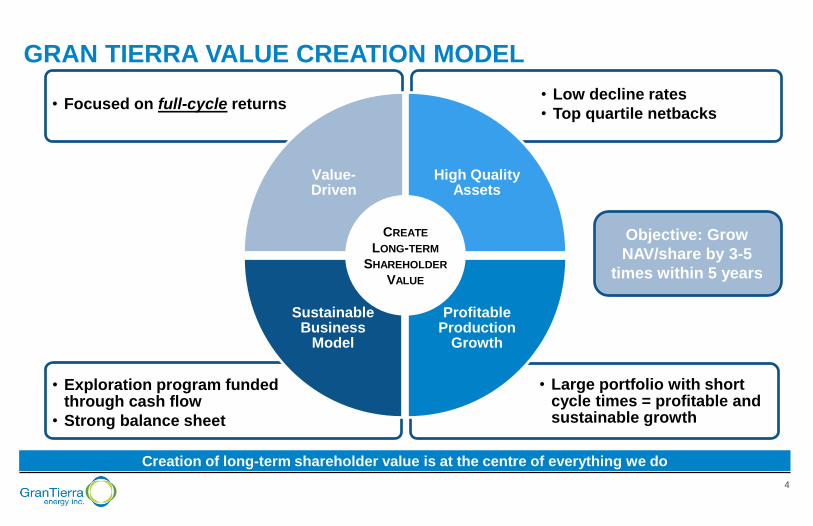
GRAN TIERRA VALUE CREATION MODEL
Creation of long-term shareholder value is at the centre of everything we do
• Large portfolio with short cycle times = profitable and sustainable growth
• Exploration program funded through cash flow
• Strong balance sheet
• Low decline rates
• Top quartile netbacks • Focused on full-cycle returns
Value-Driven
High Quality Assets
Profitable Production
Growth
Sustainable Business
Model
CREATE
LONG-TERM
SHAREHOLDER
VALUE
Objective: Grow
NAV/share by 3-5
times within 5 years
5
Larger font projection layout
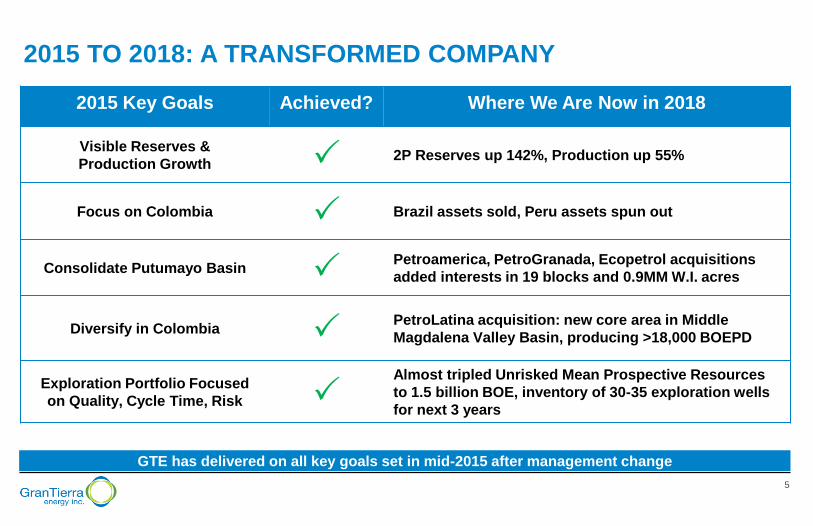
2015 TO 2018: A TRANSFORMED COMPANY
GTE has delivered on all key goals set in mid-2015 after management change
2015 Key Goals Achieved? Where We Are Now in 2018
Visible Reserves &
Production Growth P 2P Reserves up 142%, Production up 55%
Focus on Colombia P Brazil assets sold, Peru assets spun out
Consolidate Putumayo Basin P Petroamerica, PetroGranada, Ecopetrol acquisitions
added interests in 19 blocks and 0.9MM W.I. acres
Diversify in Colombia P PetroLatina acquisition: new core area in Middle
Magdalena Valley Basin, producing >18,000 BOEPD
Exploration Portfolio Focused
on Quality, Cycle Time, Risk P Almost tripled Unrisked Mean Prospective Resources
to 1.5 billion BOE, inventory of 30-35 exploration wells
for next 3 years
6
Larger font projection layout
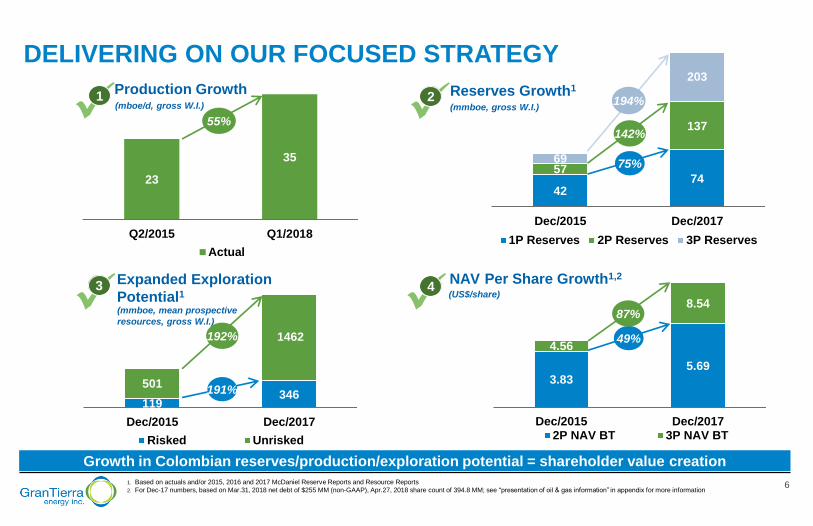
3.83 5.69
4.56
8.54
Dec/2015 Dec/20172P NAV BT 3P NAV BT
119 346
501
1462
Dec/2015 Dec/2017
Risked Unrisked
42 74
57
137
69
203
Dec/2015 Dec/2017
1P Reserves 2P Reserves 3P Reserves
23
35
Q2/2015 Q1/2018
Actual
2 Reserves Growth1
(mmboe, gross W.I.) 194%
142%
75%
DELIVERING ON OUR FOCUSED STRATEGY
1. Based on actuals and/or 2015, 2016 and 2017 McDaniel Reserve Reports and Resource Reports
2. For Dec-17 numbers, based on Mar.31, 2018 net debt of $255 MM (non-GAAP), Apr.27, 2018 share count of 394.8 MM; see “presentation of oil & gas information” in appendix for more information
Growth in Colombian reserves/production/exploration potential = shareholder value creation
1
4 NAV Per Share Growth1,2
(US$/share)
49%
87%
55%
Production Growth
(mboe/d, gross W.I.)
Expanded Exploration
Potential1
3
(mmboe, mean prospective
resources, gross W.I.)
191%
192%
7
Larger font projection layout
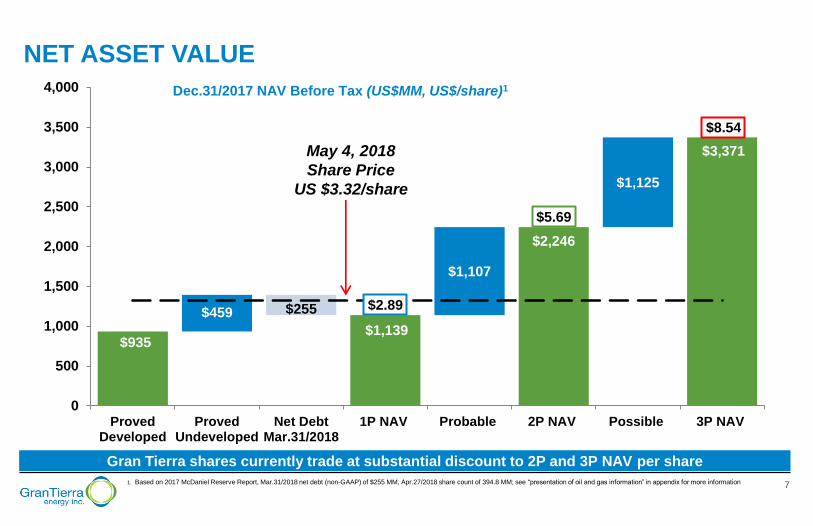
$935 $1,139
$2,246
$3,371
$459 $255
$1,107
$1,125
$2.89
$5.69
$8.54
0
500
1,000
1,500
2,000
2,500
3,000
3,500
4,000
ProvedDeveloped
ProvedUndeveloped
Net DebtMar.31/2018
1P NAV Probable 2P NAV Possible 3P NAV
NET ASSET VALUE
1. Based on 2017 McDaniel Reserve Report, Mar.31/2018 net debt (non-GAAP) of $255 MM, Apr.27/2018 share count of 394.8 MM; see “presentation of oil and gas information” in appendix for more information
Gran Tierra shares currently trade at substantial discount to 2P and 3P NAV per share
Dec.31/2017 NAV Before Tax (US$MM, US$/share)1
May 4, 2018
Share Price
US $3.32/share
8
Larger font projection layout
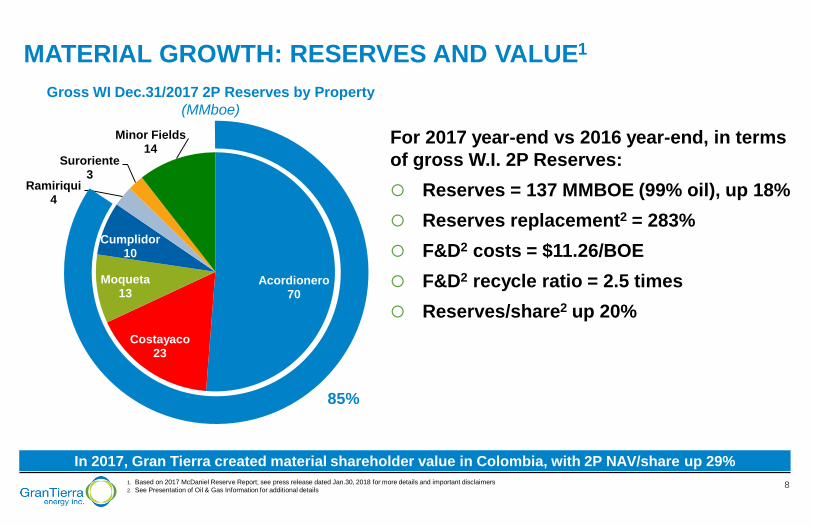
Acordionero 70
Costayaco 23
Moqueta 13
Cumplidor 10
Ramiriqui 4
Suroriente 3
Minor Fields 14
MATERIAL GROWTH: RESERVES AND VALUE1
For 2017 year-end vs 2016 year-end, in terms
of gross W.I. 2P Reserves:
Reserves = 137 MMBOE (99% oil), up 18%
Reserves replacement2 = 283%
F&D2 costs = $11.26/BOE
F&D2 recycle ratio = 2.5 times
Reserves/share2 up 20%
1. Based on 2017 McDaniel Reserve Report; see press release dated Jan.30, 2018 for more details and important disclaimers
2. See Presentation of Oil & Gas Information for additional details
In 2017, Gran Tierra created material shareholder value in Colombia, with 2P NAV/share up 29%
Gross WI Dec.31/2017 2P Reserves by Property
(MMboe)
85%
9
Larger font projection layout
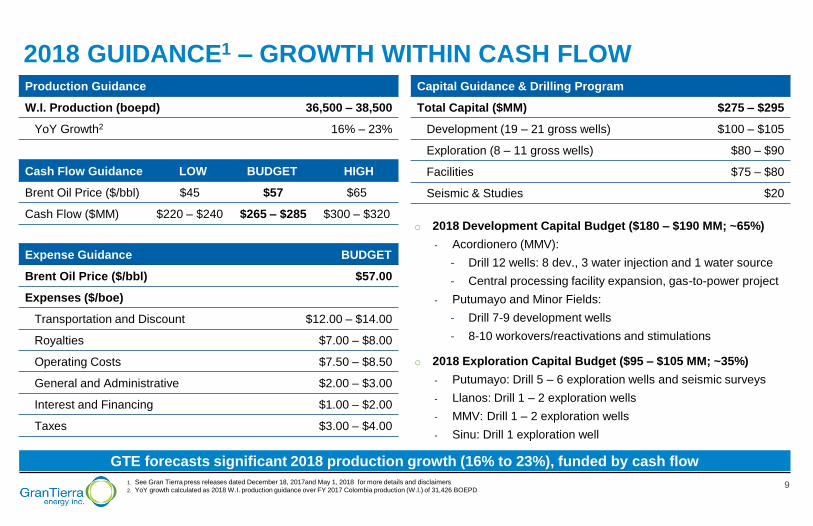
o 2018 Development Capital Budget ($180 – $190 MM; ~65%)
- Acordionero (MMV):
- Drill 12 wells: 8 dev., 3 water injection and 1 water source
- Central processing facility expansion, gas-to-power project
- Putumayo and Minor Fields:
- Drill 7-9 development wells
- 8-10 workovers/reactivations and stimulations
o 2018 Exploration Capital Budget ($95 – $105 MM; ~35%)
- Putumayo: Drill 5 – 6 exploration wells and seismic surveys
- Llanos: Drill 1 – 2 exploration wells
- MMV: Drill 1 – 2 exploration wells
- Sinu: Drill 1 exploration well
2018 GUIDANCE1 – GROWTH WITHIN CASH FLOW
1. See Gran Tierra press releases dated December 18, 2017and May 1, 2018 for more details and disclaimers
2. YoY growth calculated as 2018 W.I. production guidance over FY 2017 Colombia production (W.I.) of 31,426 BOEPD
GTE forecasts significant 2018 production growth (16% to 23%), funded by cash flow
Production Guidance
W.I. Production (boepd) 36,500 – 38,500
YoY Growth2 16% – 23%
Expense Guidance BUDGET
Brent Oil Price ($/bbl) $57.00
Expenses ($/boe)
Transportation and Discount $12.00 – $14.00
Royalties $7.00 – $8.00
Operating Costs $7.50 – $8.50
General and Administrative $2.00 – $3.00
Interest and Financing $1.00 – $2.00
Taxes $3.00 – $4.00
Capital Guidance & Drilling Program
Total Capital ($MM) $275 – $295
Development (19 – 21 gross wells) $100 – $105
Exploration (8 – 11 gross wells) $80 – $90
Facilities $75 – $80
Seismic & Studies $20
Cash Flow Guidance LOW BUDGET HIGH
Brent Oil Price ($/bbl) $45 $57 $65
Cash Flow ($MM) $220 – $240 $265 – $285 $300 – $320
10
Smaller font slide document layout
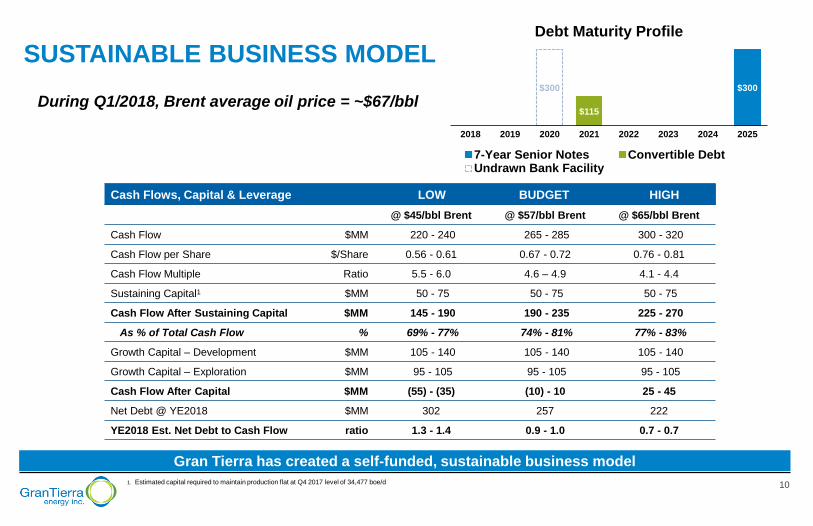
SUSTAINABLE BUSINESS MODEL
During Q1/2018, Brent average oil price = ~$67/bbl
Gran Tierra has created a self-funded, sustainable business model
1. Estimated capital required to maintain production flat at Q4 2017 level of 34,477 boe/d
Cash Flows, Capital & Leverage LOW BUDGET HIGH
@ $45/bbl Brent @ $57/bbl Brent @ $65/bbl Brent
Cash Flow $MM 220 - 240 265 - 285 300 - 320
Cash Flow per Share $/Share 0.56 - 0.61 0.67 - 0.72 0.76 - 0.81
Cash Flow Multiple Ratio 5.5 - 6.0 4.6 – 4.9 4.1 - 4.4
Sustaining Capital1 $MM 50 - 75 50 - 75 50 - 75
Cash Flow After Sustaining Capital $MM 145 - 190 190 - 235 225 - 270
As % of Total Cash Flow % 69% - 77% 74% - 81% 77% - 83%
Growth Capital – Development $MM 105 - 140 105 - 140 105 - 140
Growth Capital – Exploration $MM 95 - 105 95 - 105 95 - 105
Cash Flow After Capital $MM (55) - (35) (10) - 10 25 - 45
Net Debt @ YE2018 $MM 302 257 222
YE2018 Est. Net Debt to Cash Flow ratio 1.3 - 1.4 0.9 - 1.0 0.7 - 0.7
$300
$115
$300
2018 2019 2020 2021 2022 2023 2024 2025
Debt Maturity Profile
7-Year Senior Notes Convertible DebtUndrawn Bank Facility
11
Smaller font slide document layout
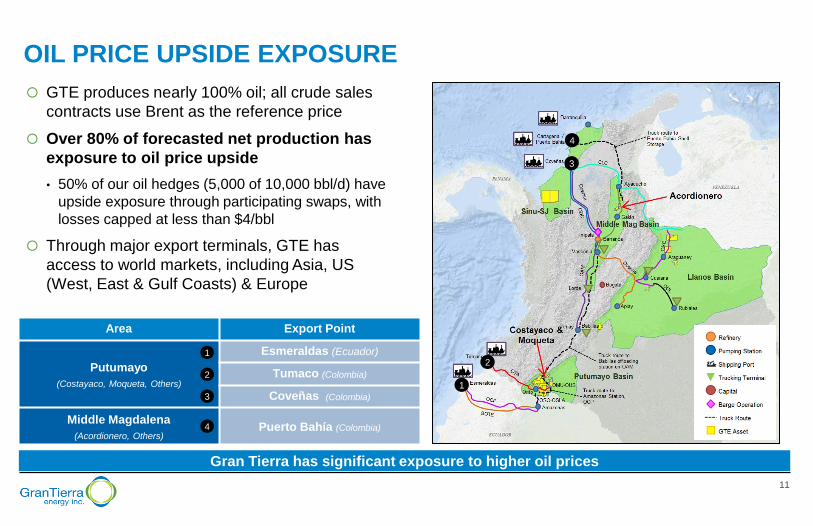
OIL PRICE UPSIDE EXPOSURE
GTE produces nearly 100% oil; all crude sales
contracts use Brent as the reference price
Over 80% of forecasted net production has
exposure to oil price upside
• 50% of our oil hedges (5,000 of 10,000 bbl/d) have
upside exposure through participating swaps, with
losses capped at less than $4/bbl
Through major export terminals, GTE has
access to world markets, including Asia, US
(West, East & Gulf Coasts) & Europe
Gran Tierra has significant exposure to higher oil prices
2
1
3
4
Area Export Point
Putumayo
(Costayaco, Moqueta, Others)
Esmeraldas (Ecuador)
Tumaco (Colombia)
Coveñas (Colombia)
Middle Magdalena
(Acordionero, Others) Puerto Bahía (Colombia)
1
2
3
4
12
Larger font projection layout
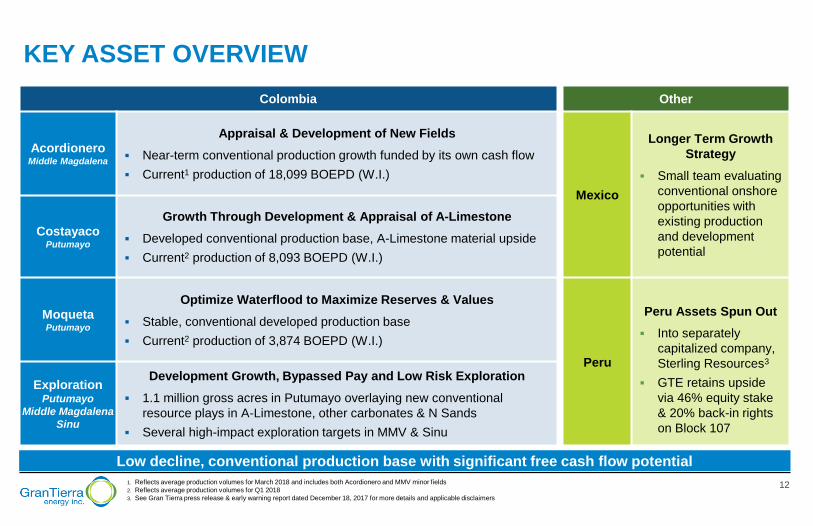
KEY ASSET OVERVIEW
Low decline, conventional production base with significant free cash flow potential
Colombia
Acordionero Middle Magdalena
Appraisal & Development of New Fields
Near-term conventional production growth funded by its own cash flow
Current1 production of 18,099 BOEPD (W.I.)
Costayaco Putumayo
Growth Through Development & Appraisal of A-Limestone
Developed conventional production base, A-Limestone material upside
Current2 production of 8,093 BOEPD (W.I.)
Moqueta Putumayo
Optimize Waterflood to Maximize Reserves & Values
Stable, conventional developed production base
Current2 production of 3,874 BOEPD (W.I.)
Exploration Putumayo
Middle Magdalena
Sinu
Development Growth, Bypassed Pay and Low Risk Exploration
1.1 million gross acres in Putumayo overlaying new conventional
resource plays in A-Limestone, other carbonates & N Sands
Several high-impact exploration targets in MMV & Sinu
Other
Mexico
Longer Term Growth
Strategy
Small team evaluating
conventional onshore
opportunities with
existing production
and development
potential
Peru
Peru Assets Spun Out
Into separately
capitalized company,
Sterling Resources3
GTE retains upside
via 46% equity stake
& 20% back-in rights
on Block 107
1. Reflects average production volumes for March 2018 and includes both Acordionero and MMV minor fields
2. Reflects average production volumes for Q1 2018
3. See Gran Tierra press release & early warning report dated December 18, 2017 for more details and applicable disclaimers

13
Larger font projection layout
$409 $804
$990
$1,578 $1,771
$2,272
At Acquisition Current1P 2P 3P
21 35
53
75
98
116
At Acquisition Current1P 2P 3P
NPV102
Acordionero + minor MMV fields have $1.6 billion 2P NPV102, more than triple the acquisition cost
o In August 2016, GTE made transformational & strategic
acquisition of PetroLatina for US$525 million
o Provided diversification into prolific Middle Magdalena
Valley Basin (MMV) through cash flow generating
growth asset with material development upside
o Since acquisition, oil production has grown 235% while
generating free cash flow
1. “At Acquisition” production based on forecast H2 2016 production as per press release dated Jul.1, 2016; “Current” production reflects average production volumes for March 2018
2. “At Acquisition” reserves and NPV based on a report with the effective date of December 31, 2015 prepared by McDaniel, “Current” reserves and NPV based on 2017 McDaniel Reserve Report
PETROLATINA: TRANSFORMATIONAL ACQUISITION IN MMV
Reserves2
(MMBOE; W.I.)
5,400
15,818
At Acquisition Current
Production1
(BOEPD; W.I.) ($MM)
235%
28%
67%
42%
18%
Acquisition
Cost =
$525MM 97%
59%
18,099
5,400
14
Smaller font slide document layout
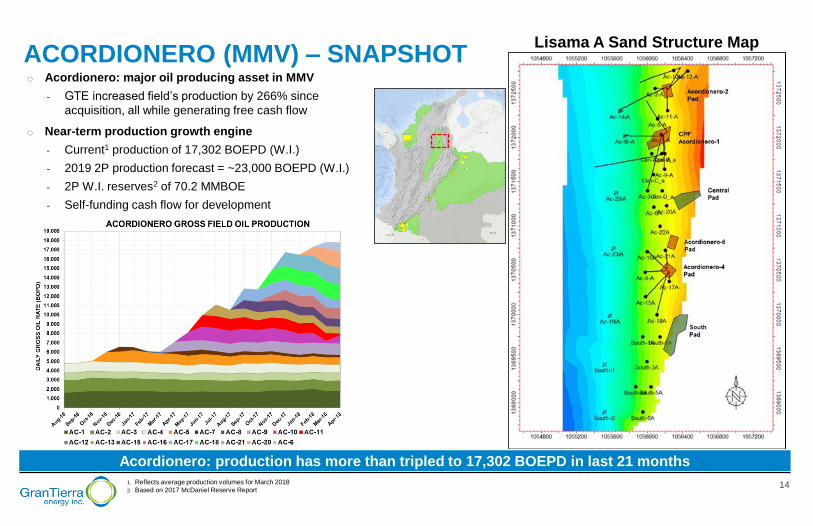
ACORDIONERO (MMV) – SNAPSHOT
Acordionero: production has more than tripled to 17,302 BOEPD in last 21 months
1. Reflects average production volumes for March 2018
2. Based on 2017 McDaniel Reserve Report
o Acordionero: major oil producing asset in MMV
- GTE increased field’s production by 266% since
acquisition, all while generating free cash flow
o Near-term production growth engine
- Current1 production of 17,302 BOEPD (W.I.)
- 2019 2P production forecast = ~23,000 BOEPD (W.I.)
- 2P W.I. reserves2 of 70.2 MMBOE
- Self-funding cash flow for development
Lisama A Sand Structure Map
15
Larger font projection layout
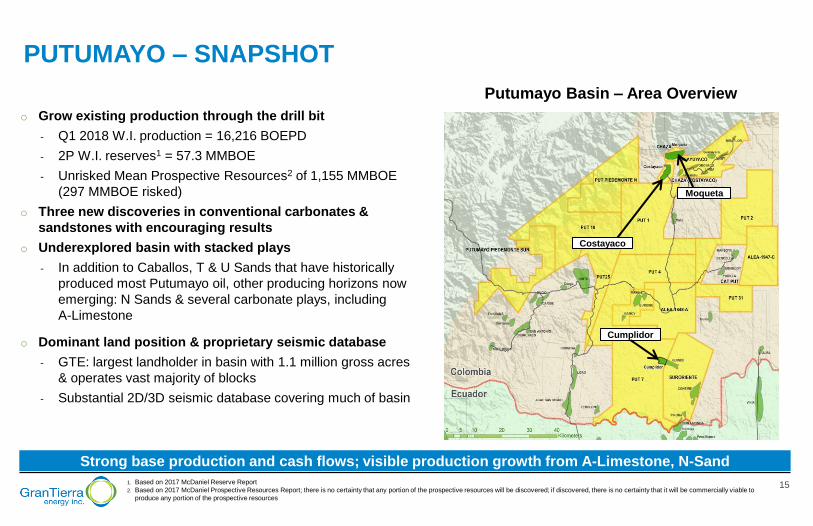
PUTUMAYO – SNAPSHOT
1. Based on 2017 McDaniel Reserve Report
2. Based on 2017 McDaniel Prospective Resources Report; there is no certainty that any portion of the prospective resources will be discovered; if discovered, there is no certainty that it will be commercially viable to
produce any portion of the prospective resources
Costayaco
Moqueta
Putumayo Basin – Area Overview
o Grow existing production through the drill bit
- Q1 2018 W.I. production = 16,216 BOEPD
- 2P W.I. reserves1 = 57.3 MMBOE
- Unrisked Mean Prospective Resources2 of 1,155 MMBOE
(297 MMBOE risked)
o Three new discoveries in conventional carbonates &
sandstones with encouraging results
o Underexplored basin with stacked plays
- In addition to Caballos, T & U Sands that have historically
produced most Putumayo oil, other producing horizons now
emerging: N Sands & several carbonate plays, including
A-Limestone
o Dominant land position & proprietary seismic database
- GTE: largest landholder in basin with 1.1 million gross acres
& operates vast majority of blocks
- Substantial 2D/3D seismic database covering much of basin
Cumplidor
Strong base production and cash flows; visible production growth from A-Limestone, N-Sand
16
Smaller font slide document layout
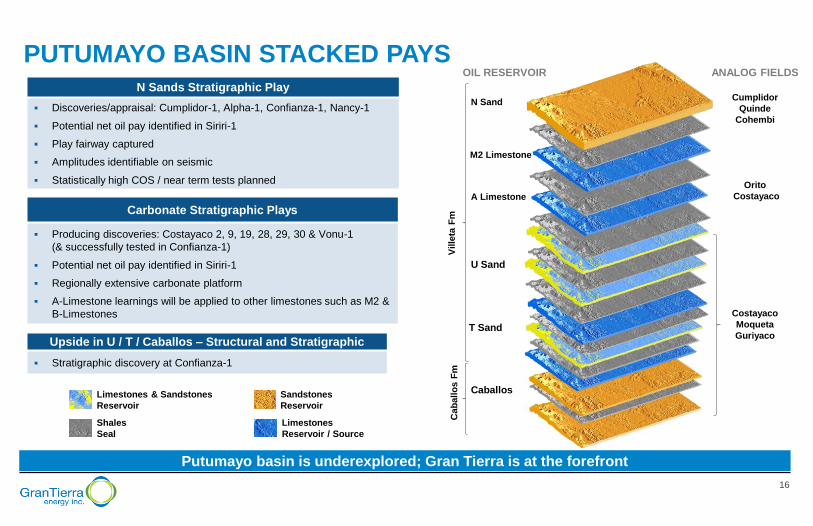
PUTUMAYO BASIN STACKED PAYS
Cab
allo
s F
m
Ville
ta F
m
ANALOG FIELDS
Caballos
T Sand
U Sand
Costayaco
Moqueta
Guriyaco
Orito
Costayaco A Limestone
M2 Limestone
N Sand Cumplidor
Quinde
Cohembi
OIL RESERVOIR
Putumayo basin is underexplored; Gran Tierra is at the forefront
Sandstones
Reservoir
Shales
Seal
Limestones
Reservoir / Source
Limestones & Sandstones
Reservoir
N Sands Stratigraphic Play
Discoveries/appraisal: Cumplidor-1, Alpha-1, Confianza-1, Nancy-1
Potential net oil pay identified in Siriri-1
Play fairway captured
Amplitudes identifiable on seismic
Statistically high COS / near term tests planned
Carbonate Stratigraphic Plays
Producing discoveries: Costayaco 2, 9, 19, 28, 29, 30 & Vonu-1
(& successfully tested in Confianza-1)
Potential net oil pay identified in Siriri-1
Regionally extensive carbonate platform
A-Limestone learnings will be applied to other limestones such as M2 &
B-Limestones
Upside in U / T / Caballos – Structural and Stratigraphic
Stratigraphic discovery at Confianza-1
17
Larger font projection layout
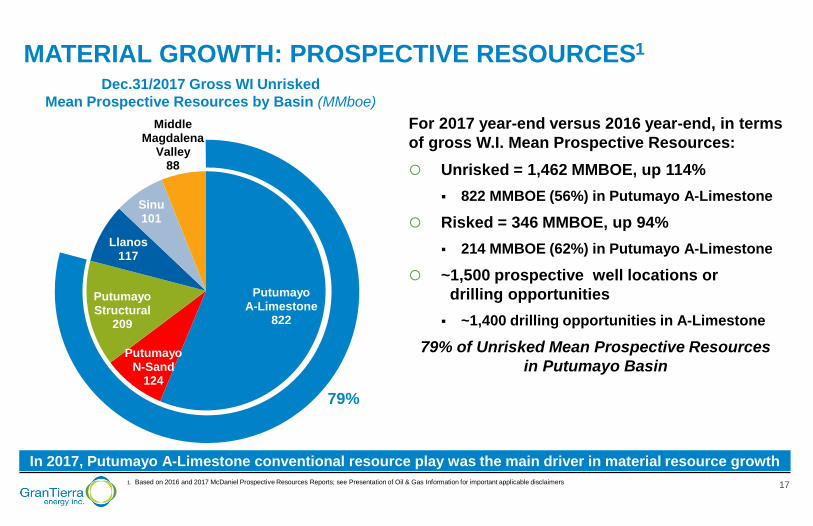
Putumayo A-Limestone
822
Putumayo N-Sand
124
Putumayo Structural
209
Llanos 117
Sinu 101
Middle Magdalena
Valley 88
MATERIAL GROWTH: PROSPECTIVE RESOURCES1
For 2017 year-end versus 2016 year-end, in terms
of gross W.I. Mean Prospective Resources:
Unrisked = 1,462 MMBOE, up 114%
822 MMBOE (56%) in Putumayo A-Limestone
Risked = 346 MMBOE, up 94%
214 MMBOE (62%) in Putumayo A-Limestone
~1,500 prospective well locations or
drilling opportunities
~1,400 drilling opportunities in A-Limestone
79% of Unrisked Mean Prospective Resources
in Putumayo Basin
1. Based on 2016 and 2017 McDaniel Prospective Resources Reports; see Presentation of Oil & Gas Information for important applicable disclaimers
In 2017, Putumayo A-Limestone conventional resource play was the main driver in material resource growth
Dec.31/2017 Gross WI Unrisked
Mean Prospective Resources by Basin (MMboe)
79%
18
Larger font projection layout
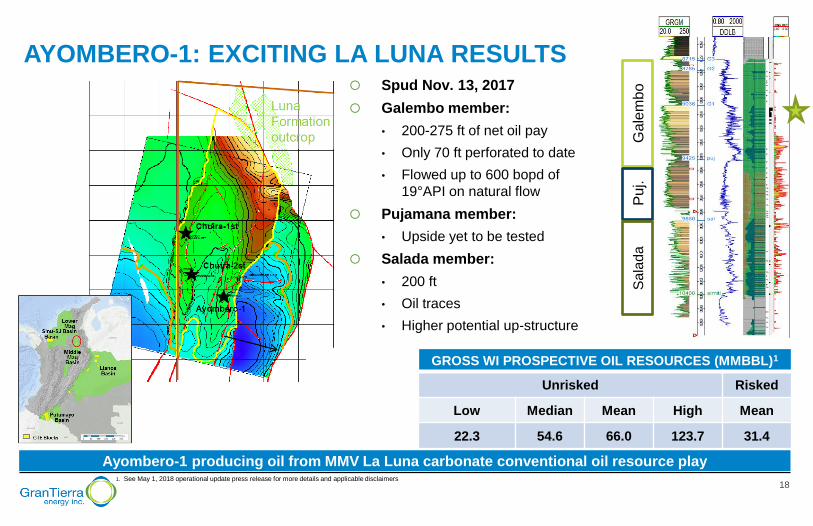
AYOMBERO-1: EXCITING LA LUNA RESULTS
1. See May 1, 2018 operational update press release for more details and applicable disclaimers
Ayombero-1 producing oil from MMV La Luna carbonate conventional oil resource play
GROSS WI PROSPECTIVE OIL RESOURCES (MMBBL)1
Unrisked Risked
Low Median Mean High Mean
22.3 54.6 66.0 123.7 31.4
Ga
lem
bo
P
uj.
Sa
lad
a
Spud Nov. 13, 2017
Galembo member:
• 200-275 ft of net oil pay
• Only 70 ft perforated to date
• Flowed up to 600 bopd of
19°API on natural flow
Pujamana member:
• Upside yet to be tested
Salada member:
• 200 ft
• Oil traces
• Higher potential up-structure
19
Smaller font slide document layout
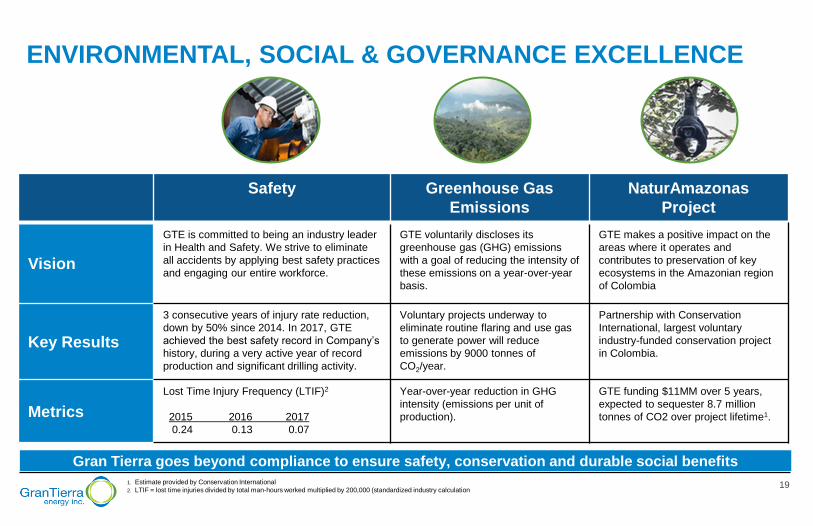
ENVIRONMENTAL, SOCIAL & GOVERNANCE EXCELLENCE
Safety Greenhouse Gas
Emissions
NaturAmazonas
Project
Vision
GTE is committed to being an industry leader
in Health and Safety. We strive to eliminate
all accidents by applying best safety practices
and engaging our entire workforce.
GTE voluntarily discloses its
greenhouse gas (GHG) emissions
with a goal of reducing the intensity of
these emissions on a year-over-year
basis.
GTE makes a positive impact on the
areas where it operates and
contributes to preservation of key
ecosystems in the Amazonian region
of Colombia
Key Results
3 consecutive years of injury rate reduction,
down by 50% since 2014. In 2017, GTE
achieved the best safety record in Company’s
history, during a very active year of record
production and significant drilling activity.
Voluntary projects underway to
eliminate routine flaring and use gas
to generate power will reduce
emissions by 9000 tonnes of
CO2/year.
Partnership with Conservation
International, largest voluntary
industry-funded conservation project
in Colombia.
Metrics
Lost Time Injury Frequency (LTIF)2
2015 2016 2017
0.24 0.13 0.07
Year-over-year reduction in GHG
intensity (emissions per unit of
production).
GTE funding $11MM over 5 years,
expected to sequester 8.7 million
tonnes of CO2 over project lifetime1.
Gran Tierra goes beyond compliance to ensure safety, conservation and durable social benefits
1. Estimate provided by Conservation International
2. LTIF = lost time injuries divided by total man-hours worked multiplied by 200,000 (standardized industry calculation
20
Larger font projection layout
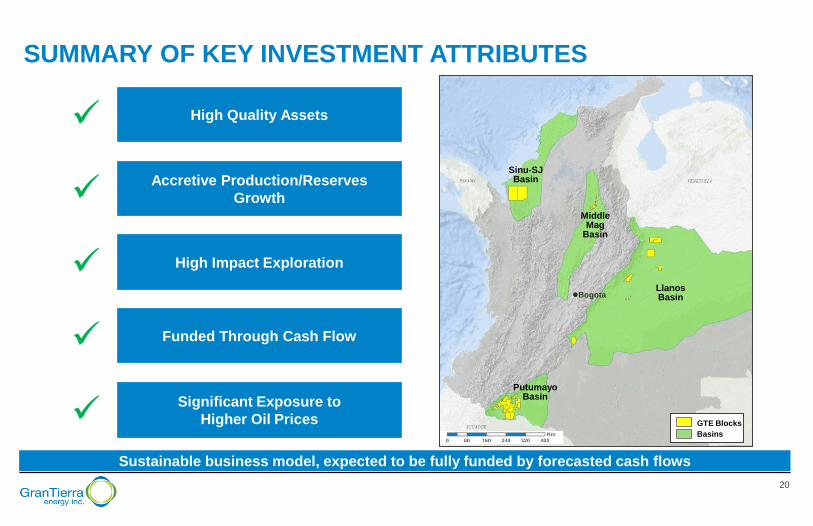
SUMMARY OF KEY INVESTMENT ATTRIBUTES
High Quality Assets
Accretive Production/Reserves
Growth
High Impact Exploration
Funded Through Cash Flow
Significant Exposure to
Higher Oil Prices
Sustainable business model, expected to be fully funded by forecasted cash flows
lBogota
GTE Blocks
Basins
Sinu-SJ Basin
Middle Mag
Basin
Llanos Basin
Putumayo Basin

21
Appendix
22
Larger font projection layout
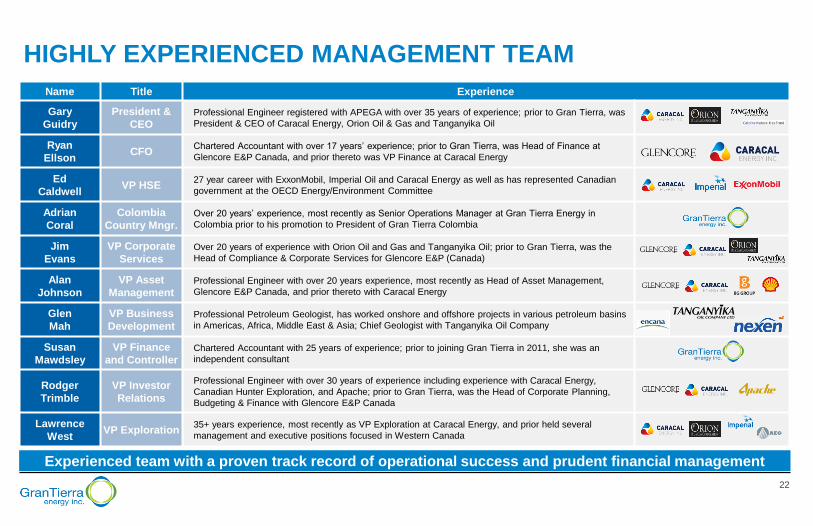
HIGHLY EXPERIENCED MANAGEMENT TEAM
Experienced team with a proven track record of operational success and prudent financial management
Name Title Experience
Gary
Guidry
President &
CEO Professional Engineer registered with APEGA with over 35 years of experience; prior to Gran Tierra, was
President & CEO of Caracal Energy, Orion Oil & Gas and Tanganyika Oil
Ryan
Ellson CFO
Chartered Accountant with over 17 years’ experience; prior to Gran Tierra, was Head of Finance at
Glencore E&P Canada, and prior thereto was VP Finance at Caracal Energy
Ed
Caldwell VP HSE
27 year career with ExxonMobil, Imperial Oil and Caracal Energy as well as has represented Canadian
government at the OECD Energy/Environment Committee
Adrian
Coral
Colombia
Country Mngr. Over 20 years’ experience, most recently as Senior Operations Manager at Gran Tierra Energy in
Colombia prior to his promotion to President of Gran Tierra Colombia
Jim
Evans
VP Corporate
Services Over 20 years of experience with Orion Oil and Gas and Tanganyika Oil; prior to Gran Tierra, was the
Head of Compliance & Corporate Services for Glencore E&P (Canada)
Alan
Johnson
VP Asset
Management Professional Engineer with over 20 years experience, most recently as Head of Asset Management,
Glencore E&P Canada, and prior thereto with Caracal Energy
Glen
Mah
VP Business
Development Professional Petroleum Geologist, has worked onshore and offshore projects in various petroleum basins
in Americas, Africa, Middle East & Asia; Chief Geologist with Tanganyika Oil Company
Susan
Mawdsley
VP Finance
and Controller Chartered Accountant with 25 years of experience; prior to joining Gran Tierra in 2011, she was an
independent consultant
Rodger
Trimble
VP Investor
Relations
Professional Engineer with over 30 years of experience including experience with Caracal Energy,
Canadian Hunter Exploration, and Apache; prior to Gran Tierra, was the Head of Corporate Planning,
Budgeting & Finance with Glencore E&P Canada
Lawrence
West VP Exploration
35+ years experience, most recently as VP Exploration at Caracal Energy, and prior held several
management and executive positions focused in Western Canada
23
Larger font projection layout
0
1
2
3
4
5
6
7
8
9
10
Pe
er
1
Pe
er
2
Pe
er
3
GT
E
Pe
er
5
Pe
er
6
Pe
er
7
Intl P
eer
Avg
Pe
er
9
Pe
er
10
Pe
er
11
Pe
er
12
Pe
er
13
Pe
er
14
Pe
er
15
Pe
er
16
Pe
er
17
Pe
er
18
Pe
er
19
Pe
er
20
Pe
er
21
Pe
er
22
Pe
er
23
Pe
er
24
Pe
er
25
Pe
er
26
US
Peer
Avg
Pe
er
28
Pe
er
29
Pe
er
30
Pe
er
31
Pe
er
32
Pe
er
33
Cdn P
eer
Avg
Pe
er
35
Pe
er
36
Pe
er
37
Pe
er
38
Pe
er
39
2018E
Deb
t / C
ash
Flo
w (
x's
)
Companies Ranked in Ascending Order of Leverage
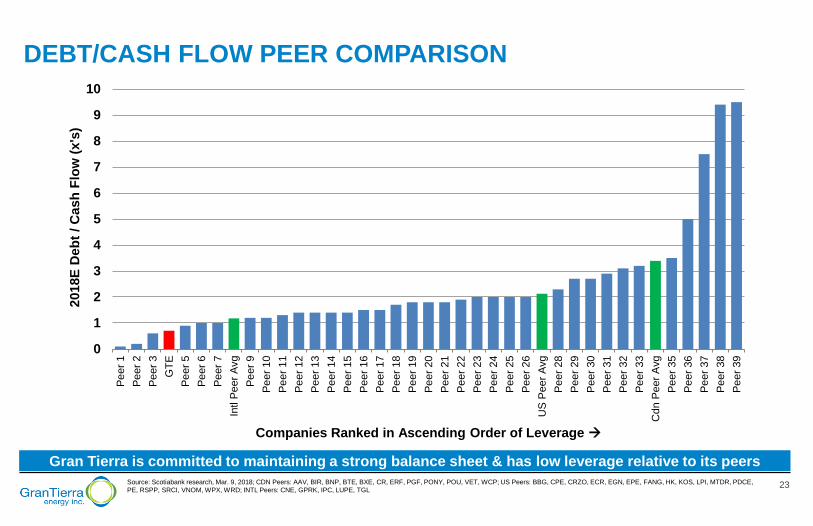
DEBT/CASH FLOW PEER COMPARISON
Source: Scotiabank research, Mar. 9, 2018; CDN Peers: AAV, BIR, BNP, BTE, BXE, CR, ERF, PGF, PONY, POU, VET, WCP; US Peers: BBG, CPE, CRZO, ECR, EGN, EPE, FANG, HK, KOS, LPI, MTDR, PDCE,
PE, RSPP, SRCI, VNOM, WPX, WRD; INTL Peers: CNE, GPRK, IPC, LUPE, TGL
Gran Tierra is committed to maintaining a strong balance sheet & has low leverage relative to its peers
24
Smaller font slide document layout
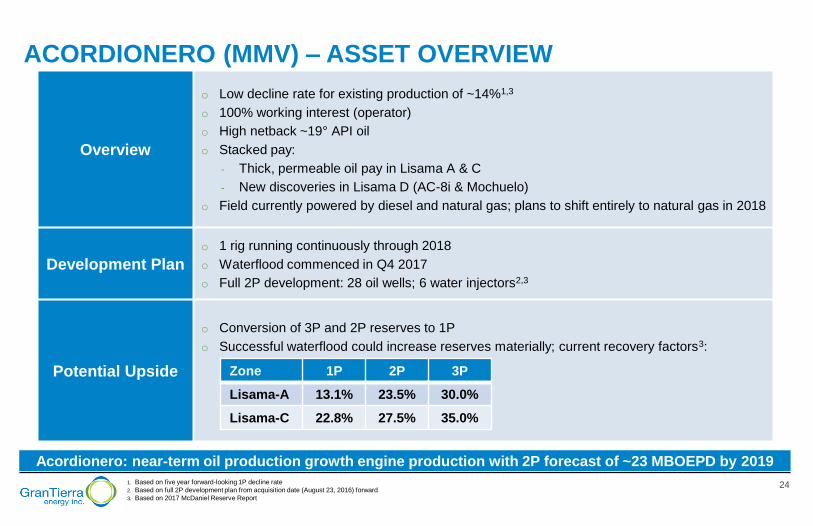
ACORDIONERO (MMV) – ASSET OVERVIEW
Acordionero: near-term oil production growth engine production with 2P forecast of ~23 MBOEPD by 2019
Overview
o Low decline rate for existing production of ~14%1,3
o 100% working interest (operator)
o High netback ~19° API oil
o Stacked pay:
- Thick, permeable oil pay in Lisama A & C
- New discoveries in Lisama D (AC-8i & Mochuelo)
o Field currently powered by diesel and natural gas; plans to shift entirely to natural gas in 2018
Development Plan
o 1 rig running continuously through 2018
o Waterflood commenced in Q4 2017
o Full 2P development: 28 oil wells; 6 water injectors2,3
Potential Upside
o Conversion of 3P and 2P reserves to 1P
o Successful waterflood could increase reserves materially; current recovery factors3:
Zone 1P 2P 3P
Lisama-A 13.1% 23.5% 30.0%
Lisama-C 22.8% 27.5% 35.0%
1. Based on five year forward-looking 1P decline rate
2. Based on full 2P development plan from acquisition date (August 23, 2016) forward
3. Based on 2017 McDaniel Reserve Report
25
Larger font projection layout
$396
$557
$799
1P 2P 3P
Costayaco Moqueta
25.6
35.7
48.4
1P 2P 3P
Costayaco Moqueta
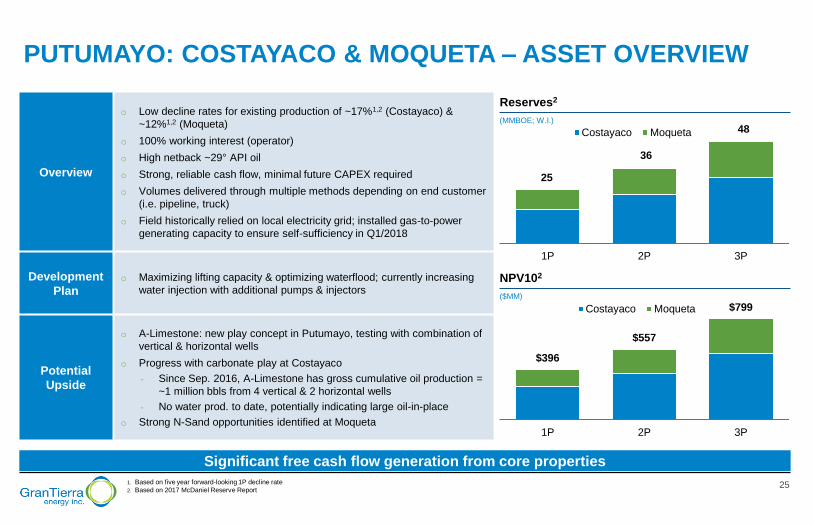
PUTUMAYO: COSTAYACO & MOQUETA – ASSET OVERVIEW
Overview
o Low decline rates for existing production of ~17%1,2 (Costayaco) &
~12%1,2 (Moqueta)
o 100% working interest (operator)
o High netback ~29° API oil
o Strong, reliable cash flow, minimal future CAPEX required
o Volumes delivered through multiple methods depending on end customer
(i.e. pipeline, truck)
o Field historically relied on local electricity grid; installed gas-to-power
generating capacity to ensure self-sufficiency in Q1/2018
Development
Plan
o Maximizing lifting capacity & optimizing waterflood; currently increasing
water injection with additional pumps & injectors
Potential
Upside
o A-Limestone: new play concept in Putumayo, testing with combination of
vertical & horizontal wells
o Progress with carbonate play at Costayaco
- Since Sep. 2016, A-Limestone has gross cumulative oil production =
~1 million bbls from 4 vertical & 2 horizontal wells
- No water prod. to date, potentially indicating large oil-in-place
o Strong N-Sand opportunities identified at Moqueta
Significant free cash flow generation from core properties
1. Based on five year forward-looking 1P decline rate
2. Based on 2017 McDaniel Reserve Report
Reserves2
(MMBOE; W.I.)
NPV102
($MM)
25
36
48
26
Larger font projection layout
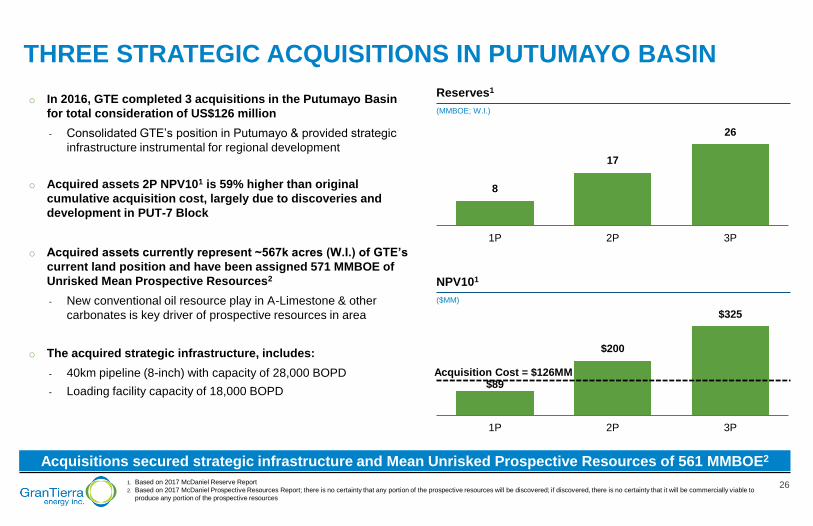
THREE STRATEGIC ACQUISITIONS IN PUTUMAYO BASIN
1. Based on 2017 McDaniel Reserve Report
2. Based on 2017 McDaniel Prospective Resources Report; there is no certainty that any portion of the prospective resources will be discovered; if discovered, there is no certainty that it will be commercially viable to
produce any portion of the prospective resources
Acquisitions secured strategic infrastructure and Mean Unrisked Prospective Resources of 561 MMBOE2
$89
$200
$325
1P 2P 3P
o In 2016, GTE completed 3 acquisitions in the Putumayo Basin
for total consideration of US$126 million
- Consolidated GTE’s position in Putumayo & provided strategic
infrastructure instrumental for regional development
o Acquired assets 2P NPV101 is 59% higher than original
cumulative acquisition cost, largely due to discoveries and
development in PUT-7 Block
o Acquired assets currently represent ~567k acres (W.I.) of GTE’s
current land position and have been assigned 571 MMBOE of
Unrisked Mean Prospective Resources2
- New conventional oil resource play in A-Limestone & other
carbonates is key driver of prospective resources in area
o The acquired strategic infrastructure, includes:
- 40km pipeline (8-inch) with capacity of 28,000 BOPD
- Loading facility capacity of 18,000 BOPD
Reserves1
(MMBOE; W.I.)
NPV101
($MM)
8
17
26
1P 2P 3P
Acquisition Cost = $126MM
27
Smaller font slide document layout
GTE Blocks
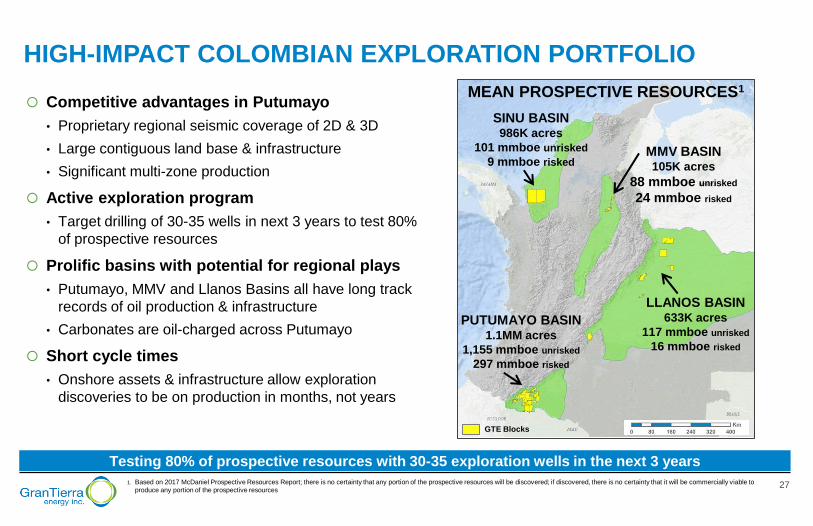
HIGH-IMPACT COLOMBIAN EXPLORATION PORTFOLIO
Competitive advantages in Putumayo
• Proprietary regional seismic coverage of 2D & 3D
• Large contiguous land base & infrastructure
• Significant multi-zone production
Active exploration program
• Target drilling of 30-35 wells in next 3 years to test 80%
of prospective resources
Prolific basins with potential for regional plays
• Putumayo, MMV and Llanos Basins all have long track
records of oil production & infrastructure
• Carbonates are oil-charged across Putumayo
Short cycle times
• Onshore assets & infrastructure allow exploration
discoveries to be on production in months, not years
1. Based on 2017 McDaniel Prospective Resources Report; there is no certainty that any portion of the prospective resources will be discovered; if discovered, there is no certainty that it will be commercially viable to
produce any portion of the prospective resources
Testing 80% of prospective resources with 30-35 exploration wells in the next 3 years
SINU BASIN 986K acres
101 mmboe unrisked
9 mmboe risked
LLANOS BASIN 633K acres
117 mmboe unrisked
16 mmboe risked
PUTUMAYO BASIN 1.1MM acres
1,155 mmboe unrisked
297 mmboe risked
MMV BASIN 105K acres
88 mmboe unrisked
24 mmboe risked
MEAN PROSPECTIVE RESOURCES1
28
Smaller font slide document layout
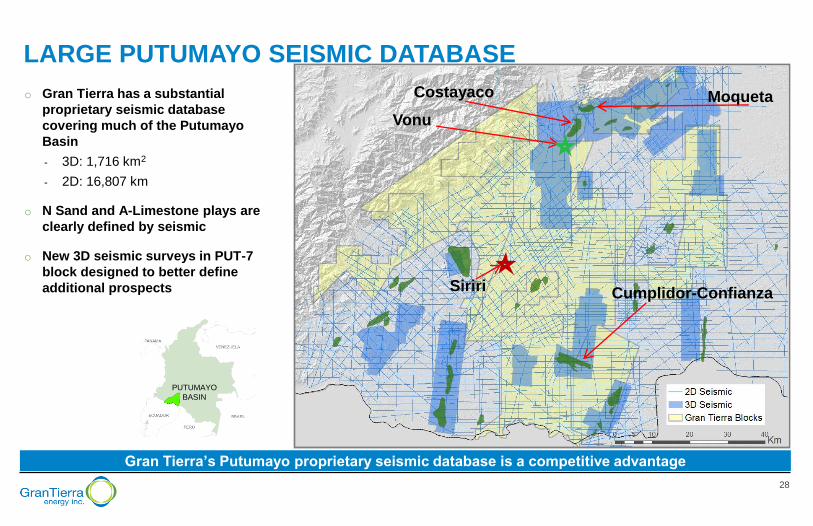
LARGE PUTUMAYO SEISMIC DATABASE
Gran Tierra’s Putumayo proprietary seismic database is a competitive advantage
PUTUMAYO
BASIN
o Gran Tierra has a substantial
proprietary seismic database
covering much of the Putumayo
Basin
- 3D: 1,716 km2
- 2D: 16,807 km
o N Sand and A-Limestone plays are
clearly defined by seismic
o New 3D seismic surveys in PUT-7
block designed to better define
additional prospects
Costayaco
Cumplidor-Confianza
Vonu
Moqueta
Siriri
29
Larger font projection layout
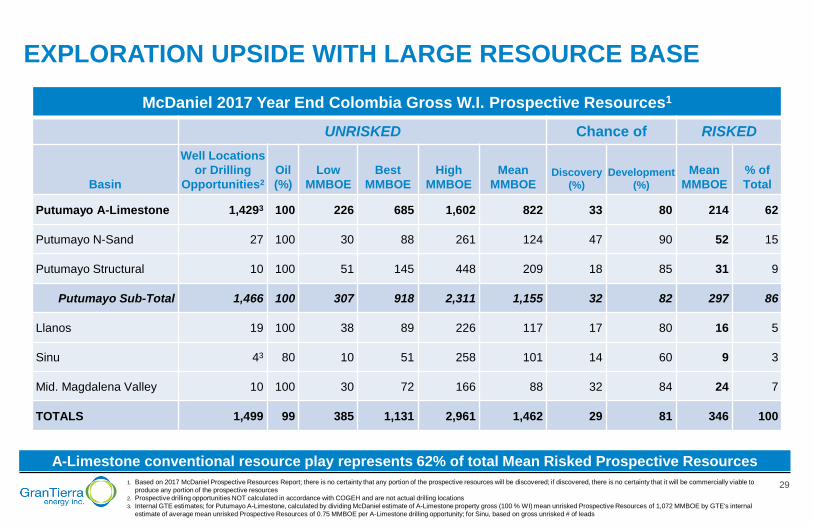
EXPLORATION UPSIDE WITH LARGE RESOURCE BASE
1. Based on 2017 McDaniel Prospective Resources Report; there is no certainty that any portion of the prospective resources will be discovered; if discovered, there is no certainty that it will be commercially viable to
produce any portion of the prospective resources
2. Prospective drilling opportunities NOT calculated in accordance with COGEH and are not actual drilling locations
3. Internal GTE estimates; for Putumayo A-Limestone, calculated by dividing McDaniel estimate of A-Limestone property gross (100 % WI) mean unrisked Prospective Resources of 1,072 MMBOE by GTE's internal
estimate of average mean unrisked Prospective Resources of 0.75 MMBOE per A-Limestone drilling opportunity; for Sinu, based on gross unrisked # of leads
A-Limestone conventional resource play represents 62% of total Mean Risked Prospective Resources
McDaniel 2017 Year End Colombia Gross W.I. Prospective Resources1
UNRISKED Chance of RISKED
Basin
Well Locations
or Drilling
Opportunities2
Oil
(%)
Low
MMBOE
Best
MMBOE
High
MMBOE
Mean
MMBOE Discovery
(%)
Development
(%)
Mean
MMBOE
% of
Total
Putumayo A-Limestone 1,4293 100 226 685 1,602 822 33 80 214 62
Putumayo N-Sand 27 100 30 88 261 124 47 90 52 15
Putumayo Structural 10 100 51 145 448 209 18 85 31 9
Putumayo Sub-Total 1,466 100 307 918 2,311 1,155 32 82 297 86
Llanos 19 100 38 89 226 117 17 80 16 5
Sinu 43 80 10 51 258 101 14 60 9 3
Mid. Magdalena Valley 10 100 30 72 166 88 32 84 24 7
TOTALS 1,499 99 385 1,131 2,961 1,462 29 81 346 100
30
Larger font projection layout
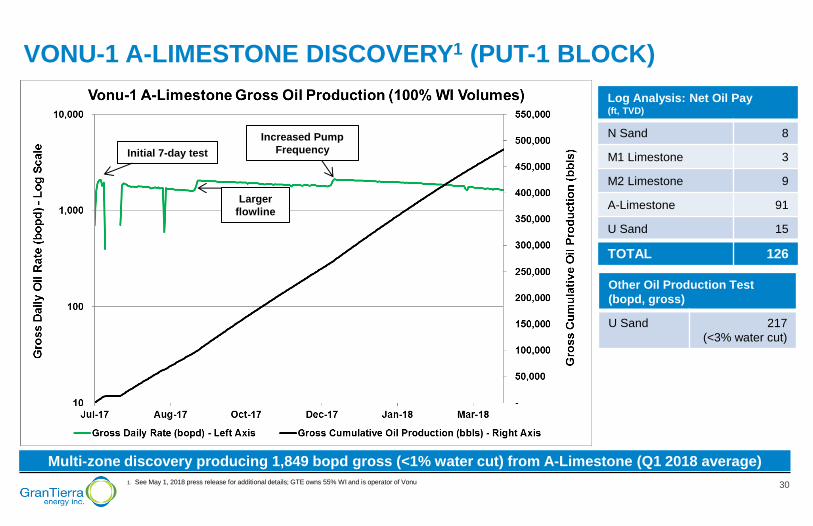
VONU-1 A-LIMESTONE DISCOVERY1 (PUT-1 BLOCK)
1. See May 1, 2018 press release for additional details; GTE owns 55% WI and is operator of Vonu
Multi-zone discovery producing 1,849 bopd gross (<1% water cut) from A-Limestone (Q1 2018 average)
Log Analysis: Net Oil Pay (ft, TVD)
N Sand 8
M1 Limestone 3
M2 Limestone 9
A-Limestone 91
U Sand 15
TOTAL 126
Other Oil Production Test
(bopd, gross)
U Sand 217
(<3% water cut)
Initial 7-day test
Larger
flowline
Increased Pump
Frequency
31
Larger font projection layout
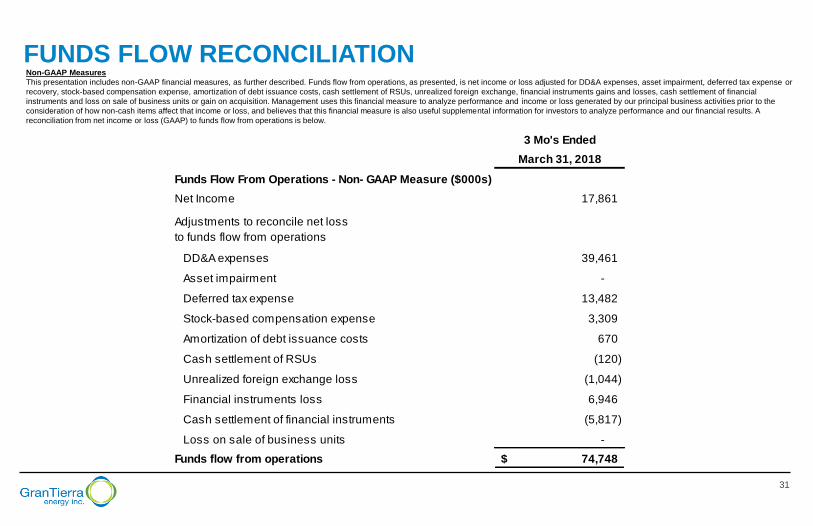
FUNDS FLOW RECONCILIATION Non-GAAP Measures
This presentation includes non-GAAP financial measures, as further described. Funds flow from operations, as presented, is net income or loss adjusted for DD&A expenses, asset impairment, deferred tax expense or
recovery, stock-based compensation expense, amortization of debt issuance costs, cash settlement of RSUs, unrealized foreign exchange, financial instruments gains and losses, cash settlement of financial
instruments and loss on sale of business units or gain on acquisition. Management uses this financial measure to analyze performance and income or loss generated by our principal business activities prior to the
consideration of how non-cash items affect that income or loss, and believes that this financial measure is also useful supplemental information for investors to analyze performance and our financial results. A
reconciliation from net income or loss (GAAP) to funds flow from operations is below.
3 Mo's Ended
March 31, 2018
Funds Flow From Operations - Non- GAAP Measure ($000s)
Net Income 17,861
Adjustments to reconcile net loss
to funds flow from operations
DD&A expenses 39,461
Asset impairment -
Deferred tax expense 13,482
Stock-based compensation expense 3,309
Amortization of debt issuance costs 670
Cash settlement of RSUs (120)
Unrealized foreign exchange loss (1,044)
Financial instruments loss 6,946
Cash settlement of financial instruments (5,817)
Loss on sale of business units -
Funds flow from operations 74,748$
32
Larger font projection layout
PRESENTATION OF OIL & GAS INFORMATION
BOEs (Barrel of Oil Equivalent) may be misleading particularly if used in isolation. A BOE conversion ratio of 6 thousand cubic feet of gas to 1 barrel of oil is based on an energy equivalency conversion method
primarily applicable at the burner tip and does not represent a value equivalency at the wellhead. In addition, given that the value ratio based on the current price of oil as compared with natural gas is significantly
different from the energy equivalent of six to one, utilizing a BOE conversion ratio of 6Mcf:1bbl would be misleading as an indication of value. Unless otherwise specified, in this presentation, all production is
reported on a working interest (“WI”) basis (operating and non-operating) before the deduction of royalties payable. Per BOE amounts are based on WI sales before royalties. For per BOE amounts based on NAR
production, see our Annual Report on Form 10-K filed February 27, 2018.
Well test results should be considered as preliminary and not necessarily indicative of long-term performance or of ultimate recovery. Well log interpretations indicating oil and gas accumulations are not necessarily
indicative of future production or ultimate recovery. If it is indicated that a pressure transient analysis or well-test interpretation has not been carried out, any data disclosed in that respect should be considered
preliminary until such analysis has been completed.
In this presentation:
o “reserves” are estimated remaining quantities of oil and natural gas and related substances anticipated to be recoverable from known accumulations, as of a given date, based on: (a) analysis of drilling,
geological, geophysical and engineering data; (b) use of established technology; and (c) specified economic conditions, which are generally accepted as being reasonable. Reserves are classified according to
degree of certainty associated with estimates.
o “proved reserves” or “1P” are those reserves that can be estimated with a high degree of certainty to be recoverable. It is likely that actua l remaining quantities recovered will exceed estimated proved
reserves;
o “proved developed reserves” are those proved reserves that are expected to be recovered from existing wells and installed facilities or, if facilities have not been installed, that would involve a low expenditure
(e.g., when compared to cost of drilling a well) to put reserves on production. Developed category may be subdivided into producing and non-producing;
o “proved undeveloped reserves” or “PUD” are those proved reserves expected to be recovered from known accumulations where a significant expenditure (e.g., when compared to cost of drilling a well) is
required to render them capable of production.
o “probable reserves” or “2P” are those unproved reserves that are less certain to be recovered than proved reserves. It is equally likely that actual remaining quantities recovered will be greater or less than
sum of estimated proved plus probable reserves. Probable reserves may be developed or undeveloped (“PPUD”).
o “possible reserves” or “3P” are those additional reserves that are less certain to be recovered than probable reserves. There is a 10% probability that quantities actually recovered will equal or exceed sum of
proved plus probable plus possible reserves. Possible reserves may be developed or undeveloped (“PPPUD”).
o “gross” means: (a) in relation to the Company’s interest in production or reserves, its “company gross” production or reserves, which represents the Company’s working interest (operating or non-operating)
share before deduction of royalties and without including any royalty interests of the Company; (b) in relation to wells, total number of wells in which the Company has an interest; and (c) in relation to
properties, total area of properties in which the Company has an interest.
o “NAV” means net asset value.
o “NPV” means net present value.
o “prospective resources” are quantities of petroleum estimated, as of a given date, to be potentially recoverable from undiscovered accumulations by application of future development projects. There is no
certainty that any portion of the prospective resources will be discovered. If discovered, there is no certainty that it will be commercially viable to produce any portion of the prospective resources. Prospective
resources have both an associated chance of discovery and a chance of development. Not all exploration projects will result in discoveries. Chance that an exploration project will result in discovery of
petroleum is referred to as “chance of discovery.” Thus, for an undiscovered accumulation, chance of commerciality is product of two risk components: chance of discovery and chance of development.
o “Net debt” at Mar.31/2018 of $255 MM is face value of debt (excluding debt issuance costs), less cash (excluding restricted cash).
33
Larger font projection layout
PRESENTATION OF OIL & GAS INFORMATION
Reserves and Prospective Resources Information
Unless otherwise noted, estimates of the Company’s reserves, net present value of future net revenue attributable to Company’s reserves and prospective resources relate solely to the Company’s Colombia
reserves and prospective resources and are based upon a report with an effective date of December 31 of each year prepared by McDaniel & Associates Consultants (“McDaniel”), the Company’s independent
qualified reserves evaluator and auditor, in accordance with NI 51-101 – Standards for Oil and Gas Activities (“NI 51-101”) and the Canadian Oil and Gas Evaluation Handbook (“COGEH”) (the “McDaniel Reserve
Report” in the case of reserves or the “McDaniel Prospective Resource Report” in the case of prospective resources).
Gran Tierra's Statement of Reserves Data and Other Oil and Gas Information on Form 51-101F1 dated effective as at December 31, 2017 (the "GTE NI 51-101F1"), which includes disclosure of its oil and gas
reserves and other oil and gas information in accordance with NI 51-101 forming the basis of this presentation, is available on SEDAR at www.sedar.com.
Estimates of reserves provided in this presentation are estimates only and there is no guarantee that estimated reserves will be recovered. Actual reserves may be greater than or less than estimates provided in this
presentation and differences may be material. Estimates of net present value of future net revenue attributable to Company’s reserves do not represent fair market value and there is uncertainty that net present
value of future net revenue will be realized and such estimates of reserves and future net revenue for individual properties may not reflect same confidence level as estimates of reserves and future net revenue for
all properties, due to effect of aggregation. There is no assurance that forecast price and cost assumptions applied by McDaniel in evaluating Gran Tierra’s reserves will be attained and variances could be material.
References to thickness of “oil pay” or of a formation where evidence of hydrocarbons has been encountered is not necessarily an indicator that hydrocarbons will be recoverable in commercial quantities or in any
estimated volume.
Prospective resources are those quantities of petroleum estimated, as of a given date, to be potentially recoverable from undiscovered accumulations by application of future development projects. Prospective
resources have both an associated chance of discovery and a chance of development. Not all exploration projects will result in discoveries. The chance that an exploration project will result in the discovery of
petroleum is referred to as the "chance of discovery." Thus, for an undiscovered accumulation the chance of commerciality is the product of two risk components-the chance of discovery and the chance of
development. There is no certainty that any portion of the Prospective resources will be discovered. If discovered, there is no certainty that it will be commercially viable to produce any portion of the prospective
resources.
The estimates of prospective resources provided in this presentation are estimates only and there is no guarantee that the estimated prospective resources will be recovered. Actual resources may be greater than
or less than the estimates provided in this in this press release and the differences may be material. There is no assurance that the forecast price and cost assumptions applied by McDaniel in evaluating Gran
Tierra's prospective resources will be attained and variances could be material. There is no certainty that any portion of the prospective resources will be discovered. If discovered, there is no certainty that it will be
commercially viable to produce any portion of the prospective resources.
Estimates of prospective resources are by their nature more speculative than estimates of proved reserves and would require substantial capital spending over a significant number of years to implement recovery.
Actual locations drilled and quantities that may be ultimately recovered from our properties will differ substantially. In addition, we have made no commitment to drill, and likely will not drill, all of the drilling locations
that have been attributable to these quantities.
The following classification of prospective resources is used in this presentation:
o Low Estimate means there is at least a 90 percent probability (P90) that the quantities actually recovered will equal or exceed the low estimate.
o Best Estimate means there is at least a 50 percent probability (P50) that the quantities actually recovered will equal or exceed the best estimate.
o High Estimate means there is at least a 10 percent probability (P10) that the quantities actually recovered will equal or exceed the high estimate.
o Mean Estimate represents the arithmetic average of the expected recoverable volume. It is the most accurate single point representation of the volume distribution.
For a discussion of Gran Tierra’s interest in the prospective resources, the location of the prospective resources, the product type reasonably expected, the risks and level of uncertainty associated with recovery of
the resources, the significant positive and negative factors relevant to the estimate of the prospective resources, a description of the applicable projects maturity sub-categories and other relevant information
regarding the prospective resources estimates, please see the GTE NI 51-101F1.
34
Larger font projection layout
PRESENTATION OF OIL & GAS INFORMATION
Oil and Gas Metrics
This presentation contains a number of oil and gas metrics, including finding and development (“F&D”) costs, F&D recycle ratio, NAV per share, operating netback, reserve life index, reserves per share and reserves
replacement, which do not have standardized meanings or standard methods of calculation and therefore such measures may not be comparable to similar measures used by other companies and should not be
used to make comparisons. Such metrics have been included herein to provide readers with additional measures to evaluate the Company's performance; however, such measures are not reliable indicators of the
future performance of the Company and future performance may not compare to the performance in previous periods.
F&D costs are calculated as estimated exploration and development capital expenditures in Colombia, excluding acquisitions and dispositions, divided by the applicable reserves additions both before and after
changes in future development costs (“FDC”). The calculation of F&D costs incorporates the change in FDC required to bring proved undeveloped and developed reserves into production. The aggregate of the
exploration and development costs incurred in the financial year and the changes during that year in estimated FDC may not reflect the total F&D costs related to reserves additions for that year. Management uses
F&D costs per BOE as a measure of its ability to execute its capital program and of its asset quality.
F&D recycle ratio is calculated as estimated Colombia fourth quarter operating netback per WI sales volume divided by the appropriate F&D costs per BOE. Management uses F&D recycle ratio as an indicator of
profitability of its oil and gas activities.
NAV per share is calculated as before tax NPV discounted at 10% plus estimated net working capital deficit and debt, excluding risk management assets and liabilities and investment in Sterling Resources Ltd.
shares, and number of shares of Gran Tierra's common stock and exchangeable shares issued and outstanding. Management uses NAV per share as a measure of the relative change of Gran Tierra's NAV over its
outstanding common stock over a period of time.
Operating netback is calculated as described in this presentation. Management believes that operating netback is a useful supplemental measure for investors to analyze financial performance and provide an
indication of the results generated by Gran Tierra's principal business activities prior to the consideration of other income and expenses.
Cash flow refers to the GAAP line item “net cash provided by operating activities”.
Cash flow after capital is cash flow less 2018 budgeted capital expenditures.
Reserve life index is calculated as reserves in the referenced category divided by the referenced estimated Colombia production. Management uses this measure to determine how long the booked reserves will last
at current production rates if no further reserves were added.
Reserve per share is calculated as reserves in the referenced category divided by the number of common stock and exchangeable shares issued and outstanding at December 31. Management uses this measure
to determine the relative change of its reserve base over its outstanding common stock over a period of time.
Reserves replacement is calculated as reserves in the referenced category divided by estimated annual Colombia production. Management uses this measure to determine the relative change of its reserve base
over a period of time.
35
Larger font projection layout
PRESENTATION OF OIL & GAS INFORMATION
Disclosure of Reserves and Resources Information and Cautionary Note to U.S. Investors
Unless expressly stated otherwise, all estimates of proved, probable and possible reserves and related future net revenue and prospective resources disclosed in this presentation have been prepared in
accordance with NI 51-101. Estimates of reserves and prospective resources and future net revenue made in accordance with NI 51-101 will differ from corresponding estimates prepared in accordance with
applicable U.S. Securities and Exchange Commission (“SEC”) rules and disclosure requirements of the U.S. Financial Accounting Standards Board (“FASB”), and those differences may be material. NI 51-101, for
example, requires disclosure of reserves and related future net revenue estimates based on forecast prices and costs, whereas SEC and FASB standards require that reserves and related future net revenue be
estimated using average prices for the previous 12 months. In addition, NI 51-101 permits the presentation of reserves estimates on a “company gross” basis, representing Gran Tierra’s working interest share
before deduction of royalties, whereas SEC and FASB standards require the presentation of net reserve estimates after the deduction of royalties and similar payments. There are also differences in the technical
reserves and resources estimation standards applicable under NI 51-101 and, pursuant thereto, the COGEH, and those applicable under SEC and FASB requirements. The SEC requirements strictly prohibit the
Company from including prospective resources in filings with the SEC.
In addition to being a reporting issuer in certain Canadian jurisdictions, Gran Tierra is a registrant with the SEC and subject to domestic issuer reporting requirements under U.S. federal securities law, including with
respect to the disclosure of reserves and other oil and gas information in accordance with U.S. federal securities law and applicable SEC rules and regulations (collectively, “SEC requirements”). Disclosure of such
information in accordance with SEC requirements is included in the Company's Annual Report on Form 10-K and in other reports and materials filed with or furnished to the SEC and, as applicable, Canadian
securities regulatory authorities. The SEC permits oil and gas companies that are subject to domestic issuer reporting requirements under U.S. federal securities law, in their filings with the SEC, to disclose only
estimated proved, probable and possible reserves that meet the SEC’s definitions of such terms. Gran Tierra has disclosed est imated proved, probable and possible reserves in its filings with the SEC. In addition,
Gran Tierra prepares its financial statements in accordance with United States generally accepted accounting principles, which require that the notes to its annual financial statements include supplementary
disclosure in respect of the Company’s oil and gas activities, including estimates of its proved oil and gas reserves and a standardized measure of discounted future net cash flows relating to proved oil and gas
reserve quantities. This supplementary financial statement disclosure is presented in accordance with FASB requirements, which align with corresponding SEC requirements concerning reserves estimation and
reporting.
The Company's before tax net present values of 2P reserves prepared in accordance with NI 51-101 and COGEH and discounted at 10% ("PV-10") differs from its US GAAP standardized measure because SEC
and FASB standards require that (i) the standardized measure reflects reserves and related future net revenue estimated using average prices for the previous 12 months, whereas NI 51-101 reserves and related
future net revenue are estimated based on forecast prices and costs and that (ii) the standardized measure reflects discounted future income taxes related to the Company's operations. The Company believes that
the presentation of PV-10 is useful to investors because it presents (i) relative monetary significance of its oil and natural gas properties regardless of tax structure and (ii) relative size and value of its reserves to
other companies. The Company also uses this measure when assessing the potential return on investment related to its oil and natural gas properties. PV-10 and the standardized measure of discounted future net
cash flows do not purport to present the fair value of the Company's oil and gas reserves. The Company has not provided a reconciliation of PV-10 to the standardized measure of discounted future net cash flows
because it is impracticable to do so.
Investors are urged to consider closely the disclosures and risk factors in the Company's Annual Report on Form 10-K, Quarterly Reports on Form 10-Q and in the other reports and filings with the
SEC, available from the Company's website. These forms can also be obtained from the SEC’s website at www.sec.gov.
36
Larger font projection layout
900, 520 – 3RD AVENUE SW
CALGARY, ALBERTA, CANADA
T2P 0R3
Investor Relations
403-265-3221 [email protected]