Embed Size (px)
Citation preview
Creep modelling of particle strengthened steels
Hans Magnusson
Licentiate Thesis
Department of Materials Science and Engineering
Royal Institute of Technology
SE-100 44 Stockholm, Sweden
ii
Creep modelling of particle strengthened steels
Akademisk avhandling som med tillstånd av Kungliga Tekniska Högskolan i
Stockholm framlägges till offentlig granskning för avläggande av teknisk
licentiatexamen onsdagen den 13 juni 2007 10.00 i konferensrummet, Brinellvägen
23, 4 tr, Kungliga Tekniska Högskolan, Stockholm.
ISBN: 978-91-7178-720-0
ISRN: KTH/MSE--07/44--SE+MAT/AVH
© Hans Magnusson 2007
This thesis is available in electronic version at: http://media.lib.kth.se
Printed by Universitetsservice US AB, Stockholm
Creep modelling of particle strengthened steels
Hans Magnusson
Materials Science and Engineering and Brinell Centre, Royal Institute of Technology,
100 44 Stockholm, Sweden
Abstract
Materials to be used in thermal power plants have to resist creep deformation for
time periods up to 30 years. The role of alloying elements for creep strength of 9-12%
Cr steels is analysed. The creep strength in these steels relies on minor additions of
alloying elements. Precipitates give rise to the main strengthening and remaining
elements produce solid solution hardening. Nucleation, growth and coarsening of
particles are predicted by thermodynamic modelling. Phase fractions and size
distributions of M23C6 carbides, MX carbonitrides and Laves phase are presented. The
size distributions are needed in order to determine the particle hardening during creep.
At elevated temperatures the climb mobility is so high that the dislocations can climb
across particles instead of passing by making Orowan loops.
By solving Fick's second law the concentration profile around a moving
dislocation can be determined. The results show an accumulation of solutes around
the dislocation that slows down dislocation movement. When Laves phase grows a
decrease in creep strength is observed due to a larger loss in solid solution hardening
than strength increase by particle hardening. Solid solution hardening also gives an
explanation of the low dislocation climb mobility in 9-12% Cr steels.
Three different dislocation types are distinguished, free dislocations, immobile
dislocation and immobile boundary dislocations. This distinction between types of
dislocations is essential in understanding the decreasing creep with strain during
primary creep. The empirical relation with subgrain size inversely proportional to
stress has been possible to predict. The total creep strength can be predicted by adding
the contribution from individual mechanisms.
iii
List of papers in the thesis
Paper I - Dislocation climb of particles at creep conditions in 9-12% Cr steels
Hans Magnusson and Rolf Sandström
Submitted to Metallurgical and Materials Transactions A
Paper II - Creep strain modelling of 9-12% Cr steels based on microstructure
evolution
Hans Magnusson and Rolf Sandström
Submitted to Metallurgical and Materials Transactions A
Paper III - Modelling of the influence of Laves phase on the creep properties in
9% Cr steels
Hans Magnusson and Rolf Sandström
ASME Pressure Vessels and Piping/CREEP8 Conference, San Antonio, Texas, USA,
Jul 22-26, 2007
iv
Table of contents
1 Introduction........................................................................................................7
2 Martensitic 9-12% Cr steels...............................................................................7
2.1 Development of 9-12% Cr steels ...............................................................7
2.2 Metallurgy..................................................................................................9
3 Creep strength ..................................................................................................11
3.1 Crystalline defects....................................................................................11
3.2 The creep curve........................................................................................12
3.3 Models for creep strength ........................................................................12
3.4 Experimental observations of creep strength...........................................15
4 Modelling of creep curves ...............................................................................16
4.1 Modelling of transient creep ....................................................................16
4.2 Creep modelling of subgrain forming materials ......................................18
4.3 Influence of particles on creep strength ...................................................20
4.4 Solid solution hardening and creep..........................................................21
5 Contributing papers..........................................................................................23
6 Conclusions......................................................................................................27
7 Future work......................................................................................................28
8 Acknowledgements..........................................................................................28
9 References........................................................................................................29
v

6
1 Introduction
Steam power plants produce an important part of the electricity around the world.
Hot gasses from fossil fired combustion or waste heat source from gas turbines
convert water into superheated steam. By increasing the working steam temperature
and pressure the efficiency of the unit increases, which lowers the fuel consumptions
and the environmental impact [1]. According to Hald [2] the increase in steam
parameters from 18 MPa/530-540 ºC to 30 MPa/600 ºC has lead to an approximate
30% decrease in CO2 emissions.
The high temperature strength is strongly related to the creep deformation in
components. Creep is the plastic deformation that a material undergoes when
subjected to a constant stress. Power plant materials have to resist stresses and
temperatures during long-term conditions in order to avoid creep failure. The life-time
of a power plant unit can be as long as 30 years. In order to estimate the long-term
creep strength basic understanding of the involved mechanisms is essential.
With the correct mechanisms considered the possible failure mechanisms can be
predicted and avoided. The great number of existing creep models illustrates the
uncertainty in creep modelling. Many models can reproduce creep data of the
situation studied, but when moving outside the data range they might fail. A
fundamental model for creep must be based on parameters with a physical basis. It is
only then possible to predict the creep strength in a more general manner.
The aim of this thesis is to model the processes determining the creep life of a
component. The modelled mechanisms are used to predict the creep strength of
particle strengthened 9-12% Cr steels. An introduction to this type of material is given
and to different approaches to model creep of these materials.
2 Martensitic 9-12% Cr steels
2.1 Development of 9-12% Cr steels
9-12% Cr steels are cost efficient materials that meet the demands in power plant
applications. These steels have been improved during the later part of the last century
by carefully selecting the alloy additions. The oxidation resistance requires a 9-12%
addition of Cr but much of the mechanical strength relies on minor additions of other
elements. A schematic comparison between the material cost of 9-12% Cr steel, other
7
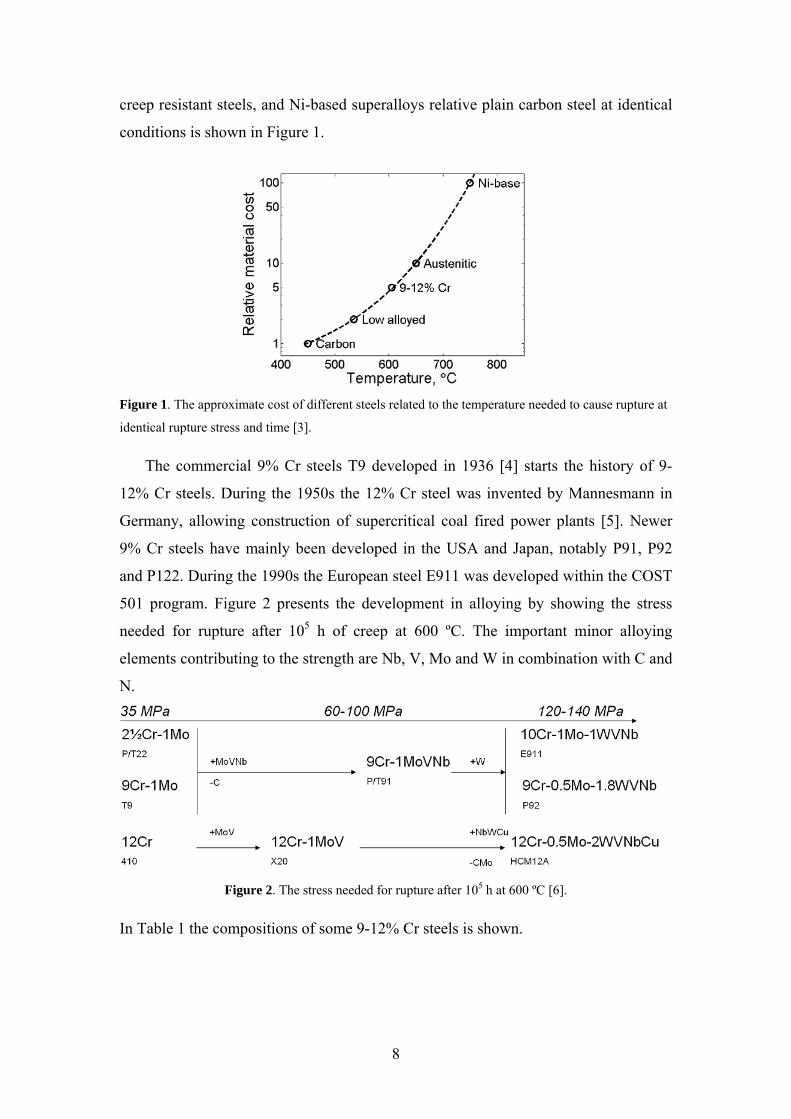
creep resistant steels, and Ni-based superalloys relative plain carbon steel at identical
conditions is shown in Figure 1.
Figure 1. The approximate cost of different steels related to the temperature needed to cause rupture at
identical rupture stress and time [3].
The commercial 9% Cr steels T9 developed in 1936 [4] starts the history of 9-
12% Cr steels. During the 1950s the 12% Cr steel was invented by Mannesmann in
Germany, allowing construction of supercritical coal fired power plants [5]. Newer
9% Cr steels have mainly been developed in the USA and Japan, notably P91, P92
and P122. During the 1990s the European steel E911 was developed within the COST
501 program. Figure 2 presents the development in alloying by showing the stress
needed for rupture after 105 h of creep at 600 ºC. The important minor alloying
elements contributing to the strength are Nb, V, Mo and W in combination with C and
N.
Figure 2. The stress needed for rupture after 105 h at 600 ºC [6].
In Table 1 the compositions of some 9-12% Cr steels is shown.
8
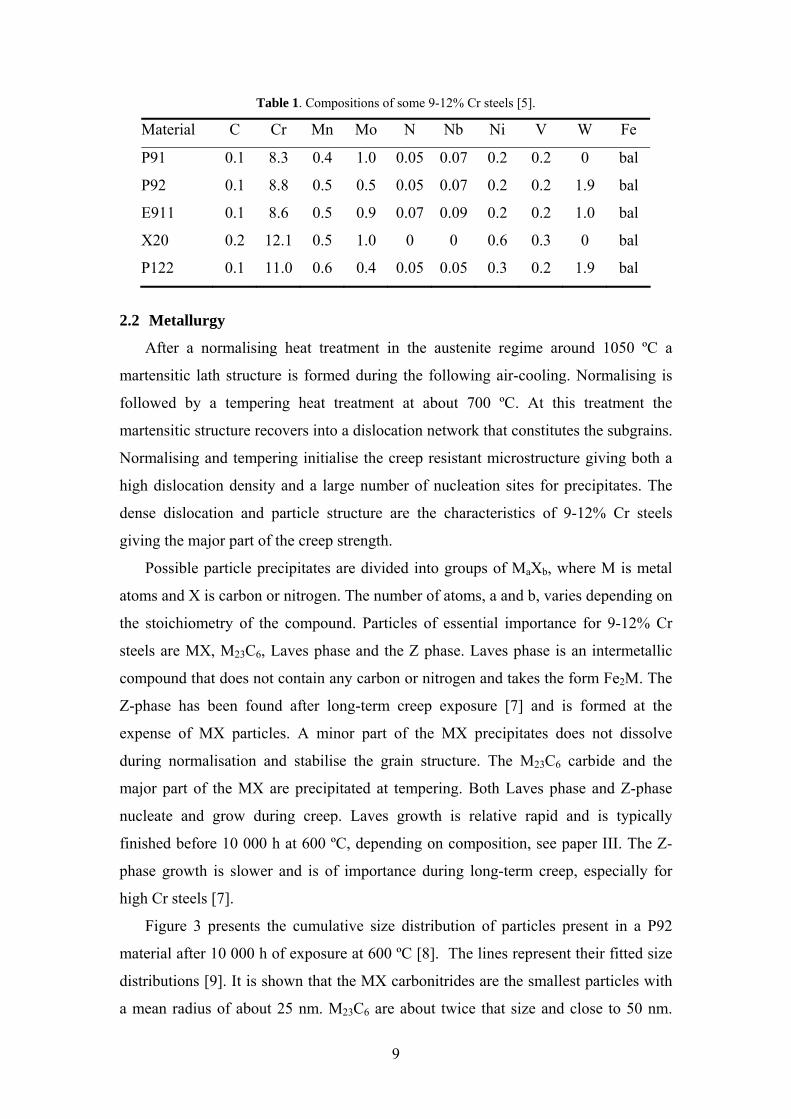
Table 1. Compositions of some 9-12% Cr steels [5].
Material C Cr Mn Mo N Nb Ni V W Fe
P91 0.1 8.3 0.4 1.0 0.05 0.07 0.2 0.2 0 bal
P92 0.1 8.8 0.5 0.5 0.05 0.07 0.2 0.2 1.9 bal
E911 0.1 8.6 0.5 0.9 0.07 0.09 0.2 0.2 1.0 bal
X20 0.2 12.1 0.5 1.0 0 0 0.6 0.3 0 bal
P122 0.1 11.0 0.6 0.4 0.05 0.05 0.3 0.2 1.9 bal
2.2 Metallurgy
After a normalising heat treatment in the austenite regime around 1050 ºC a
martensitic lath structure is formed during the following air-cooling. Normalising is
followed by a tempering heat treatment at about 700 ºC. At this treatment the
martensitic structure recovers into a dislocation network that constitutes the subgrains.
Normalising and tempering initialise the creep resistant microstructure giving both a
high dislocation density and a large number of nucleation sites for precipitates. The
dense dislocation and particle structure are the characteristics of 9-12% Cr steels
giving the major part of the creep strength.
Possible particle precipitates are divided into groups of MaXb, where M is metal
atoms and X is carbon or nitrogen. The number of atoms, a and b, varies depending on
the stoichiometry of the compound. Particles of essential importance for 9-12% Cr
steels are MX, M23C6, Laves phase and the Z phase. Laves phase is an intermetallic
compound that does not contain any carbon or nitrogen and takes the form Fe2M. The
Z-phase has been found after long-term creep exposure [7] and is formed at the
expense of MX particles. A minor part of the MX precipitates does not dissolve
during normalisation and stabilise the grain structure. The M23C6 carbide and the
major part of the MX are precipitated at tempering. Both Laves phase and Z-phase
nucleate and grow during creep. Laves growth is relative rapid and is typically
finished before 10 000 h at 600 ºC, depending on composition, see paper III. The Z-
phase growth is slower and is of importance during long-term creep, especially for
high Cr steels [7].
Figure 3 presents the cumulative size distribution of particles present in a P92
material after 10 000 h of exposure at 600 ºC [8]. The lines represent their fitted size
distributions [9]. It is shown that the MX carbonitrides are the smallest particles with
a mean radius of about 25 nm. M23C6 are about twice that size and close to 50 nm.
9
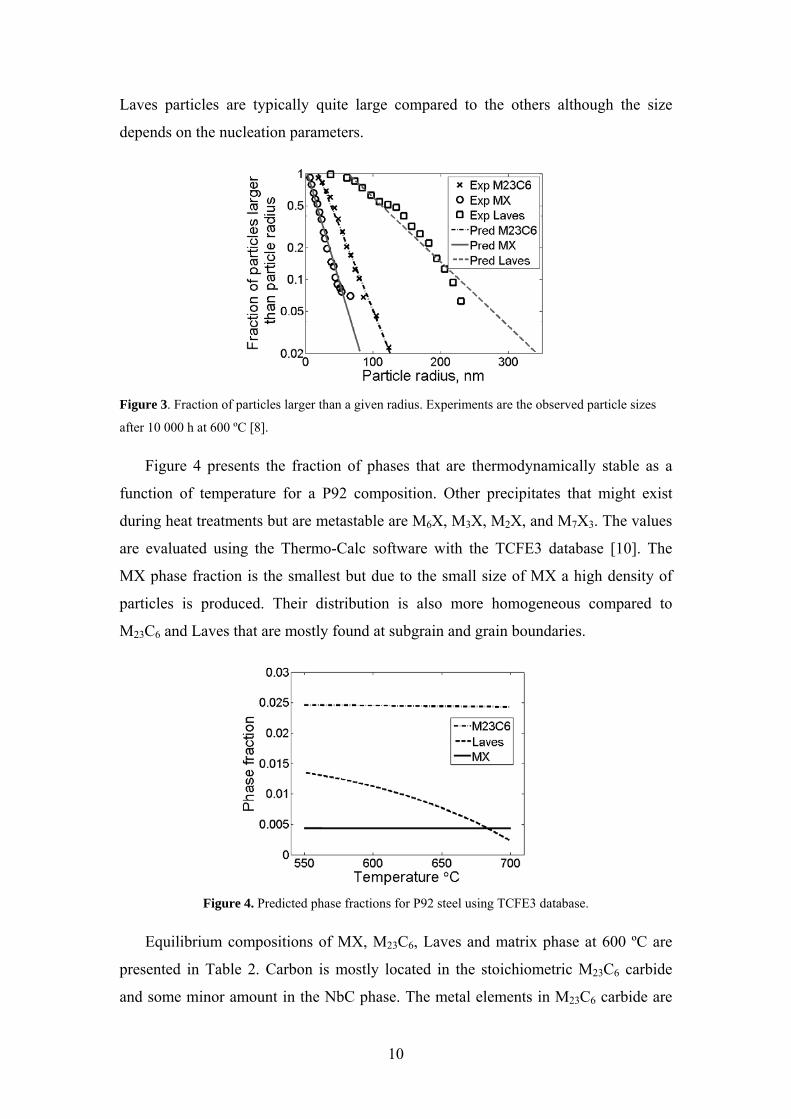
Laves particles are typically quite large compared to the others although the size
depends on the nucleation parameters.
Figure 3. Fraction of particles larger than a given radius. Experiments are the observed particle sizes
after 10 000 h at 600 ºC [8].
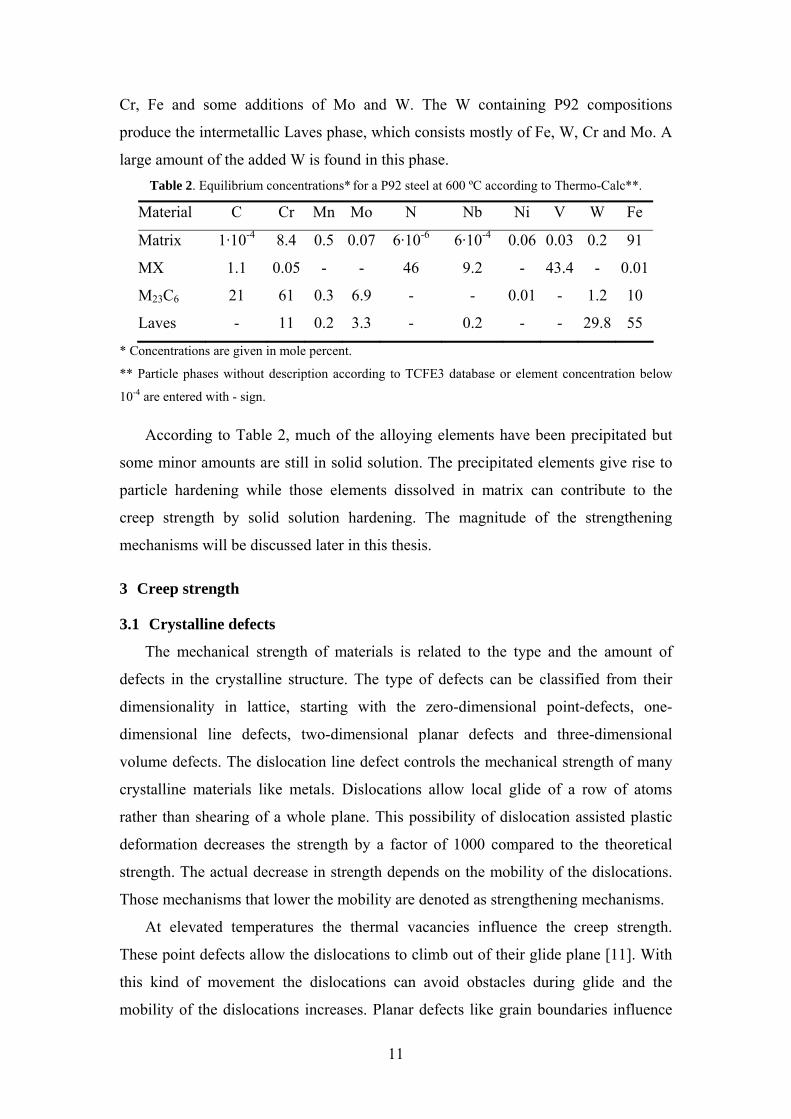
Figure 4 presents the fraction of phases that are thermodynamically stable as a
function of temperature for a P92 composition. Other precipitates that might exist
during heat treatments but are metastable are M6X, M3X, M2X, and M7X3. The values
are evaluated using the Thermo-Calc software with the TCFE3 database [10]. The
MX phase fraction is the smallest but due to the small size of MX a high density of
particles is produced. Their distribution is also more homogeneous compared to
M23C6 and Laves that are mostly found at subgrain and grain boundaries.
Figure 4. Predicted phase fractions for P92 steel using TCFE3 database.
Equilibrium compositions of MX, M23C6, Laves and matrix phase at 600 ºC are
presented in Table 2. Carbon is mostly located in the stoichiometric M23C6 carbide
and some minor amount in the NbC phase. The metal elements in M23C6 carbide are
10
Cr, Fe and some additions of Mo and W. The W containing P92 compositions
produce the intermetallic Laves phase, which consists mostly of Fe, W, Cr and Mo. A
large amount of the added W is found in this phase. Table 2. Equilibrium concentrations* for a P92 steel at 600 ºC according to Thermo-Calc**.
Material C Cr Mn Mo N Nb Ni V W Fe
Matrix 1·10-4 8.4 0.5 0.07 6·10-6 6·10-4 0.06 0.03 0.2 91
MX 1.1 0.05 - - 46 9.2 - 43.4 - 0.01
M23C6 21 61 0.3 6.9 - - 0.01 - 1.2 10
Laves - 11 0.2 3.3 - 0.2 - - 29.8 55
* Concentrations are given in mole percent.
** Particle phases without description according to TCFE3 database or element concentration below
10-4 are entered with - sign.
According to Table 2, much of the alloying elements have been precipitated but
some minor amounts are still in solid solution. The precipitated elements give rise to
particle hardening while those elements dissolved in matrix can contribute to the
creep strength by solid solution hardening. The magnitude of the strengthening
mechanisms will be discussed later in this thesis.
3 Creep strength
3.1 Crystalline defects
The mechanical strength of materials is related to the type and the amount of
defects in the crystalline structure. The type of defects can be classified from their
dimensionality in lattice, starting with the zero-dimensional point-defects, one-
dimensional line defects, two-dimensional planar defects and three-dimensional
volume defects. The dislocation line defect controls the mechanical strength of many
crystalline materials like metals. Dislocations allow local glide of a row of atoms
rather than shearing of a whole plane. This possibility of dislocation assisted plastic
deformation decreases the strength by a factor of 1000 compared to the theoretical
strength. The actual decrease in strength depends on the mobility of the dislocations.
Those mechanisms that lower the mobility are denoted as strengthening mechanisms.
At elevated temperatures the thermal vacancies influence the creep strength.
These point defects allow the dislocations to climb out of their glide plane [11]. With
this kind of movement the dislocations can avoid obstacles during glide and the
mobility of the dislocations increases. Planar defects like grain boundaries influence
11
the component in some different ways. The grain boundaries act as a highway for
diffusion and increase the rate of diffusion controlled mechanisms. Plastic
deformation can occur by grain boundary sliding. But both mechanisms are reduced
by the large grain size of creep resistant materials. The contributing minor amount of
grain boundary sliding is believed to initiate creep damage in the form of voids. These
defects strongly influence the ductility of creep resistant materials.
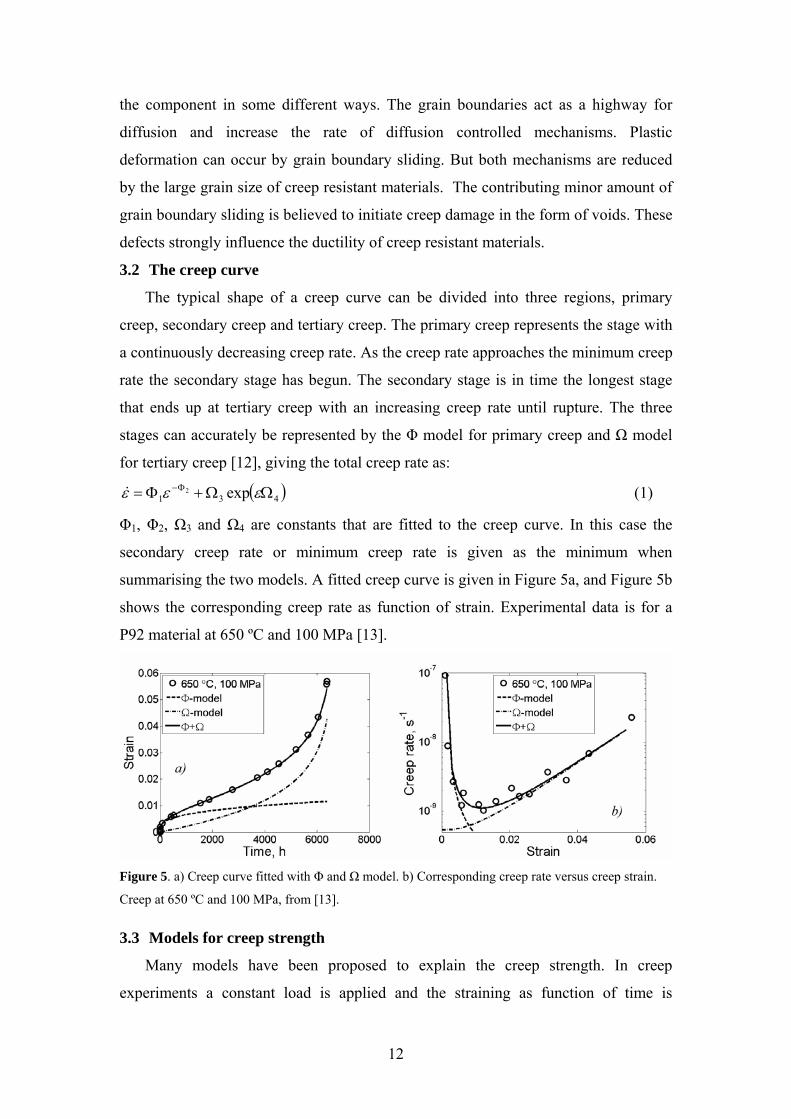
3.2 The creep curve
The typical shape of a creep curve can be divided into three regions, primary
creep, secondary creep and tertiary creep. The primary creep represents the stage with
a continuously decreasing creep rate. As the creep rate approaches the minimum creep
rate the secondary stage has begun. The secondary stage is in time the longest stage
that ends up at tertiary creep with an increasing creep rate until rupture. The three
stages can accurately be represented by the Φ model for primary creep and Ω model
for tertiary creep [12], giving the total creep rate as:
( 431 exp2 ΩΩ+Φ= Φ− εεε& ) (1)
Φ1, Φ2, Ω3 and Ω4 are constants that are fitted to the creep curve. In this case the
secondary creep rate or minimum creep rate is given as the minimum when
summarising the two models. A fitted creep curve is given in Figure 5a, and Figure 5b
shows the corresponding creep rate as function of strain. Experimental data is for a
P92 material at 650 ºC and 100 MPa [13].
Figure 5. a) Creep curve fitted with Φ and Ω model. b) Corresponding creep rate versus creep strain.
Creep at 650 ºC and 100 MPa, from [13].
3.3 Models for creep strength
Many models have been proposed to explain the creep strength. In creep
experiments a constant load is applied and the straining as function of time is
12
measured. The minimum creep rate is often chosen as a characteristic parameter
representing the evaluated material. One reason is that the minimum creep rate often
represents in time the major part of the creep life. Another argument is that the
minimum creep rate can be related to the rupture time by using the well proven
Monkmann-Grant relation [14], giving an estimate of the creep strength:
consttR =minε& (2)
tR is the time to rupture and minε& the minimum creep rate. Creep can be divided into
subgroups where the deformation mechanism of creep differs. Different deformation
mechanisms are vacancy directed material flow, dislocation based creep, and grain
boundary sliding. Although the creep mechanisms might vary all these models can be
generalised into the following expression for creep: n
appp
Gdb
kTDGbA ⎟⎟
⎠
⎞⎜⎜⎝
⎛⎟⎠⎞
⎜⎝⎛=
σε& (3)
A is a constant, D the self diffusion coefficient, G the shear modulus, b Burgers
vector, T the absolute temperature, k Bolzmanns constant, d the grain size, σapp the
applied stress, and n and p are the exponents of stress and grain size respectively. The
different creep mechanisms are represented with their values of the exponents,
constant and diffusion coefficient. By evaluating the temperature, stress or grain size
dependence on creep the active mechanism can be distinguished.
Grain boundary related mechanisms are vacancy creep and grain boundary
sliding. It has been proposed that grain boundary sliding occurs by the movement of
dislocation in grain boundaries [15]. The rate controlling step at grain boundary
sliding is the deformation resistance within grains due to the requirement of plastic
compatibility. The temperature dependence is given from the climb mobility that is
related to the self diffusion coefficient. Grain boundary sliding can be detected when
observing the macroscopic deformation of a marked surface. Diffusion creep was first
suggested by Nabarro and Herring [16, 17]. The flow of vacancies takes place within
the grains where grain boundaries or external surfaces act as sources and sinks of
vacancies. The applied stress will direct this material flow and the material creeps. If
the vacancy transport takes place at grain boundaries the creep mechanism is denoted
Coble creep [18] with temperature dependence from grain boundary diffusion.
Dislocation based creep models are based on glide and climb of dislocations that
give the creep rate. Dislocation motion starts with the generation of dislocations, for
13
instance a Frank-Read source. The dislocation travels a distance until it is annihilated
by a dislocation of the opposite kind. The many dislocation based models have their
version of the time controlling step during the dislocation life time. One example is
the model by Weertman [19], where dislocation climb is the time controlling step. In
the model by Weertman dislocation climb gives the creep rate but plastic strain is still
generated as the dislocations glide between the obstacles.
Other dislocation based theories are derived from the dislocation glide mobility.
Solute atoms might accumulate at the dislocation giving a local increase in element
concentration, a Cottrell atmosphere [20]. During motion this atmosphere has to be
dragged and the creep rate is lowered. The effect of alloying elements in solid solution
on creep strength divides metallic materials into two classes [21]. Class I alloys which
are glide controlled behave like pure metals when solute elements are added with the
stress dependence as pure metals and the temperature dependence is related to the
diffusion coefficient of the alloy. Some examples of Class I alloys are Al-Mg, Au-Ni,
Pb-Sn. Class II alloys that are climbed represents most commercial creep resistant
materials like Fe or Ni based alloys. The effect of alloying elements is not given by
the change in diffusion coefficient of the alloy compound, and some strengthening of
solutes exists [21]. Class II metals exhibit a distinct primary creep, in contrary to
Class I materials. Due to primary creep and the generation of dislocations through
work hardening these materials are subgrain forming materials.
Harper and Dorn evaluated creep data at those conditions where vacancy directed
creep is typically found [22]. The stress dependence was correct but the creep rate was
about 1400 times greater than what is suggested by Nabarro-Herring and Coble creep.
The conclusion by Harper and Dorn was that this represented a new type of creep,
which shows the same stress dependence but is independent of grain size. 50 years
since the study of Harper and Dorn was presented there is still discussions about the
existance of Harper-Dorn creep, see [23]. Other mechanisms of dislocation motion
has been proposed like the non-conservative motion of jogged screw dislocations by
Barrett and Nix [24], and dislocation climb of Bardeen-Herring sources by Nabarro
[25]. Table 3 presents a summary of the mentioned models by showing the diffusion
coefficient and exponents to grain size and stress used in Eq. (3).
14
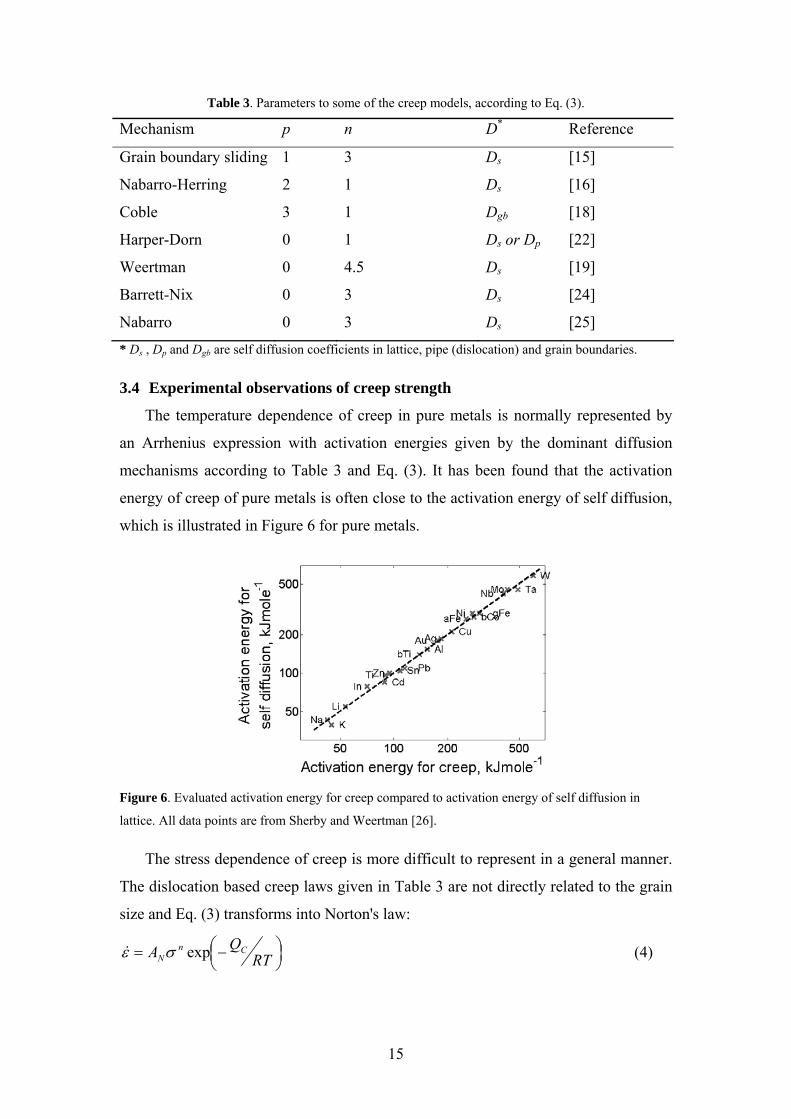
Table 3. Parameters to some of the creep models, according to Eq. (3).
Mechanism p n D* Reference
Grain boundary sliding 1 3 Ds [15]
Nabarro-Herring 2 1 Ds [16]
Coble 3 1 Dgb [18]
Harper-Dorn 0 1 Ds or Dp [22]
Weertman 0 4.5 Ds [19]
Barrett-Nix 0 3 Ds [24]
Nabarro 0 3 Ds [25]
* Ds , Dp and Dgb are self diffusion coefficients in lattice, pipe (dislocation) and grain boundaries.
3.4 Experimental observations of creep strength
The temperature dependence of creep in pure metals is normally represented by
an Arrhenius expression with activation energies given by the dominant diffusion
mechanisms according to Table 3 and Eq. (3). It has been found that the activation
energy of creep of pure metals is often close to the activation energy of self diffusion,
which is illustrated in Figure 6 for pure metals.
Figure 6. Evaluated activation energy for creep compared to activation energy of self diffusion in
lattice. All data points are from Sherby and Weertman [26].
The stress dependence of creep is more difficult to represent in a general manner.
The dislocation based creep laws given in Table 3 are not directly related to the grain
size and Eq. (3) transforms into Norton's law:
⎟⎠⎞⎜
⎝⎛−= RT
QA CnN expσε& (4)
15
AN is a constant, n the Norton exponent, QC the activation energy of creep, and R the
gas constant. For some cases the stress exponent increases with creep rate and an
exponential relation is a more appropriate choice. Then the creep rate takes the form
[27]:
⎟⎠⎞⎜
⎝⎛−⎟
⎟⎠
⎞⎜⎜⎝
⎛= RT
QMkT
VA Capp expexp
*σε& (5)
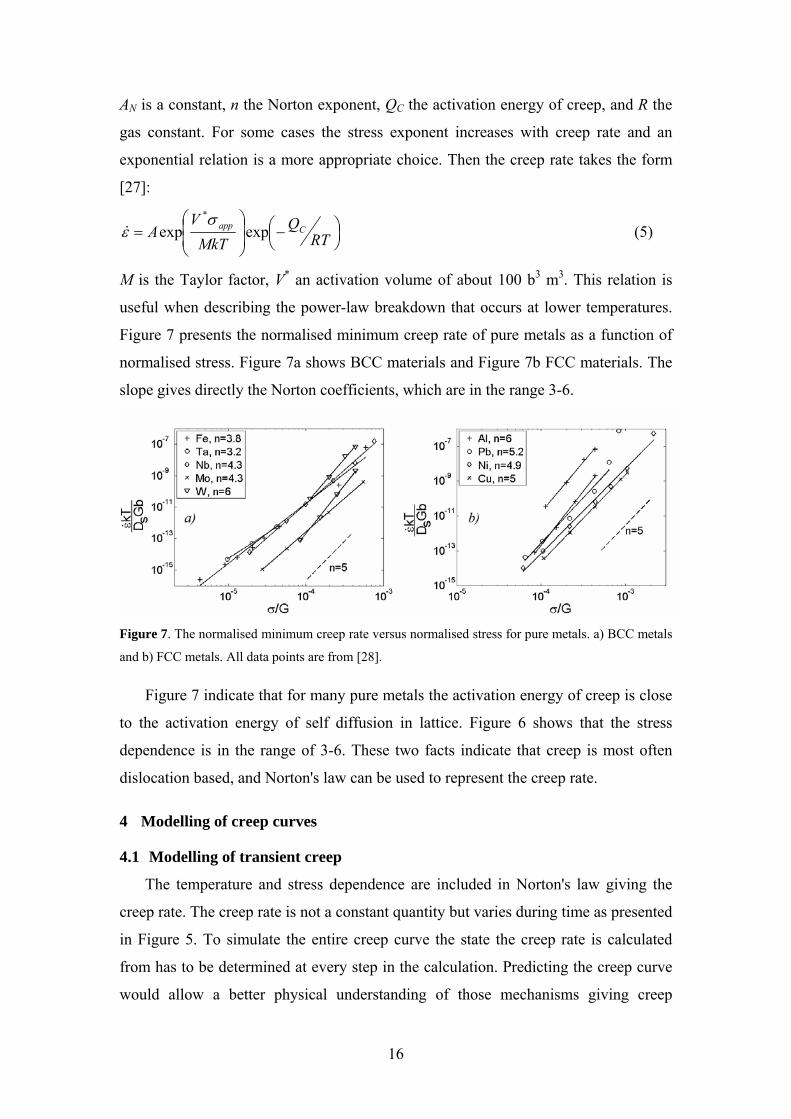
M is the Taylor factor, V* an activation volume of about 100 b3 m3. This relation is
useful when describing the power-law breakdown that occurs at lower temperatures.
Figure 7 presents the normalised minimum creep rate of pure metals as a function of
normalised stress. Figure 7a shows BCC materials and Figure 7b FCC materials. The
slope gives directly the Norton coefficients, which are in the range 3-6.
Figure 7. The normalised minimum creep rate versus normalised stress for pure metals. a) BCC metals
and b) FCC metals. All data points are from [28].
Figure 7 indicate that for many pure metals the activation energy of creep is close
to the activation energy of self diffusion in lattice. Figure 6 shows that the stress
dependence is in the range of 3-6. These two facts indicate that creep is most often
dislocation based, and Norton's law can be used to represent the creep rate.
4 Modelling of creep curves
4.1 Modelling of transient creep
The temperature and stress dependence are included in Norton's law giving the
creep rate. The creep rate is not a constant quantity but varies during time as presented
in Figure 5. To simulate the entire creep curve the state the creep rate is calculated
from has to be determined at every step in the calculation. Predicting the creep curve
would allow a better physical understanding of those mechanisms giving creep
16
strength. As Blum pointed out [29], it is disadvantageous to simulate the minimum
creep rate only since the lifetime is often determined from the primary creep.
Primary creep and the transition to minimum creep rate are physically described
by the evolution of the dislocation density. Dislocations are the source of plastic
deformation by their movement in lattice, but a high dislocation density also slows
down the glide due to work hardening. The shape of primary creep with a
continuously decreasing creep rate is then explained as an increase in dislocation
density and a lowering in dislocation mobility. The evolution in dislocation density
eventually saturates since there is a balance between dislocation generation and
annihilation. This steady-state condition is close to the minimum creep rate. The
obstructing stress due to work hardening was first suggested by Taylor as:
ρασ MGbdisl = (6)
where αM is a constant of about unity, and ρ the dislocation density.
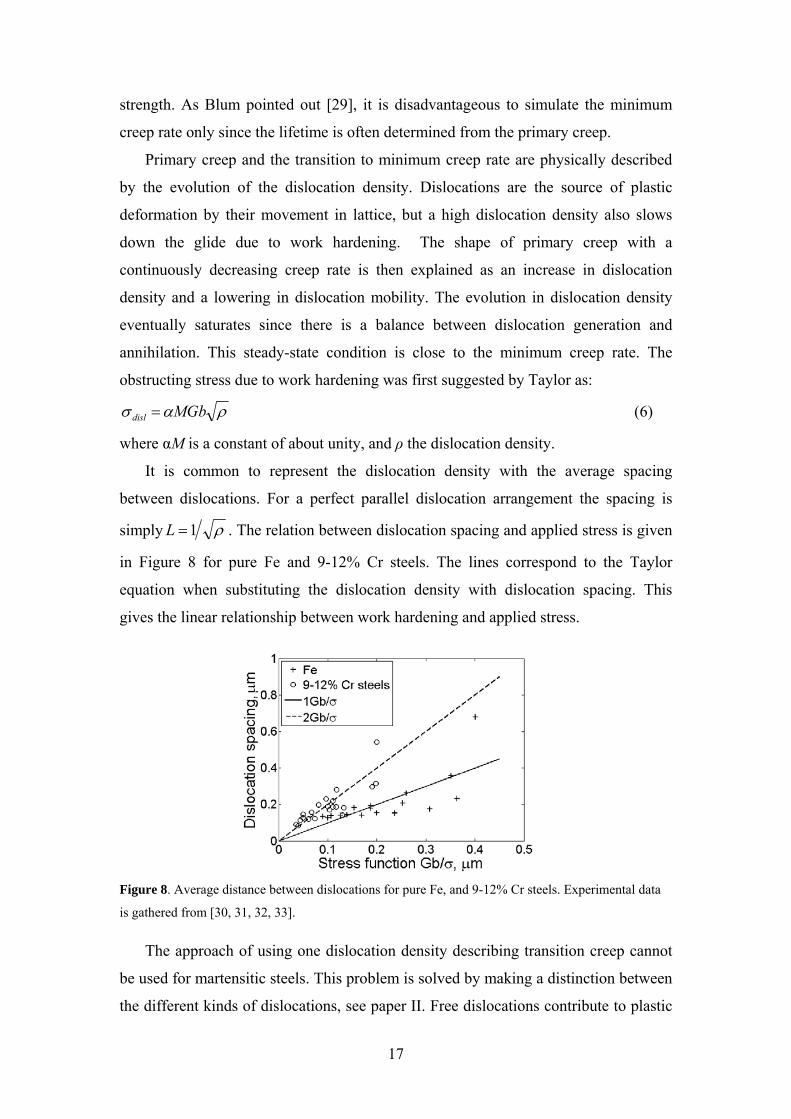
It is common to represent the dislocation density with the average spacing
between dislocations. For a perfect parallel dislocation arrangement the spacing is
simply ρ1=L . The relation between dislocation spacing and applied stress is given
in Figure 8 for pure Fe and 9-12% Cr steels. The lines correspond to the Taylor
equation when substituting the dislocation density with dislocation spacing. This
gives the linear relationship between work hardening and applied stress.
Figure 8. Average distance between dislocations for pure Fe, and 9-12% Cr steels. Experimental data
is gathered from [30, 31, 32, 33].
The approach of using one dislocation density describing transition creep cannot
be used for martensitic steels. This problem is solved by making a distinction between
the different kinds of dislocations, see paper II. Free dislocations contribute to plastic
17
strain by their movement in the lattice. These dislocations get obstructed during
motion by immobile dislocations. The immobile dislocations are located at both
subgrain interiors and subgrain boundaries, but are separated since their dislocation
processes are quite different. Thus three different types of dislocations are needed to
simulate the creep process, free dislocations, immobile dislocations and boundary
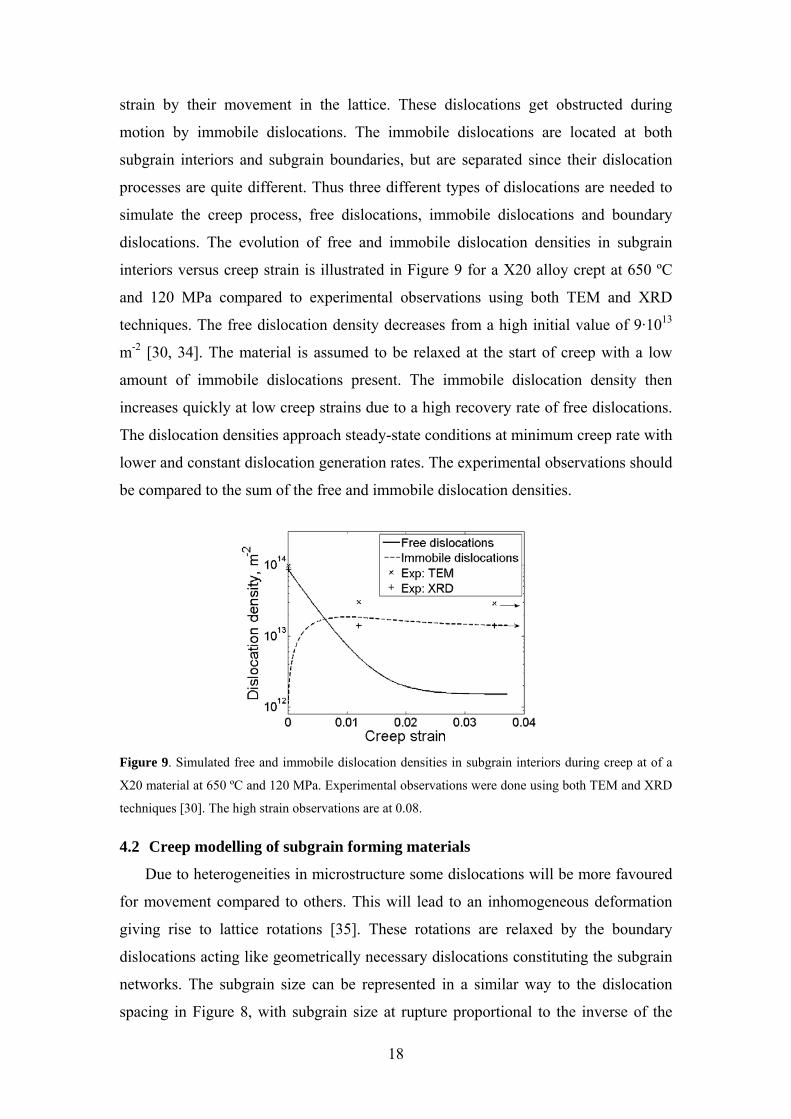
dislocations. The evolution of free and immobile dislocation densities in subgrain
interiors versus creep strain is illustrated in Figure 9 for a X20 alloy crept at 650 ºC
and 120 MPa compared to experimental observations using both TEM and XRD
techniques. The free dislocation density decreases from a high initial value of 9·1013
m-2 [30, 34]. The material is assumed to be relaxed at the start of creep with a low
amount of immobile dislocations present. The immobile dislocation density then
increases quickly at low creep strains due to a high recovery rate of free dislocations.
The dislocation densities approach steady-state conditions at minimum creep rate with
lower and constant dislocation generation rates. The experimental observations should
be compared to the sum of the free and immobile dislocation densities.
Figure 9. Simulated free and immobile dislocation densities in subgrain interiors during creep at of a
X20 material at 650 ºC and 120 MPa. Experimental observations were done using both TEM and XRD
techniques [30]. The high strain observations are at 0.08.
4.2 Creep modelling of subgrain forming materials
Due to heterogeneities in microstructure some dislocations will be more favoured
for movement compared to others. This will lead to an inhomogeneous deformation
giving rise to lattice rotations [35]. These rotations are relaxed by the boundary
dislocations acting like geometrically necessary dislocations constituting the subgrain
networks. The subgrain size can be represented in a similar way to the dislocation
spacing in Figure 8, with subgrain size at rupture proportional to the inverse of the
18
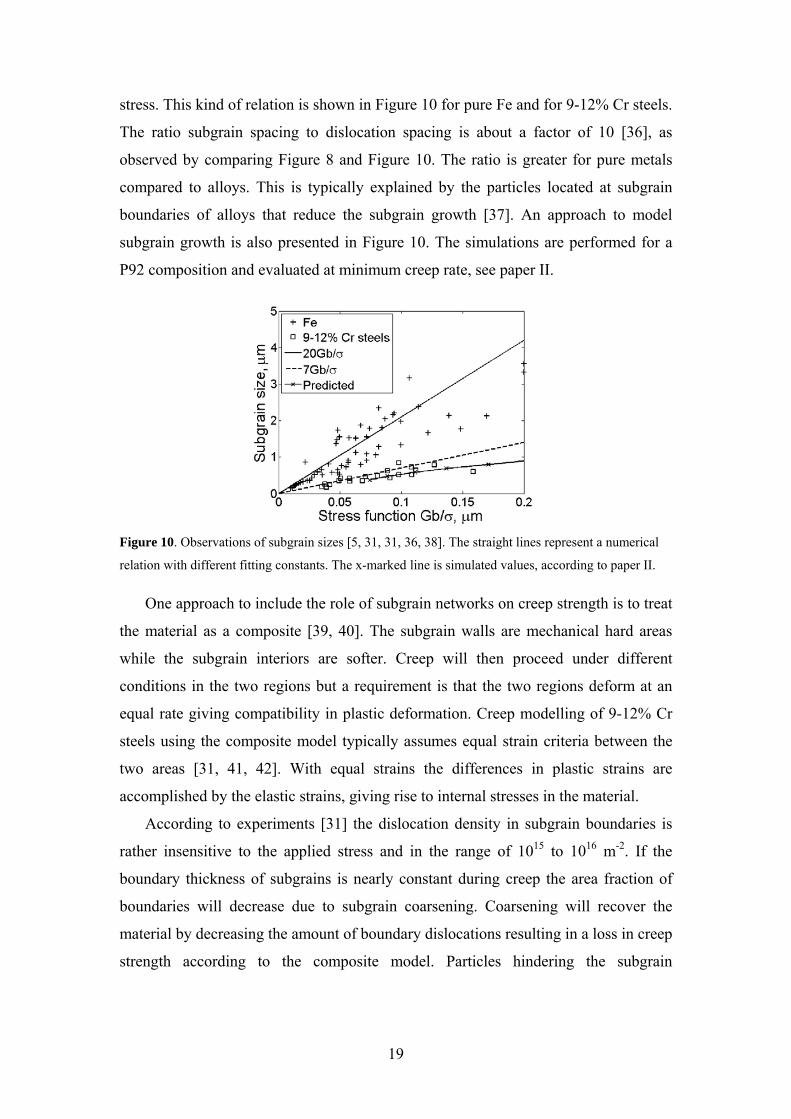
stress. This kind of relation is shown in Figure 10 for pure Fe and for 9-12% Cr steels.
The ratio subgrain spacing to dislocation spacing is about a factor of 10 [36], as
observed by comparing Figure 8 and Figure 10. The ratio is greater for pure metals
compared to alloys. This is typically explained by the particles located at subgrain
boundaries of alloys that reduce the subgrain growth [37]. An approach to model
subgrain growth is also presented in Figure 10. The simulations are performed for a
P92 composition and evaluated at minimum creep rate, see paper II.
Figure 10. Observations of subgrain sizes [5, 31, 31, 36, 38]. The straight lines represent a numerical
relation with different fitting constants. The x-marked line is simulated values, according to paper II.
One approach to include the role of subgrain networks on creep strength is to treat
the material as a composite [39, 40]. The subgrain walls are mechanical hard areas
while the subgrain interiors are softer. Creep will then proceed under different
conditions in the two regions but a requirement is that the two regions deform at an
equal rate giving compatibility in plastic deformation. Creep modelling of 9-12% Cr
steels using the composite model typically assumes equal strain criteria between the
two areas [31, 41, 42]. With equal strains the differences in plastic strains are
accomplished by the elastic strains, giving rise to internal stresses in the material.
According to experiments [31] the dislocation density in subgrain boundaries is
rather insensitive to the applied stress and in the range of 1015 to 1016 m-2. If the
boundary thickness of subgrains is nearly constant during creep the area fraction of
boundaries will decrease due to subgrain coarsening. Coarsening will recover the
material by decreasing the amount of boundary dislocations resulting in a loss in creep
strength according to the composite model. Particles hindering the subgrain
19
coarsening will then be an important strengthening mechanism in materials that show
subgrain structure.
4.3 Influence of particles on creep strength
By including the back stress from dislocations in the Norton equation the time
dependence of creep of pure metals are explained. Alloying influences the creep
properties due to the precipitation of stable particles such as carbides, nitrides or
intermetallic phases. The role of particle hardening on creep strength is typically
included in analogy with work hardening, as an extra back stress on the moving
dislocation. The classic equation of particle hardening by Orowan is the stress to push
a dislocation past two impenetrable particles as:
part
LOro bL
MT2=σ (7)
where TL is the dislocation line tension, and Lpart the interparticle spacing. At higher
temperatures particle coarsening will increase the average distance between the
particles and thus lowering the particle strength. Particle coarsening increases the
average size of particles, as the larger particles will grow at the expense of the smaller
ones. Ostwald ripening can be used to describe the coarsening:
tkrr jjj += 3,0
3 (8)
where r0,j is the initial particle size, kj the coarsening coefficient [43] and t the time.
Particle coarsening is typically a slow process and the Orowan stress is only
weakly dependent on temperature. It is obvious that this temperature dependence
cannot explain the large decrease in creep strength with temperature, as explained in
paper I. At higher temperature, climb allows the dislocations to bulge out of the slip
plane and surmount the particle. The temperature dependence of the dislocation climb
mobility is given by the self diffusion coefficient [11], and makes dislocation climb
across particles an important mechanism.
Climb mechanisms are often divided into local climb and general climb. At local
climb only the dislocation segment in contact with the particle climbs [44]. Lagneborg
pointed out that local climb would produce unrealistically sharp dislocation bends
where the dislocation leaves the glide plane, and climb in a more general manner is
more realistic [45]. Another theory of dislocation climb, first introduced by Srolowitz
et al. [46], was that the threshold stress arises due to the attractive surface at particle
20
and matrix interface. Some experimental TEM micrographs confirm this theory
showing attached dislocations on the departure side of the particle [47].
Predictions of particle hardening at climb conditions typically end up with an
expression of the minimum particle hardening, i.e. the thresholds stress. Depending on
the investigated conditions like particle geometry the size of the threshold varies over
a wide range, as explained by Blum et al. [48]. The shape of the climbing dislocation
is more relaxed at general climb compared to local climb and general climb threshold
should represent the true threshold. Suggested values of the ratio of threshold stress
σth to Orowan stress are about 0.004<σth/σOro<0.02 [48]. Many studies of particle
hardening at climb conditions focus on the threshold stress. A more useful scenario in
creep modelling would be to estimate the particle hardening when some dislocations
climb across particles while other pass by the Orowan mechanisms, thus representing
the case when particle hardening σpart is somewhere between the threshold and the
Orowan stress, 0.02<σpart/σOro<1. The dislocation climb model by Eliasson et al. [9]
compares the dislocation glide kinetics with the climb kinetics. With this approach,
the importance of dislocation climb can be determined. A study on 9-12% Cr steels
presented in paper I shows that the particle hardening increases approximately linearly
to the applied stress with an upper limit at the Orowan stress. One conclusion from
these simulations is that a fine distribution of small particles will produce a low
interparticle spacing and an important strength contribution according to the Orowan
equation. Smaller particles are however more easily climbed and a deviation from the
Orowan for small particles is expected at creep.
4.4 Solid solution hardening and creep
Alloying elements still solved in the matrix will not contribute to particle
hardening but is believed to lower the dislocation mobility by solid solution
hardening. The role of solid solution hardening during creep is debated. For 9-12% Cr
steels Hald [49] showed by experiments that the creep strength actually increased with
the precipitation of Laves phase and the decreased solid solution elements. Other
studies from Sawada et al. [50] have shown that the addition of W slows down the
dislocation reaction rates, and thus the creep rate. The dislocation climb mobility as
suggested by Hirth and Lothe for pure metals [11] cannot directly be used in creep
modelling of 9-12% Cr steels as it will overestimate the dislocation related recovery
mechanisms [50].
21
The stress field around a dislocation will create a hydrostatic pressure. This
pressure is relaxed by inserting a solute atom. The size of the reversible work is then
directly related to the volume change times the pressure, where the size difference is
represented by the differences in atomic volume between solute and matrix [11]. This
attractive potential will lead to an accumulation of solutes, forming a Cottrell
atmosphere. As the dislocation starts to move the solutes will give rise to solid
solution hardening as this solute atmosphere get dragged. The interaction energy of a
solute at position (x, y) away from the dislocation core is given by Eq. (9) [11, 51],
where the first factor is the volume difference and the second factor the hydrostatic
pressure at a distance away from the dislocation core.
22, 11
3 yxxGbW ibai +−
+⋅Ω=
νν
πε (9)
x is the glide direction, y the climb direction, ν Poisson's ratio, and Ωa the atomic
volume. εb,j represents the size mismatch defined as iib bdcdb=,ε where ci is the
concentration of element i. The deviation from equilibrium concentration of solutes
due to the interaction energy is given by:
⎟⎠⎞
⎜⎝⎛−=
kTWcc i
ii exp,0 (10)
c0,i is concentration of solute in matrix. When including the movement of a dislocation
the diffusivities of solute atoms will determine the amount of accumulation. A
solution to Fick's second law with a moving frame of reference gives the
concentration profile around a dislocation at steady-state diffusion conditions and
origin at dislocation core [11]:
dxD
xvkTW
Dxv
kTW
Dcv
cx
i
clmbi
i
clmbi
i
iclmbi ∫
∞−⎟⎟⎠
⎞⎜⎜⎝
⎛+⎟⎟
⎠
⎞⎜⎜⎝
⎛−−= expexp,0 (11)
vclimb is the dislocation climb velocity. For concentrated solutions the concentration
profile is modified so that two solutes do not occupy the same position in lattice. This
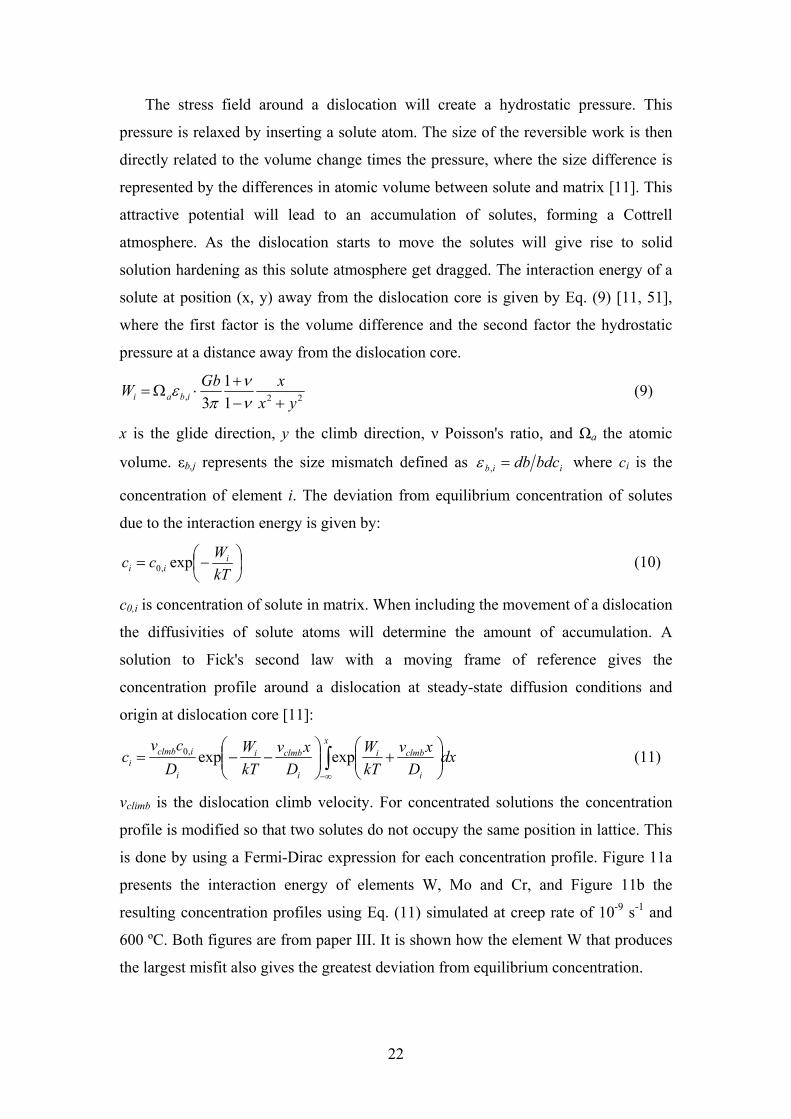
is done by using a Fermi-Dirac expression for each concentration profile. Figure 11a
presents the interaction energy of elements W, Mo and Cr, and Figure 11b the
resulting concentration profiles using Eq. (11) simulated at creep rate of 10-9 s-1 and
600 ºC. Both figures are from paper III. It is shown how the element W that produces
the largest misfit also gives the greatest deviation from equilibrium concentration.
22
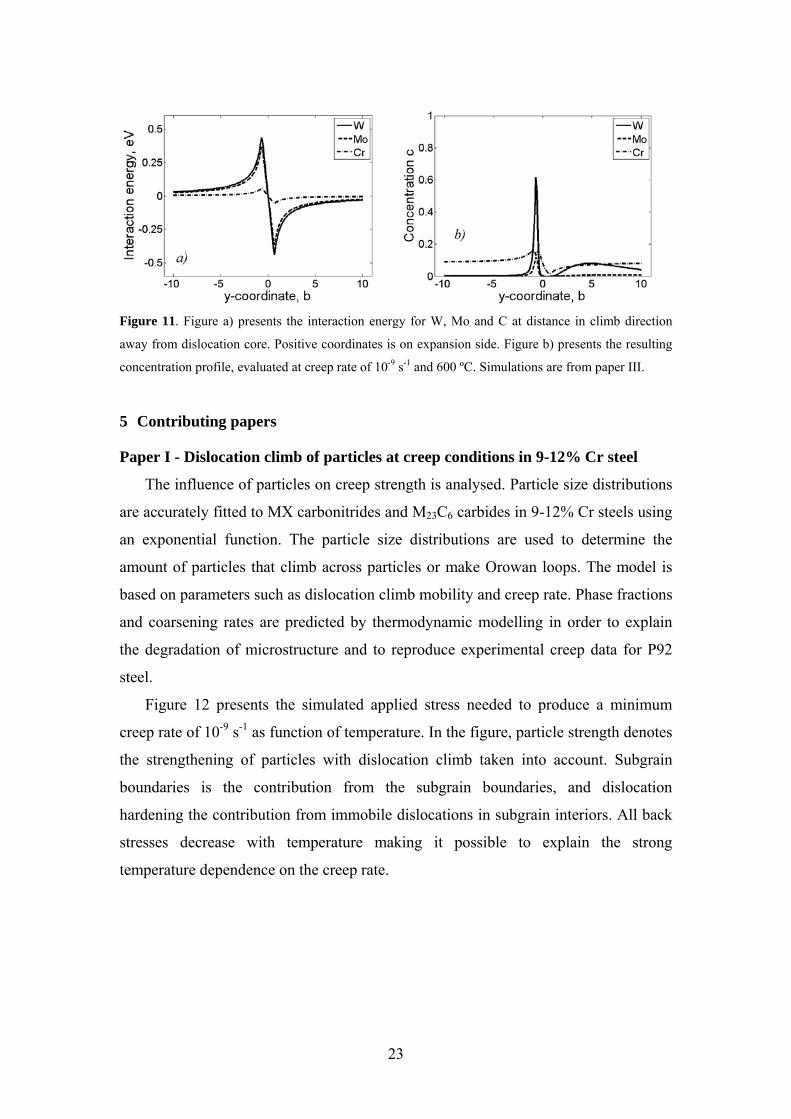
Figure 11. Figure a) presents the interaction energy for W, Mo and C at distance in climb direction
away from dislocation core. Positive coordinates is on expansion side. Figure b) presents the resulting
concentration profile, evaluated at creep rate of 10-9 s-1 and 600 ºC. Simulations are from paper III.
5 Contributing papers
Paper I - Dislocation climb of particles at creep conditions in 9-12% Cr steel
The influence of particles on creep strength is analysed. Particle size distributions
are accurately fitted to MX carbonitrides and M23C6 carbides in 9-12% Cr steels using
an exponential function. The particle size distributions are used to determine the
amount of particles that climb across particles or make Orowan loops. The model is
based on parameters such as dislocation climb mobility and creep rate. Phase fractions
and coarsening rates are predicted by thermodynamic modelling in order to explain
the degradation of microstructure and to reproduce experimental creep data for P92
steel.
Figure 12 presents the simulated applied stress needed to produce a minimum
creep rate of 10-9 s-1 as function of temperature. In the figure, particle strength denotes
the strengthening of particles with dislocation climb taken into account. Subgrain
boundaries is the contribution from the subgrain boundaries, and dislocation
hardening the contribution from immobile dislocations in subgrain interiors. All back
stresses decrease with temperature making it possible to explain the strong
temperature dependence on the creep rate.
23
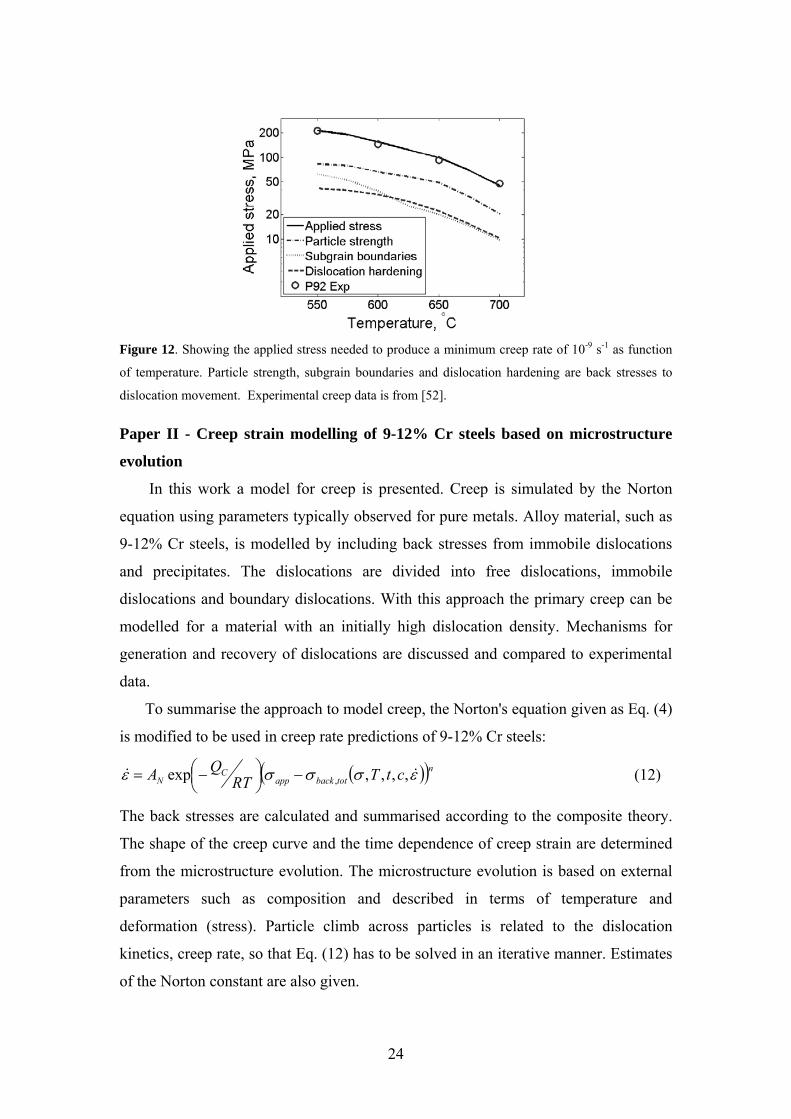
Figure 12. Showing the applied stress needed to produce a minimum creep rate of 10-9 s-1 as function
of temperature. Particle strength, subgrain boundaries and dislocation hardening are back stresses to
dislocation movement. Experimental creep data is from [52].
Paper II - Creep strain modelling of 9-12% Cr steels based on microstructure
evolution
In this work a model for creep is presented. Creep is simulated by the Norton
equation using parameters typically observed for pure metals. Alloy material, such as
9-12% Cr steels, is modelled by including back stresses from immobile dislocations
and precipitates. The dislocations are divided into free dislocations, immobile
dislocations and boundary dislocations. With this approach the primary creep can be
modelled for a material with an initially high dislocation density. Mechanisms for
generation and recovery of dislocations are discussed and compared to experimental
data.
To summarise the approach to model creep, the Norton's equation given as Eq. (4)
is modified to be used in creep rate predictions of 9-12% Cr steels:
(( ntotbackapp
CN ctTRT
QA εσσσε && ,,,,exp ,−⎟⎠⎞⎜
⎝⎛−= )) (12)
The back stresses are calculated and summarised according to the composite theory.
The shape of the creep curve and the time dependence of creep strain are determined
from the microstructure evolution. The microstructure evolution is based on external
parameters such as composition and described in terms of temperature and
deformation (stress). Particle climb across particles is related to the dislocation
kinetics, creep rate, so that Eq. (12) has to be solved in an iterative manner. Estimates
of the Norton constant are also given.
24
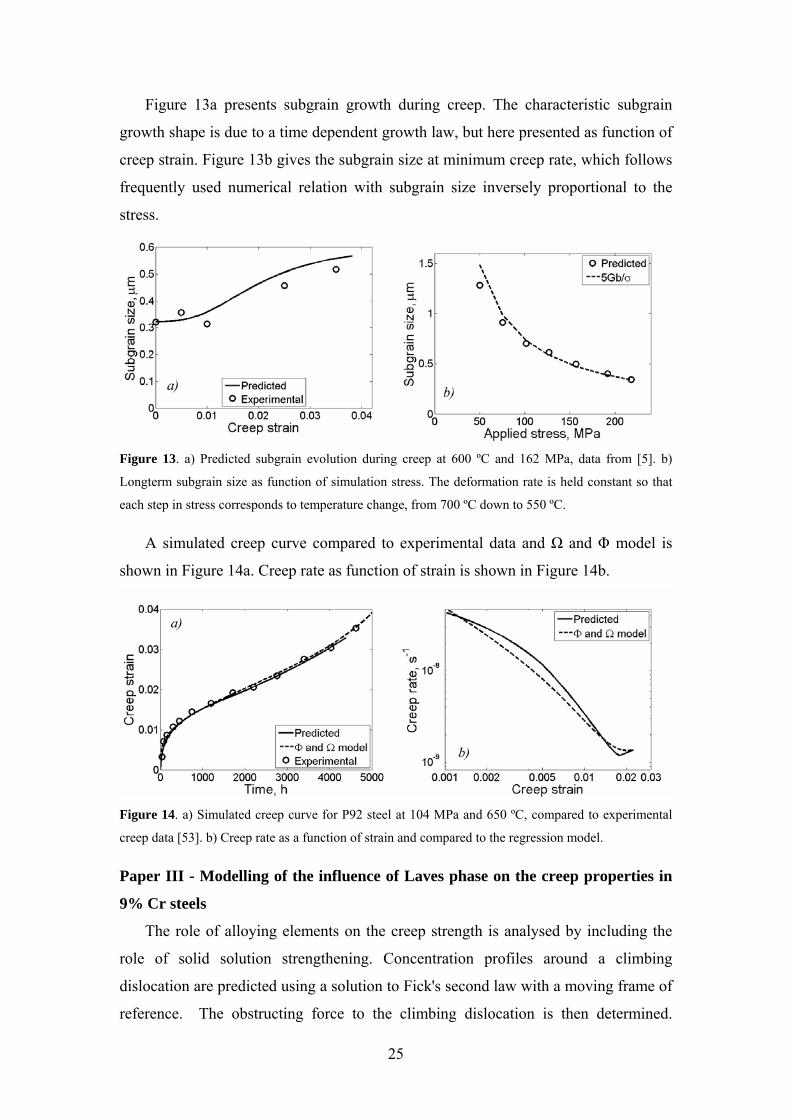
Figure 13a presents subgrain growth during creep. The characteristic subgrain
growth shape is due to a time dependent growth law, but here presented as function of
creep strain. Figure 13b gives the subgrain size at minimum creep rate, which follows
frequently used numerical relation with subgrain size inversely proportional to the
stress.
Figure 13. a) Predicted subgrain evolution during creep at 600 ºC and 162 MPa, data from [5]. b)
Longterm subgrain size as function of simulation stress. The deformation rate is held constant so that
each step in stress corresponds to temperature change, from 700 ºC down to 550 ºC.
A simulated creep curve compared to experimental data and Ω and Φ model is
shown in Figure 14a. Creep rate as function of strain is shown in Figure 14b.
Figure 14. a) Simulated creep curve for P92 steel at 104 MPa and 650 ºC, compared to experimental
creep data [53]. b) Creep rate as a function of strain and compared to the regression model.
Paper III - Modelling of the influence of Laves phase on the creep properties in
9% Cr steels
The role of alloying elements on the creep strength is analysed by including the
role of solid solution strengthening. Concentration profiles around a climbing
dislocation are predicted using a solution to Fick's second law with a moving frame of
reference. The obstructing force to the climbing dislocation is then determined.
25
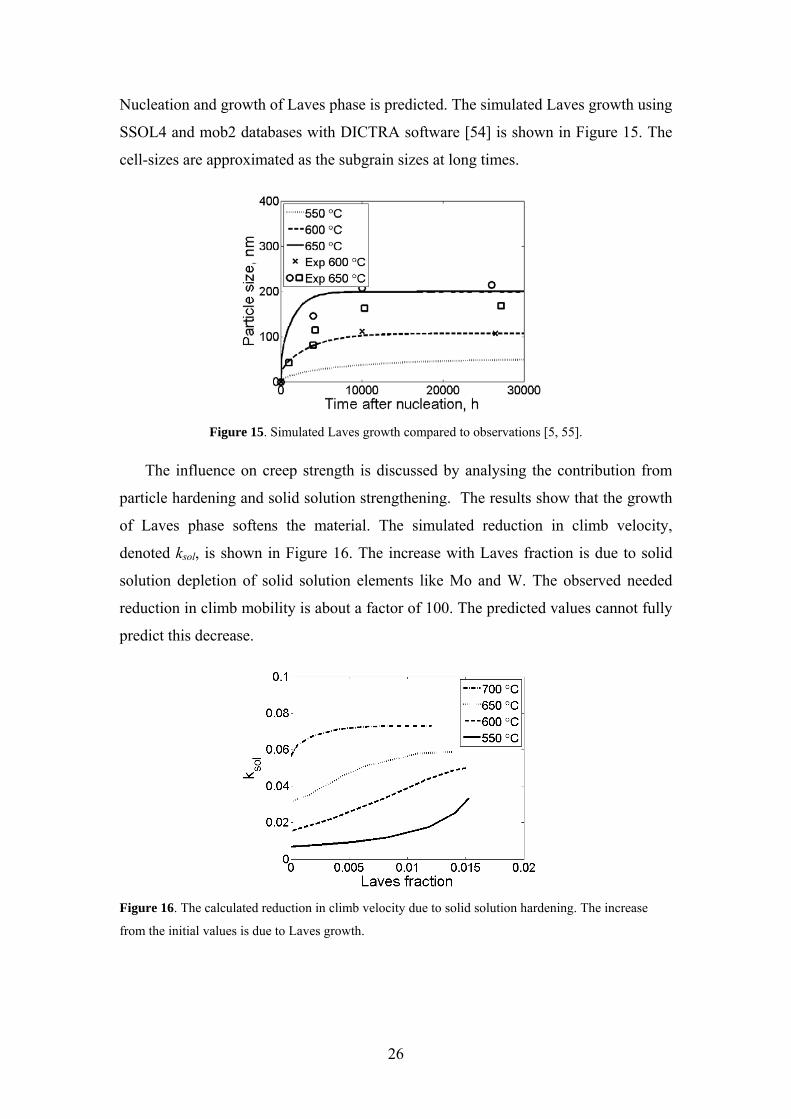
Nucleation and growth of Laves phase is predicted. The simulated Laves growth using
SSOL4 and mob2 databases with DICTRA software [54] is shown in Figure 15. The
cell-sizes are approximated as the subgrain sizes at long times.
Figure 15. Simulated Laves growth compared to observations [5, 55].
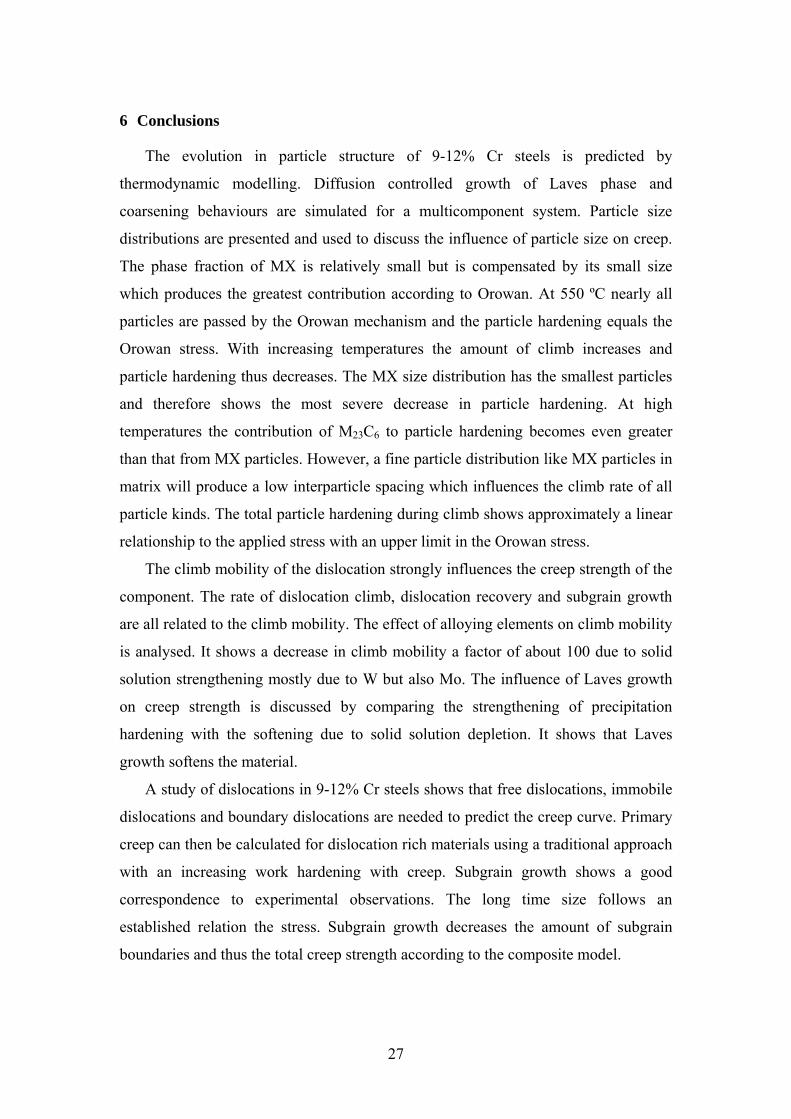
The influence on creep strength is discussed by analysing the contribution from
particle hardening and solid solution strengthening. The results show that the growth
of Laves phase softens the material. The simulated reduction in climb velocity,
denoted ksol, is shown in Figure 16. The increase with Laves fraction is due to solid
solution depletion of solid solution elements like Mo and W. The observed needed
reduction in climb mobility is about a factor of 100. The predicted values cannot fully
predict this decrease.
Figure 16. The calculated reduction in climb velocity due to solid solution hardening. The increase
from the initial values is due to Laves growth.
26
6 Conclusions
The evolution in particle structure of 9-12% Cr steels is predicted by
thermodynamic modelling. Diffusion controlled growth of Laves phase and
coarsening behaviours are simulated for a multicomponent system. Particle size
distributions are presented and used to discuss the influence of particle size on creep.
The phase fraction of MX is relatively small but is compensated by its small size
which produces the greatest contribution according to Orowan. At 550 ºC nearly all
particles are passed by the Orowan mechanism and the particle hardening equals the
Orowan stress. With increasing temperatures the amount of climb increases and
particle hardening thus decreases. The MX size distribution has the smallest particles
and therefore shows the most severe decrease in particle hardening. At high
temperatures the contribution of M23C6 to particle hardening becomes even greater
than that from MX particles. However, a fine particle distribution like MX particles in
matrix will produce a low interparticle spacing which influences the climb rate of all
particle kinds. The total particle hardening during climb shows approximately a linear
relationship to the applied stress with an upper limit in the Orowan stress.
The climb mobility of the dislocation strongly influences the creep strength of the
component. The rate of dislocation climb, dislocation recovery and subgrain growth
are all related to the climb mobility. The effect of alloying elements on climb mobility
is analysed. It shows a decrease in climb mobility a factor of about 100 due to solid
solution strengthening mostly due to W but also Mo. The influence of Laves growth
on creep strength is discussed by comparing the strengthening of precipitation
hardening with the softening due to solid solution depletion. It shows that Laves
growth softens the material.
A study of dislocations in 9-12% Cr steels shows that free dislocations, immobile
dislocations and boundary dislocations are needed to predict the creep curve. Primary
creep can then be calculated for dislocation rich materials using a traditional approach
with an increasing work hardening with creep. Subgrain growth shows a good
correspondence to experimental observations. The long time size follows an
established relation the stress. Subgrain growth decreases the amount of subgrain
boundaries and thus the total creep strength according to the composite model.
27
7 Future work
The contributed papers provide a possible explanation of the transient creep of
particle strengthened materials. The important mechanisms that determine creep
strength have been identified and fundamentally explained in order to predict creep in
a more general manner.
Future work should include tertiary stage for a better representation of the creep
curve. The solid solution hardening approach could be refined to reproduce the
measured creep data. Long-term creep data should be modelled to better evaluate the
practical use of the creep model. Much of the presented work typically have rupture
times less than 25 000 h.
The model for creep can still be used for evaluation of creep strength. A possible
action within the COST538 program is to study the effect of Al on creep strength.
This kind of work can be done with the present model.
8 Acknowledgements
I would like to thank partners from the CROX collaboration for fruitful
discussions about creep related topics, as well as colleagues participating in the
European COST538 project. The MATOP participation has provided me valuable
feedback about my own project and nice presentations about related topics.
I would also like to thank Prof. Rolf Sandström for accepting me as a graduate
student and for all the help and guidance during my work.
Past and present colleagues at the department and Fikagänget are thanked for the
various discussions and events, especially my room mate Johan for together
experiencing all the graduate courses, project meetings, squash games and the weakly
competitions in general knowledge.
Finally I would like to thank my parents, brother and sisters for making all this
possible, and Alfons and Laban for their good spirit and most of all Mimmi.
This work was supported by the Swedish foundation for strategic research (SSF)
programmes CROX, “Mechanisms of creep and oxidation of high performance
alloys” and MATOP, “Development of tools for integrated optimisation of
materials”, which is gratefully acknowledged.
28
9 References
[1] I. J. Perrin, J. D. Fishburn, Creep and fracture in high temperature components
– design and life assessment issues, DEStech Publications Inc., Lancaster, PA,
USA, 2005, pp. 46-30.
[2] J. Hald, Creep and fracture in high temperature components – design and life
assessment issues, DEStech Publications Inc., Lancaster, PA, USA, 2005, pp.
20-30.
[3] F. Masuyama, Materials for advanced power engineering 2006,
Forschungszentrum Jülich GmbH, Jülich, Germany, 2006, vol. 53, pp. 175-
187.
[4] H. D. Newell, Metall progress, 1936, pp. 175-187.
[5] L. Korcakova, Doctoral Thesis, Technical University of Denmark, 2002.
[6] F. Masuyama, 123rd ISIJ Annual Meeting, Chiba, Japan, 1992, pp. 811.
[7] H. K. Danielsen, J. Hald, F. B. Grumsen, M. Somers, Metall. Mater. Trans. A.,
2006, vol. 37A, pp. 2633-2640.
[8] M. Hättestrand, H. O. Andrén, Micron, 2001, vol. 32, pp. 789-797.
[9] J. Eliasson, Å. Gustafson, R. Sandström, Key Eng. Mat. , 2000, vol. 171-174,
pp. 277-284.
[10] B. Sundman, B. Jansson, J.O. Andersson, CALPHAD, 1985, vol. 9, pp. 153-
190.
[11] J. P. Hirth, J. Lothe, Theory of dislocations, 2 nd ed., Wiley, New-York, NY,
USA, 1982.
[12] R. Wu, R. Sandström, F. Seitisleam, J. Eng. Mater. Technol., 2004, vol. 126,
pp. 87-94.
[13] J. Hald, 3rd EPRI conference on Advances in Materials Technology for Fossil
Power Plants, 2001, Swansea, UK, 2001, pp. 115.
[14] F. C. Monkman, N. J. Grant, Proc. ASTM, 1956, vol. 56, pp. 593-597.
[15] T. G. Langdon, J. Mater. Sci., 2006, vol. 41, pp. 597-609.
[16] F. R. N. Nabarro, Strength on solids, Physical Society, London, England,
1948.
[17] C. Herring, J. Appl. Phys., 1950, vol. 21, pp. 437-445.
[18] R. L. Coble, J. Appl. Phys., 1963, vol. 34, pp. 1679-1682.
[19] J. Weertman, J. Appl. Phys., 1957, vol. 28, pp. 362-364.
29
[20] A. H. Cottrell, M. A. Jaswon, Proc. R. Soc. A., 1949, vol. 199, pp. 104-114.
[21] O. D. Sherby, P. M. Burke, Prog. Mater. Sci., 1967, vol. 13, pp. 323-390.
[22] J. Harper, J. E. Dorn, Acta Metall, 1957, vol. 5, pp. 654-665.
[23] P. Kumar, M. E. Kassner, T. G. Langdon, J. Mater. Sci., 2007, vol. 42, pp.
409-420.
[24] C. R. Barrett, W. D. Nix, Acta Metall., 1965, vol. 13, pp. 1247-1258.
[25] F. R. N. Nabarro, Phil. Mag., 1967, vol. 16, pp. 231-237.
[26] O. D. Sherby, J. Weertman, Acta Metall., 1979, vol. 27, pp. 387-400.
[27] R. W. Evans, B. Wilshire, Institute of Metals, London, UK, 1985.
[28] M. E. Kassner, M. T. Pérez-Prado, Prog. Mater Sci., 2000, vol. 45, pp. 1-102.
[29] W. Blum, P. Eisenlohr, F. Breutinger, Metall. Mater. Trans. A., 2002, vol. 33,
pp. 291-308.
[30] J. Pesicka, R. Kuzel, A. Dronhofer, G. Eggeler, Acta Mater., 2003, vol. 51, pp.
4847-4862.
[31] P. Polcik, Doctoral Thesis, Erlangen, Germany, 1998.
[32] G. Eggeler, N. Nilsvang, B. Ilschner, Steel Res. 1987, vol. 58, pp. 97-103.
[33] K. Sawada, k. Maruyama, Y. Hasegawa, T. Muraki, Key Eng. Mat., 2000, vol.
171-174, pp. 109-114.
[34] T. Sailer, Doctoral Thesis, Erlangen, Germany, 1998.
[35] R. Sedláček, W. Blum, J. Kratochvil, S. Forest, Metall. Mater. Trans. A.,
2002, vol. 33, pp. 319-327.
[36] M. R. Staker, D. L. Holt, Acta Metall., 1972, vol. 20, pp. 569-579.
[37] R. Sandström, Acta Mater., 1977, vol. 25, pp. 905-911.
[38] P. Polcik, T. Sailer, W. Blum, S. Straub, J. Bursĭk, A. Orlová, Mater. Sci.
Eng., 1999, vol. A260, pp. 252-259.
[39] H. Mughrabi, Acta Metall., 1983, vol. 31, pp. 1367-1379.
[40] R. Sedláček, W. Blum, Comput. Mater. Sci., 2002, vol. 25, pp. 200-206.
[41] S. Straub, Doctoral Thesis, Erlangen, Germany, 1995.
[42] T. Barkar, J. Ågren, Mater. Sci. Eng., 2005, vol. A395, pp. 110-115.
[43] J. Ågren, M. T. Clavaguera-Mora, J. Golcheski, G. Inden, H. Kumar, Chr.
Sigli, CALPHAD, 2000, vol. 24, pp. 41-54.
[44] L. M. Brown, R.K. Ham: Strengthening Methods in crystals, Elsevier,
Amsterdam, Netherlands, 1971.
[45] R. Lagneborg, Scripta. Metall. Mater., 1973, vol. 7, pp. 605-613.
30
[46] D. J. Srolowitz, M. J. Luton, R. Petkovic-Luton, D. M. Barnett, E. D. Nix,
Acta Metall., 1984, vol. 32, pp. 1079-1088.
[47] E. Arzt, J. H. Schröder, Scripta Metall., 1985, vol. 19, pp. 1129-1134.
[48] W. Blum, B. Reppich, Creep Behaviour of Crystalline Solids, Pineridge Press,
Swansea, UK, 1985, pp. 83-135.
[49] J. Hald, Steel research, 1996, vol. 67, pp. 369-374.
[50] K. Sawada, M. Takeda, K. Maruyama, R. Ishii, M. Yamada, Y. Nagae and R.
Komine, Mater. Sci. Eng., 1999, vol. 267, pp. 19-25.
[51] J. Friedel, Dislocations, Pergamon, Oxford, 1964.
[52] K. Sawada , K. Kubo, F. Abe, Mater. Sci. Eng., 2001, vol. A319, pp. 784-787.
[53] P. J. Ennis, A. Zielinska-Lipiecz, O. Wachter, A. Czyrska-Filemonowicz, Acta
Mater., 1997, vol. 45, pp. 4901-4907.
[54] A. Borgenstam, A. Engström, L. Höglund, J. Ågren, J. Phase Equilib., 2000,
vol. 21, pp. 269-280.
[55] P. Weinert, G. Dimmler, E. Letofsky, B. Sonderegger, J. Rajek, H. Cerjak,
Modern 9–12% Cr-steels for power plant-application, 28th MPA-Seminar in
Stuttgart, Germany, 10–11 October, 2002.
31