Embed Size (px)
Citation preview

Cross-country Consistent
Estimation of Agricultural Productivity
Yu Sheng (Eric) ABARES
the Superlative vs. the Quantity-
only Based Index Approach
5 December 2014
EMG Workshop 2014
UNSW, Sydney
Introduction
Department of Agriculture 2 5 December, Sydney
EMG Workshop 2014
Agricultural productivity growth is at the heart of dealing with global food
security
•global agricultural total factor productivity grew at 1.0 pct a year
between 1961 and 2010
•it accounted for a significant proportion of agricultural output growth
and depressed global food price
However, agricultural productivity grows unevenly across countries
•No evidence of convergence in agricultural productivity between
developed countries
•significant gap in productivity levels and growth between developed
and developing countries
It is essential to measure and compare agricultural productivity across
countries.
Introduction
Department of Agriculture 3 5 December, Sydney
EMG Workshop 2014
The growth accounting based index method is widely used a tool to
measure agricultural TFP at the industry level.
•initially developed by Jorgenson and Nishimizu (1978) and others
•large amount of literature including Ball et al. (2001, 2010), Fuglie
(2010), Coelli and Rao (2005), Ludena et al. (2007) and Nin-Pratt and
Yu (2009) etc.
Most of these studies can be categorised into two groups, depending on
the index method that they have used
•the superlative index (i.e. Fisher or Törnqvist)
•the quantity-only based index approach (i.e. Malmquist)
Although the two methods should be equal theoretically (Fare 1994), it is
not known which one performs better from an empirical perspective.
Introduction
Department of Agriculture 4 5 December, Sydney
EMG Workshop 2014
This paper aims to apply both of these index methods to cross-country
consistent data between the United States, Canada and Australia
•measure and compare agricultural TFP across countries
•examine the relative performance of the two methods
There are two contributions made to the literature
•provide a unique (national account based) dataset to compare
agricultural production system across countries at the commodity and
industry levels.
•examine the role of price information in constructing reliable index
measure in international comparison.
The findings are not restricted to the three-country case, which has
important policy implications for statistical agencies.
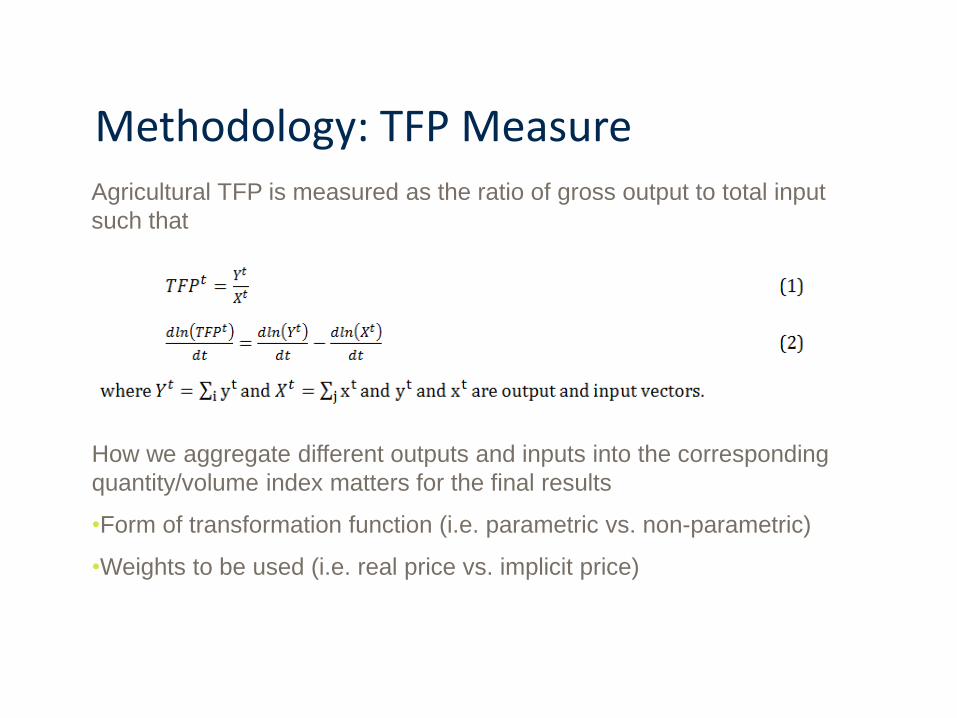
Methodology: TFP Measure Agricultural TFP is measured as the ratio of gross output to total input
such that
How we aggregate different outputs and inputs into the corresponding
quantity/volume index matters for the final results
•Form of transformation function (i.e. parametric vs. non-parametric)
•Weights to be used (i.e. real price vs. implicit price)
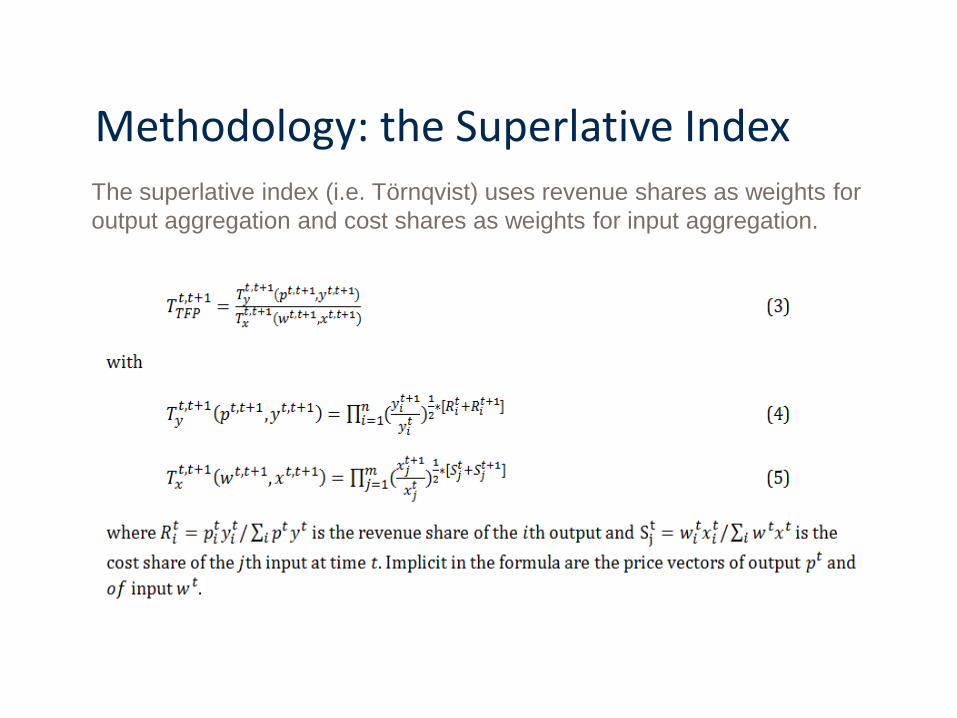
Methodology: the Superlative Index The superlative index (i.e. Törnqvist) uses revenue shares as weights for
output aggregation and cost shares as weights for input aggregation.
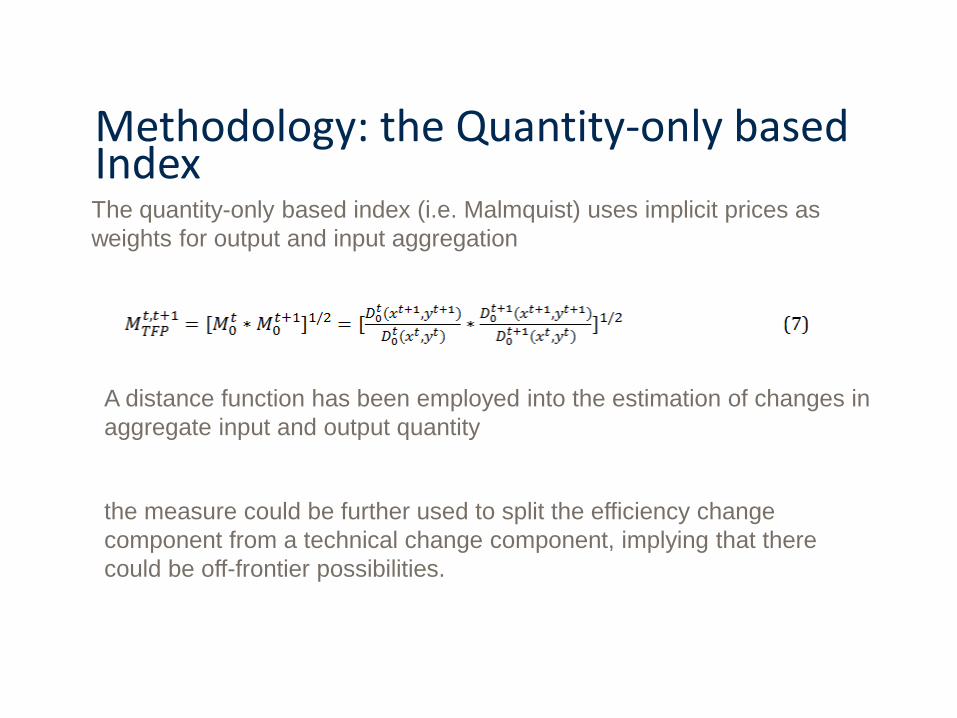
Methodology: the Quantity-only based Index The quantity-only based index (i.e. Malmquist) uses implicit prices as
weights for output and input aggregation
A distance function has been employed into the estimation of changes in
aggregate input and output quantity
the measure could be further used to split the efficiency change
component from a technical change component, implying that there
could be off-frontier possibilities.
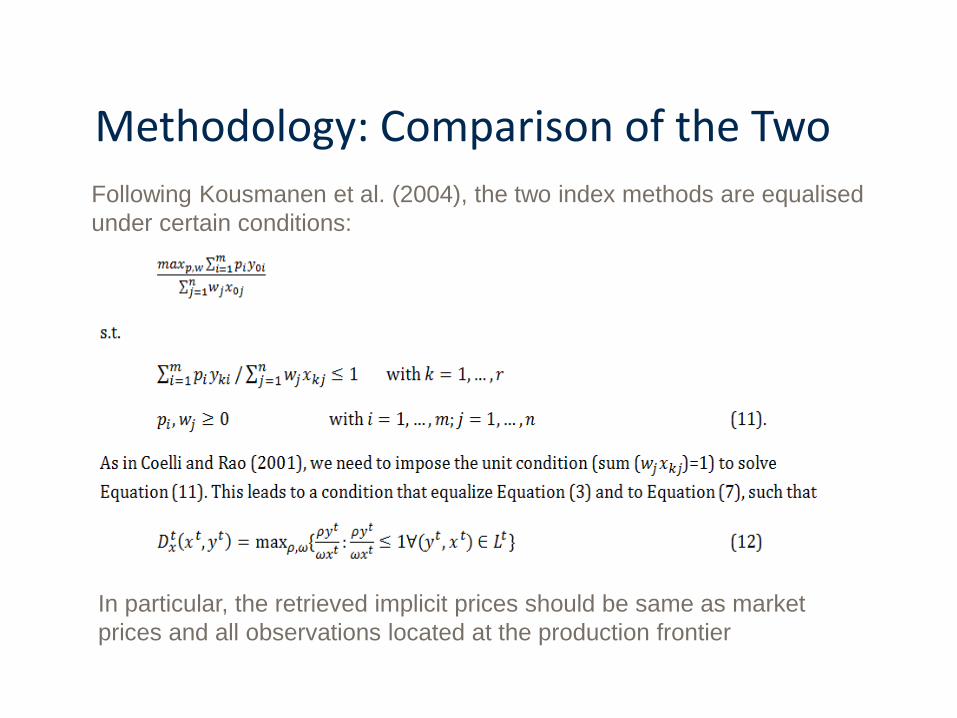
Methodology: Comparison of the Two
Following Kousmanen et al. (2004), the two index methods are equalised
under certain conditions:
In particular, the retrieved implicit prices should be same as market
prices and all observations located at the production frontier
Data Source
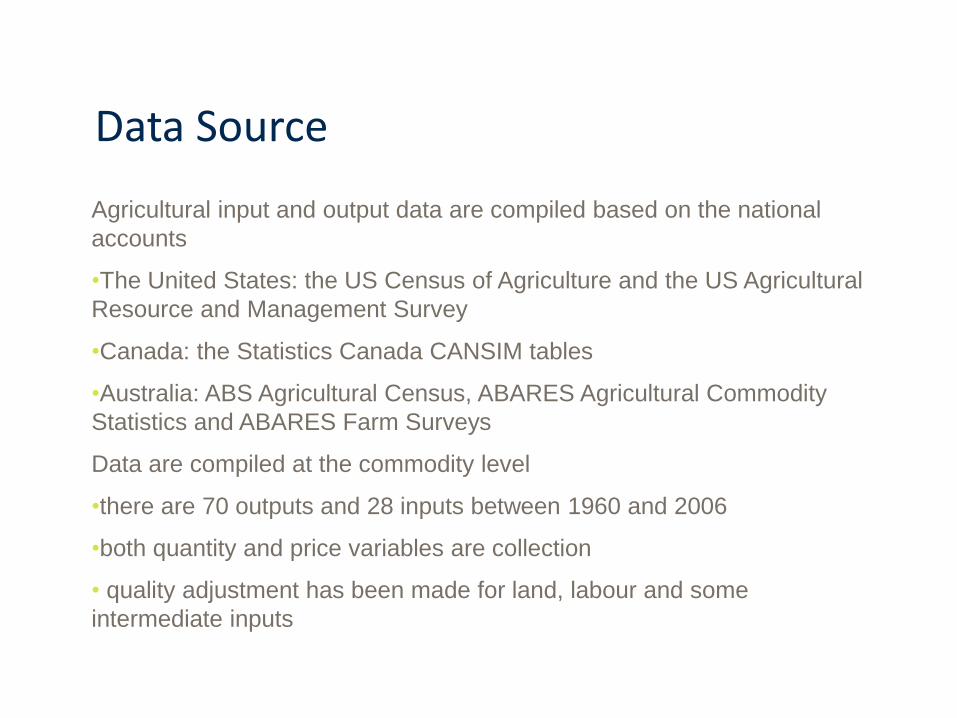
Agricultural input and output data are compiled based on the national
accounts
•The United States: the US Census of Agriculture and the US Agricultural
Resource and Management Survey
•Canada: the Statistics Canada CANSIM tables
•Australia: ABS Agricultural Census, ABARES Agricultural Commodity
Statistics and ABARES Farm Surveys
Data are compiled at the commodity level
•there are 70 outputs and 28 inputs between 1960 and 2006
•both quantity and price variables are collection
• quality adjustment has been made for land, labour and some
intermediate inputs
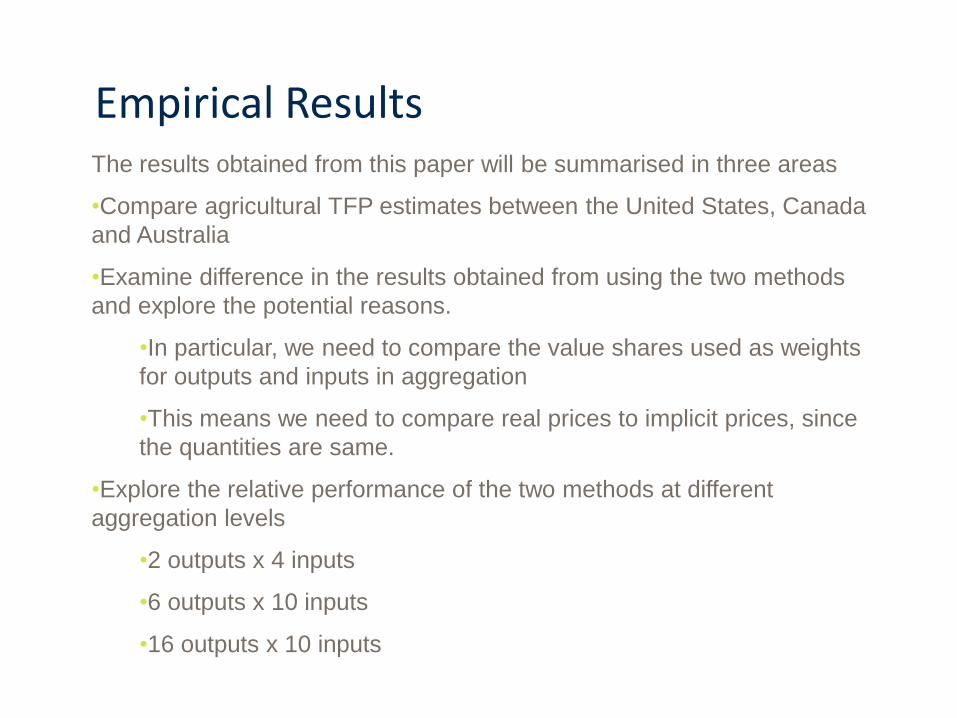
Empirical Results The results obtained from this paper will be summarised in three areas
•Compare agricultural TFP estimates between the United States, Canada
and Australia
•Examine difference in the results obtained from using the two methods
and explore the potential reasons.
•In particular, we need to compare the value shares used as weights
for outputs and inputs in aggregation
•This means we need to compare real prices to implicit prices, since
the quantities are same.
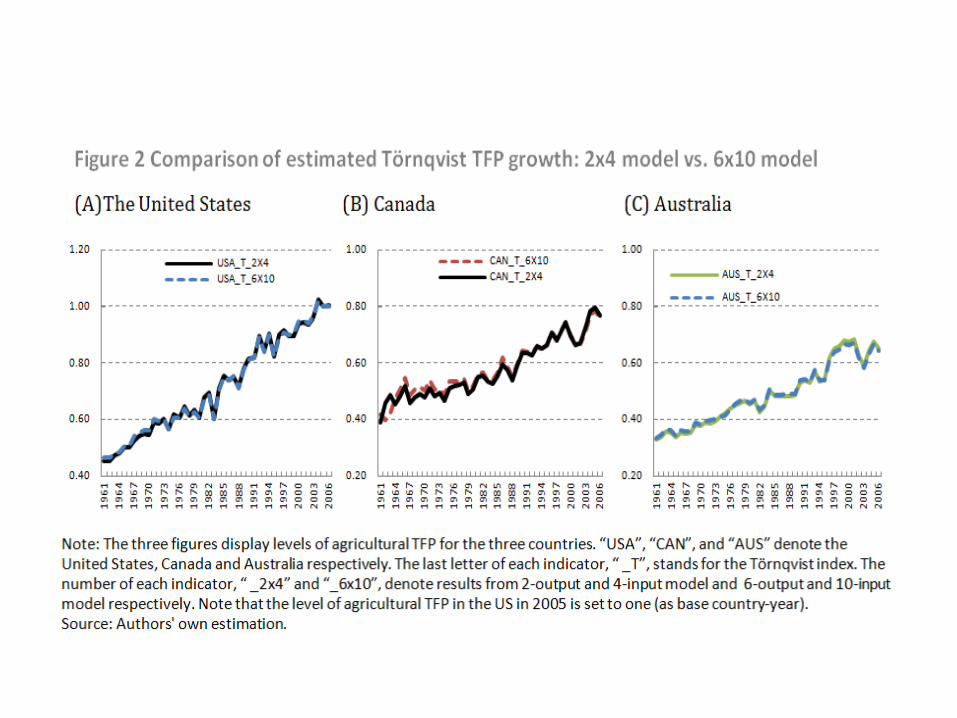
•Explore the relative performance of the two methods at different
aggregation levels
•2 outputs x 4 inputs
•6 outputs x 10 inputs
•16 outputs x 10 inputs
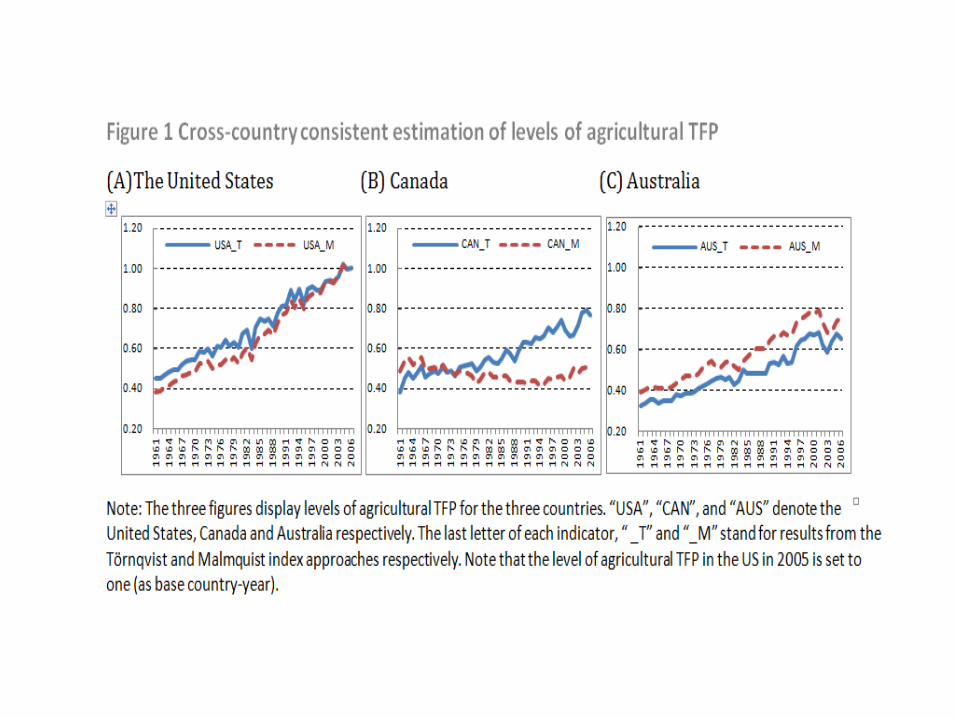
Compare Agricultural TFP between the United States, Canada and Australia
Agricultural TFP has been increasing in all the three countries over time
•The finding is consistent with our previous study
•It is consistent with literature using different methods and data.
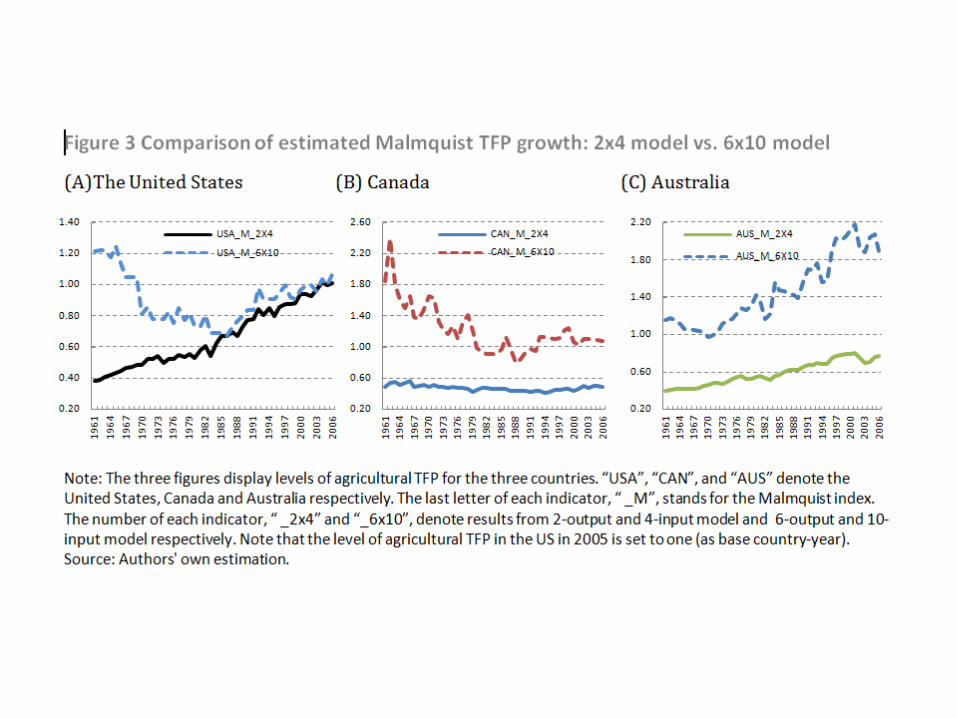
The two index method will generate different agricultural TFP estimates
across countries.
•The difference lies in agricultural TFP estimates for all countries
•The estimates obtained from the two approaches is opposite in
direction for Canada
Reasons need to be provided to explain the difference in findings obtained
from the two index methods
•The data are same so it will not cause the problem.
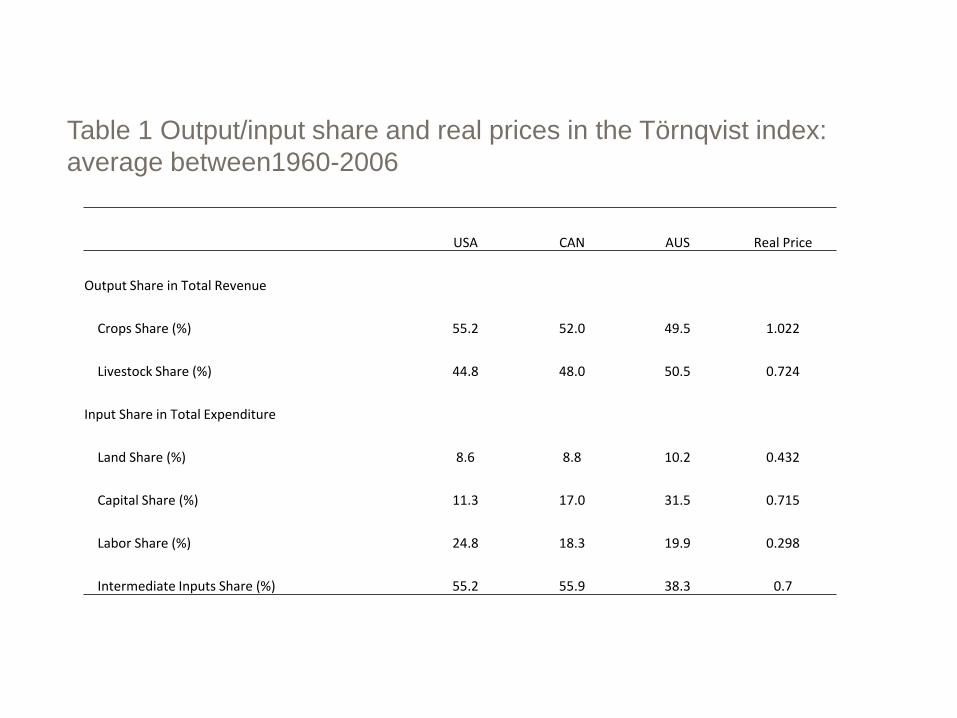
Table 1 Output/input share and real prices in the Törnqvist index:
average between1960-2006
USA CAN AUS Real Price
Output Share in Total Revenue
Crops Share (%) 55.2 52.0 49.5 1.022
Livestock Share (%) 44.8 48.0 50.5 0.724
Input Share in Total Expenditure
Land Share (%) 8.6 8.8 10.2 0.432
Capital Share (%) 11.3 17.0 31.5 0.715
Labor Share (%) 24.8 18.3 19.9 0.298
Intermediate Inputs Share (%) 55.2 55.9 38.3 0.7
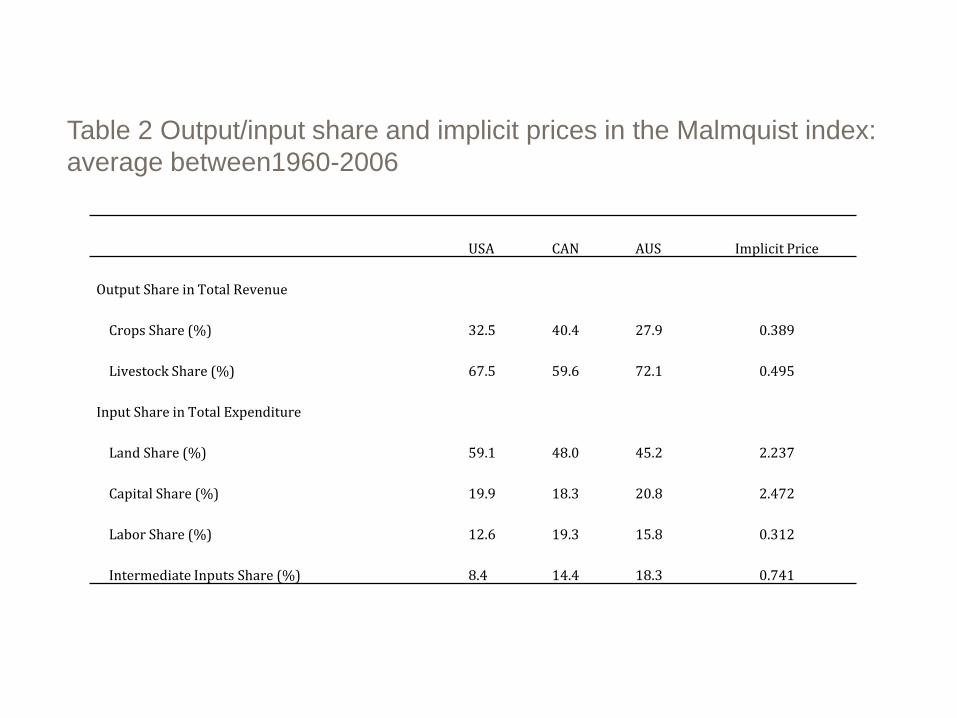
Table 2 Output/input share and implicit prices in the Malmquist index:
average between1960-2006
USA CAN AUS Implicit Price
Output Share in Total Revenue
Crops Share (%) 32.5 40.4 27.9 0.389
Livestock Share (%) 67.5 59.6 72.1 0.495
Input Share in Total Expenditure
Land Share (%) 59.1 48.0 45.2 2.237
Capital Share (%) 19.9 18.3 20.8 2.472
Labor Share (%) 12.6 19.3 15.8 0.312
Intermediate Inputs Share (%) 8.4 14.4 18.3 0.741
Conclusions
Department of Agriculture 17 19-20 June, Brisbane
Meeting of the G20 Agricultural Chief Scientists
There are challenging issues both in the construction of cross-
country consistent data as well as the choice of measurement
methods.
We find that agricultural productivity in these three countries have
generally been increasing during the period under study, though
uneven across countries.
In terms of method comparison, agricultural TFP estimates obtained
from using the superlative index outperforms those obtained from
using the quantity-only based index.
Our finding points to the importance of price data collection work for
cross-country consistent agricultural productivity comparison.

EMG Workshop 2014
5 December 2014, Sydney
Questions
and
Comments