Embed Size (px)
Citation preview
1
Crowdfunding Models: Keep-it-All vs. All-or-Nothing
Douglas J. Cumming York University - Schulich School of Business
Professor and Ontario Research Chair York University - Schulich School of Business
4700 Keele Street Toronto, Ontario M3J 1P3 (Canada)
E-mail: [email protected]
Gael Leboeuf Université Lille Nord de France – SKEMA
Université Lille 2 Faculté de Finance, Banque, Comptabilité
Rue de Mulhouse 2 - BP 381 F - 59020 Lille Cédex (France)
E-mail: [email protected]
Armin Schwienbacher Université Lille Nord de France – SKEMA
Université Lille 2 Faculté de Finance, Banque, Comptabilité
Rue de Mulhouse 2 - BP 381 F - 59020 Lille Cédex (France)
E-mail: [email protected]
This version: June 2, 2014
2
Crowdfunding Models: Keep-it-All vs. All-or-Nothing
Abstract
Rewards-based crowdfunding campaigns are commonly offered in one of two models: “Keep-it-All” (KIA)
where the entrepreneurial firm sets a fundraising goal and keeps the entire amount raised regardless of
whether or not they meet their goal, and “All-or-Nothing” (AON) where the entrepreneurial firm sets a
fundraising goal and keeps nothing unless the goal is achieved. We provide large sample evidence
consistent with the view that the usage of AON is a credible signal to the crowd that the entrepreneur
commits not to undertake the project if not enough is raised. This signal reduces the risk to the crowd,
thereby enabling the AON entrepreneurial firms to set higher goals, raise more money, and be more
likely to reach their stated goals. In contrast, KIA projects tend to be less successful, since the crowd
bears the risk that an entrepreneurial firm undertakes a project that is underfunded and hence more
likely to fail after the campaign. Entrepreneurs use the KIA model for scalable projects; that is, projects
that are still feasible with partial funding. Further, we provide evidence that the crowd is much more
sensitive to information provided by AON projects. We show that these findings are robust to a number
of robustness checks, including but not limited to use of instrumental variables and propensity score
matching.
JEL Classification: G21, G24, G32, L26
Keywords: Entrepreneurial Finance, Crowdfunding, Internet, Signaling, Indiegogo
3
1. Introduction
The rise of crowdfunding has been facilitated by standardized Internet platforms which enable clear
mechanisms through which investors can invest in early-stage entrepreneurial firms (Mollick, 2014;
Belleflamme et al., 2013, 2014). Kickstarter and Indiegogo are rewards-based crowdfunding platforms
whereby entrepreneurs state capital raising goals, and in exchange investors are offered a reward for
participating. In most cases, the reward is the product that is eventually produced by the entrepreneur
with the money raised during the campaign. In practice, two types of platforms have emerged: "All-or-
Nothing" (AON), and “Keep-it-All” (KIA). In the AON model, entrepreneurial firms set a capital raising
goal below which the entrepreneurial firm does not keep any of the pledged funds, and the crowd does
not get any reward. In the KIA model, by contrast, the entrepreneurial firm can keep the entire pledged
amount, albeit at higher fees as explained further herein, regardless of whether or not the stated capital
raising goal is reached. In this paper, we consider whether the differences in these two fundraising
models give rise to differences in the types of firms that select a particular model, their eventual
likelihood of success, and the sensitivity of investors to information released by the entrepreneurial
firms.
We conjecture that entrepreneurs that self-select into the AON model do so in order to signal to the
crowd that they are committed to only undertake the project if enough capital is raised, which reduces
the crowd’s risk that undercapitalized projects will be undertaken as under the KIA model. As such, AON
projects are expected to be larger and more successful, and investors will be more sensitive to
information released by AON entrepreneurial firms. By contrast, KIA projects will be selected by
entrepreneurs that can scale their project (i.e., a portion of the planned project is feasible), and selected
by investors that still get utility from the reward under a scaled down format (knowing that they will lose
the entire utility if the project is canceled).
To test these propositions, we extract a sample of 47,139 fundraising campaigns from the Indiegogo
platform (www.indiegogo.com) over the years 2008 – 2013. Unlike other major platforms, Indiegogo
offers entrepreneurs since 2011 the option of picking either the AON or the KIA model. Thus, Indiegogo
offers a unique setting to investigate our research questions. The data indicate that 95% of fundraising
campaigns used the KIA model, while only 5% used the AON model. Campaigns using the AON model on
average seek to raise $31,355 (and median of $16,300), while campaign goals for KIA are on average
$19,677 (median of $10,000). AON campaigns have an average completion rate (i.e., the ratio of total
pledges over goal, in percent) of 64%, while KIA campaigns have a completion rate of 42%. Put
4
differently, 34% of all AON campaigns are successfully completed, while only 17% of all KIA campaigns
achieve their funding goal. AON campaigns have on average 188 backers, while KIA campaigns on
average attract 73 backers.
The data further indicate that there is a negative relationship between the funding goal and usage of the
KIA model, in line with the prediction that AON constitutes a commitment device and thus reduces risk
to the crowd as underfunded projects will not be undertaken under AON. Consistent with existing
studies on crowdfunding success (Mollick, 2014; Belleflamme et al., 2013, 2014; Mollick and
Kuppuswamy, 2014), campaigns with larger fundraising goals are less successful. Controlling for size
differences, our data indicate AON campaigns are more likely to achieve their goal. Further, we provide
evidence that the crowd is much more sensitive to information provided by AON projects. Taken
together, these results are consistent with view that the usage of AON is a clear signal to the crowd that
the entrepreneur commits not to undertake the project if not enough is raised, which represents a
potential cost to the entrepreneur who may not be able to undertake the project. The AON model
therefore reduces the risk to the crowd, thereby enabling the AON entrepreneurial firms to set higher
goals, raise more money, and be more likely to reach their stated goals. Opting for the AON model
allows entrepreneurs to alleviate constraints on their fundraising goals induced by the negative impact of
funding goals on success. In contrast, KIA projects tend to be less successful, since the crowd bears the
risk that an entrepreneurial firm undertakes a project that is underfunded and hence more likely to
eventually fail. These findings are robust to a number of specification tests, including controls for the
endogenous choice of the KIA versus AON model, the endogenous choice of the fundraising goal, and
propensity score matching.
Our paper is related to a small but growing literature on crowdfunding. Prior work on factors that affect
success on other crowdfunding platforms (which only offers AON crowdfunding, such as Kickstarter) is
available in Mollick (2014), Belleflamme et al. (2013, 2014), Mollick and Kuppuswamy (2014) and
Colombo et al. (2014). Related studies on crowdfunding studies have examined equity crowdfunding
(Ahlers et al., 2013; Cumming and Johan, 2013). More generally to the entrepreneurial finance literature
in both the theory (Schwienbacher, 2007) and evidence (Cosh et al., 2009) on the choice across different
forms of finance for capital constrained entrepreneurs. Further, our work is related to a large signaling
literature (e.g., Spence, 2002; Stuart et al., 1999). Our paper contributes to the literature by examining
different types of rewards-based crowdfunding models, and the role of signals in the crowdfunding
market.
5
The remainder of the paper is structured as follows. Section 2 provides information on the structure of
the Indiegogo platform. Our theoretical predictions are explained and summarized in Section 3. Section
4 introduces the data. The empirical tests are presented in Section 5. A discussion and concluding
remarks are provided in the last section.
2. The Structure of the Indiegogo Platform
Launched in 2008, Indiegogo has become the second largest crowdfunding platform worldwide (59,889
projects listed1), after Kickstarter (133,859 launched projects, among which 56,468 successfully funded
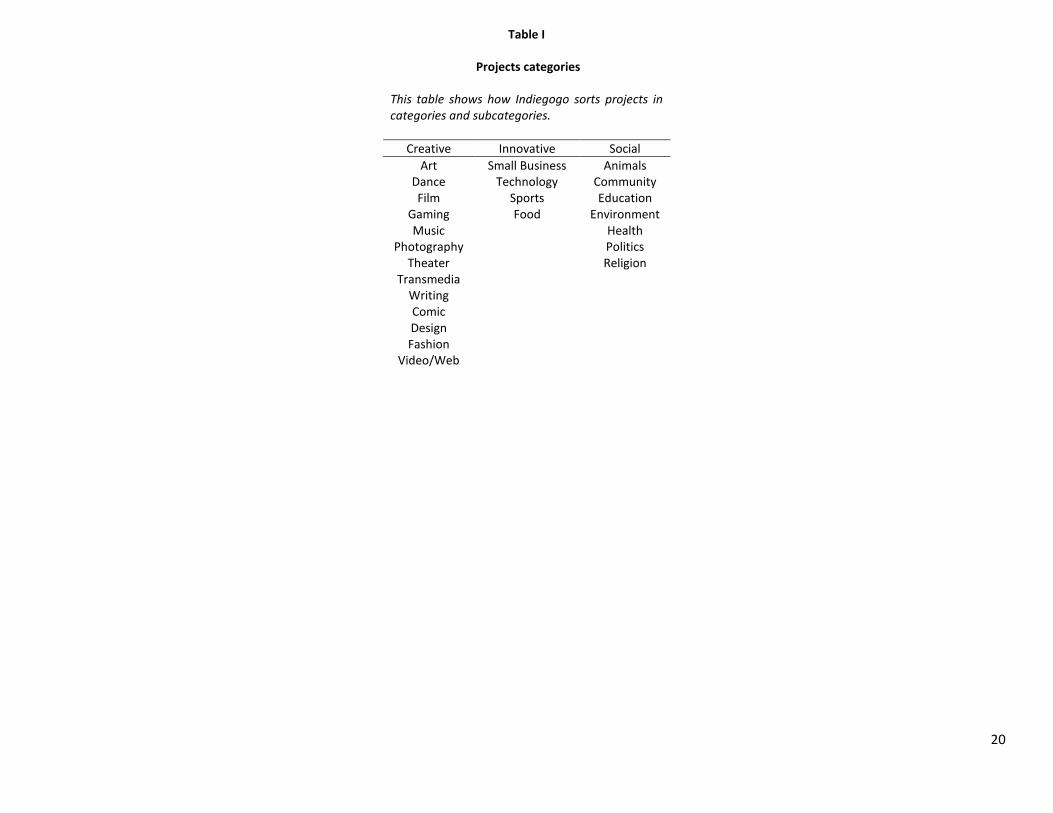
for a total amount raised of $986 million2). Indiegogo offers entrepreneurs the possibility to launch their
online reward-based crowdfunding campaign in three categories (Innovative, Creative or Social), which
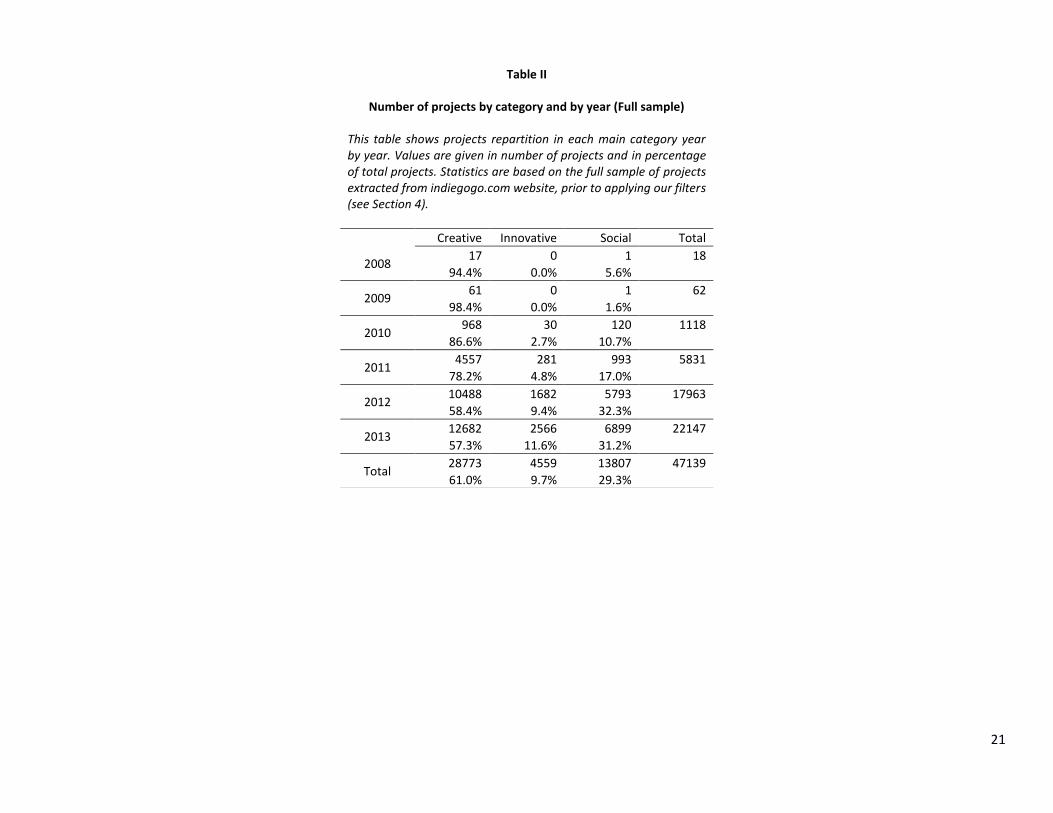
are divided in 24 subcategories (see Table I). As shown in Table II, 61% of the projects belong to the
creative category, 9.7% to the innovative category and 29.3% to the social category. The website is
available in English, French, German and Spanish, but project leaders may be located in any country of
the world. Entrepreneurs must have a fundraising goal of at least 500 units in any accepted currency
(USD, EUR, GBP, CAD or AUD). Projects can be posted by either an individual, a group of persons, a
registered business, a non-profit institution or even a religious organization. Campaigns can last up to 60
days for AON and up to 120 days for KIA. During the campaign, the platform collects pledges from the
backers; once the campaign ends, the money is transferred to the entrepreneur via PayPal.
[Tables I & II About Here]
One of the main differences between Indiegogo and most other platforms is the possibility for the
entrepreneur to choose between a KIA funding model and an AON model.3 Other major platforms such
as Kickstarter, FundedByMe or PeopleFund.it, only offer the possibility to run AON campaigns. Other
platforms such as RocketHub, GoFundMe or Sponsume, only allow use of the KIA model. In an AON
crowdfunding campaign, the entrepreneur sets a fixed fundraising goal. If the total money pledged is
smaller than the goal at the end of the campaign period, all the pledges are cancelled and the
1 Source: Indiegogo.com (last viewed on February 20, 2014)
2 Source: kickstarter.com (last viewed on February 20, 2014)
3 There are other platforms offering the choice between KIA and AON models, such as Community Funded and Crowdtilt. Indiegogo is however by far larger and more widely known according to the Google page rank (from 0 up to 10): a value of 7 for Indiegogo, 4 for Community Funded and 6 for Crowdtilt. By comparison, Kickstarter’s Google page rank is 7 and Wikipedia 9.
6
entrepreneur does not receive anything. On Indiegogo, this type of campaign is called “fixed funding”
and the platform takes a 4% success fee on the money received by the entrepreneur in case of a
successful campaign. In a KIA campaign, the entrepreneur also sets a fixed fundraising goal. However,
whatever the outcome at the end of the campaign, the entrepreneur can choose to keep all the money
pledged by backers, even if the goal is not reached. On Indiegogo, this type of campaign is called
“flexible funding”. There, the platform charges a 4% fee for successful campaigns (as in AON campaigns)
but a 9% fee in unsuccessful campaign if the entrepreneur chooses to call the pledged money. Thus,
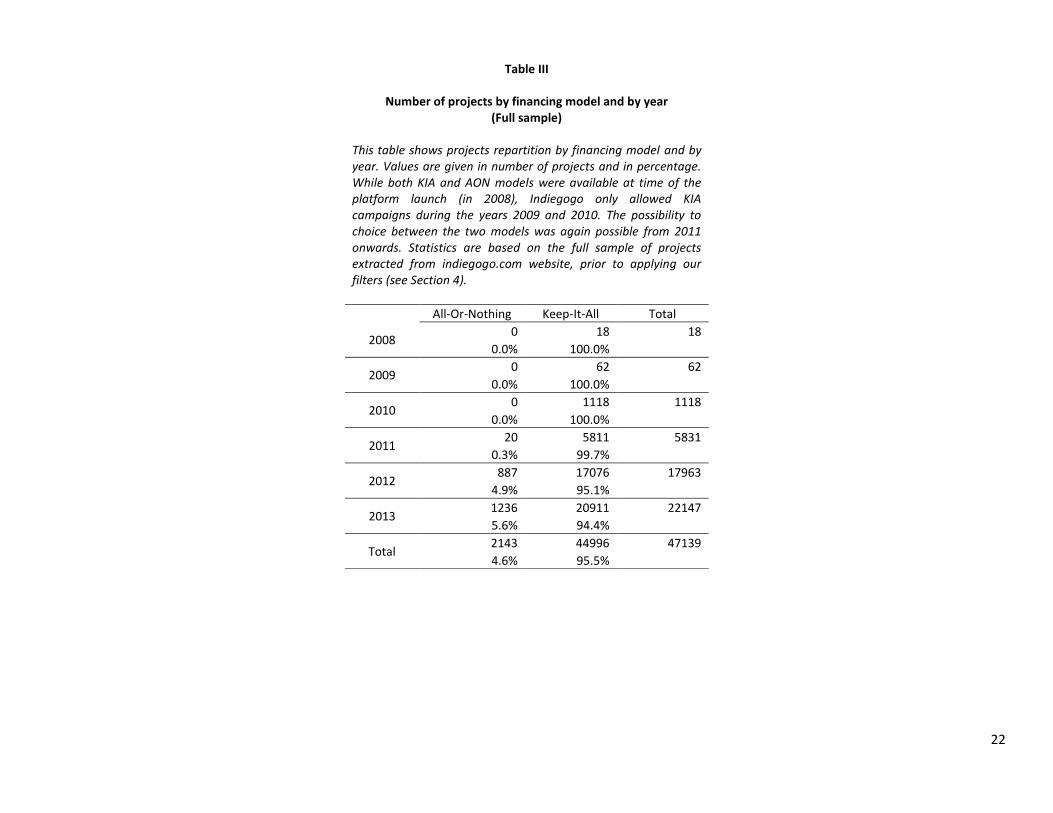
there is a cost for the entrepreneur to set the funding goal too high.4 While all the campaigns were
based on the KIA model in first years of the platform's existence, Indiegogo started offering to the
entrepreneur the option to choose between KIA and AON from December 2011 onwards. The AON
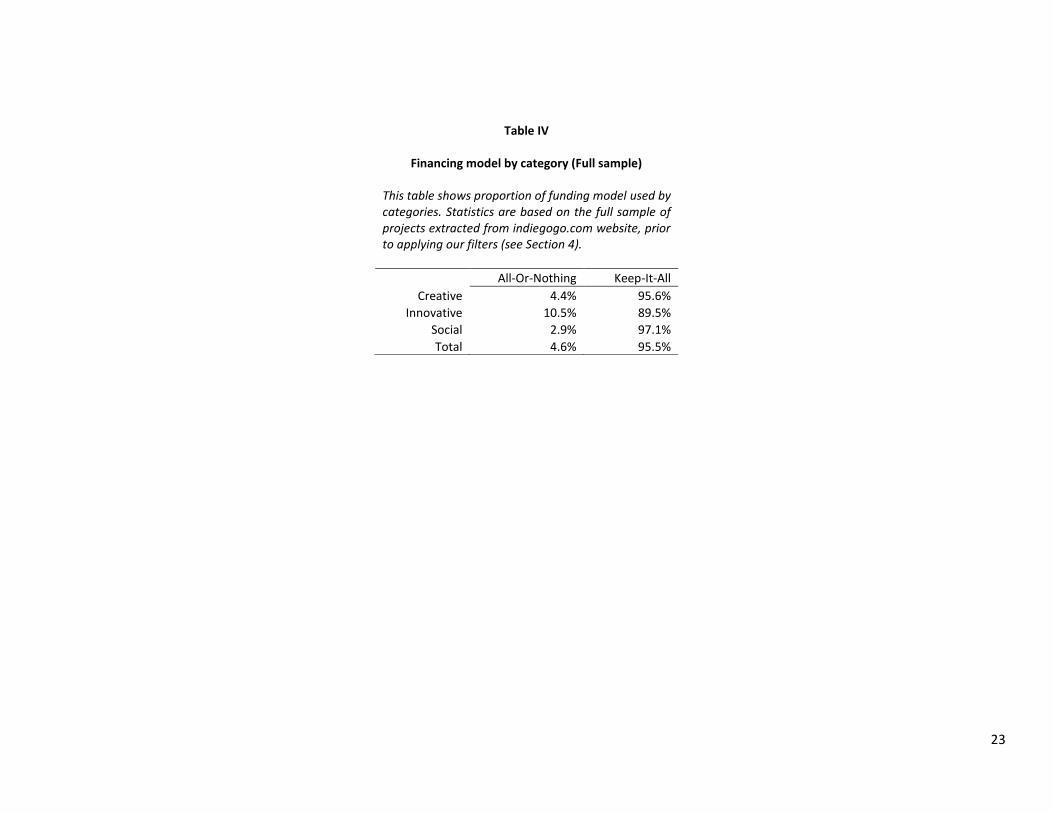
model is becoming increasingly popular and represents now more than 5% of new campaigns (Table III).
Especially innovative projects are more likely to choose the AON model (Table IV).
To sum up, two important decisions are taken by the entrepreneur when setting up his/her campaign:
the funding structure (AON versus KIA model) and the fundraising goal. These two variables are set
simultaneously at the beginning of the campaign and therefore potentially endogenous, as we discuss
and control for in our empirical analyses below.
[Tables III & IV About Here]
Each project also indicates a reward scale. The entrepreneur sets one or more pledge levels (based on
amount to pledge) for which he or she will offer different rewards to the backers. The amounts, steps
and number of levels are freely defined by the entrepreneur. Rewards offered can be as simple as a
“thank you” on the project page or as important as a key decision in the project development. Usually,
the main reward offered is the project's main product combined with some extras (dedication,
personalization, etc.). Moreover, some rewards can be available in limited quantity (limited editions of
the product, etc.). The entrepreneur also indicates a provisional date for the reward to be delivered.
These rewards offer no contractual obligation for the entrepreneur or guarantee for the backers, even in
case of project success.
Beside this hard information, Indiegogo also permits entrepreneur to provide soft information about his
or her project. Some items are needed for the index pages were projects are listed as standardized
“projects cards” (a small image, the campaign title and a short description of maximum 160 characters,
4 Next to these success fees, Indiegogo also charges for both models 3% third-party fees for credit card processing.
7
the category and the origin country and city). Others will only appear on the project main page: the full
project description with no limit in length or form (text, pictures, animations, charts, graphics…), an
optional video pitch introducing the project and the leading team, extra pictures gallery, links to external
websites or social networks pages and team description. Each team member also has a personal page
where he can introduce himself with pictures and text and where facts about his activity on Indiegogo
are listed. It shows links with other projects leaded, own backer activities in other projects, the referrals
(number of clicks on shared links from external social networks) and the number of comments he or she
made on an actual or on a past campaign.
Some of the information flow accrues only over time. While hard information is provided at the
beginning of any campaign, the entrepreneur can update the project page with soft information during
and after the campaign, notably by posting comments. However, visitors and backers are also allowed to
post comments or questions, which facilitates interaction with the entrepreneur. Complementary data
will also be provided all along the crowdfunding process by the platform and backers. The page will also
be automatically updated to provide information about enrolled backers with pledges made for the
different rewards offered, the campaign's remaining time and the overall progress towards the goal.
3. Hypotheses and Methodology
In this section, we develop several hypotheses on determinants affecting the structure (subsection 3.1)
and outcome (subsection 3.2) of crowdfunding campaigns.
3.1 Hypotheses on the setting of crowdfunding campaigns
Our first hypothesis pertains to project risk and choice of AON versus KIA model. We expect that
entrepreneurs involved in scalable projects are more likely to seek KIA funding since they are able to
produce output even when they obtain only partial funding. Examples of scalable projects include books
(one can generate a subset of the chapters, or a comic book without color), music albums with fewer
tracks than expected, video games with fewer levels and less options (less items, no digital voices, or less
sophisticated graphics), and non-profit ventures (charity, whereby ‘any amount is welcome’). Backers
contribute capital due to the utility associated with the funded project and associated reward
(Belleflamme et al., 2014). Projects based on material goods (like 3D-glasses, a health-monitoring watch,
a new restaurant, etc.) without scalable output are less likely to opt for a KIA campaigns. Indeed,
8
projects that are not scalable may face high risk of failure when pursued without enough funding. Such
projects face significant fixed costs, leading to high operational leverage and thus higher risk. The level
of risk is then magnified when undertaken without sufficient initial funding. As such, the KIA model is
relatively more attractive to backers that can still gain utility in a partially funded project. Likewise, KIA
models are more attractive if the backers are expected to lose a pronounced amount of utility or money
in the event that a project is not undertaken.
H1 (on Project Scalability): Scalable (and thus less risky) projects are more likely to opt for Keep-
it-All (KIA) crowdfunding campaigns.
Our second hypothesis is based on a quality signal effect. If an entrepreneur leads a project with a high
capital goal, he must attract more backers and/or try to convince each of them to pledge larger amounts.
To do this, the entrepreneur must give some guarantees to the backers. Based on the assumption that
incompletely funded projects are more risky than projects starting fully financed, setting an AON
campaign shows the potential backers that the project will start if and only if the funds are sufficient.
Such campaigns may then be considered as less risky for the backers, and hence may attract more
backers and/or with larger amounts.
H2 (on Funding Goal): Projects with high capital goals are more likely to opt for All-or-Nothing
(AON) crowdfunding campaigns.
3.2 Hypotheses on the outcome of crowdfunding campaigns
Recall that under the KIA model, the entrepreneurial firm sets a fundraising goal and are able to keep the
entire amount raised regardless of whether or not they meet their goal, while under the AON model, the
entrepreneurial firm sets a fundraising goal and keeps nothing unless the entire amount is raised. On
one hand, opting for an AON model can be a credible signal to the crowd that the entrepreneur commits
not to undertake the project if not enough is raised. This signal reduces the risk to the crowd, thereby
enabling the AON entrepreneurial firms to set higher goals, raise more money, and be more likely to
reach their stated goals. In contrast, KIA projects tend to be less successful, since the crowd bears the
risk that an entrepreneurial firm undertakes a project that is underfunded and hence more likely to fail.
On the other hand, we could envision a competing prediction relating the crowdfunding model to the
probability of success. For a high goal, for example, AON projects may be less likely to succeed raising
the required capital if there is a self-fulfilling prophecy insofar as the crowd perceives the probability of a
9
successful launch as being smaller. These competing ideas give rise to two alternative predictions as
follows.
H3A: All-or-Nothing (AON) campaigns are more likely to be successful than Keep-it-All (KIA)
campaigns, if AON projects are perceived by the crowd as a security for the project to start with
enough funds if undertaken.
H3B: All-or-Nothing (AON) campaigns are less likely to be successful, since they may be
perceived by the crowd as less likely to be eventually launched.
In testing these hypotheses, we control for other factors that can affect crowdfunding success, including
but not limited to the information provided by the entrepreneur and the level and structure of the
rewards. The level of information provided prior to the fundraising campaign may of course likewise
affect the probability of success. Where it is difficult or costly for the entrepreneur to provide
information that is more than mere cheap talk, campaigns that offer more information (such as having a
video and not merely a textual description of the project) are more likely to be successful.
The level of the rewards and the number of reward scales can further affect the probability of success.
We expect that campaigns with more reward scales are more likely to succeed, since it is more likely to
match preferences of the crowd due to the broader variation in the amount to invest. The size of the
first reward amount has an ambiguous effect on the outcome in that larger thresholds make
participation less likely, but each contribution is more important (since they are larger). Thus, the overall
effect is unclear.
4. Data and Summary Statistics
Our dataset was extracted directly from the Indiegogo website. Data were collected page by page in
October 2013. On Indiegogo, all finished projects stay visible on the website, regardless whether
successful or not, as long as the total amount pledged is at least 500 USD/EUR/CAD/AUD/GBP. Our full
sample consists of all the 47,139 finished campaigns that took place from the very beginning of
Indiegogo in 2008 until October 2013. Computer-automated data collection however led to a loss of less
than 5% of data due to missing or erroneous key values or inconsistency in data provided on the
Indiegogo website. There is no evidence that these missing data are linked to specific project
characteristics; therefore, it seems reasonable to assume that these missing projects are randomly
10
distributed and that our sample is a good representation of the full population of projects launched on
Indiegogo.
Since the database includes projects with five different currencies, we choose to convert all monetary
values (goal, pledge, rewards) in USD to make them comparable. The exchange rate is the yearly
average exchange rate (for campaigns lasting between 2 years, the ending date was retained). We
exclude observations from 2008 until November 2011, since the choice between AON and KIA model
was only introduced in December 2011 and thus our hypotheses cannot be tested on these campaigns.
This leads to an exclusion of 5,727 observations. Following previous empirical research on crowdfunding
(Mollick, 2014; Qiu, 2013), we exclude projects with a fundraising goal under $5,000 (after conversion of
all values into $). Such projects typically rely for their biggest parts on money from family, friends and
relatives, and thus cannot be compared with projects relying on backers (i.e., the crowd) outside the
close network of the entrepreneur. We also exclude projects with a goal higher than $200,000, which
corresponds to the 99th percentile of our distribution. Indeed, some projects have very large fundraising
goals (12 projects have a goal higher or equal to $10m). Consistent with the approach adopted by
Mollick (2014) for Kickstarter data, we consider these few observations as outliers that are distinct from
the traditional type of projects proposed on the platform. Our final sample is composed of 22,875
campaigns.
A full description of variables available in our dataset is provided in Appendix Table I. Variables are
classified in 3 types: project characteristics (subcategory, goal, duration, etc.), additional soft information
provided either at the beginning of the campaign (a link to a social network page or a video, etc.) or
during the campaign (updates or comments, etc.) and campaign output (number of backers or rewards
left, etc.).
The recorded project characteristics are mandatory information and all entrepreneurs set them once and
for all prior to campaign start. While some variables are intrinsic to the project itself (the
category/subcategory, the location), others are set freely by the entrepreneur (the goal, the funding
model, the number of rewards and the level of each reward (i.e. the amount a backer should give to
choose the defined reward), the duration, etc.). The additional “soft” information is a set of descriptive
information provided to inform the crowd about the project. It consists of text, pictures, video pitches,
additional comments and updates, as well as any other information that the entrepreneur discloses to
potential backers. As these pieces of information are mostly of qualitative nature, we decided to limit
ourselves to those that could be measured quantitatively. For instance, information such as number of
11
words/pictures/items and presence or not of some items allow us to observe the implication of the
entrepreneur in his project and its degree of preparedness as it is associated with success (Mollick,
2013).
Given that this information is intended to a wide audience reading, we also include a readability index as
control variable for evaluating crowd perception. Readability indexes are designed to gauge the
understandability of a written text. We use the Automated Readability Index (ARI) and the Coleman–
Liau Index (CLI). Both use the full text of project description, as described in Appendix Table 1. The ARI
offers an index expressed in US grade level. For instance, grade 1 indicates text for children of 6/7 years
old and grade 12 for high school students of 17/18 years old. In contrast, the CLI is based on the notion
that characters length of words is a better predictor of readability than syllables counts.
Finally, we consider campaign outputs based on observable information at the end of the campaign. It
consists in total amount pledged by backers, total number of backers and the completion ratio. These
output measures define the success of the campaign. Our primary measure of success is the completion
ratio, which corresponds to the ratio of total amount pledged over the goal set by the entrepreneur (our
variable Completion Ratio).
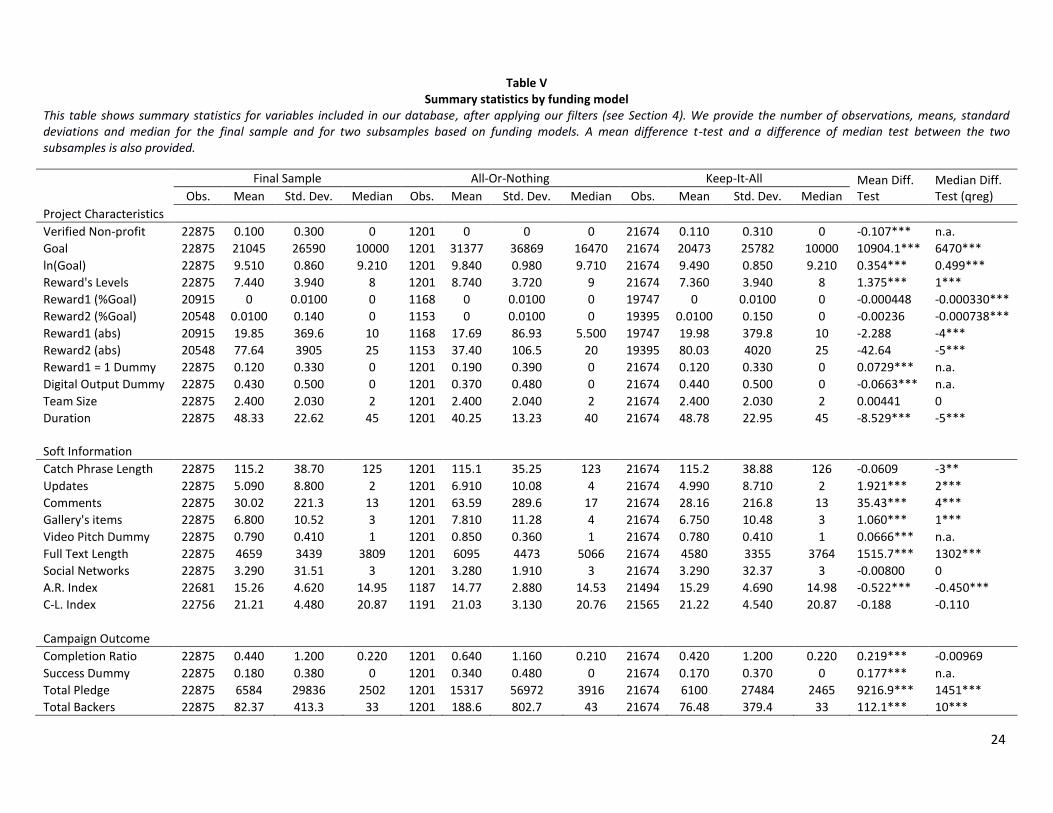
Table V presents summary statistics for our final sample and for the two subsamples All-Or-Nothing and
Keep-It-All. T-tests of difference of mean and median between both subsamples are provided in the last
two columns.
[Table V About Here]
In line with our expectations (see Hypothesis H1), flexible projects account for a larger part in the KIA
subsample: 44% of all the projects in the KIA subsample are projects with digital output, while such
projects only account for 37% of the projects in the AON subsample. Supporting Hypothesis H2, AON
projects show on average 53% higher capital goals than KIA (and a 65% higher median). Moreover, KIA
campaigns offer fewer reward levels. First reward level is on average 13% smaller for AON campaigns
and is equal to $1 in 19% of the cases while only 12% of the KIA campaigns have a first reward equal to
$1.
All verified not-for-profit organizations (the variable Verified Non-profit) use the KIA model, suggesting
that this form of fundraising constitutes a typical way non-profit organizations raise money on a regular
basis (under the motto "any money is welcome"). AON campaigns tend to have higher goals on average;
12
medians however are much closer to each other. With an average of 2 team members, team size is not
statistically different between the two subsamples.
As the risk of not collecting any funds is higher for an AON campaign, it seems that entrepreneurs
provide more information to increase their chances to attract more backers. Indeed, project
descriptions are longer (the variable Full Text Length) and easier to read, more pictures and video pitches
are provided and activity of the project pages is also higher (with more updates and more comments).
There is no difference in the numbers of external social networks pages available for both types of
project, suggesting that setting up a page on a social network requires little effort to generate extra
information. This can also be explained by the fact that social networks are a base constituent of
crowdfunding and thus considered by a majority of entrepreneurs as a must-do before even starting the
crowdfunding campaign itself.
Outcomes also differ between subsamples. AON campaigns seem to be more successful (54% versus
32% for KIA campaigns) and attract almost 3 times more backers, providing support for the hypothesis
H3A. This difference is success will be confirmed in the multivariate analysis provided in the next
section.
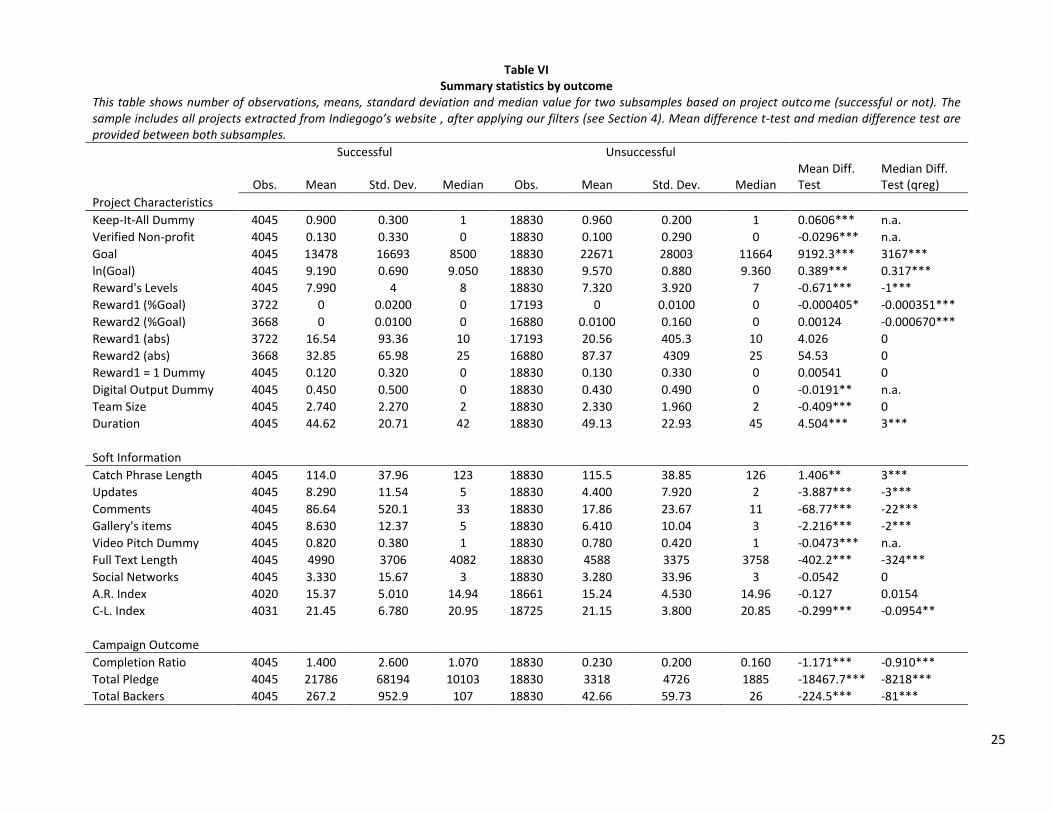
Table VI offers summary statistics based on outcome, i.e., whether the campaign was successful or not.
As expected, more information is provided in successful campaigns (longer text, more video pitch and
more pictures in galleries) and more activity observed during the campaign (more updates and more
comments) seem to lead to more success. Of course, successful projects imply, on average, more
backers and higher average pledges by backers. Here also, no difference in social network presence
between the two groups (presence does not mean popularity!). Readability of campaign description
does not seem to affect outcomes. The two groups have approximately the same typology of texts; at
best, unsuccessful projects are easier to read. It is worthwhile to note that the values obtained here are
quite high since they correspond to text designed for undergraduate level. ARI and CLI scores
correspond to the US scholar system level (12 for the last level before college, 14 for a second year
undergraduate, etc.). Here, an average level of 15 indicates text written (intentionally or not) at an
undergraduate level.
[Table VI About Here]
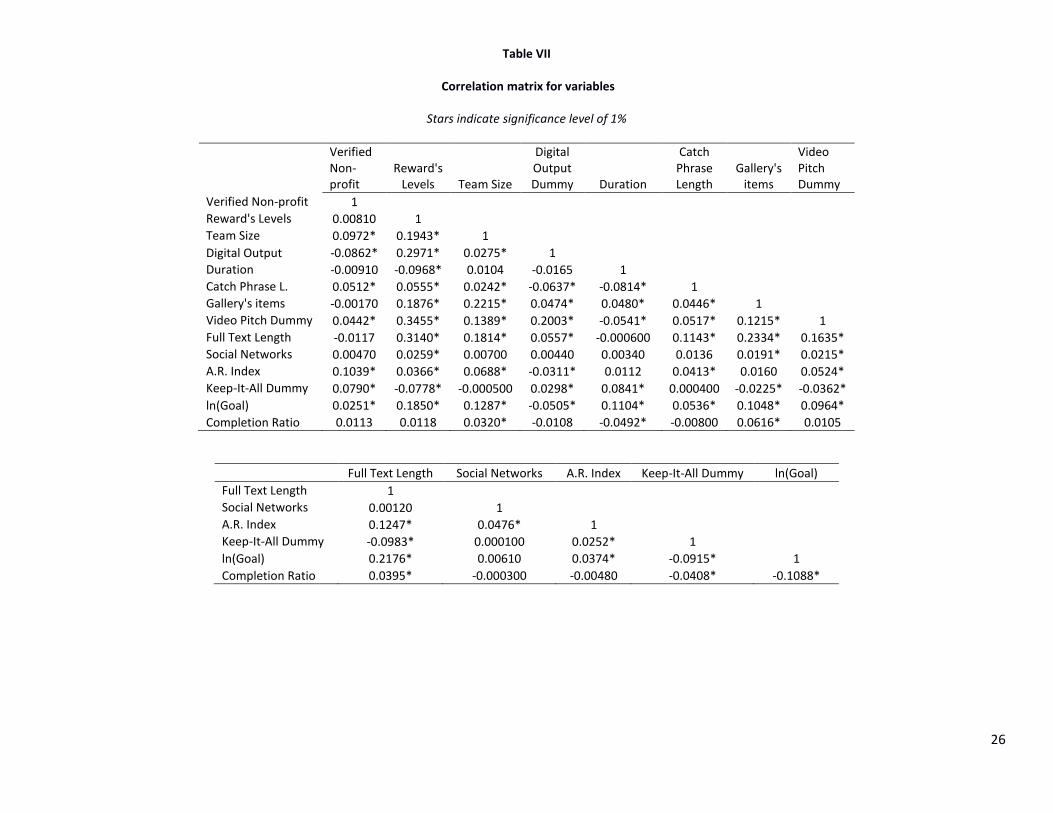
Table VII provides a comprehensive correlation matrix that includes the most relevant variables. In
particular, the reported correlations offer preliminary support for our hypotheses H1 on scalability and
13
H2 on funding goal. Indeed, the correlation between Digital Output Dummy (for scalable projects, as
defined in Appendix 1) and Keep-It-All Dummy (Hypothesis H1) is 0.0298 and statistically significant at 1%
level. Similarly, the correlation of ln(Goal) and Keep-It-All Dummy (Hypothesis 2) is -0.0915 and also
significant at 1% level. As for our hypotheses H3A/H3B, we find a correlation of -0.0408 between % of
Completion and Keep-It-All Dummy, which supports H3A. The next section tests and confirms these
findings in a multivariate setting.
[Table VII About Here]
5. Empirical results
5.1. Choice of AON versus KIA Crowdfunding Models
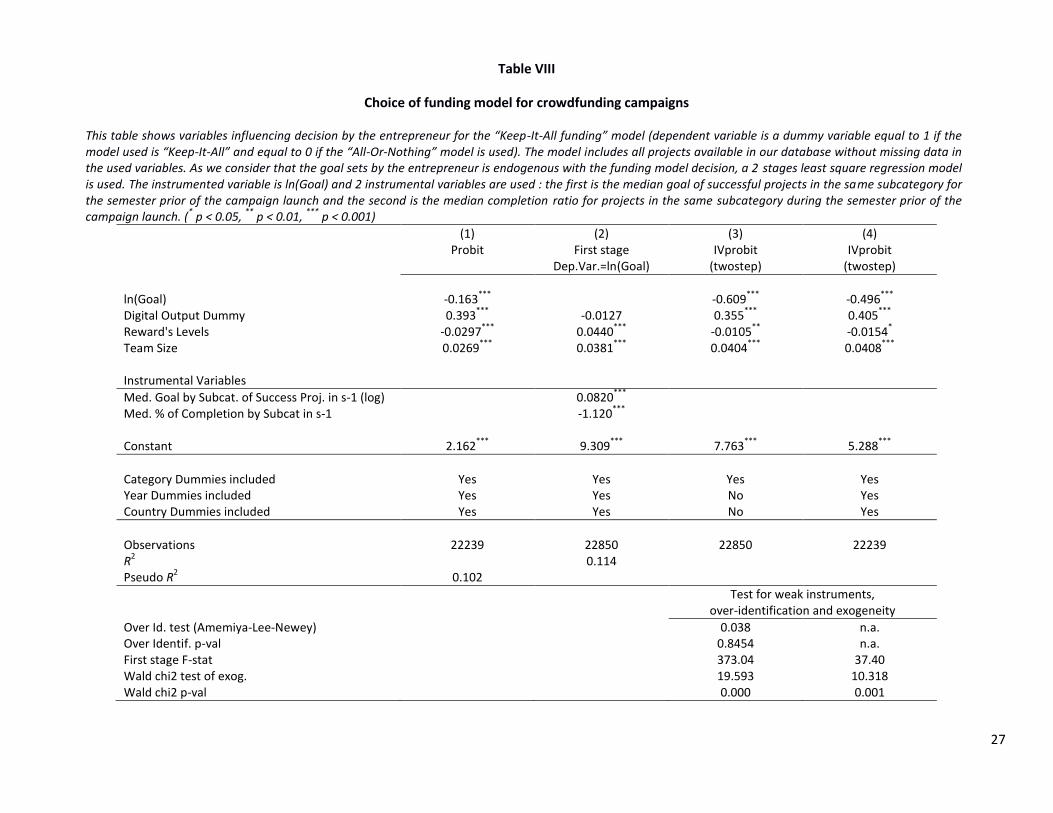
Table VIII addresses the issue of what drives entrepreneurs to opt for KIA, controlling for the
endogeneity of the goal amount. To test our hypotheses H1 and H2, we consider that the decision
between KIA and AON will depend on some characteristics intrinsic to the project that exist before the
campaign launch: the category of the project, the type of good financed (digital or not) and the amount
goal of the funding campaign. We also expect some other pre-existing variables to have an impact in this
choice: the number of different rewards that the entrepreneur is able to offer, the size of the team
leading the project and the profit purpose of the project. Moreover, our models control for fixed effect
due to the country of origin of the project and the year of campaign launch. Table VIII shows results of
our regressions under various specifications.
[Table VIII About Here]
The first method used is a probit regression with the keep-it-all dummy as the dependent variable. Our
variables of interest are the goal (the logarithm of goal) and the output type. The results are consistent
with H1 insofar as the coefficient on Reward’s Levels is negative and statistically significant at the 1%
level, whereby a 1-standard deviation increase in Reward’s Levels give rise to a 11.7% increase in the
probability of the use of KIA. Further, as expected (H2), the data indicate that the impact of ln(Goal) is
negative and statistically significant, such that a 1-standard deviation increase in ln(Goal) gives rise to a
14.0% increase in the probability of the use of AON. The digital output variable is positive and
statistically significant at the 1% level, indicating that such projects tend to prefer to use the KIA funding
model. Also, the data indicates that team size is positively associated with using KIA, such that a 1-
14
standard deviation increase in team size increases the probability of using KIA by 5.5%. One possible
reason could be that team size proxies for firm size and larger firms may be more able to start an
underfunded project.
Most likely, the goal of the campaign is set at the same time as the one for the funding model and is
linked. This causes a problem of endogeneity between our goal variable and the keep-it-all dummy as
these decisions are simultaneous. We chose to use a 2SLS regression to solve this problem. The first-
stage regression in Model (2) used to estimate the goal is based on two instrumental variables (IVs) that
are linked to the goal of the project but are independent of the decision of the funding model. The first
IV is the median goal of successful projects in the same subcategory in the semester prior of the
campaign launch and the second is the median completion ratio for project within the same subcategory
for the semester prior the campaign launch. In alternative Models (3) and (4) in Table VIII, we then use
the estimated goal based on this first regression in our model for the second regression. The results
observed confirm what we saw in the first probit specification in terms of the statistical significance, and
shows similar economic significance.
In addition to these regressions, we made some tests to address concerns about the validity of our 2SLS
methodology. The first test of endogeneity follows the specification of Durbin-Wu-Haussmann testing
the difference between OLS and IV estimates. The null hypothesis tests if the regressor of interest
(variable ln(Goal)) is exogenous. As the null hypothesis is rejected in our tests, the variable ln(Goal) is
indeed endogenous and thus OLS estimates are inconsistent. The 2SLS estimates are therefore
appropriate. The second test checks if the instruments are not weakly correlated with our endogenous
variable. Based on F-stat values of our first stage we can assume that our instruments are not weak. We
can compare the values with the minimal recommended value of 11.59 for two IVs in Stock et al. (2002).
The third test computes the Amemiya-Lee-Newey score test of overidentifying restrictions. This test
performs for overidentification (exogeneity of IVs) following the procedure described by Lee (1992). Our
results show that the null hypothesis cannot be rejected and thus our instruments are valid.
5.2. Outcome of Crowdfunding Campaigns
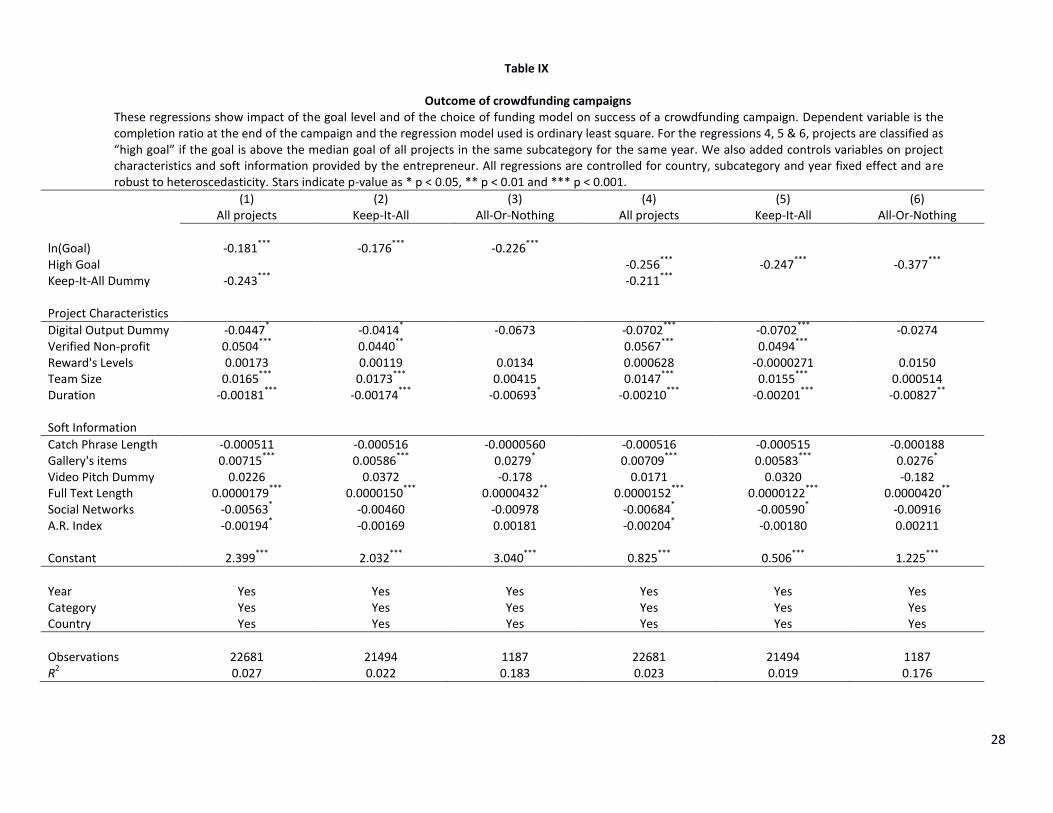
Tables IX-XIV examine factors that affect the outcome of crowdfunding campaigns in terms of the
completion ratio at the end of the campaign. The data are strongly consistent with H3A in that AON
campaigns are significantly more successful (24.3% more successful controlling for other things being
15
equal in Model 1 and 21.1% more successful in Model 4), and this effect is statistically significant at the
1% level. Also, this effect is robust to including the KIA dummy variable versus the fitted value of this
variable from the regressions in Table VIII. Below in the subsequent tables we explore the robustness of
this result to alternative model specifications and subsamples of the data.
[Table IX About Here]
The data presented in Table IX indicate a number of other interesting findings. First, ln(Goal) is negative
and significant at the 1% level, such that a 1-standard deviation increase in the Goal amount is
associated with a 35.4% reduction in the completion ratio (based on Model 1). Regarding the variables
for additional project characteristics, digital output projects (that proxies for scalability of the project)
are approximately 4.5%-7.0% less often completed, while Verified Non-profits are typically 4.9%-5.7%
more often completed (Model 1 versus Models 4 and 5). A 1-standard deviation increase in team size
gives rise to a 7.6% increase in the completion ratio for the sample of all projects in Model 1 and a 7.5%-
8.4% increase in the completion ratio for the subsample of KIA projects in Models 2 and 5, respectively,
but this effect is not significant for the subsample of AON projects in Models 3 and 6. Duration is
negatively and significantly associated with success in all models. A 1-standard deviation increase in
duration gives rise to a 22.7% reduction in duration for the full sample (Model 1). A 9.5% reduction in
the subsample of KIA projects (Model 2), and a 14.3% reduction in the subsample of AON projects
(Model 3). This results remain quite similar for these variables when substituting the variable ln(Goal)
with the dummy High Goal.
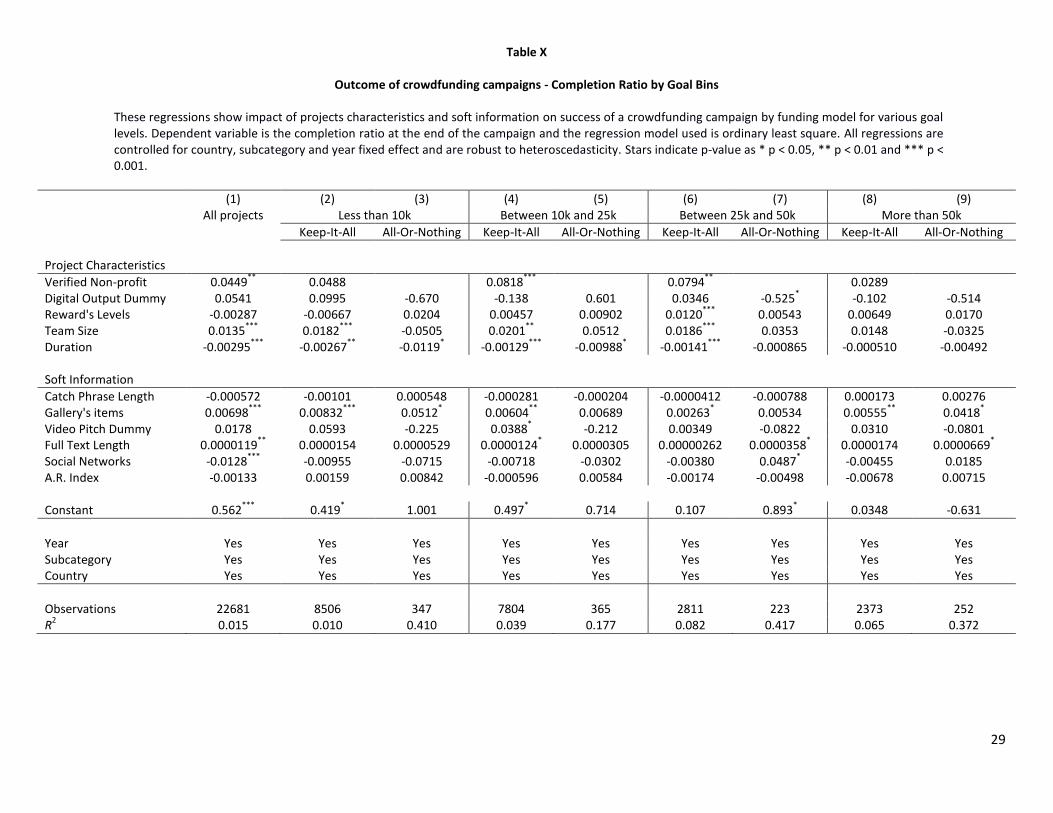
To show further insights and test for robustness, we next perform the analysis on subsamples based on
Goals. Results are shown in Table X for the following subgroups separately: projects with goals less than
$10,000, projects with goals between $10,000 and $25,000, projects with goals between $25,000 and
$50,000 and projects with goals above $50,000. Given the average size of crowdfunding campaigns done
on Indiegogo, most observations are in the first two subgroups. We find that most of the variables that
were significant in Table IX continue to be significant in Table X in the different groups matched by size,
except the last subgroup which is most likely due to the smaller sample size.
[Table X About Here]
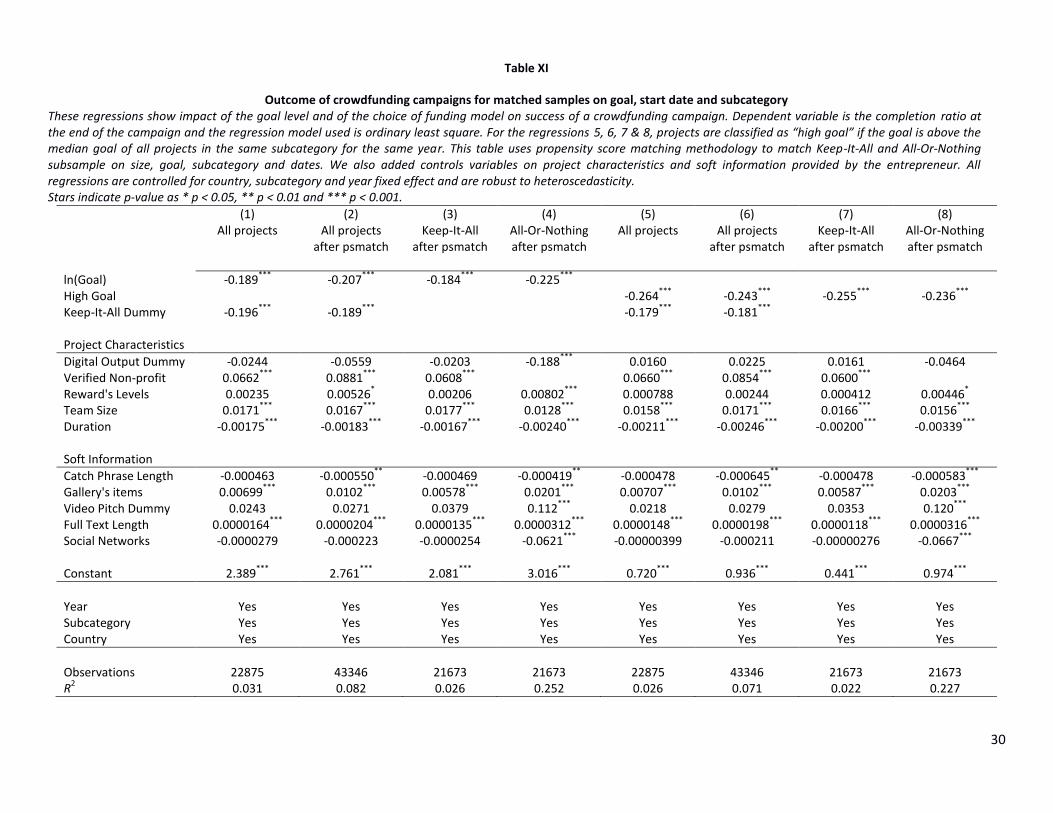
According to Table V, there is on average a significant difference in project size between KIA and AON.
Using a propensity score matching methodology (Rosenbaum and Rubin, 1983), we are able to weight
projects in the AON subsample to match more closely the average size of projects between both
16
subsamples. This methodology links all the KIA projects one by one with the closest AON project (we
matched projects on goal; category and campaign start date). In the process, since there are more KIA
projects, all AON projects must have at least one KIA equivalent, but can be matched with more than one
KIA projects. At the end of the matching process, we found a number of observations equivalent in both
subsample (with duplicated AON projects that matched more than once a KIA project).
[Table XI About Here]
After running the same regression models presented in Table IX on the new matched samples, we are
able to confirm our results. These findings are reported in Table XI. Both, the choice for KIA and the
goal, negatively impact the probability of success. These results reinforce our findings in line with
Hypothesis H3A. Moreover, coefficients for soft information variables indicate that the crowd pays more
attention to soft information for AON than for KIA. They have a larger impact on funding and are more
significant: for instance, “gallery’s items” has a coefficient for AON more than 3 times larger than for KIA;
the effect is the same for video-pitches (which is not significant for KIA) and full text length.
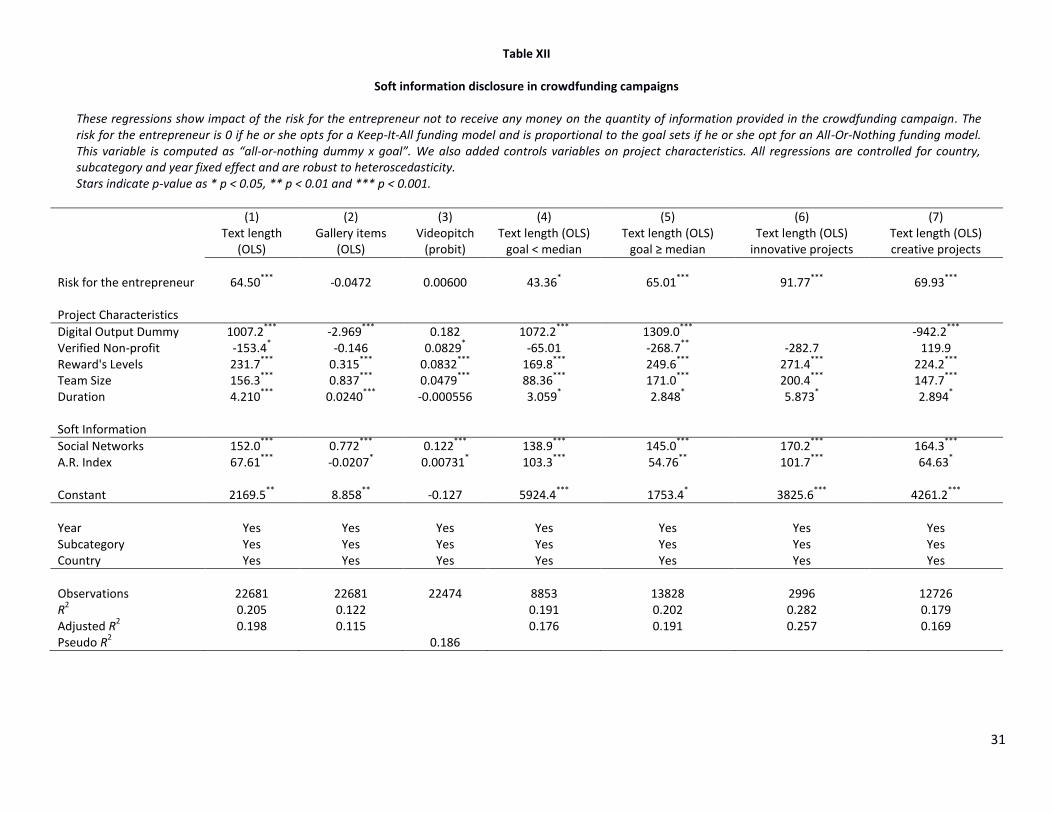
[Table XII About Here]
In Table XII, we examine the impact of risk taken by the entrepreneur on the amount of soft information
provided. We consider that the entrepreneur incurs higher risk of not getting any funding in the AON
model, and that this risk is proportional to the goal: the higher the goal, the higher the risk of not
receiving any funding (thus, the variable Risk for the Entrepreneur, which corresponds to the interaction
between AON and Goal). From Table XII, we can observe that entrepreneurial risk increases the amount
of soft information provided to the crowd: text length becomes longer. In subsamples based on project
size, we see that the effect is more important for projects with high goal (which seems intuitive, since
these projects tend to be less successful) and that the effect is even larger for innovative projects.
6. Concluding remarks
Thanks to the emergence of Internet platforms, crowdfunding has become accessible to a large number
of entrepreneurs as alternative form of funding. While the standardization in crowdfunding platforms
offers clear benefits in terms of comparability across projects and readability, it also reduces the extent
to which entrepreneurs can tailor their offer according to their specific needs. One important dimension
of standardization has been the adoption of AON and KIA models by the major reward-based platforms.
17
The choice of model clearly affects fee structure paid by the entrepreneurs (since the platforms charge
different fees) and how pledges are transformed into funding for the entrepreneur.
In this paper we compared the AON versus the KIA models in terms of the types of companies that used
these methods of raising capital, their disclosures, and their success. An analysis of the Indiegogo
platform offers a unique opportunity to examine the choice between the two forms of crowdfunding
models, as the platform offers entrepreneurs the option to choose the models along with the fundraising
goal of their project. Our findings offer support to the prediction that AON models offer a guarantee to
the crowd that the entrepreneur does not start a project with unrealistically low funding. In contrast,
the KIA model is a useful model for entrepreneurs that can scale their business. So that it is relatively
more attractive to backers that can still gain utility in a partially funded project, and are expected to lose
a pronounced amount of utility in the event that a project is stopped. Overall, AON fundraising
campaigns involved substantially larger capital goals, and were much more likely to be successful at
achieving their goals. Further, we showed that the marginal effects associated with information related
by AON fundraisers were much more pronounced than that for KIA fundraisers. These findings are
robust to controls for self-selection and endogeneity, and robust to propensity score matching.
Our study offers avenues for future research. One could be to determine success chances of projects
themselves, beyond the campaign success. Our analysis examined success during the fundraising
campaign but is silent about what happens afterwards. For instance, Mollick (2013) reports that 75% of
projects successfully funded on Kickstarter deliver late. However, based on conclusions offered in our
study, one might expect that this percentage varies according to the fundraising model (KIA versus AON)
used during the campaign, since the latter is related to the amount raised. Indeed, projects that are
started with sufficient funds are more likely to produce the promised product and eventually deliver on
time, something that is worthwhile investigating in future research.
Another worthwhile research question is whether certain models are more prone to fraud. Indeed,
concerns have recently been raised by regulators and academics (Griffin, 2012; Hildebrand, Puri and
Rocholl, 2013; Hornuf and Schwienbacher, 2014) that crowdfunding simply shifts risk to the crowd and
that some entrepreneurs may exploit an unsophisticated crowd. In the context studied here, one can
extend the analysis by seeing whether projects funded with a KIA model are more prone to lead to fraud
in the event of underfunding.
18
References
Agrawal, A., Catalini, C., and Goldfarb, A. (2011): The Geography of Crowdfunding, Working Paper,
University of Toronto.
Ahlers, G.K.C., Cumming, D.J., Günther, C., and Schweizer, D. (2013): Equity Crowdfunding, Working
Paper, York University and WHU.
Belleflamme, P., Lambert, T., and Schwienbacher, A. (2013): Individual Crowdfunding Practices, Venture
Capital: An International Journal of Entrepreneurial Finance 15 (4), 313-333.
Belleflamme, P., Lambert, T., and Schwienbacher, A. (2014): Crowdfunding: Tapping the Right Crowd,
Journal of Business Venturing, Forthcoming.
Burtch, G., Ghose, A., and Wattal, S. (2014): An Empirical Examination of the Antecedents and
Consequences of Contribution Patterns in Crowd-Funded Markets, Information Systems
Research, Forthcoming.
Colombo, M.G., Franzoni, C., Rossi-Lamastra, C. (2014): Internal Social Capital and the Attraction of Early
Contributions in Crowdfunding Projects, Entrepreneurship Theory and Practice, forthcoming.
Cosh, A., Cumming, D.J., and Hughes, A. (2009): Outside Entrepreneurial Capital, Economic Journal 119,
1494-1533.
Cumming, D.J., and Johan, S.A. (2013): Demand Driven Securities Regulation: Evidence from
Crowdfunding, Venture Capital: An International Journal of Entrepreneurial Finance 15, 361-379.
Griffin, Z.J. (2012): Crowdfunding: Fleecing the American Masses, Working paper, Available at:
http://ssrn.com/abstract=2030001.
Hildebrand, T., Puri, M. and Rocholl, J. (2013): Adverse Incentives in Crowdfunding, Working paper,
Available at: http://ssrn.com/abstract=1615483.
Hornuf, L. and Schwienbacher, A. (2014): Which Securities Regulation Promotes Crowdinvesting?,
Working paper, Available at: http://ssrn.com/abstract=2412124.
Lee, L-F. (1992): Amemiya's Generalized Least Squares and Tests of Overidenfication in Simultaneous
Equation Models with Qualitative or Limited Dependent Variables, Econometric Reviews 11 (3),
319-328.
19
Lehner, O.M. (2014): Crowdfunding Social Ventures: A Model and Research Agenda, Venture Capital: An
International Journal of Entrepreneurial Finance 15, 289-311.
Mollick, E.R. (2014): The Dynamics of Crowdfunding: Determinants of Success and Failure, Journal of
Business Venturing 29, 1-16.
Mollick, E.R. (2014): Swept Away by the Crowd? Crowdfunding, Venture Capital, and the Selection of
Entrepreneurs, Working Paper, Wharton, University of Pennsylvania.
Mollick, E.R., and Kuppuswamy, V. (2014): After the Campaign: Outcomes of Crowdfunding, Working
Paper, Wharton, University of Pennsylvania.
Nahata, R. (2008): Venture Capital Reputation and Investment Performance, Journal of Financial
Economics 90, 127-151.
Rosenbaum, P. and Rubin, D.B. (1983): The Central Role of the Propensity Score in Observational Studies
for Causal Effects, Biometrika 70 (1), 4155.
Schwienbacher, A. (2007): A Theoretical Analysis of Optimal Financing Strategies for Different Types of
Capital-Constrained Entrepreneurs, Journal of Business Venturing 22, 753-781.
Schwienbacher, A., and B. Larralde (2012): Crowdfunding of Small Entrepreneurial Ventures, The Oxford
Handbook of Entrepreneurial Finance: Oxford University Press (Ed. D. Cumming).
Spence, M. (2002): Signaling in Retrospect and the Informational Structure of Markets, American
Economic Review 92, 434-459.
Stuart, T.E., Hoang, H., and Hybels R. (1999): Interorganizational Endorsements and the Performance of
Entrepreneurial Ventures, Administrative Science Quarterly 44, 315-349.
Tomczak, A., and Brem, A. (2013): A Conceptualized Investment Model of Crowdfunding, Venture
Capital: An International Journal of Entrepreneurial Finance 15, 335-359.
20
Table I
Projects categories
This table shows how Indiegogo sorts projects in categories and subcategories.
Creative Innovative Social
Art Small Business Animals Dance Technology Community Film Sports Education
Gaming Food Environment Music Health
Photography Politics Theater Religion
Transmedia Writing
Comic Design Fashion
Video/Web
21
Table II
Number of projects by category and by year (Full sample)
This table shows projects repartition in each main category year by year. Values are given in number of projects and in percentage of total projects. Statistics are based on the full sample of projects extracted from indiegogo.com website, prior to applying our filters (see Section 4).
Creative Innovative Social Total
2008 17 0 1 18
94.4% 0.0% 5.6%
2009 61 0 1 62
98.4% 0.0% 1.6%
2010 968 30 120 1118
86.6% 2.7% 10.7%
2011 4557 281 993 5831
78.2% 4.8% 17.0%
2012 10488 1682 5793 17963
58.4% 9.4% 32.3%
2013 12682 2566 6899 22147
57.3% 11.6% 31.2%
Total 28773 4559 13807 47139
61.0% 9.7% 29.3%
22
Table III
Number of projects by financing model and by year (Full sample)
This table shows projects repartition by financing model and by year. Values are given in number of projects and in percentage. While both KIA and AON models were available at time of the platform launch (in 2008), Indiegogo only allowed KIA campaigns during the years 2009 and 2010. The possibility to choice between the two models was again possible from 2011 onwards. Statistics are based on the full sample of projects extracted from indiegogo.com website, prior to applying our filters (see Section 4).
All-Or-Nothing Keep-It-All Total
2008 0 18 18
0.0% 100.0%
2009 0 62 62
0.0% 100.0%
2010 0 1118 1118
0.0% 100.0%
2011 20 5811 5831
0.3% 99.7%
2012 887 17076 17963
4.9% 95.1%
2013 1236 20911 22147
5.6% 94.4%
Total 2143 44996 47139
4.6% 95.5%
23
Table IV
Financing model by category (Full sample) This table shows proportion of funding model used by categories. Statistics are based on the full sample of projects extracted from indiegogo.com website, prior to applying our filters (see Section 4).
All-Or-Nothing Keep-It-All
Creative 4.4% 95.6%
Innovative 10.5% 89.5%
Social 2.9% 97.1%
Total 4.6% 95.5%
24
Table V Summary statistics by funding model
This table shows summary statistics for variables included in our database, after applying our filters (see Section 4). We provide the number of observations, means, standard deviations and median for the final sample and for two subsamples based on funding models. A mean difference t-test and a difference of median test between the two subsamples is also provided.
Final Sample All-Or-Nothing Keep-It-All Mean Diff.
Test Median Diff. Test (qreg)
Obs. Mean Std. Dev. Median Obs. Mean Std. Dev. Median Obs. Mean Std. Dev. Median
Project Characteristics
Verified Non-profit 22875 0.100 0.300 0 1201 0 0 0 21674 0.110 0.310 0 -0.107*** n.a.
Goal 22875 21045 26590 10000 1201 31377 36869 16470 21674 20473 25782 10000 10904.1*** 6470***
ln(Goal) 22875 9.510 0.860 9.210 1201 9.840 0.980 9.710 21674 9.490 0.850 9.210 0.354*** 0.499***
Reward's Levels 22875 7.440 3.940 8 1201 8.740 3.720 9 21674 7.360 3.940 8 1.375*** 1***
Reward1 (%Goal) 20915 0 0.0100 0 1168 0 0.0100 0 19747 0 0.0100 0 -0.000448 -0.000330***
Reward2 (%Goal) 20548 0.0100 0.140 0 1153 0 0.0100 0 19395 0.0100 0.150 0 -0.00236 -0.000738***
Reward1 (abs) 20915 19.85 369.6 10 1168 17.69 86.93 5.500 19747 19.98 379.8 10 -2.288 -4***
Reward2 (abs) 20548 77.64 3905 25 1153 37.40 106.5 20 19395 80.03 4020 25 -42.64 -5***
Reward1 = 1 Dummy 22875 0.120 0.330 0 1201 0.190 0.390 0 21674 0.120 0.330 0 0.0729*** n.a.
Digital Output Dummy 22875 0.430 0.500 0 1201 0.370 0.480 0 21674 0.440 0.500 0 -0.0663*** n.a.
Team Size 22875 2.400 2.030 2 1201 2.400 2.040 2 21674 2.400 2.030 2 0.00441 0
Duration 22875 48.33 22.62 45 1201 40.25 13.23 40 21674 48.78 22.95 45 -8.529*** -5***
Soft Information
Catch Phrase Length 22875 115.2 38.70 125 1201 115.1 35.25 123 21674 115.2 38.88 126 -0.0609 -3**
Updates 22875 5.090 8.800 2 1201 6.910 10.08 4 21674 4.990 8.710 2 1.921*** 2***
Comments 22875 30.02 221.3 13 1201 63.59 289.6 17 21674 28.16 216.8 13 35.43*** 4***
Gallery's items 22875 6.800 10.52 3 1201 7.810 11.28 4 21674 6.750 10.48 3 1.060*** 1***
Video Pitch Dummy 22875 0.790 0.410 1 1201 0.850 0.360 1 21674 0.780 0.410 1 0.0666*** n.a.
Full Text Length 22875 4659 3439 3809 1201 6095 4473 5066 21674 4580 3355 3764 1515.7*** 1302***
Social Networks 22875 3.290 31.51 3 1201 3.280 1.910 3 21674 3.290 32.37 3 -0.00800 0
A.R. Index 22681 15.26 4.620 14.95 1187 14.77 2.880 14.53 21494 15.29 4.690 14.98 -0.522*** -0.450***
C-L. Index 22756 21.21 4.480 20.87 1191 21.03 3.130 20.76 21565 21.22 4.540 20.87 -0.188 -0.110
Campaign Outcome
Completion Ratio 22875 0.440 1.200 0.220 1201 0.640 1.160 0.210 21674 0.420 1.200 0.220 0.219*** -0.00969
Success Dummy 22875 0.180 0.380 0 1201 0.340 0.480 0 21674 0.170 0.370 0 0.177*** n.a.
Total Pledge 22875 6584 29836 2502 1201 15317 56972 3916 21674 6100 27484 2465 9216.9*** 1451***
Total Backers 22875 82.37 413.3 33 1201 188.6 802.7 43 21674 76.48 379.4 33 112.1*** 10***
25
Table VI Summary statistics by outcome
This table shows number of observations, means, standard deviation and median value for two subsamples based on project outcome (successful or not). The sample includes all projects extracted from Indiegogo’s website , after applying our filters (see Section 4). Mean difference t-test and median difference test are provided between both subsamples.
Successful Unsuccessful
Obs. Mean Std. Dev. Median Obs. Mean Std. Dev. Median
Mean Diff. Test
Median Diff. Test (qreg)
Project Characteristics
Keep-It-All Dummy 4045 0.900 0.300 1 18830 0.960 0.200 1 0.0606*** n.a.
Verified Non-profit 4045 0.130 0.330 0 18830 0.100 0.290 0 -0.0296*** n.a.
Goal 4045 13478 16693 8500 18830 22671 28003 11664 9192.3*** 3167***
ln(Goal) 4045 9.190 0.690 9.050 18830 9.570 0.880 9.360 0.389*** 0.317***
Reward's Levels 4045 7.990 4 8 18830 7.320 3.920 7 -0.671*** -1***
Reward1 (%Goal) 3722 0 0.0200 0 17193 0 0.0100 0 -0.000405* -0.000351***
Reward2 (%Goal) 3668 0 0.0100 0 16880 0.0100 0.160 0 0.00124 -0.000670***
Reward1 (abs) 3722 16.54 93.36 10 17193 20.56 405.3 10 4.026 0
Reward2 (abs) 3668 32.85 65.98 25 16880 87.37 4309 25 54.53 0
Reward1 = 1 Dummy 4045 0.120 0.320 0 18830 0.130 0.330 0 0.00541 0
Digital Output Dummy 4045 0.450 0.500 0 18830 0.430 0.490 0 -0.0191** n.a.
Team Size 4045 2.740 2.270 2 18830 2.330 1.960 2 -0.409*** 0
Duration 4045 44.62 20.71 42 18830 49.13 22.93 45 4.504*** 3***
Soft Information
Catch Phrase Length 4045 114.0 37.96 123 18830 115.5 38.85 126 1.406** 3***
Updates 4045 8.290 11.54 5 18830 4.400 7.920 2 -3.887*** -3***
Comments 4045 86.64 520.1 33 18830 17.86 23.67 11 -68.77*** -22***
Gallery's items 4045 8.630 12.37 5 18830 6.410 10.04 3 -2.216*** -2***
Video Pitch Dummy 4045 0.820 0.380 1 18830 0.780 0.420 1 -0.0473*** n.a.
Full Text Length 4045 4990 3706 4082 18830 4588 3375 3758 -402.2*** -324***
Social Networks 4045 3.330 15.67 3 18830 3.280 33.96 3 -0.0542 0
A.R. Index 4020 15.37 5.010 14.94 18661 15.24 4.530 14.96 -0.127 0.0154
C-L. Index 4031 21.45 6.780 20.95 18725 21.15 3.800 20.85 -0.299*** -0.0954**
Campaign Outcome
Completion Ratio 4045 1.400 2.600 1.070 18830 0.230 0.200 0.160 -1.171*** -0.910***
Total Pledge 4045 21786 68194 10103 18830 3318 4726 1885 -18467.7*** -8218***
Total Backers 4045 267.2 952.9 107 18830 42.66 59.73 26 -224.5*** -81***
26
Table VII
Correlation matrix for variables
Stars indicate significance level of 1%
Verified Non-profit
Reward's Levels Team Size
Digital Output Dummy Duration
Catch Phrase Length
Gallery's items
Video Pitch Dummy
Verified Non-profit 1 Reward's Levels 0.00810 1
Team Size 0.0972* 0.1943* 1 Digital Output -0.0862* 0.2971* 0.0275* 1
Duration -0.00910 -0.0968* 0.0104 -0.0165 1 Catch Phrase L. 0.0512* 0.0555* 0.0242* -0.0637* -0.0814* 1
Gallery's items -0.00170 0.1876* 0.2215* 0.0474* 0.0480* 0.0446* 1 Video Pitch Dummy 0.0442* 0.3455* 0.1389* 0.2003* -0.0541* 0.0517* 0.1215* 1
Full Text Length -0.0117 0.3140* 0.1814* 0.0557* -0.000600 0.1143* 0.2334* 0.1635*
Social Networks 0.00470 0.0259* 0.00700 0.00440 0.00340 0.0136 0.0191* 0.0215*
A.R. Index 0.1039* 0.0366* 0.0688* -0.0311* 0.0112 0.0413* 0.0160 0.0524*
Keep-It-All Dummy 0.0790* -0.0778* -0.000500 0.0298* 0.0841* 0.000400 -0.0225* -0.0362*
ln(Goal) 0.0251* 0.1850* 0.1287* -0.0505* 0.1104* 0.0536* 0.1048* 0.0964*
Completion Ratio 0.0113 0.0118 0.0320* -0.0108 -0.0492* -0.00800 0.0616* 0.0105
Full Text Length Social Networks A.R. Index Keep-It-All Dummy ln(Goal)
Full Text Length 1 Social Networks 0.00120 1
A.R. Index 0.1247* 0.0476* 1 Keep-It-All Dummy -0.0983* 0.000100 0.0252* 1
ln(Goal) 0.2176* 0.00610 0.0374* -0.0915* 1
Completion Ratio 0.0395* -0.000300 -0.00480 -0.0408* -0.1088*
27
Table VIII
Choice of funding model for crowdfunding campaigns
This table shows variables influencing decision by the entrepreneur for the “Keep-It-All funding” model (dependent variable is a dummy variable equal to 1 if the model used is “Keep-It-All” and equal to 0 if the “All-Or-Nothing” model is used). The model includes all projects available in our database without missing data in the used variables. As we consider that the goal sets by the entrepreneur is endogenous with the funding model decision, a 2 stages least square regression model is used. The instrumented variable is ln(Goal) and 2 instrumental variables are used : the first is the median goal of successful projects in the same subcategory for the semester prior of the campaign launch and the second is the median completion ratio for projects in the same subcategory during the semester prior of the campaign launch. (
* p < 0.05,
** p < 0.01,
*** p < 0.001)
(1) (2) (3) (4) Probit First stage
Dep.Var.=ln(Goal) IVprobit
(twostep) IVprobit
(twostep)
ln(Goal) -0.163
*** -0.609
*** -0.496
***
Digital Output Dummy 0.393***
-0.0127 0.355***
0.405***
Reward's Levels -0.0297
*** 0.0440
*** -0.0105
** -0.0154
*
Team Size 0.0269***
0.0381***
0.0404***
0.0408***
Instrumental Variables
Med. Goal by Subcat. of Success Proj. in s-1 (log) 0.0820***
Med. % of Completion by Subcat in s-1 -1.120
***
Constant 2.162
*** 9.309
*** 7.763
*** 5.288
***
Category Dummies included Yes Yes Yes Yes Year Dummies included Yes Yes No Yes Country Dummies included Yes Yes No Yes
Observations 22239 22850 22850 22239 R
2 0.114
Pseudo R2 0.102
Test for weak instruments, over-identification and exogeneity
Over Id. test (Amemiya-Lee-Newey) 0.038 n.a. Over Identif. p-val 0.8454 n.a. First stage F-stat 373.04 37.40 Wald chi2 test of exog. 19.593 10.318 Wald chi2 p-val 0.000 0.001
28
Table IX
Outcome of crowdfunding campaigns These regressions show impact of the goal level and of the choice of funding model on success of a crowdfunding campaign. Dependent variable is the completion ratio at the end of the campaign and the regression model used is ordinary least square. For the regressions 4, 5 & 6, projects are classified as “high goal” if the goal is above the median goal of all projects in the same subcategory for the same year. We also added controls variables on project characteristics and soft information provided by the entrepreneur. All regressions are controlled for country, subcategory and year fixed effect and are robust to heteroscedasticity. Stars indicate p-value as * p < 0.05, ** p < 0.01 and *** p < 0.001.
(1) All projects
(2) Keep-It-All
(3) All-Or-Nothing
(4) All projects
(5) Keep-It-All
(6) All-Or-Nothing
ln(Goal) -0.181
*** -0.176
*** -0.226
***
High Goal -0.256***
-0.247***
-0.377***
Keep-It-All Dummy -0.243
*** -0.211
***
Project Characteristics
Digital Output Dummy -0.0447* -0.0414
* -0.0673 -0.0702
*** -0.0702
*** -0.0274
Verified Non-profit 0.0504***
0.0440**
0.0567***
0.0494***
Reward's Levels 0.00173 0.00119 0.0134 0.000628 -0.0000271 0.0150 Team Size 0.0165
*** 0.0173
*** 0.00415 0.0147
*** 0.0155
*** 0.000514
Duration -0.00181***
-0.00174***
-0.00693* -0.00210
*** -0.00201
*** -0.00827
**
Soft Information
Catch Phrase Length -0.000511 -0.000516 -0.0000560 -0.000516 -0.000515 -0.000188 Gallery's items 0.00715
*** 0.00586
*** 0.0279
* 0.00709
*** 0.00583
*** 0.0276
*
Video Pitch Dummy 0.0226 0.0372 -0.178 0.0171 0.0320 -0.182 Full Text Length 0.0000179
*** 0.0000150
*** 0.0000432
** 0.0000152
*** 0.0000122
*** 0.0000420
**
Social Networks -0.00563* -0.00460 -0.00978 -0.00684
* -0.00590
* -0.00916
A.R. Index -0.00194* -0.00169 0.00181 -0.00204
* -0.00180 0.00211
Constant 2.399
*** 2.032
*** 3.040
*** 0.825
*** 0.506
*** 1.225
***
Year Yes Yes Yes Yes Yes Yes Category Yes Yes Yes Yes Yes Yes Country Yes Yes Yes Yes Yes Yes
Observations 22681 21494 1187 22681 21494 1187 R
2 0.027 0.022 0.183 0.023 0.019 0.176
29
Table X
Outcome of crowdfunding campaigns - Completion Ratio by Goal Bins
These regressions show impact of projects characteristics and soft information on success of a crowdfunding campaign by funding model for various goal levels. Dependent variable is the completion ratio at the end of the campaign and the regression model used is ordinary least square. All regressions are controlled for country, subcategory and year fixed effect and are robust to heteroscedasticity. Stars indicate p-value as * p < 0.05, ** p < 0.01 and *** p < 0.001.
(1) (2) (3) (4) (5) (6) (7) (8) (9) All projects Less than 10k Between 10k and 25k Between 25k and 50k More than 50k
Keep-It-All All-Or-Nothing Keep-It-All All-Or-Nothing Keep-It-All All-Or-Nothing Keep-It-All All-Or-Nothing
Project Characteristics
Verified Non-profit 0.0449**
0.0488 0.0818***
0.0794**
0.0289 Digital Output Dummy 0.0541 0.0995 -0.670 -0.138 0.601 0.0346 -0.525
* -0.102 -0.514
Reward's Levels -0.00287 -0.00667 0.0204 0.00457 0.00902 0.0120***
0.00543 0.00649 0.0170 Team Size 0.0135
*** 0.0182
*** -0.0505 0.0201
** 0.0512 0.0186
*** 0.0353 0.0148 -0.0325
Duration -0.00295***
-0.00267**
-0.0119* -0.00129
*** -0.00988
* -0.00141
*** -0.000865 -0.000510 -0.00492
Soft Information
Catch Phrase Length -0.000572 -0.00101 0.000548 -0.000281 -0.000204 -0.0000412 -0.000788 0.000173 0.00276 Gallery's items 0.00698
*** 0.00832
*** 0.0512
* 0.00604
** 0.00689 0.00263
* 0.00534 0.00555
** 0.0418
*
Video Pitch Dummy 0.0178 0.0593 -0.225 0.0388* -0.212 0.00349 -0.0822 0.0310 -0.0801
Full Text Length 0.0000119**
0.0000154 0.0000529 0.0000124* 0.0000305 0.00000262 0.0000358
* 0.0000174 0.0000669
*
Social Networks -0.0128***
-0.00955 -0.0715 -0.00718 -0.0302 -0.00380 0.0487* -0.00455 0.0185
A.R. Index -0.00133 0.00159 0.00842 -0.000596 0.00584 -0.00174 -0.00498 -0.00678 0.00715 Constant 0.562
*** 0.419
* 1.001 0.497
* 0.714 0.107 0.893
* 0.0348 -0.631
Year Yes Yes Yes Yes Yes Yes Yes Yes Yes Subcategory Yes Yes Yes Yes Yes Yes Yes Yes Yes Country Yes Yes Yes Yes Yes Yes Yes Yes Yes
Observations 22681 8506 347 7804 365 2811 223 2373 252 R
2 0.015 0.010 0.410 0.039 0.177 0.082 0.417 0.065 0.372
30
Table XI
Outcome of crowdfunding campaigns for matched samples on goal, start date and subcategory These regressions show impact of the goal level and of the choice of funding model on success of a crowdfunding campaign. Dependent variable is the completion ratio at the end of the campaign and the regression model used is ordinary least square. For the regressions 5, 6, 7 & 8, projects are classified as “high goal” if the goal is above the median goal of all projects in the same subcategory for the same year. This table uses propensity score matching methodology to match Keep-It-All and All-Or-Nothing subsample on size, goal, subcategory and dates. We also added controls variables on project characteristics and soft information provided by the entrepreneur. All regressions are controlled for country, subcategory and year fixed effect and are robust to heteroscedasticity. Stars indicate p-value as * p < 0.05, ** p < 0.01 and *** p < 0.001.
(1) (2) (3) (4) (5) (6) (7) (8) All projects All projects
after psmatch Keep-It-All
after psmatch All-Or-Nothing after psmatch
All projects All projects after psmatch
Keep-It-All after psmatch
All-Or-Nothing after psmatch
ln(Goal) -0.189***
-0.207***
-0.184***
-0.225***
High Goal -0.264
*** -0.243
*** -0.255
*** -0.236
***
Keep-It-All Dummy -0.196***
-0.189***
-0.179***
-0.181***
Project Characteristics
Digital Output Dummy -0.0244 -0.0559 -0.0203 -0.188***
0.0160 0.0225 0.0161 -0.0464 Verified Non-profit 0.0662
*** 0.0881
*** 0.0608
*** 0.0660
*** 0.0854
*** 0.0600
***
Reward's Levels 0.00235 0.00526* 0.00206 0.00802
*** 0.000788 0.00244 0.000412 0.00446
*
Team Size 0.0171***
0.0167***
0.0177***
0.0128***
0.0158***
0.0171***
0.0166***
0.0156***
Duration -0.00175
*** -0.00183
*** -0.00167
*** -0.00240
*** -0.00211
*** -0.00246
*** -0.00200
*** -0.00339
***
Soft Information
Catch Phrase Length -0.000463 -0.000550**
-0.000469 -0.000419**
-0.000478 -0.000645**
-0.000478 -0.000583***
Gallery's items 0.00699
*** 0.0102
*** 0.00578
*** 0.0201
*** 0.00707
*** 0.0102
*** 0.00587
*** 0.0203
***
Video Pitch Dummy 0.0243 0.0271 0.0379 0.112***
0.0218 0.0279 0.0353 0.120***
Full Text Length 0.0000164
*** 0.0000204
*** 0.0000135
*** 0.0000312
*** 0.0000148
*** 0.0000198
*** 0.0000118
*** 0.0000316
***
Social Networks -0.0000279 -0.000223 -0.0000254 -0.0621***
-0.00000399 -0.000211 -0.00000276 -0.0667***
Constant 2.389
*** 2.761
*** 2.081
*** 3.016
*** 0.720
*** 0.936
*** 0.441
*** 0.974
***
Year Yes Yes Yes Yes Yes Yes Yes Yes Subcategory Yes Yes Yes Yes Yes Yes Yes Yes Country Yes Yes Yes Yes Yes Yes Yes Yes
Observations 22875 43346 21673 21673 22875 43346 21673 21673 R
2 0.031 0.082 0.026 0.252 0.026 0.071 0.022 0.227
31
Table XII
Soft information disclosure in crowdfunding campaigns
These regressions show impact of the risk for the entrepreneur not to receive any money on the quantity of information provided in the crowdfunding campaign. The risk for the entrepreneur is 0 if he or she opts for a Keep-It-All funding model and is proportional to the goal sets if he or she opt for an All-Or-Nothing funding model. This variable is computed as “all-or-nothing dummy x goal”. We also added controls variables on project characteristics. All regressions are controlled for country, subcategory and year fixed effect and are robust to heteroscedasticity. Stars indicate p-value as * p < 0.05, ** p < 0.01 and *** p < 0.001.
(1) Text length
(OLS)
(2) Gallery items
(OLS)
(3) Videopitch
(probit)
(4) Text length (OLS)
goal < median
(5) Text length (OLS)
goal ≥ median
(6) Text length (OLS)
innovative projects
(7) Text length (OLS) creative projects
Risk for the entrepreneur 64.50
*** -0.0472 0.00600 43.36
* 65.01
*** 91.77
*** 69.93
***
Project Characteristics
Digital Output Dummy 1007.2***
-2.969***
0.182 1072.2***
1309.0***
-942.2***
Verified Non-profit -153.4
* -0.146 0.0829
* -65.01 -268.7
** -282.7 119.9
Reward's Levels 231.7***
0.315***
0.0832***
169.8***
249.6***
271.4***
224.2***
Team Size 156.3
*** 0.837
*** 0.0479
*** 88.36
*** 171.0
*** 200.4
*** 147.7
***
Duration 4.210***
0.0240***
-0.000556 3.059* 2.848
* 5.873
* 2.894
*
Soft Information
Social Networks 152.0***
0.772***
0.122***
138.9***
145.0***
170.2***
164.3***
A.R. Index 67.61
*** -0.0207
* 0.00731
* 103.3
*** 54.76
** 101.7
*** 64.63
*
Constant 2169.5
** 8.858
** -0.127 5924.4
*** 1753.4
* 3825.6
*** 4261.2
***
Year Yes Yes Yes Yes Yes Yes Yes Subcategory Yes Yes Yes Yes Yes Yes Yes Country Yes Yes Yes Yes Yes Yes Yes
Observations 22681 22681 22474 8853 13828 2996 12726 R
2 0.205 0.122 0.191 0.202 0.282 0.179
Adjusted R2 0.198 0.115 0.176 0.191 0.257 0.169
Pseudo R2 0.186
32
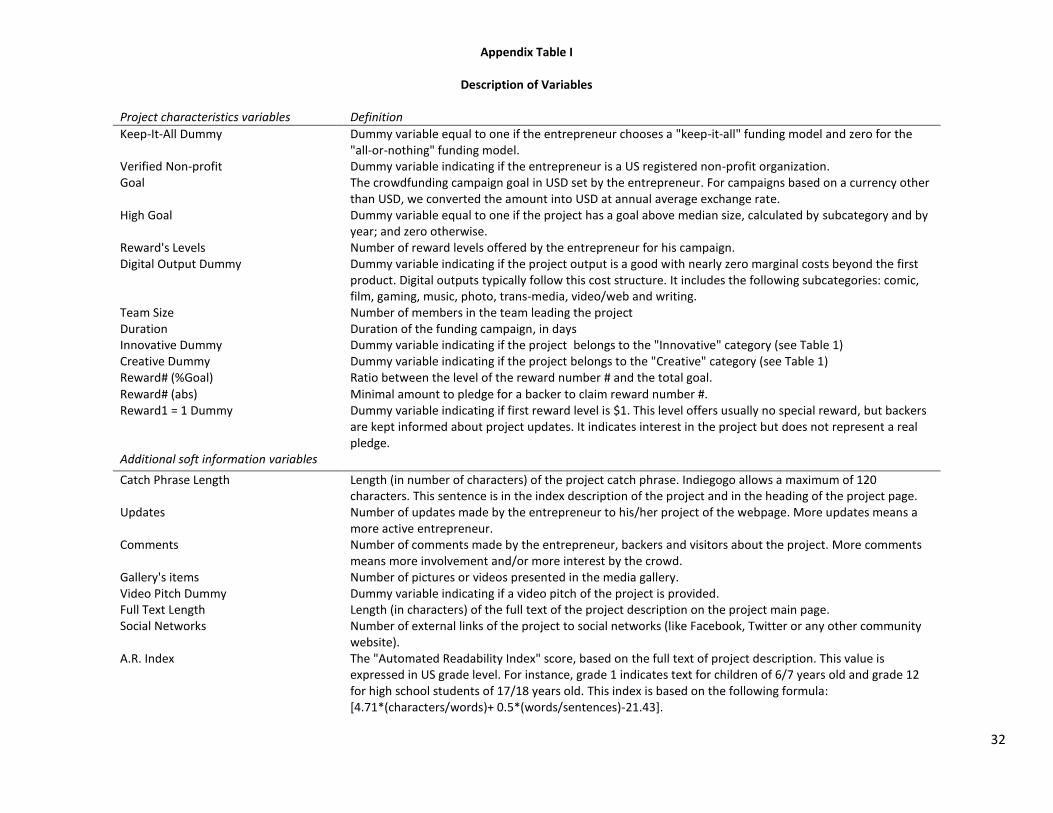
Appendix Table I
Description of Variables
Project characteristics variables
Definition
Keep-It-All Dummy Dummy variable equal to one if the entrepreneur chooses a "keep-it-all" funding model and zero for the "all-or-nothing" funding model.
Verified Non-profit Dummy variable indicating if the entrepreneur is a US registered non-profit organization. Goal The crowdfunding campaign goal in USD set by the entrepreneur. For campaigns based on a currency other
than USD, we converted the amount into USD at annual average exchange rate. High Goal Dummy variable equal to one if the project has a goal above median size, calculated by subcategory and by
year; and zero otherwise. Reward's Levels Number of reward levels offered by the entrepreneur for his campaign. Digital Output Dummy Dummy variable indicating if the project output is a good with nearly zero marginal costs beyond the first
product. Digital outputs typically follow this cost structure. It includes the following subcategories: comic, film, gaming, music, photo, trans-media, video/web and writing.
Team Size Number of members in the team leading the project Duration Duration of the funding campaign, in days Innovative Dummy Dummy variable indicating if the project belongs to the "Innovative" category (see Table 1) Creative Dummy Dummy variable indicating if the project belongs to the "Creative" category (see Table 1) Reward# (%Goal) Ratio between the level of the reward number # and the total goal.
Reward# (abs) Minimal amount to pledge for a backer to claim reward number #. Reward1 = 1 Dummy Dummy variable indicating if first reward level is $1. This level offers usually no special reward, but backers
are kept informed about project updates. It indicates interest in the project but does not represent a real pledge.
Additional soft information variables
Catch Phrase Length Length (in number of characters) of the project catch phrase. Indiegogo allows a maximum of 120 characters. This sentence is in the index description of the project and in the heading of the project page.
Updates Number of updates made by the entrepreneur to his/her project of the webpage. More updates means a more active entrepreneur.
Comments Number of comments made by the entrepreneur, backers and visitors about the project. More comments means more involvement and/or more interest by the crowd.
Gallery's items Number of pictures or videos presented in the media gallery. Video Pitch Dummy Dummy variable indicating if a video pitch of the project is provided. Full Text Length Length (in characters) of the full text of the project description on the project main page. Social Networks Number of external links of the project to social networks (like Facebook, Twitter or any other community
website). A.R. Index The "Automated Readability Index" score, based on the full text of project description. This value is
expressed in US grade level. For instance, grade 1 indicates text for children of 6/7 years old and grade 12 for high school students of 17/18 years old. This index is based on the following formula: [4.71*(characters/words)+ 0.5*(words/sentences)-21.43].
33
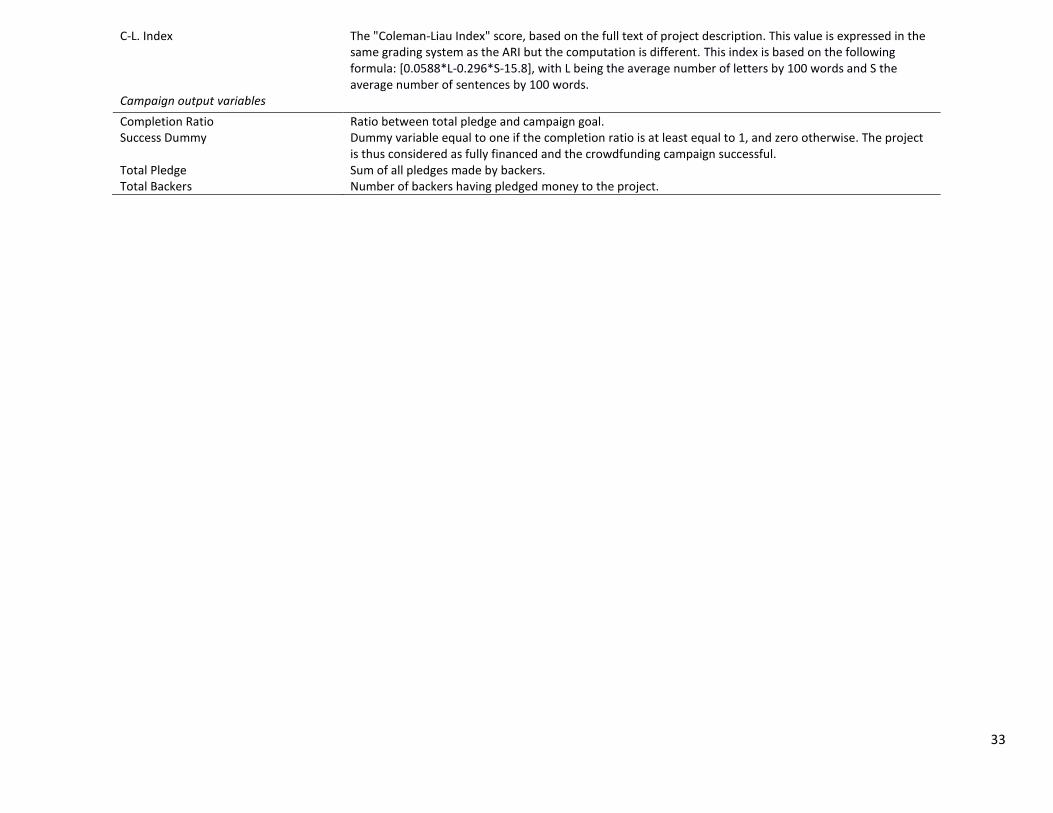
C-L. Index The "Coleman-Liau Index" score, based on the full text of project description. This value is expressed in the same grading system as the ARI but the computation is different. This index is based on the following formula: [0.0588*L-0.296*S-15.8], with L being the average number of letters by 100 words and S the average number of sentences by 100 words.
Campaign output variables
Completion Ratio Ratio between total pledge and campaign goal. Success Dummy Dummy variable equal to one if the completion ratio is at least equal to 1, and zero otherwise. The project
is thus considered as fully financed and the crowdfunding campaign successful. Total Pledge Sum of all pledges made by backers. Total Backers Number of backers having pledged money to the project.